
Related Manuals for BK Precision 2511


Summary of Contents for BK Precision 2511
- Page 1 Model: 2511, 2512, 2515, 2516 2510 Series Handheld Digital Storage Oscilloscopes USER MANUAL...
-
Page 2: Safety Summary
Safety Summary The following safety precautions apply to both operating and maintenance personnel and must be observed during all phases of operation, service, and repair of this instrument. Before applying power, follow the installation instructions and become familiar with the operating instructions for this instrument. - Page 3 A CAUTION statement calls attention to an operating procedure, practice, or condition, which, if not followed correctly, could result in damage to or destruction of part or all of the product. NOTE: Voltage ratings are given as “working voltage”. They should be read as Vac-rms (50 –...
- Page 4 Do not insert metal objects into any of the connectors. WARNING Do not use any exposed metal BNC or banana plug connectors with the instrument. Use only the insulated accessories supplied with the instrument. Do not connect the USB cable while the instrument is not in use. Keep the cable away from all probes and test leads.
- Page 5 Compliance Statements Disposal of Old Electrical & Electronic Equipment (Applicable in the European Union and other European countries with separate collection systems) This product is subject to Directive 2002/96/EC of the European Parliament and the Council of the European Union on waste electrical and electronic equipment (WEEE) , and in jurisdictions adopting that Directive, is marked as being put on the market after...
-
Page 6: Ce Declaration Of Conformity
CE Declaration of Conformity The power supply meets the requirements of 2006/95/EC Low Voltage Directive and 2004/108/EC Electromagnetic Compatibility Directive with the following standards. Low Voltage Directive EN 61010-1: 2010 Safety requirements for electrical equipment for measurement, control, and laboratory use-Part 1: General requirements EN 61010-031: 2002+A1: 2008 Part 31: Safety requirements for hand-held probe... -
Page 7: Safety Symbols
Safety Symbols Electrical Shock hazard. Refer to the operating user manual for warning information to avoid hazard or personal injury and prevent damage to instrument. This symbol shows that the switch is a power switch located at the front panel. Pressing this button turns on the oscilloscope, and holding it down for a few seconds turns off the oscilloscope. - Page 8 (included with models 2515 and 2516) - CATII 1000V RMS, CATIII 600V Maximum input voltage to CH1 and CH2 BNC via 1X/10X probe PR150SA (included with models 2511 and 2512) – CATII 300V RMS Scope Input – CATII 300V RMS ...
-
Page 9: Environmental Conditions
Environmental Conditions The instrument may be operated in the following environment. 0 °C to 40 °C Operating Environment Storage Humidity 0 – 85% R.H. Storage Environment -20 °C to +70 °C Pollution degree Pollution degree 2 Measurement Category CAT II, CAT III... -
Page 10: Table Of Contents
Table of Contents Safety Summary ....................2 General Information ................16 Product Overview ................16 Package Contents ................17 Front Panel Overview ..............18 Front Panel Description ................ 18 Top View ..................20 Rear Panel Overview ..............20 Side Panel Overview ............... 21 Side Panel Description ................ - Page 11 Channel Selection ................39 Channel Menu ................39 Channel Coupling .................. 41 Bandwidth Limit ..................41 Vertical Scale ..................41 Probe Attenuation Scale ............... 41 Invert Waveform ................... 41 Digital Filter ................... 42 Automatic Settings and Run/Stop Mode ........42 Auto Setting ..................
- Page 12 Utility Menu..................84 Check System Information ..............86 Enable/Disable Key Sound ..............87 Enable/Disable Frequency Counter ............87 Set the Language ................... 88 Updating Firmware ................88 Set Screen Saver ..................90 Waveform Record Function ..............90 Playback Recorded Waveform .............. 93 Measurement and Cursor Functions..........
- Page 13 Start Scope Recording ................. 134 Playback Scope Recording ..............136 Meter Trend Plot ..................137 Record Data with Trend Plot ............... 140 Save Recorded Data to External Memory ........... 141 Remote Communication ..............143 Troubleshooting Guide ............... 144 System Message Prompts and Instructions ..........144 Frequently Asked Questions ..............
- Page 14 List of Figures Figure 1 - Front Panel View ................18 Figure 2 - Top View ..................20 Figure 3 - Rear View ..................20 Figure 4 - Side View ..................21 Figure 5 - Oscilloscope Display ..............22 Figure 6 - Multimeter Display ............... 24 Figure 7 –...
- Page 15 Figure 38 - USB Drive Removed ..............76 Figure 39 - Directory Menu 1/2 ..............79 Figure 40 - Create Directory Name ............... 80 Figure 41 - Save Progress ................81 Figure 42 - Save Successfully................. 81 Figure 43 - Overwrite Warning ..............82 Figure 44 - Subdirectory View ...............
-
Page 16: General Information
1 General Information 1.1 Product Overview The B&K Precision 2510 series handheld digital storage oscilloscope combines the functions of a digital storage oscilloscope, digital multimeter, and a recorder into one portable form factor. The oscilloscope’s bandwidth is up to 100 MHz with a real time sampling rate of up to 1 GSa/s. With up to 2M points of deep memory, it allows for capturing more details of a signal for analysis. -
Page 17: Package Contents
1 x User Manual 2 x 10X CATIII 600 V probes (models 2515 and 2516 only) 2 x 1X/10X CATII 300 V probes (models 2511 and 2512 only) 1 x Pair of DMM test leads 1 x Carrying case and straps ... -
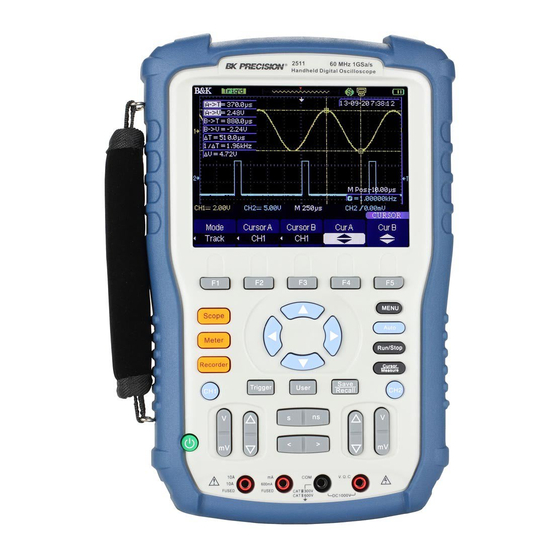
Page 18: Front Panel Overview
1.3 Front Panel Overview 12 13 Figure 1 - Front Panel View Front Panel Description LCD display Menu function keys Scope function button Multimeter function button Recorder function button Trend plot and waveform recorder Channel 1 button (scope) Trigger Menu button... - Page 19 Channel 1 Volts/div range keys (scope) Power On/Off Channel 1 vertical position keys (scope) 10 A current input port (multimeter) mA current input port (multimeter) User/Options Menu COM input port (multimeter) Voltage/Resistance/Capacitance input port (multimeter) Channel 2 vertical position keys (scope) Horizontal position keys (scope) Channel 2 Volts/div range keys (scope) Horizontal Timebase keys (scope)
-
Page 20: Top View
1.4 Top View Channel 1 Input Channel 2 Input Figure 2 - Top View 1.5 Rear Panel Overview Battery cover Kickstand Figure 3 - Rear View... -
Page 21: Side Panel Overview
1.6 Side Panel Overview Figure 4 - Side View Side Panel Description MiniUSB device port For probe compensation and remote interface USB host port For saving/recalling waveforms and instrument setups External power adapter input Mount holes for carry handle... -
Page 22: Display Overview
1.7 Display Overview Oscilloscope Display Figure 5 - Oscilloscope Display Trigger status Armed – Instrument is acquiring pre-trigger data. All triggers are ignored. Ready – All pre-trigger data has been acquired and the instrument is ready to accept a trigger ... - Page 23 timebase is slow enough in which requires a longer time to “scan” to acquire the entire signal on display Displays the position of the present waveform window in internal memory Horizontal trigger position marker USB mode indicator Side USB interface is configured for PC communication ...
-
Page 24: Digital Multimeter Display
Digital Multimeter Display Figure 6 - Multimeter Display Input port indicator Highlights which port to connect to for selected measurement function Relative value display Measurement type AC power indicator Operation mode Measurement reading display Measurement bar graph... -
Page 25: Recorder/Trend Plot Display
Recorder/Trend Plot Display Figure 7 – Scope Trend Plot Display Recording/Trend Plot time Parameter A measured value Parameter B measured value Battery indicator Parameter A measured data plot Parameter B measured data plot Current measured value and time... -
Page 26: Protection Fuse
1.8 Protection Fuse There are two input protection fuses for the current measurement inputs, labeled mA and 10 A. The 10 A input is protected with an internal 10 A, 250 V slow blow glass tube type fuse. The mA input is protected with an internal 600 mA PPTC (resettable) type fuse, rated 250 V. -
Page 27: Probes
Voltage Rating: 1000 V CATII, 600 V CATIII Attenuation: 10X Bandwidth: 250 MHz Meets IEC 61010-031:2008 Models 2511 and 2512 come with two passive 1X/10X probes (PR150SA) with the following specifications: Voltage Rating: 300 V CATII Attenuation: 1X/ 10X Bandwidth: 17/150 MHz... -
Page 28: Getting Started
2 Getting Started 2.1 Input Power Requirements The handheld oscilloscope can be powered by an AC adapter or by battery. External Power Operation To use the external AC adapter to power the instrument: 1. Connect the adapter to the external power input on the side of the instrument first. -
Page 29: Battery Operation
WARNING: Only use the supplied external AC adapter. Using a different or incorrect type adapter will result in damage to the instrument and void its warranty. Battery Operation The instrument can be powered by an external Li-ion battery pack, rated for 5000 mAh, 7.4 V. -
Page 30: Tilt Stand
Charging the Battery For first time use, fully charge the battery for at least 4 hours with the instrument turned OFF. Before charging the battery, follow the instructions above to install the battery. Then, connect the AC adapter to the instrument. While the instrument is ON, the battery indicator will show the battery status for charging and when it’s fully charged (see “1.7 Display Overview”). -
Page 31: Perform Self-Calibration
The oscilloscope will display a boot screen shown below for 5-10 seconds before the main operating display appears. Figure 10 - Boot Screen To power OFF the device, hold down for at least 3 seconds. 2.4 Perform Self-Calibration We recommend you to perform self-calibration if any of the following applies: Operating temperature changes by more than 5 °C after 30 minutes of use. -
Page 32: Set To Factory Default
To perform self-calibration, follow these steps: 1. Power ON the instrument and allow it to warm up for 30 minutes. 2. Press and press to select Do Self Cal. 3. Follow the prompt on the screen and press F4 to proceed. To exit and cancel self-calibration, press F5. - Page 33 Menu or Options, Knobs or Buttons Default setup system Coupling BW Limit Volts/div Coarse CH1, CH2 Probe Invert Filter Volts/div 1.00V Operation CH1+CH2 CH1 Invert CH2 Invert FFT Operation: Source MATH Window Hanning FFT Zoom Scale dBVrms Display Split Window Main Time Base Position 0.00 μs...
- Page 34 Intensity Brightness Format Menu Display Infinite Type Setups SAVE/RECALL Save To Device Setup No.1 Source REFA REFB Sound Frequency Counter UTILITY USB Device Computer Record Type Edge Source Slope Rising TRIGGER (Edge) Mode Auto Coupling Level 0.00V Type Pulse Source Condition TRIGGER (Pulse) Set Pulse Width...
-
Page 35: Configure Date And Time
Mode Auto Type Alternative Source TRIGGER Mode Edge (Alternative) Coupling Slope Rise 2.6 Configure Date and Time Users can configure the date and time on the oscilloscope. Press and press three times to go to the Utility menu 4. Figure 11 - Utility Menu 4/4 Press to select Date/Time. -
Page 36: Probe Compensation
Press so that the Hour is highlighted. Use Hour keys to change the hour. Press so that the Minute is highlighted. Use Minute keys to change the hour. Once set, press to select Confirm option and save changes. To enable or disable the date and time display, toggle in the menu to change Display to On or Off. - Page 37 1. Set the probe attenuation option in the channel 1 menu to 10X by pressing and press F4 to select Probe until it shows 10X. 2. Connect the BNC side of the probe to channel 1 input on the top of the instrument.
- Page 38 5. Display the channel and press 6. Check the shape of the waveform displaying on the screen. Under Compensated Correctly Compensated Over Compensated 7. Adjust the trim on the probe or repeat all the operations above if necessary. PR250SA PR150SA...
-
Page 39: Using The Oscilloscope
3 Using the Oscilloscope 3.1 Channel Selection Use the and/or button to enable or disable channel 1 and/or channel 2 on the display. These buttons will also access their respective channel menus. Figure 14 - Channel Display 3.2 Channel Menu To access the channel menu, press to display the respective channel menu. - Page 40 Table 2 - Channel Menu 1/2 Menu Setting Description Option DC passes both AC and DC components of the input signals. AC blocks the DC component of the Coupling input signals and attenuates signals below 10 Hz. GND disconnects the input signal. Limit the bandwidth above 20 MHz to reduce display noise;...
-
Page 41: Channel Coupling
Channel Coupling Both channel 1 and channel 2 coupling can be set to DC, AC, or GND (ground). Press in the channel menu to toggle the settings. Bandwidth Limit Bandwidth limit can be enabled or disabled by toggling in the channel menu. -
Page 42: Digital Filter
Digital Filter There are four types of digital filters available and can be used to apply to the input waveform. To access the digital filter menu, go to page two of the channel menu and press to enter the filter menu. Below is a table of the filter menu structure. -
Page 43: Run/Stop Mode
When measuring an unknown signal, the auto setting function can be used to allow the oscilloscope to automatically adjust the vertical and horizontal scale, range, and trigger to display the signal. To use this function, input a channel to either or both channel 1 and 2. Then press the button. -
Page 44: Scope Menu
In continuous run mode, the signal going into channel 1 and/or 2 will constantly be triggered regardless of the position of the trigger level. At the top, the indicator will display “Trig’d” to indicate that the signal is triggered. In stopped mode, the oscilloscope will stop triggering the signals going into channel 1 and/or 2. -
Page 45: Display Menu
Equ time Set the sampling mode to equivalent sampling. Mode Real time Set the sampling mode to real time sampling. Sa Rate Display the sampling rate. To change the settings to any of the menu options, press their corresponding function keys ( Sampling: To construct the waveform, the scope samples the signals in equal interval. - Page 46 Vectors fill the space between Vectors adjacent sample points on the Type display. Dots Dots display the sample points only. 1 sec Set the length of time each displayed Persist 2 sec sample point remains displayed. 5 sec Infinite Intensity 0 –...
-
Page 47: Figure 16 - Xy Mode
Persistence: The wavefrom persistence can be configured by changing the Persist menu option of the Display menu page 1. Use the toggle between persistence timing. Intensity and Brightness: The waveform intensity and the display grid brightness can be adjusted by first pressing for intensity or for grid brightness in the Display menu page 1. -
Page 48: Figure 17 - Inverted Screen Color
Figure 17 - Inverted Screen Color Grid Display: The display of the grid can be changed to show grid and axes, axes only, or no grid or axes. The below screenshots illustrate the options. This can be changed by toggling in the Display menu 2. -
Page 49: Math Menu
Figure 19 - Axes Only Display Figure 20 - No Grid and Axes Display Math Menu To access the math menu, go to the scope menu and press select Math. Below is a table of the Math menu structure. Note: Math function is not available in XY mode. - Page 50 Table 8 - Math Menu 1/2 Menu Option Setting Description + CH1+CH2 - CH1-CH2, CH2-CH1 Operation CH1*CH2 CH1/CH2, CH2/CH1 Fast Fourier Transform. Invert the waveform. Invert Disable inverting the waveform. Page1/2 Next Page Enter the second page of MATH menu. Table 9 - Math Menu 2/2 Description Menu Option...
-
Page 51: Figure 21 - Math Waveform Display
Figure 21 - Math Waveform Display FFT: Fast Fourier Transform function is supported. Toggle the button from the Math menu 1 to change Operation to FFT to select this function. When FFT is selected, additional menu options are available. See table below for the FFT menu structure. - Page 52 (see table Window Selects FFT windowing. below) 1X, 2X, 5X, 10X FFT Zoom Zoom function of FFT waveform. Table 11 - FFT Window Options Window Characteristic Best Use Cases The best frequency Symmetric transients or bursts. resolution but the Equal-amplitude sine waves Rectangular worst magnitude with fixed frequencies.
-
Page 53: Figure 22 - Fft Full Screen (Left), Split Screen (Right)
Turn On/Off the FFT waveform. When using the FFT function, first select the channel source by toggling the button from the FFT menu 1 to change Source between CH1 and CH2. Use the button from the FFT menu 1 to select the Window to use. Descriptions of each window are provided in Table 11 - FFT Window Options above. -
Page 54: Horizontal System
FFT Display Description FFT waveform position FFT waveform indicator FFT vertical scale FFT frequency scale and sampling rate Horizontal System Adjust Horizontal Position The horizontal position, or time reference position, marks the reference of the trigger point. The position is indicated by the arrow at the top of the display as marked in the illustration below. -
Page 55: Figure 23 - Horizontal Position Reference Marker
Figure 23 - Horizontal Position Reference Marker This position can be adjusted by using the keys to move left (<) or right (>). If the left or right position key is pressed down for > 3 seconds, the position change will be coarse. The scale factor is indicated as marked by the illustration below. -
Page 56: Figure 25 - Horizontal Position Indicator
Figure 25 - Horizontal Position Indicator Adjust Horizontal Scale/Timebase The horizontal scale or timebase scale factor can be changed using the keys. Press S to adjust to a slower scale, and press ns to adjust to a faster scale. Delay Scan The instrument has a delay scan function that can be enabled to zoom in on a portion of the channel 1 and/or channel 2 waveforms. -
Page 57: Figure 27 - Delay Scan
Figure 27 - Delay Scan The blue shaded areas mark the masked out area and the area in between the blue shaded area is the zoomed portion, shown at the bottom in the split screen. Deep Memory The instrument’s deep memory function enable storage of a greater number of sampling points for timebase settings between 50 ms to 25 µs. -
Page 58: Figure 28 - Normal Memory Depth
4. Now, go back to Horizon menu and change MemDepth to Long Mem. Go back to Acquire menu afterwards and note the Sa Rate is now 100.0MSa. 5. The differences can be visually observed by pressing to stop the waveform at 100 µs. Then adjust the horizontal scale factor to a slower timebase until the entire waveform captured can be shown on the display. - Page 59 Note: Different timebase settings will result in different sampling rates, both with normal and long memory depth configured in MemDepth. Selecting a timebase lower than 50 ms will automatically set the instrument into scan mode. Deep memory is not supported in scan mode. For timebase selections faster than 25 µs, the deep memory function will have an adverse affect and will result in fewer sample points than if deep memory is disabled.
-
Page 60: Vertical System
5 µs 2.5 µs 1 µs 250 MSa/s 250 MSa/s 500 ns 250 MSa/s 250 ns 500 MSa/s 100 ns 50 ns 250 MSa/s 25 ns 500 MSa/s 10 ns 1 GSa/s 500 MSa/s 5 ns 2.5 ns (100 models) Vertical System Adjust Vertical Position The vertical position of channel 1 and channel 2 are marked on the left side... -
Page 61: Figure 31 - Vertical Position Indicator
To move the vertical position up or down, use the left vertical position keys (for CH1) or right vertical position keys (for CH2) . If the up or down key is pressed down for > 3 seconds, the position change will be coarse. The vertical position relative to center 0 reference will be indicated when changed, as illustrated below: Figure 31 - Vertical Position Indicator... -
Page 62: Reference Waveform Menu
Figure 32 - Fine Control Volts/Div Reference Waveform Menu The instrument can save and display two reference waveforms from both channel 1 and/or channel 2. A reference waveform copies the source waveforms’ vertical position, vertical scale factor, horizontal position, and horizontal scale factor. -
Page 63: Figure 33 - Reference Waveforms Display
Toggles displaying the reference waveform. Ref A/Ref B Note: Under Source, CH1 Off and CH2 Off will be displayed if both channel 1 and 2 are turned Off. Saving a Reference Waveform Follow the steps below to save a reference waveform. 1. -
Page 64: Trigger System
3.5 Trigger System There are five types of trigger functions supported by the instrument: edge, pulse, video, slope, and alternative. Adjust Trigger Level To adjust the trigger level in all trigger modes, use the arrow keys to move up or down. The trigger level position is marked by T on the right of the display. -
Page 65: Edge Trigger
Edge Trigger Edge trigger seeks to trigger off of a specified slope and level of a waveform. Select Edge under Type from the trigger menu. Table 15 - Edge Trigger Menu Menu Setting Description Option Trigger on the rising or falling edge of the input Type Edge signal. - Page 66 Table 16 - Edge Trigger Setup Menu Menu Setting Description Option Passes all components of the signal Blocks DC components and attenuates signals below 170 Hz. Attenuates the high-frequency Coupling HF Reject components above 140 kHz. Blocks the DC component and attenuates LF Reject the low-frequency components below 7 kHz.
-
Page 67: Pulse Trigger
Figure 35 - Hold Off Time Indicator Pulse Trigger Pulse trigger seeks certain pulse conditions of a waveform to trigger. Select Pulse under Type from the trigger menu. Table 17 - Pulse Trigger Menu 1/2 Menu Setting Description Option Type Pulse Select the pulse trigger function. - Page 68 (Positive pulse width less than pulse width set) (Positive pulse width larger than pulse width setting) (Positive pulse width equal to pulse width setting) Select the pulse trigger When (Negative pulse conditions; it triggers as soon as width less than pulse width condition is met.
-
Page 69: Video Trigger
To set the pulse width for the pulse trigger condition, press in the Pulse Trigger menu 1 to select Set Width and use arrow keys to adjust the width, which will be displayed when it is adjusted. Figure 36 - Pulse Width Trigger Condition Display Note: Trigger level cannot be changed while the Pulse Trigger Menu is active because the SetWidth option shares the same arrow keys to make changes. - Page 70 Select Video trigger. To trigger NTSC, PAL and Type Video SECAM video signals, set coupling to AC. Source Set CH1 or CH2 as the trigger source. Normal trigger on the negative edge of the sync (Normal) pulse. Polarity (Inverted Inverted trigger on the positive edge of the sync pulse.
- Page 71 Table 20 - Video Trigger Menu 2/2 Menu Setting Description Option When you select type video and select Type Video AC coupling, you could trigger to a NTSC, PAL and SECAM video signal. NTSC, Select the video standard for sync and line Standard PAL/SECAM number count.
-
Page 72: Slope Trigger
Return Return to the Video Trigger Menu. Slope Trigger Slope trigger can be used to trigger off a rising or falling edge with specified slope timing conditions and vertical boundaries. It is similar to Edge trigger but with more options users can setup to seek for specific slope conditions from the selected source. - Page 73 Set time Use the arrow keys to set Time slope time. The time range is 20 ns – 10 s. Enter the second page of the Next Page Page 1/2 Slope Trigger Menu. Table 23 - Slope Trigger Menu 2/2 Menu Setting Description...
-
Page 74: Alternative Trigger
until after the first trigger. Use this mode to run a single Single capture. Enter the Slope Trigger Setup Setup Menu. See Table 16 for details. Return to the first page of the Next Page Page 2/2 Slope Trigger Menu. Alternative Trigger Alternative trigger will alternate the trigger between two channels to allow triggering both channels. -
Page 75: Connecting External Memory
Page/Set If Mode is Pulse, see Pulse Trigger section. If Mode is Video, see Edge Trigger section. If Mode is Slope, see Slope Trigger section. Table 25 - F4 option in Alternative Trigger Menu Menu Setting Description Option Slope Edge trigger option. See Table 15 for details. When Pulse trigger option. -
Page 76: Save/Recall Function
Figure 37 - USB Drive Detected When the USB flash drive is removed from the USB host port, the following prompt will display: Figure 38 - USB Drive Removed 3.7 Save/Recall Function Instrument setups and waveform traces can be saved and recalled into both internal memory and external memory (USB flash drive). - Page 77 Table 26 - Save/Recall Menu Menu Setting Description Option Setups Select to save instrument settings/setups. Waveforms Select to save the waveform traces on screen. Type Picture Select to save the screenshot as a .BMP file. Select to save the waveform data as a .CSV file. Factory Select to set instrument to default settings.
-
Page 78: Saving And Recalling Setups And Waveforms
Select to save bitmap image to external memory. (This option is available when a USB Save flash drive is connected and detected by the instrument) Table 28 – Save Waveform Data Menu Menu Setting Description Option Type Select to save the waveform data as a .CSV file. Displayed Select to save only the waveform data Data... -
Page 79: Figure 39 - Directory Menu 1/2
To save setups and waveforms, follow the steps below: 1. Press to go into the Save/Recall menu, then select Type. 2. Toggle to choose Setups to save instrument setups, or choose Waveforms to save waveform traces on display. 3. To save the file into internal memory, press to set Save To to Device. -
Page 80: Figure 40 - Create Directory Name
Figure 40 - Create Directory Name 7. You can set the name using the on screen virtual keypad. Use keys to move the cursor position of the name to left and right respectively. To select a character to insert at the cursor position, use the arrow keys to move the selection cursor to the character you want to select. -
Page 81: Figure 41 - Save Progress
Figure 41 - Save Progress If the file saves successfully, a message will prompt as shown below: Figure 42 - Save Successfully 13. If the file name is found to be the same as another file already in the external memory, the instrument will prompt an overwrite warning. Press to select Confirm to overwrite the file, or press to select Cancel. -
Page 82: Figure 43 - Overwrite Warning
Figure 43 - Overwrite Warning 14. To exit the Directory menu, press to go to Directory Menu 2, then press to select Return. Note: Instrument setups will be saved as a .SET file and waveform traces will be saved as a .DAV file. Both of these file types can only be recalled from within the oscilloscope Save/Recall menu. -
Page 83: Saving Screen Capture
by pressing . To go back up a folder, just press it again with cursor selecting UP. Figure 44 - Subdirectory View Saving Screen Capture The screen capture can be saved as a .BMP file to external memory. To do this, select Picture as Type from the Save/Recall menu. -
Page 84: Utility Menu
2. Then, select Data Depth as Displayed or Maximum. (See “Table 28” for description of the options) 3. Then, select Para Save as On or Off. Set to On if you want scope parameters (i.e. timebase, volts/div) to be saved along with the waveform data. - Page 85 English, Français, 日本語, 한국의, Deutsch, Español, Language Select the interface language. русский, Italiana, Português, ,ال عرب يةPolish, 简体中文, 繁體中文 Next Page 1/4 Enter the next page of the menu. Page Table 30 - Utility Menu 2/4 Menu Setting Description Option Do a self calibration to calibrate the Do Self Cal...
-
Page 86: Check System Information
Press this button to enter the Waveform Record Record Menu. Next Page Page 3/4 Enter the fourth page of the menu. Table 32 - Utility Menu 4/4 Menu Option Setting Description 1min, 2min, 5min, 10min, Screen saver 15min, 30min, Set the screen saver time. 1hour, 2hour, 5hour, Off Configure date and time (see section 2.6... -
Page 87: Enable/Disable Key Sound
Figure 45 - System Information Display To exit and go back to the main menu, press Enable/Disable Key Sound The key press sound can be enabled or disabled from the Utility Menu 1/4. Press to toggle the Sound option to enable or disable key sound. Enable/Disable Frequency Counter The oscilloscope has a built-in counter to display frequency when a signal from channel 1 or channel 2 is measurable. -
Page 88: Set The Language
Figure 46 - Frequency Counter Display Set the Language The interface can be displayed in different languages. Supported languages are: English, French, Japanese, Korean, German, Spanish, Russian, Italian, Portuguese, Arabic, Polish, Simplified Chinese, and Traditional Chinese. From the Utility Menu 1/4, toggle to change the language. - Page 89 4. Press to enter the Utility Menu and press to go to page 3/4 of the menu. Select Update Firmware by pressing 6. To proceed, press . Otherwise, press to exit out of the firmware update menu. 7. From the Directory menu, use the arrow keys to select the firmware file stored in the USB flash drive.
-
Page 90: Set Screen Saver
Set Screen Saver The instrument has a screen saver mode to save power when the instrument is idle or not in use. The timer to enable the screen saver can be configured by going to page 4 of the Utility menu and pressing select Screen saver option. - Page 91 Table 33 - Waveform Record Menu Menu Setting Description Option Record Set to configure and record. Mode Replay Set to playback recorded waveform. Turn off waveform record menu. Source CH1, CH2 Choose recorder source. Set interval to record waveform. (1 ms Interval –...
-
Page 92: Figure 47 - Record Frame Indicator
An indicator at the top left of the grid display will indicate the approximate frame count of the recording. Figure 47 - Record Frame Indicator When recording is finished, the following message will be prompted: Figure 48 - Recording Finished... -
Page 93: Playback Recorded Waveform
Playback Recorded Waveform To playback a recorded waveform, select Playback for Mode in the Waveform Record menu. Playback menu options are available to configure playback. Once configured, press in page 1 of the menu to start playback. Press it once more to stop playback at any time. Table 34 - Waveform Playback Menu 1/2 Menu Setting... -
Page 94: Measurement And Cursor Functions
End Frame Set end frame. Return Press to exit back to the Utility menu. Next Page Page 2/2 Return to the first page of the Playback menu. 3.9 Measurement and Cursor Functions Measurement Functions NOTE: The measurement function will not make automatic measurements when the instrument is in SCAN mode. - Page 95 Table 36 - Measurement Selection Menu Menu Option Description Voltage Press this button to enter the Voltage measure menu. Time Press this button to enter the Time measure menu. Delay Press this button to enter the Delay measure menu. All Mea Press this button to enter the All Measurement menu.
- Page 96 well as the measured value. Return to the Return Measure menu. Vpp – Voltage peak-to- Mean – Arithmetic mean peak over the entire waveform Vmax – Positive peak Vrms – True rms voltage voltage over the entire waveform Vmin – Negative peak Crms –...
- Page 97 Table 38 - Time Measurement Parameters Menu Menu Setting Description Option Select input signal source for Source CH1, CH2 Time measure. Period, Freq, +Wid, -Wid, Rise Select the type of time Type Time, Fall Time, BWid, +Dut, - measurement. Display the corresponding icon for the selected time measurement as well as the measured value.
- Page 98 Table 39 - Delay Measurement Parameters Menu Menu Setting Description option Select input signal source for Source CH1, CH2 delay measure. Phase, FRR, FRF, FFR, FFF, Select the type of delay Type LRR, LRF, LFR, LFF measurement. Display the corresponding icon for the selected delay measurement as well as the measured value.
- Page 99 From the Measure menu, press to select All Mea. Then, select the single source to show its corresponding measurements by toggling to set Source as CH1 or CH2. Press to toggle On or Off displaying all voltage measurements. Press to toggle On or Off displaying all time measurements.
-
Page 100: Figure 49 - All Voltage Measurements Display
Figure 49 - All Voltage Measurements Display Figure 50 - All Time Measurements Display Figure 51 - All Delay Measurements Display... -
Page 101: Cursor Functions
Figure 52 - All Measurements Display Cursor Functions Toggle the button to enter the Cursor menu. There are three cursor modes available: Manual, Track, and Auto. To disable cursors, set Mode to Off. Manual Cursor Mode Manual cursor mode allows users to set either horizontal or vertical cursors to make measurements from a selected signal source. - Page 102 Table 41 - Manual Cursor Menu Menu Setting Description Option Mode Manual Set to manual cursor mode. Use cursors to measure voltage Voltage parameters. Type Time Use cursors to measure time parameters. CH1, CH2, Choose the signal source to measure with Source MATH, REFA, cursors.
-
Page 103: Figure 53 - Manual Voltage Cursor
Figure 53 - Manual Voltage Cursor Cursor A Cursor B Cursor A position Cursor B position Voltage difference between Cursor A and Cursor B Time Type – Time cursors are used to make cursor measurements. Two vertical cursor lines will appear on the display, and their positions and differences will be indicated in the upper left corner of the display. -
Page 104: Figure 54 - Manual Time Cursor
Figure 54 - Manual Time Cursor Cursor B Cursor A Cursor A time position Cursor B time position Frequency between Cursor A and Cursor B Time difference between Cursor A and Cursor B Track Cursor Mode Track cursor mode allows users to setup two cursors with both time and voltage tracked from selected signal sources. - Page 105 From the Cursor menu, set Mode to Track. Select the source for Cursor A and the source for Cursor B by toggling respectively. To adjust Cursor A, select it with to that it’s highlighted, then use arrow keys to adjust its position. Do the same to adjust Cursor B by selecting it with Table 42 - Track Cursor Menu Menu...
-
Page 106: Figure 55 - Track Cursor Display
Figure 55 - Track Cursor Display Cursor B Cursor A Voltage difference between Cursor A and Cursor B Frequency between Cursor A and Cursor B Time difference between Cursor A and Cursor B Cursor B voltage position Cursor B time position Cursor A voltage position Cursor A time position Auto Cursor Mode... -
Page 107: Figure 56 - Auto Cursor Measuring Vpp
In this mode, the cursor(s) will be displayed when selecting automatic measurements. For example, toggle to go to Measure menu. Select any of the five measurements displayed in the menu display area, then select any measurement parameter types. Selecting Vpp as the voltage measurement Type will show the following display, with two cursors shown on display to illustrate their positions to which the measurements are being made. -
Page 108: Figure 57 - Auto Cursor Measuring Period
Figure 57 - Auto Cursor Measuring Period Note: Auto cursor mode does not support displaying cursors for multiple measurements. -
Page 109: Using The Digital Multimeter
4 Using the Digital Multimeter The handheld digital storage oscilloscope has a built-in multimeter that can measure DC and AC voltage, DC and AC current, resistance, diode, continuity, and capacitance. To set the instrument to the digital multimeter mode, press , and the display will enter the multimeter display, as shown below. -
Page 110: Dc And Ac Voltage Measurements
Note: In the digital multimeter mode, only the function keys ( , and keys are active. All other front panel keys, besides are inactive and are unused. CAUTION: Always use only the included test leads to make measurements. Verify that test leads are in proper working conditions and that they meet the specified electrical ratings and input requirements of the instrument. -
Page 111: Dc Voltage Measurement
Table 43 – DC/AC Voltage Measurement Menu Menu Option Setting Description Save the current input value as a reference value. Subsequent measurements will be the difference from the reference value. This is Relative same as “zeroing” the meter. Relative mode is disabled. Select to enable autoranging. -
Page 112: Figure 59 - Out Of Range
0.L. Figure 59 - Out of Range CAUTION: Always connect the test leads to the instrument inputs first before probing the DUT to avoid potential shock hazard. Follow these steps to make a measurement. 1. Connect the negative (-) side with the black test lead to the COM input. -
Page 113: Ac Voltage Measurements
10 A V.Ω.C DC Voltage Figure 60 - Connection for DC Voltage Measurement WARNING: Never connect more than 1000V DC across the input terminals. AC Voltage Measurements AC voltage measurements use the same setup as DC voltage measurements. Configure all settings from the menu. When set for Manual ranging (select Manual by toggling ), use the key to increase the range. -
Page 114: Dc And Ac Current Measurements
1. Connect the black test lead to the COM input. 2. Connect the red test lead to the V.Ω.C input. 3. Probe with the test leads to the DUT and take the measured reading on display. NOTE: If the measurement is out of range or if manual range is used and the measurement is outside of the selected range, the instrument will beep continuously. -
Page 115: Dc Current Measurements
Table 44 – DC/AC Current Measurement Menu Menu Option Setting Description Save the current input value as a reference value. Subsequent measurements will be the difference from the reference value. This is the Relative same as “zeroing” the meter. Relative mode is disabled. Select to enable autoranging. -
Page 116: Figure 62 - Connection For Low Dc Current Measurement
Low Current Measurements (< 600 mA) Follow these steps to make measurements < 600 mA. 1. Connect the negative (-) side with the black test lead to the COM input. 2. Connect the positive (+) side with the red test lead to the mA input. 3. -
Page 117: Make Ac Current Measurements
10 A V.Ω.C DC Current Figure 63 - Connection for Higher DC Current Measurement WARNING: Do not connect more than 10 A DC current across the 10A input terminal or the protection fuse will be tripped. Make AC Current Measurements For current measurements, the low current measurement mode supports two ranges. -
Page 118: Figure 64 - Connection For Low Ac Current Measurement
10 A V.Ω.C DC Current Figure 64 - Connection for Low AC Current Measurement WARNING: Do not connect more than 600 mA AC current across the mA input terminal or the protection fuse will be tripped. Never input 10 A or more current across the terminal or the instrument will be damaged and warranty will be void. -
Page 119: Make Resistance Measurements
WARNING: Do not connect more than 10 A DC current across the 10A input terminal or the protection fuse will be tripped. 4.3 Make Resistance Measurements To measure resistances, press repeatedly until Meter is set to “Res.”. Table 45 – Resistance Measurement Menu Menu Option Setting Description... -
Page 120: Figure 66 - Connection For Resistance Measurement
Enters the Meter Trend plot mode (See “Meter Trend Plot Trend Plot” for more information). Configure all settings from the menu. When set for Manual ranging (select Manual by toggling ), use the key to increase the range. At the highest range, pressing this will automatically go back to the lowest range. -
Page 121: Make Diode Measurements
WARNING: Do not apply more than 1000 VDC across the terminals or they will be damaged. 4.4 Make Diode Measurements The instrument can measure the forward voltage of general purpose diodes. To measure diodes, press repeatedly until Meter is set to Diode. WARNING: Fully discharge the capacitor before connecting it to any of the inputs or it may damage the... -
Page 122: Continuity Test
inputs first before connecting the DUT to avoid potential shock hazard. Follow these steps to make a measurement. 1. Connect the black test lead to the COM input. 2. Connect the red test lead to the V.Ω.C input. 3. Probe with the test leads to the DUT and take the measured reading on display. -
Page 123: Figure 68 - Continuity Test
Figure 68 - Continuity Test WARNING: Fully discharge the capacitor before connecting it to any of the inputs or it may damage the instrument. CAUTION: Always connect the test leads to the instrument inputs first before connecting the DUT to avoid potential shock hazard. -
Page 124: Make Capacitance Measurements
10 A V.Ω.C Continuity Figure 69 - Connection for Continuity Test WARNING: Do not apply more than 1000 VDC across the terminals or they will be damaged. 4.6 Make Capacitance Measurements To measure capacitance, press repeatedly until Meter is set to “Cap.”. - Page 125 value. Subsequent measurements will be the difference from the reference value. This is same as “zeroing” the meter. Relative mode is disabled. Enters the Meter Trend plot mode (See “Meter Trend Plot Trend Plot” for more information). Configure relative settings from the menu. WARNING: Fully discharge the capacitor before connecting it to any of the inputs or it may damage the...
-
Page 126: Using Trend Plot
10 A V.Ω.C Capacitor Figure 71 - Connection for Capacitance Measurement WARNING: Do not apply more than 1000 VDC across the terminals or they will be damaged. 4.7 Using Trend Plot The trend plot function is available for some of the multimeter measurement functions. - Page 127 Scope Trend Plot allows storing two types of measurement data from the oscilloscope’s channel input signals and plotting it to a graph. The data can be stored into external memory using a USB flash drive connected to the USB host port. NOTE: The oscilloscope cannot be in SCAN mode when using scope trend plot.
-
Page 128: Record Data With Trend Plot
Table 48 - Scope Trend Plot Menu 2/2 Menu Option Setting Description Normal Display the data up to the minute. View all Display all data on display. Record data automatically Manual Record data manually. Pressing each time will record one measurement. Select to save data to external USB flash drive. - Page 129 Press to choose from delay measurement parameters. 3. Select the source channel and type of measurement parameter you want to record. For voltage measurement parameters, the menu and selections are the same as in “Table 37 - Voltage Measurement Parameters Menu”. For time measurement parameters, the menu and selections are the same as in “Table 38 - Time Measurement Parameters Menu”.
- Page 130 Pause Recording By default, data is always recording continuously. To stop recording at any time, press to toggle between Run or Stop. Restart Recording To restart recording the data from the beginning, press to select Restart. The recording timer will reset back to 0:00:00 and all previously recorded data will be cleared from memory.
-
Page 131: Save Recorded Data To External Memory
menu. To exit out of Scope Trend Plot, press to select Return. All previously recorded data will be lost if you exit. A confirmation message will ask if you want to exit. Save Recorded Data to External Memory The recorded data on the scope trend plot is stored temporarily. All recorded data will be lost if the recording gets reset, exit out of the scope trend plot mode, or power OFF the instrument. -
Page 132: Scope Recorder
data. When finished, a message will prompt to notify the file has been saved successfully. To exit out of the Directory menu, go to the second page and select Return. Scope Recorder The scope recorder allows users to record the oscilloscope’s channel input signals for a long period of time. - Page 133 Record Select record options Replay Replay the recorded waveform. Option Setup the parameters of waveform recorder. Return Exit scope recorder function. Table 50 - Record Options Menu Menu Setting Description Option Start Begin recording CH1 and/or CH2 waveforms. Replay Select to replay the recorded waveform. Copy recording saved in internal memory to Copy external USB flash drive.
-
Page 134: Configure Record Options
Table 52 - Option Menu Menu Setting Description Option Record and replay channel waveform with full Full screen screen. Viewer Record and replay channel waveform with a Split split screen. The top half will display CH1 and the bottom half will display CH2. Continuously record data. -
Page 135: Figure 72 - Scope Recorder External Save Mode
If USB key is selected for Save Mode, File Name will be shown in the menu with a file name starting with BKXXXXX where XXXXX will be an auto increment number starting with 00001. If no external USB flash drive is detected, File Name will indicate No U disk. -
Page 136: Playback Scope Recording
To stop recording at any time, press to select Stop. To pause the recording at any time, press to select Pause. While the recording is paused, the menu option will change to Continue. Press it to continue recording. Playback Scope Recording To playback the recorded waveforms, from the Scope Recorder menu, press to select Record. -
Page 137: Meter Trend Plot
To view different portions of the recording, use the Previous and Next menu options by pressing respectively to go backward or forward. To replay it again after playback is finished, select Restart by pressing To playback a file saved to an external USB flash drive, press from the recorder menu to select File Name and the file directory screen will be displayed. -
Page 138: Figure 75 - Meter Trend Plot Display
set up the multimeter first with the measurement function you want to use with trend plot. By default, the trend plot will continuously store and plot data when you enter the Meter Trend Plot menu. Figure 75 - Meter Trend Plot Display Recording/Trend Plot time and percentage of temporary storage memory used. - Page 139 Table 53 - Meter Trend Plot Menu 1/2 Menu Setting Description Option Trend Plot Restart Restart the trend plot recording. 10Sa/s, 5Sa/s, 2Sa/s, 1Sa/s, Set the sampling rate of the trend plot Sa Rate 0.5Sa/s, recording. 0.2Sa/s Display the trend plot recorded data up to Normal the minute.
-
Page 140: Record Data With Trend Plot
Instrument will return to the Return multimeter mode. Return to the first page of the Meter Next Page Page2/2 Trend Plot menu. Record Data with Trend Plot Follow these steps to record data using Meter Trend Plot. 1. Select the multimeter measurement function you want to record. Press to enter the multimeter mode. -
Page 141: Save Recorded Data To External Memory
Select Display Mode The display settings on the trend plot can be changed. Users can select viewing the data up to the minute, or select viewing all data in a compressed format. To toggle between the two display modes, toggle to select between Normal and View All. - Page 142 However, the data can be saved onto an external USB flash drive. To save: 1. Go to the second page of the Meter Trend Plot menu and select CSV by pressing 2. The Directory menu will be displayed. 3. Follow the same instructions from section 3.7 “Save/Recall Function”...
-
Page 143: Remote Communication
6 Remote Communication The 2510 series digital storage oscilloscope comes with application software which provides most of the controls that emulate the front panel of the instrument. The miniUSB device port on the side of the instrument, when not used for probe compensation, can be used to connect to a computer using a miniUSB to USB type A cable and allow remote communication via the software. -
Page 144: Troubleshooting Guide
7 Troubleshooting Guide System Message Prompts and Instructions Trig level at limit! The trigger level is at the limit when you adjust the trigger level. Horizon position at limit! The horizontal position is at the limit when adjust the horizontal position keys. -
Page 145: Frequently Asked Questions
File successfully saved. Ready Data Success! Setup data or waveform data from the internal storage of the oscilloscope or USB flash drive was read successfully. Record Wave Success! This message will appear when you finish recording waveforms. Frequently Asked Questions Oscilloscope 1. -
Page 146: Multimeter
Multimeter 1. After I change a menu selection, how do I set the changes and close the menu window? Press the keys to set the menu changes and to close the menu window. 2. I cannot measure any current. Is there a problem? There are 2 ports to measure current, one is labeled 10 A to measure current up to 10 A. -
Page 147: Specifications
If the operating temperature changes by more than 5° C, you must perform the Do Self Cal operation, accessible through the Utility menu. All specifications are guaranteed unless noted “typical.” Models 2511 2512 2515 2516 Bandwidth 60 MHz... - Page 148 2 mV/div: ≤ ± 4 % Max. BNC Input CATII 300 V RMS from BNC signal to BNC shell Voltage Max. input 1x/10x CATII 300 V RMS (PR150SA) Voltage for (5)(6) 10x CATIII 600 V RMS, CATII 1000 V RMS (PR250SA) probe 2mV - 200mV : ±1.6V 5mV - 200mV : ±1.6V...
- Page 149 Trigger Modes Auto, Normal, Single Trigger Coupling AC, DC, LF reject, HF reject Trigger Source CH1, CH2 Trigger Level CH1, CH2: ± 6 divisions from center of display Range Trigger Pre-trigger: Memory depth/ 2* sampling Displacement Delay Trigger: 268.04 div Trigger Modes: Positive Pulse (>,<, =), Negative Pulse (>, Pulse Width <, =)
- Page 150 (3) Available when sampling rate is < 500 MSa/s and maximum data depth mode is enabled. (4) Probe included with models 2511 and 2512 only. (5) Probe included with models 2515 and 2516 only. (6) Refer to the respective probe’s manual for more information on the...
-
Page 151: Maximum Input Voltages
Maximum Input Voltages Maximum Input Voltage vs. Frequency The chart below shows the maximum input voltage vs. frequency. - Page 152 Maximum Input Voltage between Scope Reference and Scope Reference to ground The chart below shows the maximum input voltage between scope reference and scope reference to ground for models 2515 and 2516 only.
-
Page 153: Multimeter Specifications
Multimeter Specifications All specifications are based on operating at temperatures 23 ± 5°C and relative humidity < 75%. Accuracy is based on ± (% of reading + offset) Display 6000 counts Resolution DC voltage, AC voltage, resistance, diode, continuity, Measurement capacitance, DC current, AC current Function... - Page 154 600.0 V 100 mV 1000 V AC Voltage Range Resolution Accuracy 60.00 mV 10 µV ± (1 % + 15 digits) 600.0 mV 100 µV 6.000 V 1 mV 60.00 V 10 mV ± (1 % + 5 digits) 600.0 V 100 mV 750 V 1.
-
Page 155: Recorder Specifications
(2)(3) DC and AC Current Range Resolution Accuracy 60.00 mA 10 µA ± (1.5 % + 5 digits) 600.0 mA 100 µA 6.000 A 1 mA ± (2.5 % + 5 digits) 10.00 A 10 mA 2. For 10 A terminal, > 6 A DC or AC rms for 10 seconds ON and 15 minutes OFF. -
Page 156: General Specifications
General Specifications Environmental and Safety Temperature Operating: 32 °F to 104 °F (0 °C to +40 °C) Not operating: -4 °F to 158 °F (-20 °C to +70 °C) Humidity Operating: 85% RH, 104 °F (40 °C), 24 hours Altitude Operating: 9,842.5 ft (3,000 m) Electromagnetic EMC Directive 2004/108/EC,... -
Page 157: Maintenance
Maintenance Do not expose the LCD display to direct sunlight for long periods of time. To avoid damage to the instrument or probes, do not expose them to sprays, liquids, or solvents. Cleaning If the instrument requires cleaning, disconnect it from all power sources and clean only with a mild detergent and water. -
Page 158: Service Information
SERVICE INFORMATION Warranty Service: Please go the support and service section on our website www.bkprecision.com obtain an RMA #. Return the product in the original packaging with proof of purchase to the address below. Clearly state on the RMA the performance problem and return any leads, probes, connectors and accessories that you are using with the device. -
Page 159: Limited Three-Year Warranty
LIMITED THREE-YEAR WARRANTY B&K Precision Corp. warrants to the original purchaser that its products and the component parts thereof, will be free from defects in workmanship and materials for a period of three years from date of purchase. B&K Precision Corp. will, without charge, repair or replace, at its option, defective product or component parts. - Page 160 22820 Savi Ranch Parkway Yorba Linda, CA 92887 www.bkprecision.com © 2013 B&K Precision Corp. Printed in China V051115...
Need help?
Do you have a question about the 2511 and is the answer not in the manual?
Questions and answers