Advertisement
Quick Links
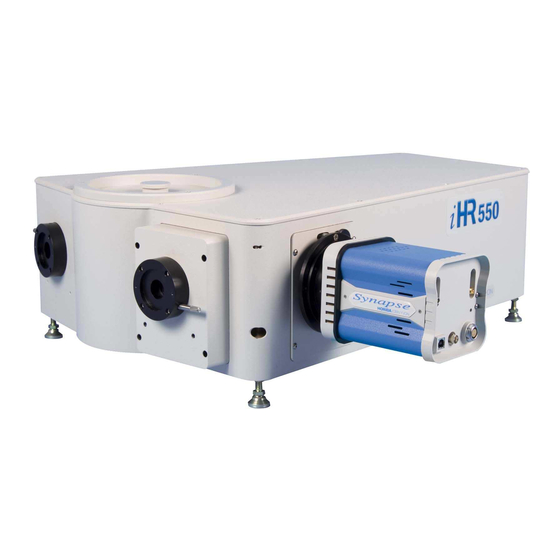
Horiba iHR550 Spectrometer QuickInstallation and Operation Guide
Sabeeh Irfan Ahmad, Physlab, 23 July 2016
The Horiba iHR550 is an imaging spectrometer that can be used both as a
spectrograph and as a monochromator. This is a short guide to installing its software
tools and operating the spectrometer to get a simple wavelength spectrum
measurement.
• Install the pre-requisite software. First should be the USB-spectrometer utilities.
This initializes the spectrometer and controls only the spectrometer, not any
attached detectors (such as the Syncerity CCD camera) or external mirrors and
appendages. In the case of this particular setup, the spectrometer can be
initialized and only the front entrance slit and Grating turret (that rotates the
gratings) can be controlled. Once the utilities are installed, open the
'USBSpectrometerControl' program.
Advertisement

Related Manuals for horiba ihr550


Summary of Contents for horiba ihr550
- Page 1 Horiba iHR550 Spectrometer QuickInstallation and Operation Guide Sabeeh Irfan Ahmad, Physlab, 23 July 2016 The Horiba iHR550 is an imaging spectrometer that can be used both as a spectrograph and as a monochromator. This is a short guide to installing its software tools and operating the spectrometer to get a simple wavelength spectrum measurement.
- Page 2 ‘Initialize button. • If the spectrometer is being configured for the first time, click the ‘Add’ button and select the iHR550 option (the 550 refers to its 55cm focal length) and click ‘Next.’ • Proceed through the options until you get to the spectrometer’s details window;...
- Page 3 • Finish adding the spectrometer and proceed to the installation of SynerJY. The USBSpectrometerControl should be run before SynerJY for the initialization and control of the monochromator. SYNERJY is the overall spectrometer system’s control software. It interfaces, synchronizes and operates the spectrometer along with associated detectors (in this case, the Syncerity).
- Page 4 • Select the configuration; the iHR550+Syncerity in this case or just wait for it to do it itself. • The New Experiment window will open up.
- Page 5 • On the left will be tabs with options to configure different aspects of experiments, perform computations on signals, chain experiments together, etc. In the ‘General’ tab, The ‘Detector’ tab should be open. Make sure the ‘Active’ option is selected, select spectra, and set the details as required. In the ‘Mono’ tab, some options for the monochromator will be provided.
- Page 6 • Experiment comments are important to identify and distinguish between data sets. These are also in the experiment setup window. • Make sure your hardware is setup. Below are examples of simple arraignments where a Stellarnet SL2 calibration lamp and an Electrotechnic neon spectrum tube were set up before the entrance slit of the spectrometer.
- Page 7 • Once all the setting are configured, simply click the ‘Run’ button. The spectrometer will then take measurements. • Shown is a ‘dark’ reading where the entrance slit is closed.
- Page 8 • The collected data contains a spectrum graph, raw data points and experiment notes that can be used for later reference. • Shown now is a spectrum measurement with the electromechanical shutter, entrance and exit slits all open at specific dimensions; the setup is the neon spectrum tube described above with a grating with a groove density of 1200gr/mm;...
- Page 9 If this data is to be exported, then go to the File export option; it contains • multiple exporting options including NI (National Instruments) TDM/TDMS files and Multipage PDFs. • If instead of a spectrum a spectral image is required, then simply select ‘Image’ instead of ‘spectrum in the Experiment setup window.
- Page 10 • The interpretation of the spectral image is simple, the CCD takes an exact image (or ‘picture’) of the grating-seperated light falling on it. The horizontal pixels correspond to wavelengths and the ‘colour’ corresponds to the number of photons detected by the camera.
Need help?
Do you have a question about the ihr550 and is the answer not in the manual?
Questions and answers