HP 39gII User Manual
Graphing calculator
Hide thumbs
Also See for 39gII:
- Product information (3 pages) ,
- Quick start manual (5 pages) ,
- Quick start manual (69 pages)
Table of Contents
Advertisement
Quick Links
Advertisement
Table of Contents

Related Manuals for HP 39gII


Summary of Contents for HP 39gII
- Page 1 HP 39gII graphing calculator user's guide Edition1 Part Number NW249-90001...
- Page 2 Printing History Edition 1 November 201 1...
-
Page 3: Table Of Contents
Mathematical calculations ............12 Numerical representations............19 Complex numbers ..............20 Catalogs and editors ............. 21 2 Apps and their views HP Apps ................23 App library..............24 App views ............... 25 Standard app views .............. 27 About the Symbolic view ........... 27 Defining an expression (Symbolic view) ...... - Page 4 Getting started with the Solve app ........62 Interpreting results ..............66 Multiple solutions..............67 Using variables in equations ........... 68 5 Statistics 1Var app About the Statistics 1Var app ..........71 Getting started with the Statistics 1Var app ......71 Entering and editing statistical data .........
- Page 5 Two-Sample T-Interval............117 8 Parametric app About the Parametric app ............ 119 Getting started with the Parametric app......119 9 Polar app About the Polar app ............123 Getting started with the Polar app ........123 10 Sequence app About the Sequence app............127 Getting started with the Sequence app ......
- Page 6 The Math menu............... 158 Math functions by category........... 160 Calculus functions ............160 Complex number functions ..........160 Constants............... 161 Distribution..............162 Hyperbolic trigonometry ..........166 Integer................167 List functions ..............170 Loop functions ..............170 Matrix functions .............. 171 Polynomial functions............
- Page 7 Introduction ................ 229 The Program Catalog............231 Creating a New Home Program........232 The Program Editor ............233 The HP 39gII Programming Language ....... 241 App programs ............... 247 Program commands ............254 Variables and Programs ..........277 App Functions ..............300 22 Reference information Glossary ................
- Page 8 Program commands ............325 Constants ................326 Program constants............326 Physical Constants ............327 Status messages ..............327 23 Appendix: Product Regulatory Information Federal Communications Commission Notice....... i European Union Regulatory Notice ........... iii Contents...
-
Page 9: Manual Conventions
Preface Manual conventions The following conventions are used in this manual to represent the keys that you press and the menu options that you choose to perform the described operations. Key presses are represented as follows: • , etc. Shift keys, that is the key functions that you access by •... -
Page 10: Notice
© 1994–1995, 1999–2000, 2003–2006, 2010–2011 Hewlett-Packard Development Company, L.P. The programs that control your HP 39gII are copyrighted and all rights are reserved. Reproduction, adaptation, or translation of those programs without prior written permission from Hewlett-Packard Company is also prohibited. -
Page 11: Getting Started
Getting started On/off, cancel operations To turn on Press to turn on the calculator. To cancel When the calculator is on, the key cancels the current operation. To turn off Press to turn the calculator off. To save power, the calculator turns itself off after several minutes of inactivity. -
Page 12: The Display
History Edit line Menu key labels Menu key labels. The top row of keys on the HP 39gII keyboard (F1-F6) are the menu keys. These keys give you access to the menu items shown at the bottom of the display. - Page 13 Annunciators. Annunciators are symbols that appear above the title bar and give you important status information. Annunciator Description To activate, press . Shift in effect for next keystroke. To cancel, press again. To activate, press . Alpha in effect for next keystroke. To lock, press again.
-
Page 14: The Keyboard
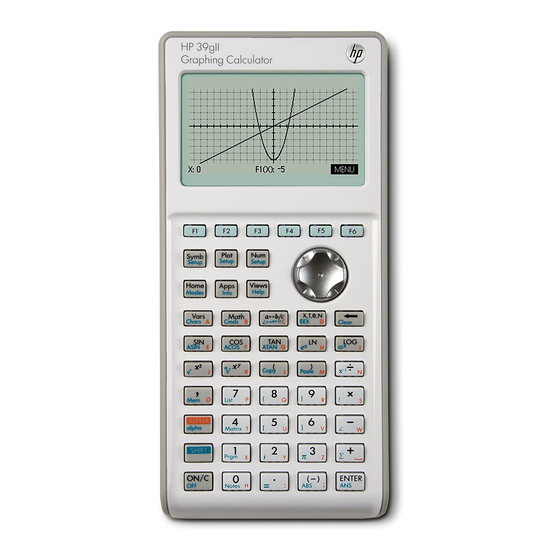
The keyboard Number Feature HP 39gII 256 x 128 pixel display Context-sensitive menu F1-F6 menu keys HP Apps keys Modes Common math and science functions Shift keys On (cancel) Last Answer (ANS) Enter key Alphabetic entry Catalogs and editors Backspace (Clear) - Page 15 Meaning (Continued) Displays the Plot view for the current app. Displays the Numeric view for the current app. Displays the Home view, for performing calculations. Displays the App Library menu. Displays the VIEWS menu. Entry/Edit keys The entry and edit keys are: Meaning Cancels the current operation if the calculator is on by pressing...
-
Page 16: Shifted Keystrokes
Meaning (Continued) Enters the independent variable by inserting X, T, θ, or N into the edit line, depending on the current active app. Backspace. Deletes the character to the left of the cursor. Clears all data on the screen. On a settings screen, for example Plot CLEAR Setup,... -
Page 17: Math Keys
Alpha shift. Help Press (Help) to enter the HP 39gII built-in Help system. The Help system always opens in your current context or view, giving you information about the current view and its menu items. Once in the Help system, you can navigate to other topics and find help on any view or command. - Page 18 See the chapter Using Mathematical Functions for details. H I N T When using the Math menu, or any menu on the HP 39gII, the categories and items are numbered for your convenience. For example, ITERATE is the first item under Loop, which is the eighth category.
-
Page 19: Menus
Menus A menu offers you a choice of items. Menus are displayed in 1-3 columns. arrow means more • items below. arrow means more • items above. To search a menu Press to scroll through the list. If you press •... -
Page 20: Input Forms
Input forms An input form shows several fields of information for you to examine and specify. After highlighting the field to edit, you can enter or edit a number (or expression). You can also select options from a list ( ). -
Page 21: Setting A Mode
Choose a smaller or larger font for most display purposes. Calculator Calculator NameEnter a descriptive Name name to identify your calculator to the HP 39gII Connectivity Kit. Textbook Disable or enable Textbook Format Display Display for expressions entered in the Home and Symbolic views. -
Page 22: Mathematical Calculations
the current app. The procedure is the same for changing number format, language, and complex number modes. 1. Press to open the Home Modes input MODES form. The cursor (highlight) is in the first field, Angle Measure. 2. Press to display a list of choices. - Page 23 Entering Enter an expression into the HP 39gII in the same left- • expressions to-right order that you would write the expression. This is called algebraic entry. To enter functions, select the key or Math menu item • for that function. You can also enter a function by using the Alpha keys to spell out its name.
- Page 24 The calculator inserts it automatically. Parentheses are also important in specifying the order of operation. Without parentheses, the HP 39gII calculates according to the order of algebraic precedence (the next topic). Following are some examples using parentheses.
- Page 25 8. OR and XOR. 9. Left argument of | (where). 10. Equals, =. Largest and –499 The HP 39gII represents 1 × 10 (as well as all smallest numbers smaller than this) as zero. The largest number displayed is 9.99999999999 × 10 .
- Page 26 When you highlight a previous input or result (by pressing ), the menu labels appear. To copy a previous Highlight the line (press ) and press . The line number (or expression) is copied into the edit line. Your last few entries are always copied to the clipboard, so in most cases, you can just paste a recent result.
- Page 27 The variable is different from the numbers in Home’s display history. A value in is stored internally with the full precision of the calculated result, whereas the displayed numbers match the display mode. H I N T When you retrieve a number from , you obtain the result to its full precision.
- Page 28 1. Perform a calculation. 2. Store the result in the A variable. 3. Perform another calculation using the A variable. Accessing the Pressing enables the highlight bar in the display display history history. While the highlight bar is active, the following menu and keyboard keys are very useful: Function Scrolls through the display history.
-
Page 29: Numerical Representations
For example, enter 18/7 to see the decimal result: 2.5714…. Press once to see and again to ----- - . The 39gII will approximate fraction and -- - mixed number representations in cases where it cannot find exact ones. Enter to see the decimal approximation: 2.236…. -
Page 30: Complex Numbers
Complex numbers Complex results If the Complex mode setting is checked, then the HP 39gII can return a complex number as a result for some math functions. A complex number appears as . For × example, entering returns i and entering (4,5) 1 –... -
Page 31: Catalogs And Editors
Catalogs and editors The HP 39gII has several catalogs and editors. You use them to create and manipulate objects. They access objects with stored data (lists of numbers or notes with text) that are independent of apps, as well as notes and programs attached to the current HP App. - Page 32 Getting started...
-
Page 33: Apps And Their Views
HP Apps are applications designed for the study and exploration of a branch of mathematics or to solve problems of one or more types. The following table lists the name of each HP App and gives a general description of its purpose. App name... -
Page 34: App Library
In addition to these apps, which can be used in a variety of applications, the HP 39gII is supplied with three apps for exploring function families: The Linear, Quadratic, and Trig Explorers. These apps will retain their data so... -
Page 35: App Views
App views The HP Apps all utilize the same set of views and it is this consistency in the use of views that make them easy to learn and to use. There are three major views, known as the Symbolic, Plot (Graphic), and Numeric views. These... -
Page 36: The Views Menu
HP App. The Views menu Besides the 7 views that all HP Apps can utilize, the Views key provides access to any special views or scaling options that an app may have or that some of the apps may share in common. -
Page 37: Standard App Views
Plot-Detail view Press Select Plot-Detail Splits the screen into the current plot and a user- defined zoom. Plot-Table view Press Select Plot-Table Splits the display, showing both the plot and tabular views. Preset zooms The Views menu also contains the same preset zooms from the Zoom menu: Auto Scale •... -
Page 38: Defining An Expression (Symbolic View)
Defining an expression (Symbolic view) Choose the app from the App Library. Press to select an app. The Function, Parametric, Polar, and Sequence apps start in the Symbolic view. If the highlight is on an existing expression, scroll to an empty line—unless you don’t mind writing over the expression—or, clear one line ( ) or all lines CLEAR... -
Page 39: Evaluating Expressions
Nth term as a non-recursive expression in terms of N only. Note: you will have to enter the second term if the – HP 39gII is unable to calculate it automatically. Typically if Ux(N) depends on Ux(N–2) then you must enter Ux(2). Evaluating expressions... - Page 40 3. Highlight F3(X). 4. Press Note how the values for F1(X) and F2(X) are substituted into F3(X). In Home You can also evaluate any function expression in Home by entering it into the edit line and pressing For example, define F4 as below. In Home, type F4(9)and press .
-
Page 41: About The Plot View
Meaning (Continued) Enters the independent variable in the Polar app. Or, you can use the key on the keyboard. Enters the independent variable in the Sequence app. Or, you can use key on the keyboard. Displays the current expression in Textbook Format. - Page 42 If there is a number to enter, type it in and – press If there is an option to choose, press – highlight your choice, and press As a shortcut to , just highlight the field to change and press to cycle through the options.
-
Page 43: Exploring The Graph
Those items with space for a checkmark are settings you can turn on or off. Press to display the second page. Field Meaning Draws the axes. AXES Labels the axes with XRNG and LABELS YRNG values. Draws grid points using XTICK GRID DOTS and YTICK spacing. - Page 44 Meaning (Continued) Turns menu-key labels on and off. When the labels are off, pressing turns them back on. Displays the Zoom menu list. Turns trace mode on/off. Opens an input form for you to enter an X (or T or N or θ) value. Enter the value and press .
- Page 45 Meaning (with trace mode on) Moves cursor one pixel left and right, <> respectively on the current graph. Switches the tracer from one graph to to the previous or next, respectively, in the list of symbolic definitions. Moves the tracer to the leftmost or rightmost point on the current graph.
- Page 46 Zoom options Press , select an option, and press . (If is not displayed, press .) Not all options are available in all apps. Option Meaning Re-centers the plot around the Center on current position of the cursor without Cursor changing the scale.
- Page 47 Option Meaning (Continued) Rescales the vertical axis so that the Auto Scale display shows a representative piece of the plot, for the supplied x axis settings. (For Sequence and Statistics apps, autoscaling rescales both axes.) The autoscale process uses the first selected function only to determine the best scale to use.
- Page 48 Un-zoom: Un-zoom Note: press to move to the bottom of the Zoom list. Zoom Out: Now un-zoom. As a shortcut, press while in the Plot view to zoom out. X-Zoom In: X In Now un-zoom. X-Zoom Out: X Out Now un-zoom. Y-Zoom In: Y In Apps and their views...
- Page 49 Y-Zoom Out: Y Out Zoom Square: Square To box zoom The Box Zoom option lets you draw a box around the area you want to zoom in on by selecting the endpoints of one diagonal of the zoom rectangle. 1. If necessary, press to turn on the menu-key labels.
- Page 50 To set zoom factors 1. In the Plot view, press 2. Press 3. Select Set Factors... and press 4. Enter the zoom factors. There is one zoom factor for the horizontal scale (XZOOM) and one for the vertical scale (YZOOM). Zooming out multiplies the scale by the factor, so that a greater scale distance appears on the screen.
- Page 51 1. Press . Select Plot-Detail and press The graph is plotted twice. You can now zoom in on the right side. 2. Press select the zoom method and press . This zooms the right side. Here is an example of split screen with Zoom In.
-
Page 52: About The Numeric View
Decimal scaling Decimal scaling is the default scaling. If you have changed the scaling to Trig or Integer, you can change it back with Decimal. Integer scaling Integer scaling compresses the axes so that each pixel is and the origin is near the screen center. ×... -
Page 53: Exploring The Table Of Numbers
Numeric view The following table details the fields on the Numeric settings Setup input form. Field Meaning The independent variable’s NUMSTART starting value. The size of the increment from NUMSTEP one independent variable value to the next. Type of numeric table: NUMTYPE Automatic or BuildYourOwn. - Page 54 Zoom within a Zooming recalculates the table of numbers with greater or table lesser common differences among X-values. Zoom options The following table lists the zoom options: Option Meaning Decreases the step value for the independent variable so a narrower range is shown.
-
Page 55: Building Your Own Table Of Numbers
recalculated, and the entire table is regenerated with the same interval between X-values. Building your own table of numbers The default NUMTYPE is Automatic, which fills the table with data for regular intervals of the independent (X, T, θ, or N) variable. With the NUMTYPE option set to Build YourOwn, you fill the table yourself by typing in the independent-variable values you want. -
Page 56: Buildyourown Table Keys
BuildYourOwn table keys Besides the menu keys, you can use the following keys to explore the table when BuildYour Own is active. Meaning Puts the highlighted independent value (X, T, θ, or N) into the edit line. Pressing replaces this variable with its current value. - Page 57 wdjmE -Sjl wdjmE 2. Reset the graph setup to the default settings. SETUP PLOT CLEAR 3. Plot the two functions. 4. Reset the numeric setup to the default settings. SETUP CLEAR 5. Display the functions in numeric form. Apps and their views...
- Page 58 Apps and their views...
-
Page 59: Function App
Function app About the Function app The Function app enables you to explore up to 10 real- valued, rectangular functions y in terms of x. For example, – – – Once you have defined a function you can: create graphs to find roots, intercepts, slope, signed •... - Page 60 Define the There are 10 function definition fields on the Function expressions app's Symbolic view. They are labelled F1(X) through F9(X) and F0(X). Highlight the function definition field you want to use, and enter an expression. You can press to edit an existing expression or just start typing to enter a new expression.
- Page 61 Plot the 5. Plot the functions. functions Trace a graph 6. Trace the linear function. > < Note: by default, the tracer is active. 7. Jump from tracing the linear function to the quadratic function. Change the You can change the scale to see more or less of your scale graph.
- Page 62 Display the 1. Display the Numeric Numeric view view. Set up the table 2. Display the Numeric setup. SETUP You can set the starting value and step value for the x- column, as well as the zoom factor for zooming in or out on a row of the table.
- Page 63 To go directly to a 6. Move directly to X =10. value N O T E to navigate directly to a value, ensure the cursor is in the independent variable column, in this case, x, before typing the desired value. To access the zoom 7.
-
Page 64: Function App Interactive Analysis
Function app interactive analysis From the Plot view ( ), you can use the functions on the FCN menu to find roots, intersections, slopes, signed areas and extrema for a function defined in the Function app (and any Function-based apps). The FCN functions act on the currently selected graph. - Page 65 4. Choose the function whose intersection with the quadratic function you wish to find. to select F1(X) The coordinates of the intersection point are displayed at the bottom of the screen. Note: if there is more than one intersection (as in our example), the coordinates of the intersection point closest...
- Page 66 7. Move the cursor to x = –1.3 by pressing > < to move to x = –1.3 8. Press to accept using F2(X) as the other boundary for the integral. 9. Choose the end value for The cursor jumps to on the linear function and the area is shaded.
- Page 67 To find the 1 1. Move the cursor to the extremum of the quadratic equation and find the extremum of the quadratic quadratic. (to move the tracer to the quadratic) Select Extremum The coordinates of the extremum are displayed at the bottom of the screen.
- Page 68 The FCN functions are: Function Description Select Root to find the root of the Root current function nearest the cursor. If no root is found, but only an extremum, then the result is labeled Extremum: instead of Root:. The cursor is moved to the root value on the x-axis and the resulting x-value is saved in a variable named Root.
- Page 69 To access FCN The FCN variables are contained on the Vars menu. variables To access FCN variables in the Home view: Select Function Results >= to choose a variable You can access and use the FCN variables to define functions in the Symbolic view the same way as you do in the Home view.
- Page 70 Function app...
-
Page 71: Solve App
Solve app About the Solve app The Solve app solves an equation or an expression for one of its unknown variables. You define an equation or expression in the Symbolic view, then supply values for all the variables except one in the Numeric view. Solve works only with real numbers. -
Page 72: Getting Started With The Solve App
Getting started with the Solve app Suppose you want to find the acceleration needed to increase the speed of a car from 16.67 m/sec (60 kph) to 27.78 m/sec (100 kph) in a distance of 100 m. The equation to solve is: Open the Solve 1. - Page 73 highlight the variable that you want to solve for, and press 4. Enter the values for the known variables. 1 0 0 Solve the 5. Solve for the unknown variable (A). unknown variable Therefore, the acceleration needed to increase the speed of a car from 16.67 m/sec (60 kph) to 27.78 m/sec (100 kph) in a distance of 100 m is approximately 2.47 m/s...
- Page 74 6. Plot the equation for variable A. Select Auto Scale 7. Trace along the graph representing the left side of the equation until the cursor nears the intersection. Note the value of A displayed near the bottom left corner of the screen. The Plot view provides a convenient way to find an approximation to a solution instead of using the Numeric view Solve option.
- Page 75 Meaning (Continued) Clears highlighted variable to zero or deletes current character in the edit line, if the edit line is active. Resets all variable values to zero or CLEAR clears the edit line, if cursor is in the edit line. Solve app...
-
Page 76: Interpreting Results
Interpreting results After Solve has returned a solution, press in the Numeric view for more information. You will see one of the following three messages. Press to clear the message. Message Condition The Solve app found a point where Zero both sides of the equation were equal, or where the expression was zero (a root), within the calculator's... -
Page 77: Multiple Solutions
Since this equation is quadratic for x, there can be (and in this case are) two solutions. In the case of polynomials, the HP 39gII offers a quick way to find multiple solutions. 1. Select the Solve app and enter the equation. -
Page 78: Using Variables In Equations
2. Solve for x. appears in the menu to alert you that there are multiple solutions. Press to see the list of solutions and to select the one you want. Using variables in equations You can use any of the real variable names, A to Z and θ. - Page 79 App variables Functions defined in other apps can also be referenced in the Solve app. For example, if you define F1(X)=X in the Function app, you can enter F1(X)=50 in the Solve app to solve the equation X +10=50. Solve app...
- Page 80 Solve app...
-
Page 81: Statistics 1Var App
Statistics 1Var app About the Statistics 1Var app The Statistics 1Var app can store up to ten data sets at one time. It can perform one-variable statistical analysis of one or more sets of data. The Statistics 1Var app starts with the Numeric view which is used to enter data. - Page 82 3. Find the mean of the sample. Press to see the statistics calculated from the sample data in Note that the title of the column of statistics is H1. There are 5 data set definitions available for one- variable statistics: H1–H5. If data is entered in D1, H1 is automatically set to use D1 for data, and the frequency of each data point is set to 1.
-
Page 83: Contents
Statistics 1Var app's Symb View keys The keys you can use from this window are: Meaning Copies the column variable (or variable expression) to the edit line for editing. Press when done. Checks/unchecks the current data set. Only the checkmarked data set(s) are computed and plotted. - Page 84 shall simply add another column, D2, that holds the frequencies of our five data points in D1. Height (cm) Frequency 5. Move the highlight bar into the right column of the H1 definition and enter the column variable name D2. 6.
-
Page 85: Entering And Editing Statistical Data
9. Setup a histogram plot for the data. SETUP PLOT Enter set up information appropriate to your data. 10. Plot a histogram of the data. Entering and editing statistical data The Numeric view ( ) is used to enter data into the Statistics 1Var app. - Page 86 Meaning (Continued) Sorts the specified independent data column in ascending or descending order, and rearranges a specified dependent (or frequency) data column accordingly. Switches between larger and smaller font sizes. Opens a dialog box for creating a sequence based on an expression and storing it in a data column.
- Page 87 Edit a data set In the Numeric view of the Statistics 1Var app, highlight the data value to change. Type a new value and press , or press to copy the value to the edit line for modification. Press after modifying the value on the edit line.
-
Page 88: Computed Statistics
Computed statistics Pressing displays the results in the following table. Statistic Definition Number of data points. Minimum data value in data set. First quartile: median of values to left of median. Median value of data set. Third quartile: median of values to right of median. -
Page 89: Plotting
Plotting You can plot: Histograms • Box-and-Whisker plots • Normal Probability plots • Line plots • Bar graphs • Pareto charts • Once you have entered your data and defined your data set, you can plot your data. You can plot up to five box- and-whisker plots at a time;... -
Page 90: Plot Types
Plot types Histogram The numbers below the plot mean that the current bar (where the cursor is) starts at 0 and ends at 2 (not including 2), and the frequency for this column, (that is, the number of data elements that fall between 0 and 2) is 1. -
Page 91: Setting Up The Plot (Plot Setup View)
The Plot Setup ( ) sets most of the same SETUP PLOT plotting parameters as it does for the other built-in HP Apps. Settings unique to the Statistics 1Var app are as follows: Histogram width HWIDTH enables you to specify the width of a histogram bar. -
Page 92: Exploring The Graph
Exploring the graph The Plot view has menu keys for zooming, tracing, and coordinate display. There are also scaling options under Statistics 1Var app’s Plot View keys The Plot view keys are: Meaning Erases the plot. CLEAR Offers additional pre-defined views for splitting the screen and autoscaling the axes. -
Page 93: Statistics 2Var App
Statistics 2Var app About the Statistics 2Var app The Statistics 2Var app can store up to ten data sets at one time. It can perform two-variable statistical analysis of one or more sets of data. The Statistics 2Var app starts with the Numeric view which is used to enter data. - Page 94 Open the 1. Clear existing data and open the Statistics 2Var app. Statistics 2Var Select Statistics 2Var The Statistics 2Var app starts in the Numeric view. Enter data 2. Enter the data into the columns. > to move to the next column 1400 1 100 2265...
- Page 95 You can create up to five explorations of two-variable data, named S1 to S5. In this example, we will create just one: S1. Explore statistics 5. Find the correlation, r, between advertising time and sales. The correlation is r=0.8995… 6. Find the mean advertising time ( ) and the mean sales ( ).
- Page 96 Plot the graph 8. Plot the graph. Draw the 9. Draw the regression curve (a curve to fit the data regression curve points). This draws the regression line for the best linear fit. Display the 10. Return to the Symbolic view. equation The slope (m) is 425.875.
-
Page 97: Entering And Editing Statistical Data
12. Trace to x=6 on the linear fit. to move the tracer to the fit > 40 times to find x=6 The model predicts that sales would rise to $2,931.50 if advertising were increased to 6 minutes. Entering and editing statistical data The Numeric view ( ) is used to enter data into the Statistics 2Var app. - Page 98 Meaning (Continued) Sorts the specified independent data column in ascending or descending order, and rearranges a specified dependent (or frequency) data column accordingly. Switches between larger and smaller font sizes. Opens a dialog box to create a column of data based on an expression.
-
Page 99: Defining A Regression Model
Delete data To delete a single data item, highlight it and press • . The values below the deleted cell will scroll up one row. To delete a column of data, highlight an entry in that • column and press . - Page 100 Accept the default option to fit the data to a straight • line. Select one of the available fit options in the Symbolic • view. Enter your own mathematical expression in the • Symbolic view. This expression will be plotted, but it will not be fitted to the data points.
-
Page 101: Computed Statistics
Fit model Meaning (Continued) Fits to a logistic curve, Logistic ------------------------- - – ( where L is the saturation value for growth. You can store a positive real value in L, or—if L=0—let L be computed automatically. Fits to a quadratic curve, Quadratic +bx+c. - Page 102 dependent column. Press to return to the default view. The tables below describe the statistics displayed in each view. Here are the statistics computed when you press Statistic Definition The number of data points. Correlation coefficient of the independent and dependent data columns, based only on the linear fit (regardless o the fit type chosen).
-
Page 103: Plotting
Here are the statistics displayed when you press Statistic Definition Mean of y- (dependent) values. Sum of y-values. Σ Sum of y -values. Σ The sample standard deviation of the dependent column. The population standard deviation σ of the dependent column. The standard error of the serrY dependent column. - Page 104 Fitting a curve Press . The graph of the fit will be displayed with the scatter plot. Press to move the tracer to the > < graph of the fit. Press to trace along the fit to see the equation of the fit. Press to see the equation of the fit in the...
-
Page 105: Plot Setup
Correlation The correlation coefficient is stored in the variable r. It is Coefficient, a measure of fit to a linear curve only. Regardless of the fit model you have chosen, relates to the linear model. The value of can range from -1 to 1, where -1 and 1 indicate best fits. -
Page 106: Trouble-Shooting A Plot
Trouble-shooting a plot If you have problems plotting, check that you have the following: The correct fit (regression model). • Only the data sets to compute or plot are • checkmarked (Symbolic view). The correct plotting range. Try using Auto Scale •... - Page 107 Statistics 2Var app's Plot view keys Meaning Erases the plot. CLEAR Offers additional pre-defined views for splitting the screen and auto- scaling the axes. S< Moves cursor to far left or far right. S> Displays the Zoom menu. Turns trace mode on/off. The white dot appears next to the option when Trace mode is active.
-
Page 108: Calculating Predicted Values
Calculating predicted values The functions PREDX and PREDY estimate (predict) values for X or Y given a hypothetical value for the other. The estimation is made based on the equation that has been calculated to fit the data according to the specified fit. Find predicted 1. -
Page 109: Inference App
Inference app About the Inference app The Inference app's capabilities include calculation of confidence intervals and hypothesis tests based on the Normal Z-distribution or Student's t-distribution. Based on statistics from one or two samples, you can test hypotheses and find confidence intervals for the following quantities: •... -
Page 110: Confidence Intervals
Inference app’s Symbolic view options The table below summarizes the options available in Symbolic view. Hypothesis Confidence Intervals Tests Z-Test: 1 μ, the Z- Z-Int: 1 μ, the confidence Test on 1 mean interval for 1 mean, based on the Normal distribution Z-Test: μ... - Page 111 In this section, we will use the example data for the Z-Test on 1 mean to illustrate how the app works and what features the various views present. Select the 2. Select the Hypothesis Test inferential method. inferential method Select Hypothesis Test 3.
-
Page 112: Importing Sample Statistics
Field Definition (Continued) name Sample size Assumed population mean μ Population standard deviation σ Alpha level for the test α Display test 6. Display the test results in numeric format. results The test distribution value and its associated probability are displayed, along with the critical value(s) of the test and the associated critical value(s) of the statistic. - Page 113 Open the 1. Open the Statistics 1Var app and reset the current Statistics 1Var settings. Select Statistics 1Var The Statistics app opens in the Numeric view. Enter data 2. In the D1 column, enter the random numbers produced by the calculator. H I N T If the Decimal Mark setting in the Modes input form modes) is set to Comma, use...
- Page 114 Open the 5. Open the Inference app and clear current settings. Inference app Select Inference Select inference 6. Select an inference method. method and type Select CONF INTERVAL 7. Select a distribution statistic type. Select T-Int: 1 μ Set up the 8.
-
Page 115: Hypothesis Tests
You use hypothesis tests to test the validity of hypotheses that relate to the statistical parameters of one or two populations. The tests are based on statistics of samples of the populations. The HP 39gII hypothesis tests use the Normal Z-distribution or Student’s t-distribution to calculate probabilities. Inference app... -
Page 116: One-Sample Z-Test
One-Sample Z-Test Menu name Z-Test: 1 μ On the basis of statistics from a single sample, the One-Sample Z-Test measures the strength of the evidence for a selected hypothesis against the null hypothesis. The null hypothesis is that the population mean equals a specified value, Η... -
Page 117: Two-Sample Z-Test
Result Description Boundary value(s) of Critical required by the α value that you supplied. Two-Sample Z-Test Menu name Z-Test: μ – μ On the basis of two samples, each from a separate population, this test measures the strength of the evidence for a selected hypothesis against the null hypothesis. -
Page 118: One-Proportion Z-Test
Result Description Difference in the means associ- Test Δ x ated with the test Z-value. Probability associated with the Z-Test statistic. Critical Z Boundary value(s) of Z associ- ated with the α level that you supplied. Difference in the means associ- Critical Δ... -
Page 119: Two-Proportion Z-Test
Inputs The inputs are: Field name Definition Number of successes in the sample. Sample size. Population proportion of successes. π Significance level. α Results The results are: Result Description Test Z Z-Test statistic. Test Proportion of successes in the sample. p ˆ... - Page 120 Inputs The inputs are: Field name Definition Sample 1 success count. Sample 2 success count. Sample 1 size. Sample 2 size. Significance level. α Results The results are: Result Description Test Z Z-Test statistic. Difference between the Test Δ p ˆ proportions of successes in the two samples that is associated with the test Z-value.
-
Page 121: One-Sample T-Test
One-Sample T-Test Menu name T-Test: 1 μ The One-Sample T-Test is used when the population standard deviation is not known. On the basis of statistics from a single sample, this test measures the strength of the evidence for a selected hypothesis against the null hypothesis. -
Page 122: Two-Sample T-Test
Result Description Critical T Boundary value(s) of T associated with the α level that you supplied. Boundary value(s) of Critical required by the α value that you supplied. Two-Sample T-Test Menu name T-Test: μ – μ The Two-sample T-Test is used when the population standard deviation is not known. -
Page 123: Confidence Intervals
Critical Difference in the means associated with the α level you supplied. Δ x Confidence intervals The confidence interval calculations that the HP 39gII can perform are based on the Normal Z-distribution or Student’s t-distribution. One-Sample Z-Interval Menu name Z-int: 1 μ... -
Page 124: Two-Sample Z-Interval
Inputs The inputs are: Field Definition name Sample mean. Sample size. Population standard deviation. σ Confidence level. Results The results are: Result Description Confidence level. Critical Z Critical values for Z. Lower Lower bound for μ. Upper Upper bound for μ. Two-Sample Z-Interval Menu name Z-int: μ... -
Page 125: One-Proportion Z-Interval
Field Definition name Population 1 standard deviation. σ Population 2 standard deviation. σ Confidence level. Results The results are: Result Description Confidence level. Critical Z Critical values for Z. Lower Lower bound for Δ μ. Upper Upper bound for Δ μ. -
Page 126: Two-Proportion Z-Interval
Result Description Critical Z Critical values for Z. Lower Lower bound for π. Upper Upper bound for π. Two-Proportion Z-Interval Menu name Z-Int: π – π This option uses the Normal Z-distribution to calculate a confidence interval for the difference between the proportions of successes in two populations. -
Page 127: One-Sample T-Interval
One-Sample T-Interval Menu name T-int: 1 μ This option uses the Student’s t-distribution to calculate a confidence interval for μ, the true mean of a population, for the case in which the true population standard deviation, σ, is unknown. Inputs The inputs are: Field Definition... - Page 128 Inputs The inputs are: Field Definition name Sample 1 mean. Sample 2 mean. Sample 1 standard deviation. Sample 2 standard deviation. Sample 1 size. Sample 2 size. Confidence level. Whether or not to pool the samples Pooled based on their standard deviations. Results The results are: Result...
-
Page 129: Parametric App
Parametric app About the Parametric app The Parametric app allows you to explore parametric equations. These are equations in which both x and y are defined as functions of t. They take the forms f t ( ) g t ( ) Getting started with the Parametric app The following example uses the parametric equations x t ( ) - Page 130 Define the 2. Define the expressions. expressions Set angle 3. Set the angle measure to degrees. measure MODES Select Degrees Set up the plot 4. Set up the plot by displaying the graphing options. PLOT SETUP The Plot Setup input form has two fields not included in the Function app, TRNG and TSTEP.
- Page 131 Plot the 6. Plot the expression. expression Explore the 7. Plot a triangle instead of a circle. graph Select Fixed-Step Segments A triangle is displayed rather than a circle (without changing the equation) because the changed value of TSTEP ensures that points being plotted are 120° apart instead of nearly continuous, and selecting Fixed-Step Segments connects the points 120°...
- Page 132 your own table, and the split screen functionality available in the Function app. Parametric app...
-
Page 133: Polar App
Polar app About the Polar app The Polar app allows you to explore polar equations. Polar equations are equations in which r is defined in terms of . They take the form θ f θ ( ) Getting started with the Polar app Open the Polar 1. - Page 134 Set angle 3. Set the angle measure to radians. measure MODES Select Radians Set up the plot 4. Set up the plot. In this example, we will use the default settings, except for the θRNG fields. SETUP PLOT CLEAR >tS π...
- Page 135 Display the 7. Display the table of values for θ and R1 in the Numeric view Numeric view. 8. With a θ-value selected, type in a replacement value and press , and see the table jump to that value. You can also zoom in or zoom out on any θ- value in the table.
- Page 136 Polar app...
-
Page 137: Sequence App
You will, though, have to enter the second term if the HP 39gII is unable to calculate it automatically. Typically if the nth term in the sequence depends on n–2, then you must enter the second term. - Page 138 Open the 1. Open the Sequence app. Sequence app Select Sequence The Sequence app starts in the Symbolic view. Define the 2. Define the Fibonacci sequence, in which each term expression (after the first two) is the sum of the preceding two terms: >...
- Page 139 Plot the 4. Plot the Fibonacci expression sequence. 5. In Plot Setup, set the SEQPLOT option to Cobweb. SETUP PLOT Select Cobweb Display the 6. Display the Numeric view for this example. numeric view 7. With any n-value selected, type in a replacement value, and see the table jump to that value.
- Page 140 Sequence app...
-
Page 141: Finance App
Finance app About the Finance app The Finance app, or Finance Solver, provides you with the ability to solve time-value-of-money (TVM) and amortization problems. These problems can be used for calculations involving compound interest applications as well as amortization tables. Compound interest is the process by which earned interest on a given principal amount is added to the principal at specified compounding periods, and then the... - Page 142 N O T E After you type in a value and press another variable is automatically highlighted. To manually navigate to a desired field, press the arrow keys. Be sure that values are entered for six of the seven TVM variables: N,I%YR,PV,P/YR,PMT,C/YR,and 3.
-
Page 143: Cash Flow Diagrams
Cash flow diagrams TVM transactions can be represented by using cash flow diagrams. A cash flow diagram is a time line divided into equal segments representing the compounding periods. Arrows represent the cash flows, which could be positive (upward arrows) or negative (downward arrows), depending on the point of view of the lender or borrower. -
Page 144: Time Value Of Money (Tvm)
Time value of money (TVM) Time Value of Money (TVM) calculations, as the name implies, make use of the notion that a dollar today will be worth more than a dollar sometime in the future. A dollar today can be invested at a certain interest rate and generate a return that the same dollar in the future cannot. -
Page 145: Performing Tvm Calculations
The future value of the transaction: the amount of the final cash flow or the compounded value of the series of previous cash flows. For a loan, this is the size of the final balloon payment (beyond any regular payment due). For an investment this is the cash value of an investment at the end of the investment period. -
Page 146: Calculating Amortizations
l%YR = 6.5 PV = $150,000 N = 30 x 12 = 360 (for PMT) N = 10 x 12 = 120 (for balloon payment) P/YR = 12; End mode PMT = ? Balloon payment, FV = ? 1. Start the Finance App. Use the arrow keys to highlight P/YR. - Page 147 3. Type and store values for the TVM variables, I%YR, PV, PMT, and FV, which define the payment schedule. 4. Enter the number of payments per amortization period in the GSize field. By default, the group size is 12 to reflect annual amortization. 5.
- Page 148 Finance app...
-
Page 149: Linear Solver App
Linear Solver app will attempt to solve for x and y (and z in three- equation sets). The HP 39gII will alert you if no solution can be found, or if there is an infinite number of solutions. Linear Solver... - Page 150 The Linear Equation Solver opens in the Numeric view. NOTE If the last time you used the Linear Solver app you solved for two equations, the two-equation input form is displayed. To solve a three-equation set, press now the input form displays three equations. Define and solve 2.
- Page 151 Solve a two-by- If the three-equation input two system form is displayed and you want to solve a two- equation set, press NOTE You can enter any expression that resolves to a numerical result, including variables; you can enter the name of a stored variable.
- Page 152 Linear Solver app...
-
Page 153: Triangle Solver App
The HP 39gII will alert you if no solution can be found, or if you have provided insufficient data. If you are determining the properties of a right-angled triangle, a simpler input form is available by pressing the menu key. - Page 154 Set angle Make sure that your angle measure mode is appropriate. measure By default, the app starts in degree mode. If the angle information you have is in radians and your current angle measure mode is degrees, change the mode to degrees before running the solver.
- Page 155 Choose the 4. The Triangle Solver triangle type app offers you two input forms: a general input form and a more specialized form for right triangles. If the general input form is displayed, and you are investigating a right-angled triangle, press to display the simpler input form.
- Page 156 Not enough data If you are using the general input form, you need to specify at least three values for the Triangle Solver to be able to calculate the remaining attributes of the triangle. If you specify less than three, Not enough data appears on the screen.
-
Page 157: The Explorer Apps
The Explorer Apps Linear Explorer App The Linear Explorer app is used to investigate the behavior of the graphs of as the values of a and b change, both by manipulating the graph and seeing the change in the equation, and by manipulating the equation and seeing the change in the graph. -
Page 158: Quadratic Explorer App
see one of the parameters in the equation highlighted. In Equation mode, you change the values of one or more of the parameters in the equation and those changes are reflected in the graph. Press to increase or decrease the value of the selected parameter, >... -
Page 159: Trig Explorer App
It is also possible to have the equation control the graph. Press to enter Equation mode. > < Press to move between parameters and press to change the value of a parameter. The graph of the equation will update in real time as you change the values of the parameters. - Page 160 The button labelled is a toggle between . When chosen, < > control vertical and horizontal translations. For horizontal translations, the F6 menu key controls the magnitude of the increment. By default, the increment is set at . When π 9 ⁄ <...
-
Page 161: Extending Your App Library
Apps are the application environments where you explore different classes of mathematical operations. You can extend the capability of the HP 39gII by adding additional apps to the Apps Library. Adding new apps to the library can be done in a number of ways: Create new apps, based on existing apps, with •... - Page 162 1. Open the Solve app and save it under the new name. Solve T R I A N G L E S 2. Enter the formulas: 3. Decide whether you want the app to operate in Degrees or Radians. Degrees 4.
-
Page 163: Resetting An App
A convenient way to distribute or share problems in class and to turn in homework is to transmit (copy) apps directly from one HP 39gII to another. Transfer of apps between calculators is done with the micro-USB cable that comes with each HP 39gII. -
Page 164: Managing Apps
5. On the receiving unit, open the Apps Library to see the new app. To transmit an app from your PC to an HP 39gII, use the HP 39gII Connectivity Kit. This software application controls the transfer of all data from your PC to your HP 39gII. -
Page 165: Using Mathematical Functions
Using mathematical functions Math functions The HP 39gII contains many mathematical functions. To use a math function, you enter the function onto the command line, and include the function's argument(s) in parentheses after the function name. The most common math functions have their own key (or Shift of a key) on the keyboard. - Page 166 Common logarithm. Also accepts complex numbers. LOG(value) Example: LOG(100) returns 2 Common exponential (antilogarithm). Also accepts complex numbers. 10^value Example: 10^3 returns 1000 Sine, cosine, tangent. Inputs and outputs depend on the current angle format (Degrees, Radians, or Grads). SIN(value) COS(value) TAN(value) Example:...
- Page 167 –1 Arc tangent: tan x. Output range is from –90° to 90° or ATAN –π/2 to π/2. Inputs and outputs depend on the current angle format. Also accepts complex numbers. ATAN(value) Example: ATAN(1) returns 45 (Degrees mode). Square. Also accepts complex numbers. value Example: returns 324...
-
Page 168: The Math Menu
Negation. Also accepts complex numbers. –value Example: -(1+2*i) returns -1-2*i Absolute value. For a complex number, this is ABS(value) ABS((x+y*i)) Example: ABS(–1) returns 1 ABS((1,2)) returns 2.2360679775 The Math menu The Math menu provides access to math functions, units, and physical constants. By default, pressing opens the Math Functions menu. - Page 169 To select a function 1. Press to display the Math menu. The categories appear in alphabetical order. Press to scroll through the categories. To skip directly to a category, type the number (1-9) or letter (A-E) of the category. 2. The list of functions (on the right) applies to the >...
-
Page 170: Math Functions By Category
Math functions by category Syntax Each function’s definition includes its syntax, that is, the exact order and spelling of a function’s name, its delimiters (punctuation), and its arguments. Note that the syntax for a function does not require spaces. Calculus functions This category contains the numerical derivative and integral functions, as well as the Where function (|). -
Page 171: Constants
The constants available from the Math Functions menu are mathematical constants. These are described in this section. The HP 39gII has two other menus of constants: program constants and physical constants. The physical constants are described further on in this chapter, while the program constants are described in the programming chapter. -
Page 172: Distribution
Imaginary value for , the complex number (0,1). 1 – MAXREAL Maximum real number. Internally represented as 9.99999999999 x 10 MAXREAL MINREAL Minimum real number. Internally represented as -499 1x10 MINREAL Internally represented as 3.14159265359. π π Distribution This category contains probability density functions, and both cumulative probability functions and their inverses, for the common probability distributions. - Page 173 normald_icdf Inverse cumulative normal distribution function. Returns the cumulative normal distribution value associated with the lower-tail probability, p, given the mean, μ and standard deviation, σ of a normal distribution. If only a single value (x) is supplied, assumes μ=0 and σ=1. normald_cdf([μ, σ,] p) Example: normald_icdf(0, 1, 0.841344746069) returns 1.
- Page 174 chisquare probability density function. Computes the probability χ density of the distribution at x, given n degrees of χ freedom. chisquare(n, x) Example: chisquare(2, 3.2) returns 0.100948258997. chisquare_cdf Cumulative distribution function. Returns the lower-tail χ probability of the probability density function for the χ...
- Page 175 fisher_icdf Inverse cumulative Fisher distribution function. Returns the value x such that the Fisher lower-tail probability of x, with numerator n and denominator d degrees of freedom, is p. fisher_icdf(n, d, p) Example: fisher_icdf(5, 5, 0. .76748868087) returns 2. poisson Poisson probability mass function.
-
Page 176: Hyperbolic Trigonometry
student_cdf Cumulative student's t distribution function. Returns the lower-tail probability of the student's t probability density function at x, given n degrees of freedom. student_cdf(n, x) Example: student_cdf(3, –3.2) returns 0.0246659214813. student_icdf Inverse cumulative student's t distribution function. Returns the value x such that the student's-t lower-tail probability of x, with n degrees of freedom, is p. -
Page 177: Integer
Natural exponential. This is more accurate than to limitations of the power function. EXP(value) EXPM1 Exponent minus 1 : . This is more accurate than – EXP when x is close to zero. EXPM1(value) LNP1 Natural log plus 1 : ln(x+1). This is more accurate than the natural logarithm function when x is close to zero. - Page 178 ifactor Prime factorization. Returns the prime factorization of the integer a as a product. ifactor(a) Example: ifactor(150) returns ⋅ ⋅ 2 3 5 ifactors Prime factors. Similar to ifactor, but returns a list of the factors of the integer a with their multiplicities. ifactor(a) Example: ifactor(150) returns [2,1,3,1,5,2].
- Page 179 isprime Prime integer test. Returns 1 if the integer a is prime; otherwise, returns 0. isprime(a) Example: isprime(1999) returns 1. ithprime Nth prime. For the integer n, returns the nth prime number less than 10,000. ithprime(n) Example: ithprime(5) returns 1 1. nextprime Next prime.
-
Page 180: List Functions
numer Simplified Numerator. For the integers a and b, returns the numerator of the fraction a/b after simplification. numer(a/b) Example: numer(10/12) returns 5. denom Simplified Denominator. For the integers a and b, returns the denominator of the fraction a/b after simplification. denom(a/b) Example: denom(10/12) returns 6. -
Page 181: Matrix Functions
Matrix functions These functions are for matrix data stored in matrix variables. See the chapter Matrices for details. Polynomial functions Polynomials are products of constants (coefficients) and variables raised to powers (terms). POLYCOEF Polynomial coefficients. Returns the coefficients of the polynomial with the specified roots. -
Page 182: Probability Functions
H I N T The results of POLYROOT will often not be easily seen in Home due to the number of decimal places, especially if they are complex numbers. It is better to store the results of POLYROOT to a matrix. For example, POLYROOT([1,0,0,-8] M1 will store the three complex cube roots of 8 to matrix M1 as... -
Page 183: Real-Number Functions
RANDOM Random number. With no argument, this function returns a random number between zero and one. With one integer argument a, it returns a random integer between 0 and a. With three integer arguments, n, a, and b, returns n random integers between a and b. RANDOM RANDOM(a) RANDOM(n, a, b) - Page 184 → Degrees to radians. Converts value from Degrees angle format to Radians angle format. DEG→RAD(value) Example: DEG→RAD(180) returns 3.14159265359, the value of π. FLOOR Greatest integer less than or equal to value. FLOOR(value) Example: FLOOR(-3.2) returns -4 FNROOT Function root-finder (like the Solve app). Finds the value for the given variable at which expression most nearly evaluates to zero.
- Page 185 Integer part. INT(value) Example: INT(23.2) returns 23 MANT Mantissa (significant digits) of value. MANT(value) Example: MANT(21.2E34) returns 2.12 Maximum. The greater of two values. MAX(value1, value2) Example: MAX(210,25) returns 210 Minimum. The lesser of two values. MIN(value1, value2) Example: MIN(210,25) returns 25 Modulo.
- Page 186 %TOTAL Percent total : (100)y/x. What percentage of x, is y. %TOTAL(x, y) Example: %TOTAL(20,50) returns 250 RAD→DEG Radians to degrees. Converts value from radians to degrees. RAD→DEG (value) Example: RAD→DEG(π) returns 180 ROUND Rounds value to decimal places. Accepts complex numbers.
-
Page 187: Test Functions
XPON Exponent of value. XPON(value) Example: XPON(123.4) returns 2 Test functions The test functions are logical operators that always return either 1 (true) or 0 (false). Less than. Returns 1 if true, 0 if false. < value1<value2 Less than or equal to. Returns 1 if true, 0 if false. ≤... -
Page 188: Trigonometry Functions
Returns 1 if either value1 or value2 is non-zero, otherwise returns 0. value1 OR value2 Exclusive OR. Returns 1 if either value1 or value2—but not both of them—is non-zero, otherwise returns 0. value1 XOR value2 Trigonometry functions The trigonometry functions can also take complex numbers as arguments. -
Page 189: Units And Physical Constants
Units and physical constants When you press , three menus become available: the Math Functions menu (which appears by default) • the Units menu • the Physical Constants menu • The math functions menu is described extensively earlier in this chapter. Units You can attach physical units to any numerical calculation or result. - Page 190 2. Now add 5 inches. > (8 times for _inch) The result is shown as 32.7 cm. If you had wanted the result in inches, then you would have entered the 5 inches first. 3. To continue the example, we divide this result by 4 seconds and convert the result to kilometers per hour.
-
Page 191: Physical Constants
Physical constants There are 29 physical constants you can use in calculations. These constants are grouped into the categories chemistry, physics and quantum mechanics. A list of all these constants can be found in Physical Constants in the Reference Information chapter. To access the menu of physical constants: 1. - Page 192 1. Enter the mass and multiplication. 2. Go to the Physical Constants menu. 3. Select the speed of light. (to select Physics (to select c) >\ 4. Enter the speed of light into the current expression. 5. Square the speed of light and evaluate the expression.
-
Page 193: Lists
Lists Introduction You can do list operations in Home and in programs. A list consists of comma-separated real or complex numbers, expressions, or matrices, all enclosed in braces. A list may, for example, contain a sequence of real numbers such as {1,2,3}. Lists represent a convenient way to group related objects. -
Page 194: The List Editor
Meaning Opens the highlighted list for editing. Deletes the contents of the selected list. Transmits the highlighted list to another HP 39gII. Clears all lists. CLEAR Moves to the end or the beginning of the catalog. The List Editor Press to create or edit a list. - Page 195 List edit keys When you press to create or change a list, the following keys are available to you: Meaning Inserts a new value before the highlighted item. Copies the highlighted list item into the edit line. Toggles between large and small fonts.
-
Page 196: Deleting Lists
3. Press to highlight the element you want to edit. In this example, edit the third element so that it has a value of 5. To insert an element Suppose you wish to insert in a list a new value, 9, in L1(2) in the list L1 shown to the right. -
Page 197: Lists In The Home View
You can send lists to another calculator or a PC just as you can apps, programs, matrices, and notes. To send lists between two HP 39gII calculators: 1. Connect the two HP 39gII calculators with the micro- USB cable provided with the calculators and turn both calculators on. -
Page 198: List Functions
4. Press 5. The transfer will occur immediately. 6. Open the List Catalog on the receiving calculator to see the new list. List functions List functions are found in the Math menu. You can use them in Home, as well as in programs. You can type in the name of the function, or you can copy the name of the... - Page 199 Example: CONCAT({1,2,3},{4}) returns {1,2,3,4}. LIST Creates a new list composed of the first differences of a Δ list, that is, the differences between the sequential elements in the list. The new list has one less element than the original list. The first differences for {x ,...
- Page 200 Example: In Home, generate a series of squares from 23 to 27. ΠLIST Calculates the product of all elements in list. ΠLIST(list) Example: ΠLIST({2,3,4}) returns 24. Returns the position of an element within a list. The element can be a value, a variable, or an expression. If there is more than one instance of the element, the position of the first occurrence is returned.
-
Page 201: Finding Statistical Values For Lists
ΣLIST Calculates the sum of all elements in a list. ΣLIST(list) Example: ΣLIST({2,3,4}) returns 9. SORT Sorts the elements in a list in ascending order. SORT(list) Example: SORT({2,5,3}) returns {2,3,5} Finding statistical values for lists To find values such as the mean, median, maximum, and minimum of a list, use the Statistics 1Var app. - Page 202 3. Start the Statistics 1Var app. Select Statistics 1Var Note: your list values are now in column 1 (D1). 4. Select the column upon which to base the statistical calculations. This is done in the Symbolic view. By default, H1 is defined to use D1, so nothing further remains to be done in the Symbolic view;...
-
Page 203: Matrices
Matrices Introduction You can perform matrix calculations in Home and in programs. The matrix and each row of a matrix appear in brackets, and the elements and rows are separated by commas. For example, the following matrix: 1 2 3 4 5 6 is displayed in the history as: [[1,2,3],[4,5,6]]... -
Page 204: Creating And Storing Matrices
Matrix Editor. You may then return to the Matrix Catalog to send your matrix to another HP 39gII. To open the Matrix catalog, press MATRIX In the Matrix Catalog, a matrix is listed with two dimensions, even if it has only one row. -
Page 205: Working With Matrices
Working with matrices To start the Matrix To edit a matrix, go to the Matrix Catalog, highlight the Editor matrix variable name you wish to use, and press the to enter the Matrix Editor. Matrix Editor keys The following table lists the matrix edit key operations. Meaning Copies the highlighted element to the edit line. - Page 206 To create a matrix 1. Press to open the Matrix Catalog. The MATRIX in the Matrix Editor Matrix catalog lists the 10 matrix variables, M0 to M9. 2. Highlight the matrix variable name you want to use and press . Press first if you want to create a vector.
- Page 207 3. Press to evaluate and display the vector or matrix. Immediately after entering the matrix, you can store it in a variable by pressing matrixname. The matrix variables are M0 through M9. The left screen below shows the matrix [[2.5,729],[16,2]] being stored into M5. The screen on the right shows the vector [66,33,11] being stored into M6.
-
Page 208: Matrix Arithmetic
You can send matrices between calculators just as you matrix can send apps, programs, lists, and notes. 1. Connect the two HP 39gII calculators with the micro- USB cable provided with the calculators and turn both calculators on. 2. Open the Matrix catalog on the sending calculator. - Page 209 3. Add the matrices that you created. To multiply and For division by a scalar, enter the matrix first, then the divide by a scalar operator, then the scalar. For multiplication, the order of the operands does not matter. The matrix and the scalar can be real or complex. For example, to divide the result of the previous example by 2, press the following keys: To multiply two...
-
Page 210: Solving Systems Of Linear Equations
To divide by a For division of a matrix or a vector by a square matrix, square matrix the number of rows of the dividend (or the number of elements, if it is a vector) must equal the number of rows in the divisor. - Page 211 1. Open the Matrix catalog and create a vector. MATRIX 2. Create the vector of the constants in the linear system. 3. Return to the Matrix Catalog. MATRIX In this example, the vector you created is listed as M1. 4. Create a new matrix. 5.
-
Page 212: Matrix Functions And Commands
6. Return to Home and enter the calculation to left-multiply the constants vector by the inverse of the coefficients matrix. –1 The result is a vector of the solutions x = 2, y = 3 and z = –2. An alternative method, is to use the RREF function. Matrix functions and commands About functions Functions can be used in any app or in Home. -
Page 213: Argument Conventions
Argument conventions For row# or column#, supply the number of the row • (counting from the top, starting with 1) or the number of the column (counting from the left, starting with 1). The argument matrix can refer to either a vector or a •... - Page 214 INVERSE Inverts a square matrix (real or complex). INVERSE(matrix) LQ Factorization. Factors an m × n matrix into three matrices: {[[ m × n lowertrapezoidal]],[[ n × n orthogonal]], [[ m × m permutation]]}. LQ(matrix) Least Squares. Displays the minimum norm least squares matrix (or vector).
- Page 215 RREF Reduced-Row Echelon Form. Changes a rectangular matrix to its reduced row-echelon form. RREF(matrix) SCHUR Schur Decomposition. Factors a square matrix into two matrices. If matrix is real, then the result is {[[orthogonal]],[[upper-quasi triangular]]}. If matrix is complex, then the result is {[[unitary]],[[upper-triangular]]}.
- Page 216 Examples Identity Matrix You can create an identity matrix with the IDENMAT function. For example, IDENMAT(2) creates the 2×2 identity matrix [[1,0],[0,1]]. You can also create an identity matrix using the MAKEMAT (make matrix) function. For example, entering J,4,4) creates a 4 × 4 matrix showing the MAKEMAT(I numeral 1 for all elements except zeros on the diagonal.
- Page 217 The reduced row echelon matrix gives the solution to the linear equation in the fourth column. An advantage of using the RREF function is that it will also work with inconsistent matrices resulting from systems of equations which have no solution or infinite solutions.
- Page 218 Matrices...
-
Page 219: Notes And Info
Notes and Info The HP 39gII has text editors for entering notes. There are two text editors: The Notes Editor runs from within the Notes Catalog, • a collection of notes independent of apps. These notes can be sent to another calculator from the Note Catalog. - Page 220 Meaning Opens the selected note for editing. Begins a new note, and asks for a name. Transmits the selected note to another HP 39gII or PC. Deletes the selected note. Deletes all notes in the CLEAR catalog. Notes and Info...
- Page 221 To create a note in 1. In an app, press Info for the Info view and the Info view to start your note. 2. Use the note editing keys and formatting options. These are identical to those found in the Note Editor (see previous section).Your work is automatically saved.
- Page 222 Meaning (Continued) Displays special characters. CHARS To type one, highlight it and press . To copy a character without closing the Chars menu, press Entering alphanumeric characters While in the Note or Info editors, you will want to enter upper-case and lower-case alphabetical characters. The table below describes the various options available for entering these characters Purpose...
- Page 223 4. Move the cursor to the end of the text you wish to format. 5. Press to open the Format menu. The Format menu is a two-column menu. The left column contains a list of categories and the right column lists the formatting options within each category.
- Page 224 Category Options Bullets Level 1 • Level 2 • Level 3 • Style Underline • Font style Strikethrough • Superscript • Subscript • Normal • To import a note You can import a note from the Note Catalog into an app's Info view and vice versa.
- Page 225 To transmit a note You can send notes between calculators just as you can send apps, programs, matrices, and lists. 1. Connect the two HP 39gII calculators with the micro- USB cable provided with the calculators and turn both calculators on.
- Page 226 Notes and Info...
-
Page 227: Variables And Memory Management
Variables and memory management Introduction The HP 39gII has approximately 250Kb of user memory, as well as 80Mb of flash memory.You use the calculator’s memory to store the following objects: copies of apps with specific configurations • new apps that you download •... -
Page 228: Storing And Recalling Variables
You can use the Memory Manager ( ) to MEMORY view the amount of memory available. The catalog views, which are accessible via the Memory Manager, can be used to transfer variables such as lists or matrices between calculators. Storing and recalling variables You can store numbers or expressions from a previous input or result into variables. - Page 229 The following example illustrates the procedure. 1. Perform the calculation for the result you want to store. 2. Highlight the result you wish to store 3. Copy the result to the edit line 4. Store the result The results of a calculation can also be stored directly to a variable.
-
Page 230: The Vars Menu
The Vars menu You use the Vars menu to access all variables in the calculator. There are menu keys for Home, App, and User variables. When you press , the Vars menu opens with the Home variables menu open by default. The Vars menu is organised by category. - Page 231 5. Choose whether to place the variable name or the variable contents on the command line. Press to indicate that you want the – variable’s contents to appear on the command line. Press to indicate that you want the – variable’s name to appear on the command line.
- Page 232 3. Return to the List Catalog to create L2. LIST to select L2 4. Enter data for L2. 5. Press to access Home. 6. Open the variable menu and select L1. a = > 7. Copy it to the command line. 8.
-
Page 233: Home Variables
9. Store the answer in the List catalog L3 variable. Note: you can also type list names directly from the keyboard. Home variables The following table lists the categories of Home variables and the available variable names in each category. It is not possible to store data of one type in a variable of another type. - Page 234 You can qualify the name of any app variable so that it can be accessed from anywhere on the HP 39gII. For example, both the Function app and the Parametric app have an app variable named Xmin. If you are in the...
-
Page 235: Memory Manager
Memory Manager to determine which variables you might delete to free up memory. You can also use the Memory manager to send sets of variables to another HP 39gII or to clone your entire memory to another HP 39gII. Memory manager... - Page 236 Meaning Deletes the contents of all variables of the selected type. Deletes all memory. Example 1. Start the Memory Manager. A list of variable categories is displayed. MEMORY Free memory is displayed in the top right corner and the body of the screen lists each category of variable and the total memory used by the variables of that type.
- Page 237 You can send all the variables of a single type (all lists, variables of a matrices, programs, notes, etc.) from your HP 39gII to another HP 39gII or a PC. To send variables of a single single type type between two HP 39gII calculators: 1.
- Page 238 Variables and memory management...
-
Page 239: Programming
Programming Introduction This chapter describes how to program the HP 39gII. In this chapter you’ll learn about: programming commands • writing functions in programs • using variables in programs • executing programs • debugging programs • creating programs for building custom apps •... - Page 240 specified as the first argument. The default is G0, which always contains the currently displayed screen. Thus, the full syntax for the PIXON command is: PIXON([G,] xposition, yposition [ ,color]); Some built-in commands employ an alternate syntax, whereby function arguments do not appears in parentheses.
-
Page 241: The Program Catalog
Opens the highlighted program for editing. Prompts for a new program name, then opens an empty program. Not displayed if the app program is selected Transmits the highlighted program to another HP 39gII or to a PC. Runs the highlighted program. Programming... -
Page 242: Creating A New Home Program
Deletes all programs. Creating a New Home Program 1. Open the Program catalog and start a new program. PRGM 2. The HP 39gII prompts you for a name. for alpha lock MYPROGRAM A template for your program is automatically created. -
Page 243: The Program Editor
The Program Editor Until you become familiar with the HP 39gII commands, the easiest way to enter commands is to select them from menus. Entering a 1. Position the cursor program where you want the command to go using the navigation keys. - Page 244 Press to bring up CMDS the complete menu of Program Commands. On the left, use highlight a command category, then press > to access the commands in the category. Select the command that you want and press to paste the command into the program.
- Page 245 H I N T Use the Characters menu to enter the quote, ("). Press , highlight the quote character, and press CHARS H I N T For lower-case alpha lock, press: AASA When you are done, press to return to the PRGM Program Catalog or to go to the Home view.
- Page 246 Home. What you see will differ slightly depending on where you started the program. If you start the program from Home, the HP 39gII displays the contents of Ans (Home variable containing the last result), when the program has finished. If you start the program from...
- Page 247 > (switch columns) Select MYPROGRAM While debugging a program, the > indicator at the left of the screen points to the current command. The current value of each local variable is visible at the bottom of the screen. Since there are no local variables in our program, nothing is shown.
-
Page 248: Editing Keys
2. Use the arrow keys to highlight the program you want to edit, and press . The HP 39gII opens the Program Editor. The name of your program appears in the title bar of the display. You can use the following keys to edit your program. - Page 249 Keys Meaning Moves up or down one S= S\ page Moves left or right one <,>, direction keys character. Moves to beginning or S< S> end of line Starts a new line. Deletes the character to the left of the cursor (Backspace) Erases the entire program.
- Page 250 Copy a program You can use the global Copy and Paste commands to or part of a copy part or all of a program. The following steps illustrate the process: program 1. Press to open the Program catalog. PRGM 2. Highlight the program containing the commands you wish to copy and press 3.
-
Page 251: The Hp 39Gii Programming Language
The HP 39gII Programming Language Variables and Variables in an HP 39gII program can be used to store visibility numbers, lists, matrices, graphics objects, and strings. The name of a variable must be a sequence of alphanumeric characters (letters and numbers), starting with a letter. - Page 252 G1. A full list of system variables appears in the chapter titled, Reference Information. Besides these reserved variables, each HP app has its own reserved variables. For more information on these variables, see the section in this chapter Variables and programs.
- Page 253 into the same local variable, this is poor programming practice and should be avoided. Qualifying the The HP39gII system has many system variables with name of a names that are apparently the same. For example, the Function app has a variable named Xmin, but so, too, do variable the Polar, Parametric, Sequence, and Solve apps.
- Page 254 In this section, we will create a small set of programs, each illustrating some aspect of programming on the HP 39gII. Each of these programs will be used as a building block for a custom app described in the next section, App Programs.
- Page 255 Any statements between the end of the RETURN statement and END are ignored. On the Home screen (or in fact, anywhere in the calculator where a number can be used), you can enter ROLLDIE(6) and a random integer between 1 and 6, inclusive will be returned.
- Page 256 MAKELIST(0,X,1,2*sides,1) L2; FOR k FROM 1 TO n DO ROLLDIE(sides)+ROLLDIE(sides) roll; L2(roll)+1 L2(roll); END; END; ROLLDIE(n) BEGIN RETURN 1 + FLOOR(n*RANDOM); END; In this scenario, assume there is no ROLLDIE function exported from another program. Instead, ROLLDIE is visible only in the context of ROLLMANY. Finally, the list of results could be returned as the result of calling ROLLMANY instead of being stored directly into the global list variable, L2.
-
Page 257: App Programs
App programs Apps are a unified collection of views, programs, notes, and associated data. Creating an app program allows you to redefine the app's views and how a user will interact with those views. This is done through two mechanisms: dedicated program functions with special names and redefining the views in the Views menu. - Page 258 A useful procedure for customizing an app is illustrated below: 1. Decide on the HP app that you want to customize. For example, you could customize the Function app or the Statistics 1Var app. The customized app inherits all the properties of the HP app.
- Page 259 could execute a command to start the Statistics 1Var app, and a program associated with the Statistics 1Var app could return to the Function app (or launch any other app). Example: The following example illustrates the process of creating a custom app. This app creates an environment to simulate the rolling of a pair of dice, each with a number of sides specified by the user.
- Page 260 Each app has one program attached to it. Initially, this program is empty. You customize the app by entering functions into that program. 5. Edit the program DiceSimulation. Select DiceSimulation It is here that you enter functions to customize the app.
- Page 261 The program START() DiceSimulation BEGIN DICESIMVARS(); // Empty data columns D1 and D2 {} D1; {} D2; SETSAMPLE(H1,D1); SETFREQ(H1,D2); 0 H1Type; END; VIEWS “Roll Dice”,ROLLMANY() BEGIN LOCAL k,roll; MAKELIST(X+1,X,1,2*SIDES-1,1) D1; MAKELIST(0,X,1,2*SIDES-1,1) D2; FOR k FROM 1 TO ROLLS DO Roll:=ROLLDIE(SIDES)+ROLLDIES(SIDES); D2(roll-1)+1 D2(roll-1);...
- Page 262 IF SIDES<2 THEN MSGBOX("Must be >= 2"); END; UNTIL SIDES>=2; END; // specify num times to roll the dice. VIEWS "Set Rolls",SETROLLS() BEGIN REPEAT INPUT(ROLLS,"Num of Rolls","N = ","Enter num rolls",10); FLOOR(ROLLS) ROLLS; IF ROLLS<1 THEN MSGBOX("You must enter a number >= 1"); END;...
- Page 263 The program above calls two other user programs: ROLLDIE() and DICESIMVARS(). ROLLDIE() appears earlier in this chapter. Here's DICESIMVARS. Store it into a new user program. The program EXPORT ROLLS,SIDES; DICESIMVARS EXPORT DICESIMVARS() BEGIN ROLLS; SIDES; END; Press to see the custom app menu.
-
Page 264: Program Commands
This section contains details on each of the individual commands grouped by category. App commands These commands allow you to launch any HP app, bring up any view of the current app, and change the options in the Views menu. - Page 265 Note that if , this allows starting global views: < HomeScreen:-1 Home Modes:-2 Memory Manager:-3 Apps Library:-4 Matrix Catalog:-5 List Catalog:-6 Program Catalog:-7 Notes Catalog:-8 VIEWS Syntax: VIEWS ("string") Adds a view to the Views menu. These commands are used to select or deselect particular functions for graphing or display in the numeric view DEBUG Syntax: DEBUG ("program name")
-
Page 266: Branch Commands
When assigning a value to a cell in a list, vector, or matrix, use the command rather than :=. For example, the command 73 L1(5) will put the number 73 into the 5th position of list L1. If you are entering a program using a calculator emulator running on a computer, then =>... - Page 267 commands2. Continue evaluating tests until a true is found. If no true test is found, execute commandsD, if provided. Example: CASE THEN RETURN "negative"; END < THEN RETURN "small"; END < DEFAULT RETURN "large"; END; Drawing There are 10 graphic variables in the HP39gII, called G0 Commands to G9.
- Page 268 Sets the color of the pixel of G with coordinates x,y to white. G can be any of the graphic variables and is optional. The default is G0, the current graphic GETPIX and GETPIX_P Syntax: GETPIX([G], xposition, yposition) GETPIX_P([G], xposition, yposition) Returns the color of the pixel of G with coordinates x,y.
- Page 269 EXPORT BOX() BEGIN RECT(); RECT_P(40,90,0); FREEZE; The program below also uses the RECT_P command. In this case, the pair of arguments 0 and 3 correspond to x2 and y2. The program produces the figure below to the right. EXPORT BOX() BEGIN RECT();INVERT(G0);...
- Page 270 Draws an arc or circle on G, centered on point x,y, with radius r and color c starting at angle a1 and ending on angle a2. G can be any of the graphic variables and is optional. The default is G0 r is given in pixels.
- Page 271 c2 can be 0 to 3 (0=black, 1= dark gray, 2= light gray, 3= white). c2 is optional. If not specified the background is not erased. Example: This program displays the successive approximations for using the series for the arctangent(1). EXPORT RUNPISERIES() BEGIN LOCAL sign;...
- Page 272 Copies the region of srcGRB between point sx1, sy1 and sx2, sy2 into the region of trgtGRB between points dx1, dy1 and dx2, dy2. Do not copy pixels from srcGRB that are color c. trgtGRB can be any of the graphic variables. trgtGRB can be any of the graphic variables and is optional.
- Page 273 You can enter hexadecimal number using the 0xdigits syntax. The first pixel of the line is defined by the 2 lest significant bit of the number. The 2nd pixel by the 2 lest significant bit, etc. SUBGROB and Syntax: SUBGROB(srcGRB [ ,x1, y1, x2, y2], trgtGRB) SUBGROB_P SUBGROB_P(srcGRB [ ,x1, y1, x2, y2], trgtGRB) Sets trgtGRB to be a copy of the area of srcGRB between...
- Page 274 I/O Commands This section describes commands for inputting data into a program, and for outputting data from a program. These commands allow users to interact with programs. These commands start the Matrix and List editors. EDITLIST Syntax: EDITLIST(listvar) Starts the list editor, loading listvar. Example: EDITLIST(L1) edits list L1.
- Page 275 combination (press and hold , then press , then release both keys). Pressing stops the interaction with the terminal. There are also commands for outputting data in the Graphics section. In particular, the commands TEXTOUT and TEXTOUT_P can be used for test output. This example prompts the user to enter a value for the radius of a circle, and prints the area of the circle on the terminal.
- Page 276 ISKEYDOWN Syntax: ISKEYDOWN(key_id); Returns true (non-zero) if the key whose key_id is provided is currently pressed, and false (0) if it is not. MSGBOX Syntax: MSGBOX(expression or string [ ,ok_cancel?]); Displays a message box with the value of the given expression or string.
- Page 277 Replace the PRINT command in the previous example with the MSGBOX command to: EXPORT AREACALC() BEGIN LOCAL radius; INPUT(radius, "Radius of Circle",:"r = ","Enter radius",1); π MSGBOX("The area is " + *radius^2); END; If the user enters 10 for the radius, the message box shows this: CHOOSE...
-
Page 278: Loop Commands
causes the name of the selected person will be printed to the terminal. Loop commands FOR…FROM…TO… DO…END Syntax: FOR var FROM start TO finish [STEP increment] DO commands END; Sets variable var to start, and for as long as this variable's value is less than or equal to finish, executes the sequence of commands, and then adds 1 (increment) to var. - Page 279 EXPORT DRAWPATTERN() BEGIN LOCAL xinc,yinc,color; STARTAPP("Function"); RECT(); xincr := (Xmax - Xmin)/254; yincr := (Ymax - Ymin)/110; FOR X FROM Xmin TO Xmax STEP xincr DO FOR Y FROM Ymin TO Ymax STEP yincr DO color := FLOOR(X^2+Y^2) MOD 4; PIXON(X,Y,color);...
- Page 280 Evaluate test. If result is true (non 0), executes the commands, and repeat. Example: A perfect number is one that is equal to the sum of all its proper divisors. For example, 6 is a perfect number because 6 = 1+2+3. This function returns true when its argument is a perfect number.
- Page 281 BREAK Syntax: BREAK Exits from a loop. Execution picks up with the first statement after the loop. CONTINUE Syntax: CONTINUE Transfer execution to the start of the next iteration of a loop. Matrix Some matrix commands take as argument the matrix Commands variable name on which the command is applied.
- Page 282 matrix that was edited, EDITMAT cannot be used as an argument to other matrix commands. RANDMAT Syntax: RANDMAT (name, rows, columns) Creates random matrix with a specified number of rows and columns and stores the result in name (name must be M0...M9).
- Page 283 String A string is a sequence of characters enclosed in double commands quotes (""). To put a double quote in a string, use two consecutive double quotes. The \ character starts an "escape" sequence, and the character(s) immediately following are interpreted specially. \n inserts a new line, two backslashes insert a single backslash.
- Page 284 program, if variables a and b are not declared and X is 90, then expr("2X+a+b") returns 180+a+b. When used in tandem with other functionality built-in to the HP39gII, the expr command can be used in powerful ways. For example, you could build functions up out of strings and export these functions so they can be used throughout the calculator.
- Page 285 left Syntax: left(str,n) Return the first n characters of string str. If ≥ n dim str , returns str. If n == 0 returns the empty string. < Example: left("MOMOGUMBO",3) returns "MOM" right Syntax: right(str,n) Returns the last n characters of string str. If n <= 0, returns empty string.
- Page 286 Relational expressions Equality. Syntax: object1 == object2 Example: 3+1== 4 returns 1. < Less than. Syntax: object1 < object2 Example: 3+1 < 4 returns 0. (or < =) Less than or equal to. Syntax: object1 object2 Example: 3+1 4 returns 1. >...
-
Page 287: Variables And Programs
Makes the variables var1, var2, etc. local to the program in which they are found. Variables and Programs The HP 39gII has three types of variables: Home variables, App variables, and User variables. You use the Variable menu ( ) to retrieve Home, app, or User variables. - Page 288 User variables are variables exported from a user program. They provide one of several mechanisms to allow programs to communicate with the rest of the calculator, or with other programs. Once a variable has been exported from a program, it will appear among the User variables in the Vars menu, next to the program that exported it.
- Page 289 GridDots Turns the background dot grid in Plot view on or off. From Plot setup, check (or uncheck) GRID DOTS. Or, in a program, type: GridDots—to turn the grid dots on (default). GridDots—to turn the grid dots off. GridLines Turns the background line grid in Plot view on or off. From Plot setup, check (or uncheck) GRID LINES.
- Page 290 Or, in a program, type: Labels—to turn labels on. Labels—to turn labels off (default). Nmin/Nmax Defines the minimum and maximum independent variable Sequence values. Appears as the NRNG fields in the Plot Setup input form. From Plot Setup, enter values for NRNG. Or, in a program, type: Nmin Nmax...
- Page 291 Appears as the RNG field in the Plot Setup input form. From Plot Setup, enter values for RNG. Or, in a program, type: θ θ where < θ step Sets the step size for the independent variable. Polar From Plot Setup, enter a value for STEP. Or, in a program, type: θ...
- Page 292 Or, in a program, type Tstep where > Xcross Sets the horizontal coordinate of the crosshairs. Only works with TRACE off ( ). From the Plot view, use the cursor keys to move to the desired x-value. Or, in a program, type: Xcross Ycross Sets the vertical coordinate of the crosshairs.
- Page 293 Ymin/Ymax Sets the minimum and maximum vertical values of the plot screen. Appears as the YRNG fields (vertical range) in the Plot Setup input form. From Plot Setup, enter the values for YRNG. Or, in a program, type: Ymin Ymax where <...
- Page 294 μ < μ AltHyp—for μ > μ AltHyp—for μ ≠ μ AltHyp—for E0...E9 Solve Can contain any equation or expression. Independent variable is selected by highlighting it in Numeric View. Example: X+Y*X-2=Y E1 F0...F9 Can contain any expression. Independent variable is X. Function Example: SIN(X) F1...
- Page 295 Method Determines whether the Inference app is set to calculate Inference hypothesis test results or confidence intervals. Or, in a program, type: Method—for Hypothesis Test Method—for Confidence Interval R0...R9 Polar Can contain any expression. Independent variable is θ Example: θ 2*SIN(2* ) R1 S1Type...S5Type Statistics 2Var...
- Page 296 Or, in a program, store the constant number from the list below into the variable Type. With Method=0, the constant values and their meanings are as follows: μ 0 Z-Test:1 μ μ – 1 Z-Test: π 2 Z-Test:1 π π –...
- Page 297 Numeric view variables C0...C9 Statistics 2Var C0 through C9, for columns of data. Can contain lists. Enter data in the Numeric view Or, in a program, type: LIST where , 1, 2, 3 ... 9 and LIST is either a list or the name of a list.
- Page 298 Or, in a program, type: LIST NumIndep List can be either a list itself or the name of a list. NumRow Function Sets the row to be highlighted in the Numeric view. Use Parametric the cursor keys to select a row in the Numeric view. Polar Or, in a program, type: Sequence...
- Page 299 Inference app The following variables are used by the Inference app. variables They correspond to fields in the Inference app Numeric view. The set of variables shown in this view depends on the hypothesis test or the confidence interval selected in the Symbolic view.
- Page 300 Or, in a program, type: μ0 where 0 μ0 1 < < Sets the size of the sample for a hypothesis test or confidence interval. For a test or interval involving the difference of two means or two proportions, sets the size of the first sample.
- Page 301 Or, in a program, type: For a test or interval involving the difference of two means or two proportions, sets the sample standard deviation of the second sample. From the Numeric view, set the value of s2. Or, in a program, type: Sets the population standard deviation for a hypothesis σ1 test or confidence interval.
- Page 302 Finance app The following variables are used by the Finance app. variables They correspond to the fields in the Finance app Numeric view. CPYR Compounding periods per year. Sets the number of compounding periods per year for a cash flow calculation.
- Page 303 Or, in a program, type: NbPmt where > Payment value. Sets the value of each payment in a cash flow. From the Numeric view of the Finance app, enter a value for PMT. Or, in a program, type: Note: payment values are negative if you are making the payment and positive if you are receiving the payment.
- Page 304 Solver app, enter the coefficients and constants of the linear system. Or, in a program, type: matrix LSystem where matrix is either a matrix or the name of one of the matrix variables M0-M9. Size Contains the size of the linear system. From the Numeric view of the Linear Solver app, press Or, from a program, type: 2 Size—for a 2x2 linear system...
- Page 305 AngleA The measure of angle A. Sets the measure of angle A. The value of this variable will be interpreted according to the angle mode setting (Degrees or Radians). From the Triangle Solver Numeric view, enter a positive value for A. Or, in a program, type: AngleA where...
- Page 306 AAngle Sets the angle mode. From Modes view, choose System, Degrees, or Radians for angle measure. System (default) will force the angle measure to agree with that in Modes. In the Statistics app, you can set this from Symbolic Setup as well.
- Page 307 Results These variables are found in various views. They capture variables the results of calculations such as those performed when menu key is pressed in the Statistics 1Var Numeric view. The following results variables store calculations from the Function app. They store results from the commands in the Plot view FCN menu.
- Page 308 Contains the value of the third quartile in the current 1- variable analysis (H1-H5). Contains the maximum value in the current 1-variable analysis (H1-H5). Contains the sum of the data set in the current 1-variable ΣX analysis (H1-H5). Contains the sum of the squares of the data set in the ΣX current 1-variable analysis (H1-H5).
- Page 309 MeanX Contains the mean of the independent values (X) of the current 2-variable statistical analysis (S1-S5). Contains the sum of the independent values (X) of the ΣX current 2-variable statistical analysis (S1-S5). Contains the sum of the squares of the independent values ΣX (X) of the current 2-variable statistical analysis (S1-S5).
-
Page 310: App Functions
Contains the value of the experimental variable associated with the TestScore. App Functions App functions are used by several of the HP Apps to perform common calculations. For example, in the Function app, the Plot view FCN menu has a function called SLOPE that calculates the slope of a given function at a given point. - Page 311 AREA(Fn, [Fm,] lower, upper) Example: -2, -2, 1) returns 4.5 AREA(-X, X EXTREMUM Extremum of a function. Finds the extremum (if one exists) of the function Fn that is closest to the X-value guess. EXTREMUM(Fn, guess) Example: -X-2, 0) returns 0.5 EXTREMUM(X ISECT Intersection of two functions.
- Page 312 SOLVE(En, var, guess) Example: -X-2, X, 3) returns 2 SOLVE(X This function also returns an integer that is indicative of the type of solution found, as follows: 0—an exact solution was found 1—an approximate solution was found 2—an extremum was found that is as close to a solution as possible 3—neither a solution, an approximation, nor an extremum was found...
- Page 313 SETSAMPLE Set sample data. Sets the sample data for one of the statistical analyses (H1-H5) defined in the Symbolic view of the Statistics 1Var app. Sets the data column to one of the column variables D0-D9 for one of the statistical analyses H1-H5.
- Page 314 DoInference Calculate confidence interval or test hypothesis. Performs the same calculations as pressing in the Inference app's Numeric view and stores the results in the appropriate Inference app results variables. DoInference() Sequence app The Sequence app has a single function for defining a functions sequence and storing it into one of the Sequence app Symbolic variables U0-U9.
- Page 315 Linear Solver The Linear Solver app has a single function that solves a app functions 2x2 or 3x3 linear system, based on a matrix of coefficients and constants. LinSolve Solve linear system. Solves the 2x2 or 3x3 linear system represented by matrix. LinSolve(matrix) Examples: LinSolve([[A, B, C], [D, E,F]]) solves the linear...
- Page 316 In the indeterminate case AAS where two solutions may be possible, AAS may return a list of two such lists containing both results. Common app In addition to the app functions specific to each app, functions there are two functions common to the following apps: Function •...
- Page 317 UNCHECK Unchecks the Symbolic view variable Symbn. UNCHECK(Symbn) Example: UNCHECK(R1) unchecks the Polar app Symbolic view variable R1. The result is that R1(θ) is not drawn in the Plot view and does not appear in the Numeric view of the Polar app.
- Page 318 Programming...
-
Page 319: Glossary
Reference information Glossary A small application, designed to study one or more related topics or to solve problems of a particular type. The built-in apps are Function, Solve, Statistics 1Var, Statistics 2Var, Inference, Parametric, Polar, Sequence, Finance, Linear Solver, Triangle Solver, Linear Explorer, Quadratic Explorer, and Trig Explorer. - Page 320 list A set of values separated by commas and enclosed in braces. Lists are commonly used to enter statistical data and to evaluate a function with multiple values. Created and manipulated by the List editor and catalog. matrix A two-dimensional array of values separated by commas and enclosed in nested brackets.
-
Page 321: Resetting The Hp 39Gii
2. Release all keys in the reverse order. If the calculator does not turn on If the HP 39gII does not turn on, follow the steps below until the calculator turns on. You may find that the calculator turns on before you have completed the procedure. -
Page 322: Batteries
4. Remove the batteries, press and hold for 10 seconds, then put the batteries back in and press Batteries The calculator takes 4 AAA (LR03) batteries as a main power source. To install batteries Warning: When the battery annunciator indicates that the batteries are low, you need to replace the batteries as soon as possible. -
Page 323: Operating Details
Warning! There is danger of explosion if the battery is incorrectly replaced. Replace only with the same or equivalent type recommended by the manufacturer. Dispose of used batteries according to the manufacturer's instructions. Do not mutilate, puncture, or dispose of batteries in fire. -
Page 324: App Variables
Category Available names (Continued) Modes HAngle HDigits HFormat HComplex Language Program Function Solve Statistics 1Var Statistics 2Var Inference Parametric Polar Sequence Finance Linear Solver Triangle Solver User-named programs Real A...Z, θ App variables Function app variables The Function app variables are: Category Available names Results... -
Page 325: Solve App Variables
Category Available names (Continued) Numeric NumStart NumType NumStep NumZoom Modes AAngle ADigits AComplex AFormat Solve app variables The Solve app variables are: Category Available names Symbolic Plot Axes Xmax Cursor Xmin GridDots Xtick GridLines Xzoom Labels Ymax Method Ymin Recenter Ytick Tracing Yzoom... -
Page 326: Statistics 2Var App Variables
Category Available names (Continued) Symbolic H1Type H2Type H3Type H4Type H5Type Plot Axes Xmax Cursor Xmin GridDots Xtick GridLines Xzoom Labels Ymax Method Ymin Recenter Ytick Tracing Yzoom Numeric Modes AAngle ADigits AComplex AFormat Statistics 2Var app variables The Statistics 2Var app variables are: Category Available names Results... -
Page 327: Inference App Variables
Category Available names (Continued) Plot Axes Xmax Cursor Xmin GridDots Xtick GridLines Xzoom Labels Ymax Method Ymin Recenter Ytick Tracing Yzoom Numeric Modes AAngle ADigits AComplex AFormat Inference app variables The Inference app variables are: Category Available names Results Result CritScore TestScore CritVal1... -
Page 328: Parametric App Variables
Parametric app variables The Parametric app variables are: Category Available names Symbolic Plot Axes Xmax Cursor Xmin GridDots Xtick GridLines Xzoom Labels Ymax Method Ymin Recenter Ytick Tracing Yzoom Numeric NumStart NumType NumStep NumZoom Modes AAngle ADigits AComplex AFormat Polar app variables The Polar app variables are: Category Available names... -
Page 329: Sequence App Variables
Category Available names (Continued) Plot Axes Xmax Cursor Xmin GridDots Xtick GridLines Xzoom Labels Ymax Method Ymin Recenter Ytick Tracing Yzoom Numeric NumStart NumType NumStep NumZoom Modes AAngle ADigits AComplex AFormat Sequence app variables The Sequence app variables are: Category Available names Symbolic Plot... -
Page 330: Finance App Variables
Finance app variables The Finance app variables are: Category Available names Numeric CPYR NbPmt PPYR GSize IPYR Linear Solver app variables The Linear solver app variables are: Category Available names Results LSolution Numeric LSystem Size Modes AAngle ADigits AComplex AFormat Triangle Solver app variables The Triangle solver app variables are: Category... -
Page 331: Linear Explorer App Variables
Linear Explorer app variables The Linear Explorer app variables are: Category Available names Modes AAngle ADigits AComplex AFormat Quadratic Explorer app variables The Quadratic Explorer app variables are: Category Available names Modes AAngle ADigits AComplex AFormat Trig Explorer app variables The Trig Explorer app variables are: Category Available names... -
Page 332: Functions And Commands
Functions and Commands Math menu functions The Math menu functions are: Category Available functions Calculus ∂ ∫ | (Where) Complex CONJ Constant MAXREAL MINREAL π Distribution normald fisher normald_cdf fisher_cdf normald_icdf fisher_icdf binomial poisson binomial_cdf poisson_cdf binomial_icdf poisson_icdf chisquare student chisquare_cdf student_cdf chisquare_icdf... - Page 333 Category Available functions (Continued) Loop ITERATE Σ Matrix COLNORM COND RANK CROSS ROWNORM RREF SCHUR EIGENVAL SIZE EIGENVV SPECNORM IDENMAT SPECRAD INVERSE TRACE MAKEMAT Polynom. POLYCOEF POLYROOT POLYEVAL Prob. COMB UTPC UTPF PERM UTPN RANDOM UTPT Real CEILING DEG→RAD FLOOR FNROOT %CHANGE FRAC...
-
Page 334: App Functions
Category Available functions (Continued) Trig ACOT ACSC ASEC App functions The app functions are: Category Available functions Function AREA(Fn,[Fm,]lower,upper) EXTREMUM(Fn,guess) ISECT(Fn,Fm,guess) ROOT(Fn,guess) SLOPE(Fn,value) Solve SOLVE(En,var,guess) Statistics Do1VStats(Hn) 1Var SETFREQ(Hn,Dn) or SETFREQ(Hn,value) SETSAMPLE(Hn,Dn) Statistics Do2VStats(Sn) 2Var PredX(value) PredY(value) SetDepend(Sn,Cn) SetIndep(Sn,Cn) Inference DoInference() Sequence RECURSE(Un,nthterm[,term1,... -
Page 335: Program Commands
Program commands The Program commands are: Category Available functions CHECK STARTVIEW UNCHECK VIEWS STARTAPP Block BEGIN RETURN Branch THEN CASE ELSE IFERR Drawing PIXON TEXTOUT PIXON_P TEXTOUT_P PIXOFF BLIT PIXOFF_P BLIT_P GETPIX DIMGROB GETPIX_P DIMGROB_P RECT SUBGRB RECT_P SUBGROB_P INVERT FREEZE INVERT_P GROBH... -
Page 336: Constants
Constants Program constants The Program constants are: Category Available names Angle Degrees Radians H1Type...H5Type Hist BoxW NormalProb LineP BarP ParetoP Format Standard Fixed SeqPlot Cobweb Stairstep S1Type...S5Type Linear Logistic LogFit QuadFit ExpFit Cubic Power Quartic Inverse Trig Exponent User Stat1VPlot Hist BoxW NormalProb... -
Page 337: Physical Constants
Physical Constants The Physical constants are: Category Available names Chemistry Avogadro NA Boltmann, k molar volume, Vm universal gas, R standard temperature, StdT standard pressure, StdP Phyics Stefan-Boltzmann, σ speed of light, c permittivity, Σ permeability, μ acceleration of gravity, g gravitation, G Quantum Planck, h... - Page 338 Message Meaning (Continued) Infinity error Math exception, such as 1/0. Insufficient You must recover some memory Memory to continue operation. Delete one or more matrices, lists, notes, or programs (using catalogs), or custom (not built- in) apps (using MEMORY Insufficient Not enough data points for the Statistics Data calculation.
- Page 339 Message Meaning (Continued) Receive Error Problem with data reception from another calculator. Re- send the data. Too Few The command requires more Arguments arguments than you supplied. Undefined Name The global variable named does not exist. Undefined Result The calculation has a mathematically undefined result (such as 0/0).
- Page 340 Reference information...
-
Page 341: Appendix: Product Regulatory Information
Appendix: Product Regulatory Information Federal Communications Commission Notice This equipment has been tested and found to comply with the limits for a Class B digital device, pursuant to Part 15 of the FCC Rules. These limits are designed to provide reasonable protection against harmful interference in a residential installation. - Page 342 For questions regarding this FCC declaration, write to: Hewlett-Packard Company P.O. Box 692000, Mail Stop 510101 Houston, TX 77269- 2000 or call HP at 281-514-3333 To identify your product, refer to the part, series, or model number located on the product.
-
Page 343: European Union Regulatory Notice
European standards (European Norms) that are listed in the EU Declaration of Confor- mity issued by HP for this product or product family and available (in English only) either within the product docu- mentation or at the following web site: www.hp.eu/cer- tificates (type the product number in the search field). -
Page 344: Japanese Notice
Japanese Notice Korean Class Notice Disposal of Waste Equipment by Users in This symbol on the product or on its Private Household in packaging indicates that this product must the European Union not be disposed of with your other household waste. Instead, it is your responsibility to dispose of your waste equipment by handing it over to a designated collection point for the... - Page 345 Chemical Substances HP is committed to providing our customers with informa- tion about the chemical substances in our products as needed to comply with legal requirements such as REACH (Regulation EC No 1907/2006 of the European Parliament and the Council). A chemical information report for this product can be found at: http://www.hp.com/go/reach...
- Page 346 Product Regulatory Information...
- Page 347 Special views definition of Symbolic setup deleting Symbolic view Explorer arc cosine Finance arc sine Function arc tangent functions area HP Apps between curves Inference arguments library conventions Linear Solver auto scale Parametric axes Polar options 32, 33 resetting...
- Page 348 covariance critical value(s) displayed calculus functions canceling operations catalogs and editors data set definition 74, 84 clearing debugging programs an app decimal display history scaling 40, 42 edit line decreasing display contrast clone define your own fit memory definite integral cobweb graph definition of coefficient of determination...
- Page 349 notes analyze with FCN tools programs area editors definition of Eigen values entering Eigen vectors extremum element intersection point storing Math menu equations slope definition of tracing solving exclusive OR (XOR) glossary Explorer apps graph exponent auto scale axes minus 1 raising to box-and-whisker exponential...
- Page 350 history setting Modes clearing the display insufficient memory Home insufficient statistics data evaluating expressions integer functions 167–170 variables integer scaling 217, 313 40, 42 variables categories integral Home view definite calculating in invalid display dimension horizontal zoom statistics data 36, 38 hyperbolic trig syntax 166–167...
- Page 351 commands 271–272 storing elements condition number storing one element create identity syntax creating variables deleting logarithm deleting columns logarithmic deleting rows determinant functions displaying logical operators displaying matrix elements 177–178 loop commands 268–271 loop functions dividing by a square matrix low battery lower case letters dot product...
- Page 352 modes power angle measure on/cancel complex One-Proportion Z-Interval font size One-Proportion Z-Test language One-Sample T-Interval number format One-Sample T-Test textbook display One-Sample Z-Interval Modes app variables One-Sample Z-Test multiplication order of precedence name conflict π natural exponential Parametric app 155, 167 natural log plus 1 define the expression natural logarithm...
- Page 353 stairsteps statistical data scale one-variable scaling two-variable automatic t values decimal tickmarks integer 37, 40, 42 tracing options trigonometric scaling trigonometric Plot view app variables 278–283 scientific notation plot-detail scientific number format simultaneous views scrolling splitting into plot and zoom move between relations in Trace mode Polar app...
- Page 354 Statistics 1Var summary data set definition storing deleting data a value in Home view editing data list element histogram matrix elements subtract range width Symbolic setup inserting data Symbolic view plot types syntax of functions saving data sorting data table Statistics 1Var app variables automatic Results...
- Page 355 Two-Sample Z-Test views definition of undefined name warning symbol result Where command (|) units and physical constants Upper-Tail Chi-Square probability Z-Intervals 113–116 zoom Upper-Tail Normal Probability examples of in Numeric view Upper-Tail Snedecor’s F probabil- options set factors Upper-Tail Student’s t-probability X zoom Y-zoom USB connectivity...
Need help?
Do you have a question about the 39gII and is the answer not in the manual?
Questions and answers