Table of Contents
Advertisement
Quick Links
Advertisement
Table of Contents

Related Manuals for Amprobe PQ55A


Summary of Contents for Amprobe PQ55A
- Page 1 PQ55A Power Analyzer User Manual...
- Page 2 PQ55A Power Analyzer December 2007 © 2007 Amprobe Test Tools All rights reserved...
- Page 3 During the warranty period any defective test tool can be returned to your Amprobe® Test Tools distributor for an exchange for the same or like prod- uct. Please check the “Where to Buy” section on www.amprobe.com for a list of distributors near you.
-
Page 4: Table Of Contents
PQ55A Power Analyzer Contents Introduction/ Contents ........................4 Safety Information .........................5 Appropriate Usage ........................5 Transport and Storage ........................5 Power Supply ..........................6 Operation Elements and Connections ..................6 Casing bottom ........................8 Display ............................8 General information ........................11 Carrying out Measuremetns ......................11 Connection Power Supply .....................11 Single-phase Power Measurement –... -
Page 5: Measurement Functions
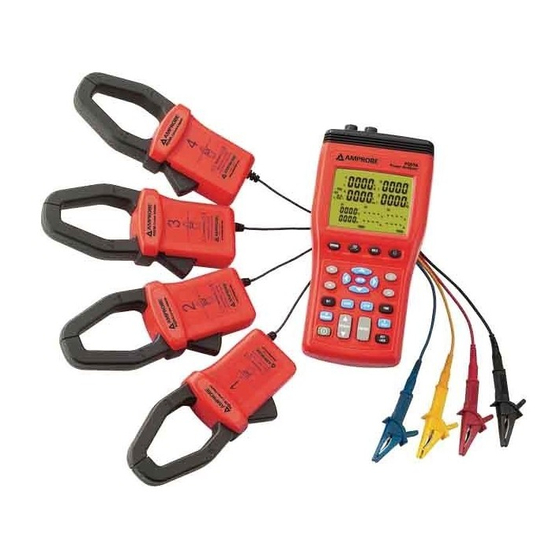
Failure to read the users manual or to comply with the warnings and references contained herein can result in serious bodily injury or instrument damage. Introduction/ Contents The Amprobe PQ55A Power Analyzer is a portable measurement instrument for power measurements within public mains supplies. The power measuring device is characterized by the following features: Characteristics •... -
Page 6: Safety Information
� � Safety Information • The respective accident prevention regulations established by the professional associations for electrical systems and equipment must be strictly met at all times. • The instrument may only be connected to input voltage as indicated on the back decal. -
Page 7: Power Supply
Never use the batteries and the mains adapter simultaneously as the batteries will warm up and can explode. � Only the mains adapter shipped with the PQ55A may be connected and used. Operation Elements and Connections Side view – connecting fields Connections for voltage measurement (U1, U2, U3, N) •... - Page 8 Lateral connection for electric power supply. The instrument may only be connected to the mains adapter shipped with the PQ55A or a mains adapter complying with the data defined within the specification section. Lateral optically isolated connection for the RS-232 interface LCD (liquid crystal display) Key for type of connection.
-
Page 9: Casing Bottom
Measurement data memory - Key to save individual measure- ment data. ☞ After selecting the display of measurement data, the symbol [R] is displayed. The navigation keys 5 and 6 are used to select and display the measurement values, starting with the first storage place. - Page 10 The multi-function display contains the currently measured primary quantities. The display format and the units (V, kV, A, kA, W, kW, MW etc...) are automati- cally displayed in compliance with the selected values. The following symbols and values are displayed: Auto-power-off function is activated P1 Display of the active power on phase 1 P2 Display of the active power on phase 2...
-
Page 11: Installing The Batteries
5.25 display value for voltage or date 5.26 U2 or U23 display of voltage on phase 2 (U2) or the conductor voltage U23 5.27 D-h display for day (D) and hour (h) 5.28 display value for voltage or date/ time 5.29 <-123 or 123->... -
Page 12: General Information
General information � The safety references must be followed. ☞ The respective accident prevention regulations established by the professional associations for electrical systems and equipment must be strictly met at all times. Carrying out Measurements Connection Power Supply � The respective accident prevention regulations established by the professional associations for electrical systems and equipment must be strictly met at all times. -
Page 13: Single-Phase Power Measurement - Type Of Connection 1P2W
Single-phase Power Measurement – Type of connection 1P2W 1) Switch on the instrument. Select the type of connection 1P2W using the “Wiring” function key (6). After selection, the following display is indicated with the symbol 1P2W (5.11): Display type of connection 1P2W 3) The measurement inputs are connected as illustrated in the following drawing: black CURRENT PROBE... - Page 14 4) If required, connect the clamp adapter 4 in the same way to the protective earth. The current measurement values are indicated on the display. The following additional measurement values can be selected subsequently and indicated on the additional display (5.13): To display the mains frequency, press the “Hz“...
-
Page 15: Two-Phase Power Measurement - Type Of Connection 1P3W
Two-phase Power Measurement – Type of Connection 1P3W 1) Switch on the instrument. Select the type of connection 1P3W using the “Wiring” function key (6). After selection, the following display is indicated with the symbol 1P3W (5.11): Display Type of connection 1P3W 3) The measurement inputs are connected as illustrated in the following drawing: black yellow... - Page 16 ☞ Make sure that the clamp completely surrounds the conductor and that there is no air gap. 5) Connect in the same way clamp adapter 2 to the phase L2. 6) If required, connect the clamp adapter 4 in the same way to the protective earth. The current measurement values are displayed on the screen.
-
Page 17: Three-Phase Power Measurement, Aron Connection - Type Of Connection 3P3W2M
Three-phase Power Measurement, Aron connection – type of connection 3P3W2M 1) Switch on the instrument. Select the type of connection 3P3W2M using the “Wiring” function key (6). After selection, the following display is indicated with the sym- bol 3P3W2M (5.11): Display Type of connection 3P3W2M 3) The measurement inputs are connected as illustrated in the following drawing: black... - Page 18 ☞ Make sure that the clamp completely surrounds the conductor and that there is no air gap. 5) Connect in the same way clamp adapter 2 to the phase L3. Press the “POWER” key to switch between the measurement values of Phase L1, Phase and L2, and the total value.
-
Page 19: Three-Phase Power Measurement, Star Connection - Type Of Connection 3P4W
Three-phase Power Measurement, Star connection – type of connection 3P4W 1) Switch on the instrument. Select the type of connection 3P4W using the “Wiring” function key (6). After selection, the following display is indicated with the symbol 3P4W (5.11): Display Type of connection 3P4W The measurement inputs are con nected as illustrated in the following drawing:... - Page 20 Press the “POWER” key to switch between the measurement values of Phase L1, Phase L2 and Phase 3 and the total value. The respectively dis- played value can be assigned by means of the suffix 1, 2, 3, or t (5.2.). The following additional measurement values can be selected subsequently and indicated on the additional display (5.13): To display the mains frequency, press the “Hz“...
-
Page 21: Single-Phase Current Measurement
Single-phase Current Measurement 1) Switch on the instrument. Select the type of connection 1P2W using the “Wiring” function key (6). After selection, the following display is indicated with the symbol 1P2W (5.11): Display Type of connection 1P2W The measurement inputs are connected as illustrated in the following drawing: Type of connection current measurement L1: phase 1 L2: phase 2... -
Page 22: Data Memory - Saving Individual Measurements
Data Memory – Saving individual measurements This functions allows saving maximum 99 individual measurements. A) Saving measurements 1) Switch on the instrument 2) Perform the measurement Save the desired measurement pressing the “M/MEMORY” key (19). ☞ When saving a measurement, the symbol [M] is briefly displayed, the storage place is indicated below. -
Page 23: Basic Settings
Basic Settings The data and the sampling rate should be set before starting the recording. For time setting, simultaneously press the “SET” (14) and “TIME“ keys (15). The TIME” symbol (5.44) is displayed and the line “Date and Time” is indi- cated with the following assignment: (5.24) display for year (Y) and month (M) (5.27) display for day (D) and hour (h) -
Page 24: Determining The Rotary Field
Determining the Rotary Field 1) Switch on the instrument Select the type of connection 3P4W using the “Wiring” function key (6). After selection, the following display is indicated with the symbol 3P4W (5.11): Display Type of connection 3P4W The measurement inputs are connected as illustrated in the following drawing: yellow blue black... -
Page 25: Curve Shape And Harmonic Wave Measurement
• Connection to the PC Connection to the PC Interface The Amprobe Power Analyzer is connected to a free interface (COM1 through COM 8) using the interface cable included with the delivery. The interface is selected after the program start. -
Page 26: Installation
Installation � Viruses! In the present state of the art it cannot be guaranteed 100 % that the enclosed data carrier is free from viruses. Despite a careful virus test with the latest anti-virus programs we cannot be held liable for any damage caused by viruses. -
Page 27: Online Register: Online Measurement
The main menu is divided into three areas: A: Buttons – Programme functions Starting and saving measurement Opening the file Online measurement / data in form of a list Online measurement / data in form of a graph Sampling rate Data logger –... - Page 28 Starting and saving measurement: Click the (a) [Insert graph] button to start the online measurement. After having clicked the button, the window for the entry of the file name and of the path for the measurement or measurements to be saved will be displayed. ☞...
- Page 29 Opening file – Analysis of the data saved in the PC By clicking the (b) [Insert graph] button, the saved measurements can be loaded. After clicking on the button, the window for the selection of the file will appear. After having selected the requested file, the saved data will be displayed in form of a table.
-
Page 30: Ordinal Number Of The Harmonics
For a better general survey, all input signals are represented in form of a graph. Click the graph to enlarge it. -
Page 31: Harmonics Register: Harmonics Measurement
“Graph Range” area The display area can be modified by direct input or using the arrow keys. “Track Mode” area Mouse functions for the graphic display Normal: no function Cursor Coordinates: Cursor display with additional indication of the measured value in the “Cursor Information” area. PanXY: Shifting the graph in X and Y direction PanX:... - Page 32 The file name may consist of the current date and must consist of the .mes file index. ☞ If more than 10000 measured values are saved, the measured values will be saved automatically. The file name consists of the date and the current time, e. g.
-
Page 33: Data Logger Register : Data Logger - Anaylsis Of The Data
If a measured value recording is enabled in the measuring instrument, a data transmission is not possible. The reading and generation of the list can take some minutes in case of a large number of measured values or in case of full memory. If one measurement includes more than 10000 measured values, they will be divided into two lists or files. - Page 34 Harmonic measurement In this window you can carry out simple harmonic measurements up to the 31st harmonic. The total value of the harmonic distortion THD in percent is calculated according to the following equation: whereas: A(f1) = fundamental wave, A(fn) = harmonic with number n. The number of harmonics (n) for the calculation of THD can be selected.
- Page 35 Harmonic window: Field “Harmonics” - Number of harmonics for the calculation of THD: To select the requested last harmonic use the arrow keys or directly enter or modify it in the display field. Example: If 5 is selected, the total value THD from number 1 to 5 will be calcu- lated.
-
Page 36: Setting Date And Time
Setting date and time Click the (h) [Insert graph] button to transmit the current system time of the PC to the power measuring instrument. Data transfer to an external program Example: Evaluation of the measured values by importing the data to MS EXCEL. Open the “Open file”... -
Page 37: Saved Data Register: Analysis Of Data Saved On The Pc
☞ The data format of the second column has to be set to YMT date format. As a result, you will receive the read raw data in the correct spreadsheet form. ☞ Now, you can edit the data at discretion. -
Page 38: Maintenance
Maintenance When using the instrument in compliance with the users manual, no special maintenance is required. Cleaning If the instrument is dirty after daily usage, it is advised to clean it by using a damp cloth and a mild household detergent �... -
Page 39: Round Cells
Batteries If the adjusted date and time is not being saved, the small coin cell needs to be replaced. 1) Use a screwdriver to remove the four screws from the case (backside) 2) Remove the holster 3) Remove the battery cover 4) Insert new battery ☞... -
Page 40: Technical Data
Technical Data (valid for 23 °C ± 5 °C, for less than 70 % relative humidity). Voltage measurement: ..3 input channels with common reference point “N” Measurement range: ..0 to 600 Vrms Display range: ....0 to 999.9 Vrms Resolution: ....0.1V Accuracy: ....±... - Page 41 Phase angle (f) (calculation out of power factor) Display of phase angle of an individual input or the total value, as desired Measurement range: ..0° to 90° A negative sign “- “shows a leading current. Resolution: ....0.1° Accuracy: ....± 4° Frequency measurement (for voltage ramge >...
- Page 42 Technical Data – General Information Display: ..........multiple function LCD Refresh rate: ........approx. 2 seconds (Backlight): ........automatic-power-off after approx. 30 s Data logger:........512 Kb, non-volatile memory ..........max. 21 000 measurement values, max. 10 measurement series ..........0max. 10 000 measurement values for on measurement series Sampling rate (adjustable): ..5 seconds, 30 seconds, 1 min, 2 min Data transfer: ........via optically isolated RS-232 interface Manual data memory: ....Max: 99 measurement...
Need help?
Do you have a question about the PQ55A and is the answer not in the manual?
Questions and answers