Table of Contents
Advertisement
Quick Links
User's Guide
Hygro-Thermometers
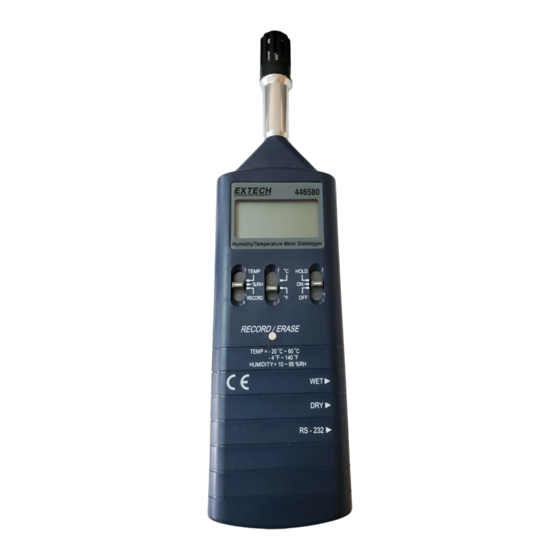
Models 4465CF and
446580
Introduction
Congratulations on your purchase of the Extech 4465CF or 446580 Hygro-Thermometer.
The Extech Hygro-Thermometers measure and display temperature and relative
humidity. The 446580 has a PC interface and built-in datalogging capabilities. Careful
use of these meters will provide years of reliable service.
Advertisement
Table of Contents

Related Manuals for Extech Instruments 4465CF


Summary of Contents for Extech Instruments 4465CF
- Page 1 Models 4465CF and 446580 Introduction Congratulations on your purchase of the Extech 4465CF or 446580 Hygro-Thermometer. The Extech Hygro-Thermometers measure and display temperature and relative humidity. The 446580 has a PC interface and built-in datalogging capabilities. Careful use of these meters will provide years of reliable service.
-
Page 2: Specifications
Warranty EXTECH INSTRUMENTS CORPORATION warrants this instrument to be free of defects in parts and workmanship for one year from date of shipment (a six month limited warranty applies to sensors and cables). If it should become necessary to return the instrument for service during or beyond the warranty period, contact the Customer Service Department at (781) 890-7440 ext. -
Page 3: Getting Started
6. When the low battery icon flashes on the LCD, replace the 9V battery. Displayed Readings The Model 4465CF displays humidity or temperature readings in the center of the LCD depending upon the position of the TEMP-%RH switch. The Model 446580, displays both parameters simultaneously with the primary measurement in the center of the LCD (large digits) and the secondary measurement in the lower right hand side of the LCD (smaller digits). - Page 4 Analog Output - Model 4465CF The Model 4465CF has an analog output whereby the user can connect a datalogging device such as a chart recorder to capture temperature and humidity readings. The analog output jack located on the right side of the Model 4465CF accepts a TIP-RING-SLEEVE 3.5mm phono plug (detailed below).
- Page 5 Running the supplied Datalogging software 1. Place the supplied software CD in the PC CD-ROM drive and follow the on-screen instructions for installation. 2. Launch the program by double clicking the program file in the location where it was saved during installation. 3.
- Page 6 Datalogging One Reading (Manual Logging) with the Model 446580 1. Set the TEMP-%RH-RECORD switch to the RECORD position 2. Press the RECORD-ERASE button once. The RECORD display icon will flash briefly on the LCD. 3. One reading is now placed in the internal memory of the meter. Datalogging Continuously (Automatic Logging) 1.
- Page 7 Graph the Downloaded Data 1. After downloading data as previously described, select TEMPERATURE or HUMIDITY from the GRAPH menu heading in the REC LIST software window. 2. An x-y graph will appear that plots Temperature or Humidity over Time. 3. The graph can be printed by selecting PRINT from the menu heading in the graph window.
- Page 8 For the latest version of this User’s Guide, Software updates, and other up-to-the-minute product information, visit our website: www.extech.com Copyright © 2004 Extech Instruments Corporation All rights reserved including the right of reproduction in whole or in part in any form.
Need help?
Do you have a question about the 4465CF and is the answer not in the manual?
Questions and answers