Table of Contents
Advertisement
Quick Links
Advertisement
Table of Contents

Related Manuals for Mindray TE Air


Summary of Contents for Mindray TE Air
- Page 1 TE Air Diagnostic Ultrasound System Operator's Manual...
-
Page 3: Intellectual Property Statement
Contents of this manual are subject to change without prior notice. All information contained in this manual is believed to be correct. Mindray shall not be liable for errors contained herein or for incidental or consequential damages in connection with the furnishing, performance, or use of this manual. -
Page 4: Exemptions
Mindray or repairs by people other than Mindray authorized personnel. -
Page 5: About This Manual
• Important data must be backed up on external memory media. • Mindray shall not be liable for loss of data stored in the memory of this system caused by operator error or accidents. • This manual contains warnings regarding foreseeable potential dangers, but you shall also be continuously alert to dangers other than those indicated. -
Page 6: Software Interfaces In This Manual
[Items in menu] > [Items in submenu]: select a submenu item following the path. Notification of Adverse Events As a health care provider, you may report the occurrence of certain events to SHENZHEN MINDRAY BIO-MEDICAL ELECTRONICS CO., LTD., and possibly to the competent authority of the Member state in which the user and / or patient is established. -
Page 7: Table Of Contents
Contents Contents Intellectual Property Statement ....................3 Warranty ............................3 Exemptions ..........................4 Customer Service Department ....................4 Important Information ......................4 About This Manual ........................5 Meaning of Signal Words ......................5 Manuals .............................5 Software Interfaces in this Manual ..................6 Conventions ..........................6 Notification of Adverse Events ....................6 Important Information ......................1 Safety Precautions .......................... - Page 8 Contents 2.10.2 System Tools ........................15 2.10.3 Measurement, Annotations and Body Marks Menu ............16 2.11 The Air Capsule ..........................16 2.11.1 Power Supply ........................16 2.11.2 Charging the Wireless Probe ..................... 16 2.11.3 Charging the Air Capsule ....................17 2.12 Warning Labels ..........................
- Page 9 Contents Patient Information ..........................33 5.1.1 New Patient Information ..................... 33 5.1.2 Retrieve Patient Information ....................33 End an Exam ............................ 33 Image Acquisition ........................35 B Mode ............................. 35 6.1.1 B Mode Image Scanning ....................35 6.1.2 B Mode Image Parameters ....................35 M Mode .............................
- Page 10 Contents 8.1.5 Smart Calc ......................... 55 8.1.6 References ......................... 55 Annotation ............................60 8.2.1 Adding Annotations ......................60 8.2.2 Modifying (Editing) Annotations ..................61 8.2.3 Deleting Annotations ......................61 Body Mark ............................61 8.3.1 Adding Body Marks ......................62 8.3.2 Moving Body Marks ......................
- Page 11 Contents 12.3.1 View Selecting Area ......................76 12.3.2 Zooming Display ........................ 76 Acoustic Output ........................77 13.1 Concerns with Bioeffects ........................77 13.2 Prudent Use Statement ........................77 13.3 ALARA Principle (As Low As Reasonably Achievable) ..............77 13.4 MI/TI Explanation ..........................78 13.4.1 Basic Knowledge of MI and TI....................
- Page 12 16.3.18 z5M (Linear) ........................164 16.3.19 a3Px ..........................168 16.3.20 e3P ........................... 172 16.3.21 e3Ps ..........................176 16.3.22 e3Pt ..........................180 16.3.23 z3P ........................... 184 16.3.24 z3Ps ..........................188 16.3.25 z3Pt ..........................192 Indications For Use ......................197...
-
Page 13: Important Information
IEC 60601-1. If you have any questions regarding these requirements, consult your vendor. ● Do not use an aftermarket probe other than those specified by Mindray. The probes may damage the system causing a profound failure, e.g. a fire in the worst case. CAUTION ●... - Page 14 ● Please use the disinfection solution recommended in this operator’s manual; otherwise Mindray will not be liable for damage caused by other solutions. If you have any questions, please contact Mindray Customer Service Department or sales representative. ●...
-
Page 15: Intellectual Property Statement
Important Information Latex Alert When choosing a probe sheath, it is recommended that you directly contact CIVCO for obtaining information regarding probe sheaths, pricing, samples and local distribution. For CIVCO information, please contact the following: CIVCO Medical Instruments Tel: 1-800-445-6741 www.civco.com Allergic reactions in patients sensitive to latex (natural rubber) may range from mild skin reactions (irritation) to fatal anaphylactic shock, and may include difficulty breathing (wheezing), dizziness, shock,... -
Page 16: Important Information
This page intentionally left blank. -
Page 17: About This Manual
Ensure that probe software and the TE Air software versions are latest and compatible with each other. Otherwise, it could cause issues in the basic functionality of the TE Air and could also cause issues in pairing the probe with the app. -
Page 18: Operating Environment
When the Wi-Fi connection status of the probe changes, the probe indicator will be blinking. ● When the device decommissions, please delete patient data or uninstall the TE Air. The following measures are taken by Mindray to ensure information security and network security: •... -
Page 19: Software Environment
Sqlite OpenLDAP Ldap OpenLDAP Linux, Mac OS X, Authentication Microsoft Windows, the BSDs, Solaris MiCo+ SDK Image Coding & 1.0.0 Mindray iOS, Android decoding Sound network Image Coding & 4.2.2 Shanghai Zhaoyan iOS, Android decoding Network Technology Co., Ltd. Table 2-2 OTS (off-the-shelf) Software of Android platform... -
Page 20: Electronic Interface
System Overview Operating Version/Kernel Item Description Supplier Version Environment Huawei unified QRCode 2.11.0.300 Huawei Software Android scanning code Encode&Decode Technology Co., SDK(Android Ltd. Version) MMKV Data Storage and 1.2.11 Tencent Technology Android Retrieval. (Shenzhen) Co., Ltd. gson Json Data 2.8.9 Google LLC Android Processing... -
Page 21: Interoperability
Input voltage: 5V-10V – Input current: 4A Max NOTE: The power adapters and wireless charging docks are not configured or sold by Mindray. The user can purchase them based on the specific needs. It is recommended to purchase via www.ebay.com www. -
Page 22: Probe Environmental Conditions
System Overview 2.5.2 Probe Environmental Conditions WARNING Do not use the probe in the conditions other than those specified. Operational conditions • Ambient temperature: 0°C ~ 35°C • Relative humidity: 20% ~ 85% (no condensation) • Atmospheric pressure: 700 hPa ~ 1060 hPa Storage and transportation conditions •... -
Page 23: System Configuration
System Overview B- histogram B- histogram B- histogram B- histogram Probe model (Ellipse) (Trace) (Spline) (Rectangle) √ √ √ √ × √ √ √ z5Ms √ × √ √ z5Mt √ √ × √ √ √ √ × e5Ms × ×... -
Page 24: Introduction Of Each Unit
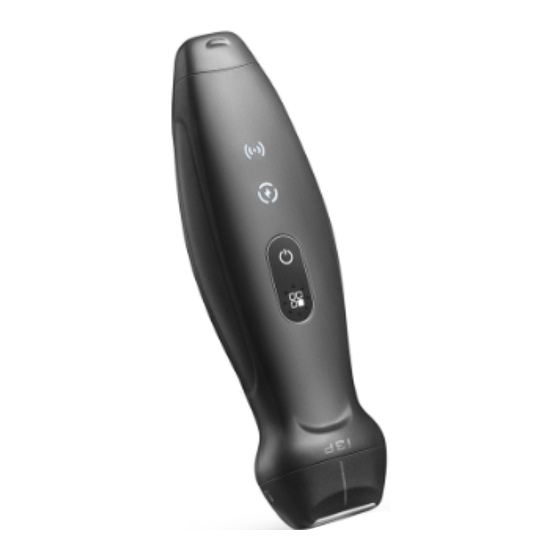
System Overview Introduction of Each Unit Name Function Power key Long press to power on or power off the probe. Press to display the battery capacity. Battery status indicator It indicates the charging status of the built-in battery of the probe. It illumines in white when fully charged and blinks in orange in low battery. -
Page 25: Screen Display
System Overview Name Function Wi-Fi connection It indicates the connection status of the probe. indicator The indicator is blinking when the probe is not connected. The indicator is white when the probe is connected successfully. Charging port Charges the built-in battery of the probe. Charging cable plug Connects with the charging port of the probe. - Page 26 System Overview Name Function System Tools button Selects Patient Information and Review, iStation, Setup, etc. Reviews the stored images and cines in the “Patient Info.&Review” menu. Image parameters Displays the parameter values of the current image. Imaging area In B mode, slide up or down in the imaging area to adjust the imaging depth.
-
Page 27: System Tools
System Overview 2.10.2 System Tools Name Function User name Displays user name. Patient & Review Taps to enter Patient Info and Review page. iStation Taps to enter iStation and manage patient data. iWorks Taps to enter iWorks screen. It automates a clinical workflow in common exam protocols in a logical “step by step”... -
Page 28: Measurement, Annotations And Body Marks Menu
System Overview 2.10.3 Measurement, Annotations and Body Marks Menu Name Function Measurement tab Taps to enter measurement status. Annotation tab Taps to enter annotation status. End Exam button Taps to end the current exam and start a new one. Body Mark tab Taps to enter body mark status. -
Page 29: Charging The Air Capsule
System Overview Name Function Battery capacity 95% < battery capacity: the indicator is in green. indicator 30% < battery capacity ≤ 95%: the indicator is in white. 0% ≤ battery capacity ≤ 30%: the indicator is in orange. Error: the indicator is in purple. Battery capacity Press to turn on the battery capacity indicator. -
Page 30: Symbols
System Overview The warning labels use the same signal words as those used in the operator’s manual. Read operator’s manual carefully before using the system. The name, pattern and meaning of each warning label are described as follows: Symbol Description Caution! General warning sign Read this information carefully before using the system. - Page 31 System Overview Symbol Description Temperature limit Humidity limit Atmospheric pressure limitation Non-ionizing electromagnetic radiation CONFORMS TO AAMI Std. ES 60601-1, IEC Std. 60601-2-37, IEC Std. 60601-2-18; CERTIFIED TO CSA Std. C22.2 NO. 60601-1, 60601-2-37, 60601-2-18 This way up Fragile, handle with care Keep dry Do not roll Stack height limit...
- Page 32 System Overview Symbol Description Federal law restricts this device to sale by or on the order of a licensed healthcare practitioner (USA). The following definition of the WEEE label applies to EU member states only: The use of this symbol indicates that this system should not be treated as household waste.
-
Page 33: System Preparation
If the system begins to function improperly, immediately stop scanning. If the system continues to function improperly, fully shut down the system and contact the Mindray Customer Service Department or a sales representative. If you use the system in a persistent improperly functioning state, you may harm the patient or damage the equipment. -
Page 34: Power On/Off
Long press the power button of the probe to power on or power off the probe. Installing Applications The device can download the TE Air application from the App Store or Google Play. Before installing the application, make sure that your device meets the minimum configuration requirements. For details, please refer to “2.4.1 Hardware Configuration”. -
Page 35: Logging Onto The System
System Preparation 3.3.2 Logging onto the System Using Local Account/LDAP Account Perform the following procedure: Select the login type (Local or LDAP). Enter the user name and password, and tap [Login]. Using Emergency Account The system can be accessed through emergency account without logging in when users need to use the system in an emergency and he forgot his user ID. -
Page 36: Activating The Probe
System Preparation 3.4.3 Activating the Probe After connecting a probe for the first time, activate the probe by activation code. Perform the following procedure: Click [Start] in the "Activate the probe" window. If there is an activation code, tap [Enter Activation Code]. Make sure your device is connected to a wireless or cellular network. -
Page 37: System Setup
System Setup System Setup The Setup function is designed to set the configuration parameters of operating the system and maintaining user workflow setup data. To enter Setup: Tap [Setup] in System Tools to enter setup menu. Font Preset Item Description Larger Text To set whether to enable Larger Test. -
Page 38: Probe Check
System Setup Item Description Firmware Update Taps to upgrade probe firmware. Auto Freeze Sets auto freezing time after the probe is scanned into idle state. Probe Key Functions Sets functions of probe keys K1 and K2 in short press or long press. -
Page 39: My Account
Setting up registered accounts. 4.6.1 Change Password of Local Account Select [Change Password], and enter device password for TE Air. Input new password and confirm password. Select [Save]. Return to the login interface and use the new password to log in the account. -
Page 40: Share Folder Settings
System Setup Share Folder Settings Share folder preset items are described as follows. Item Description Name Sets a name of the share folder. IP Address Enters the IP address of the destined PC server. Port To set the server port. User Name Enters the user name of the share folder. - Page 41 System Setup Tools GA formulae Hadlock Tokyo Jeanty Kurtz Hansmann Merz Rempen ChittyOI Osaka China Nicolaides ASUM Verburg(O-O) Hadlock Jeanty Hansmann ChittyPL ChittyDer Nicolaides ASUM Hadlock Jeanty Merz Nicolaides ASUM CFEF Hansmann Chitty Hadlock Tokyo Jeanty Hohler Merz Hansmann Warda Chitty Osaka China...
-
Page 42: Iworks Settings
System Setup Units Formulae Descriptions Item Hadlock (AC, FL) EFW= 10^(1.304+ (0.05281*AC)+ (0.1938*FL)- (0.004*AC*FL)) SD=0.154*EFW SD Type=±2SD Hadlock (AC, FL, EFW= 10^(1.335 -(0.0034*AC*FL) + (0.0316*BPD) + (0.0457*AC) + BPD) (0.1623*FL)) SD=0.146*EFW SD Type=±2SD Hadlock (AC, FL, EFW= 10^(1.326-(0.00326*AC*FL)+ (0.0107*HC)+ (0.0438*AC)+ (0.158*FL)) SD=0.148*EFW SD Type=±2SD... -
Page 43: Option Settings
System Setup Item Description Scan Barcode Example Input a barcode example, barcode example is separated by separators (the separator is used to set the start and end position of each item), and the barcode data is displayed in the following items in turn. Regular Expression to set the regular expression according to the bar code format. - Page 44 This page intentionally left blank.
-
Page 45: Exam Preparation
Exam Preparation Exam Preparation You can start a patient exam in the following situations: • New patient information: to start a new patient exam, patient information must first be entered. • New exam: to start a new exam for patient who is already registered, the recorded information can be obtained through either iStation or WorkList. - Page 46 This page intentionally left blank.
-
Page 47: Image Acquisition
Image Acquisition Image Acquisition The images displayed in this system are only reference for diagnosis. Mindray is not responsible for the correctness of diagnostic results. Operations for switching between different image modes and optimizing images, see the System Overview chapter. -
Page 48: M Mode
Image Acquisition You should perform exams according to actual situation and follow the ALARA Principle. iClear Image Enhance The function is used to enhance the image profile so as to distinguish the image boundary for optimization. Rotation/Invert (L/R Flip) This function provides a better observation for image display. Gray map Adjusting grayscale contras to optimize the image. -
Page 49: Color Mode
Image Acquisition Speed This function is used to set the scan speed of M mode imaging, and the real-time speed value is displayed in the image parameter area. Color Mode The Color mode is used to detect color flow information, and the color is designed to judge the direction and speed of blood flow. -
Page 50: Power Mode
Image Acquisition Power Mode Power mode provides a non-directionally display of blood flow in the form of intensity as opposed to flow velocity. In Power mode, acoustic power is synchronous with that of B mode. Adjustment of the depth or zoom to the B Mode image will lead to corresponding changes in Power mode image. - Page 51 Image Acquisition Increasing the gain will brighten the image and you will see more received signals. However, noise may also be increased. PW Sampling Gate To adjust the SV position and size of sampling in PW mode, the real-time value of SV and SVD are displayed in the image parameter area of the screen, in which SV represents the size of the sampling gate, and SVD represents the sampling depth.
-
Page 52: Tdi
Image Acquisition • Smooth: To set the smooth level when tracing. • Sensitivity: This function is used to set the sensitivity of tracing in the spectrum. TDI mode is intended to provide information of low-velocity and high-amplitude tissue motion, specifically for cardiac movement. -
Page 53: Iworks
Image Acquisition iWorks 6.8.1 Overview The main objective of ultrasound workflow automation (iWorks) is to speed up exam times and reduce the excessive number of user interface manual key strokes that can lead to repetitive strain injuries over time. It automates a clinical workflow in common exam protocols in a logical “step by step” manner. It also prevents missing important parts of examinations as well as decreasing exam times. - Page 54 This page intentionally left blank.
-
Page 55: Display & Cine Review
Display & Cine Review Display & Cine Review Image Magnification NOTE Zooming an image changes the frame rate which tends to change thermal indices. The position of the focal zones may also change which may cause the peak intensity to occur at a different location in the acoustic filed. -
Page 56: Manual Cine Review
Display & Cine Review 7.3.2 Manual Cine Review After entering cine review in 2D mode, drag playback mark to review the cine images on the screen one by one. If you roll the playback mark to the left, the review sequence is reversed to the image-storing sequence, thus the images are displayed in descending order. -
Page 57: Measurement, Annotations And Body Mark
Measurement, Annotations and Body Mark Measurement, Annotations and Body Mark Measurement There are general measurement and application measurement. You can perform measurements on a zoomed image, cine reviewing image, real-time image, or frozen image. WARNING ● Be sure to measure areas of interest from the most optimal image plane to avoid misdiagnosis from inaccurate measurement values. -
Page 58: Measurement Menu
Measurement, Annotations and Body Mark Table 8-3 Auto Measurements Parameter Error AutoEF Within ±10% Smart Bladder Within ±10% Smart Calc Within ±10% 8.1.1 Measurement Menu Freeze and select [Exam Mode]. The measurement menu is displayed on the left tab. 8.1.2 General Measurements Distance Function: Measure the distance between two points on 2D and M image. - Page 59 Measurement, Annotations and Body Mark Double Dist Function: Measure the distance between two points of two vertical line segments on B image. Perform the following procedure: Tap [Double Dist] in the menu, and two vertical cursor appears on the screen. Set two line segments, and refer to “Distance”...
- Page 60 Measurement, Annotations and Body Mark Tap [Area] in the measurement menu and select [Ellipse]. Then the cursor appears on the screen. Drag the cursor to an area of interest. Select and drag any measurement cursor to confirm the ellipse area, and the measure result will be displayed in the results window.
- Page 61 Measurement, Annotations and Body Mark – B: Left ventricular wall and mitral valve junction; After setting A and B, the cursor positions automatically at point D where considered as the apical part by system detecting, also the long axis (line segment CD) and the line that traces the endocardium are displayed at the same time.
- Page 62 Measurement, Annotations and Body Mark The result is displayed in the result window. LVOT Diam Perform the following procedure: Tap [LVOT Diam] in the measurement menu, and the cursor appears on the screen. Select the left cross cursor and drag it to the measurement starting point. Select the right cross cursor and drag it to the measurement end point.
- Page 63 Measurement, Annotations and Body Mark MV Ea (medial) Perform the following procedure: Tap [MV Ea (medial)] in the measurement menu. Move the cursor to the point to be measured for velocity and the measurement result is displayed in the result window. After the results are saved, measure MV E Vel item to get E/Ea result.
- Page 64 Measurement, Annotations and Body Mark Item Description Method or formula Vas Area Dist. Obtain the area by measuring Vas. Area = π × Vas Diam (cm)2/ 4 the vascular diameter. Trace Obtain the area using the Area in 2D General Measurements trace method.
- Page 65 Measurement, Annotations and Body Mark The result window shows result. Function: To evaluate whether the amniotic fluid volume is within the normal range. Formulae: Measure AF1, AF2, AF3, and AF4 respectively, and AFI =AF1+AF2+AF3+AF4. Perform the following procedure: Tap [AFI] in the measurement menu. Enter the submenu. Measure the maximum AFs of the four amniotic fluid pockets of a pregnant woman.
-
Page 66: Autoef
Measurement, Annotations and Body Mark M: M = ∑Di / N; MAX: MAX = the pixel number in the maximum gray/N×100% SD: Standard deviation. SD = (∑Di2/N-(∑Di/N)2)1/2 Di: the gray at each pixel point ∑Di: the total grays of all pixels. Ellipse: fix an ellipse region by two equal-cut perpendicular axes. -
Page 67: Smart Bladder
Measurement, Annotations and Body Mark Tap [ES] to switch to the section ES, move the cursor on the trace line to adjust the trace line. The result is displayed in the result window. Tap [Done] to confirm the result. 8.1.4 Smart Bladder Function: Automatically measuring the urine volume in the bladder. - Page 68 Measurement, Annotations and Body Mark Fetal Growth Chart Using the Ultrasonotomographic Technique, Keiichi Kurachi, Mineo Aoki, Department of Obstetrics and Gynecology, Osaka University Medical School Revision 3 (September 1983) Studies on Fetal Growth and Functional Developments, Takashi Okai, Department of Obstetrics and Gynecology, Faculty of Medicine, University of Tokyo Chitty L.S., Altman D.G.
- Page 69 Measurement, Annotations and Body Mark Ultraschalldiagnostik in Geburtshilfe und Gynäkologie 1985 Chitty L.S., Altman D.G. British Journal of Obstetrics and Gynaecology January 1994, Vol.101 P29-135. Chitty L.S., Altman D.G., Hendesson A., Campell S., Charts of fetal size: 2 Head measurements, Br J Obstetric Gynecology 1994, Vol 101, P 35-43.
- Page 70 Measurement, Annotations and Body Mark Jeanty P., Cousaert E., Cantraine F. Normal Growth of the Abdominal Perimeter. American Journal of Perinatology; Volume 1 Number 2; January 1984; pages 129-135 R. J. M. Snijders and K. H. Niicolaides. Fetal biometry at 14-40 weeks’ gestation. Ultrasound Obstet. Gynecol.
- Page 71 Measurement, Annotations and Body Mark Jeanty P., Cousaert E., Cantraine F., Hobbins J.C., Tack B., Struyven J. “A longitudinal Study of fetal limb growth” American Journal of Perinatology; Volume 1; Number 2; January 1984;136-144 Jeanty P., Rodesch F., Delbeke D., Dumont J. “Estimation of Gestational Age from Measurements of Fetal Long Bones”...
-
Page 72: Annotation
Measurement, Annotations and Body Mark Annotation Annotations can be added to an ultrasound image to bring attention, notate or communicate information observed during the examination. You can add annotations to frozen images. In annotation status, you can enter annotation to the image through the touch screen. WARNING Ensure that the entered annotations are correct. -
Page 73: Modifying (Editing) Annotations
Measurement, Annotations and Body Mark 8.2.2 Modifying (Editing) Annotations Modifying (Editing) a Character Perform the following procedure: In annotation status, move the cursor onto the annotations to be modified: Tap alphabetic keys to enter the character to the cursor position directly. Tap [Back] to delete the annotation character or text on the left side of the cursor. -
Page 74: Adding Body Marks
Measurement, Annotations and Body Mark 8.3.1 Adding Body Marks Perform the following procedure: Select body mark to be added in the body mark list. Adjust the probe marker: – Tap and drag the probe marker to identify the location. – Drag and rotate the probe marker extension cable to adjust the probe marker orientation. -
Page 75: Patient Data Management
When not operating for a long time, please lock the device screen in time to prevent patient information leakage or modifying. ● The system support sharing patient information via the DICOM on the TE Air application and data shared is secured. Image File Management You can store the image files in the patient database in the system. -
Page 76: Sending Image File
Patient Data Management 9.1.4 Sending Image File NOTE Data saved this way can only be reviewed on the PC and cannot be restored to the ultrasound system. Perform the following procedure: > [Patient&Review] to enter the Review page or select the exam in iStation screen. In the Review screen, tap [Select] and select a stored image thumbnail. -
Page 77: Worklist
Patient Data Management WorkList When the DICOM basic package is configured and the WorkList server has been set, tap [WorkList] in the “Patient Info” screen to query or import the patient data. Tricefy You can use the ultrasound system to send data (exam images and report) to the Tricefy. Operator's Manual... - Page 78 This page intentionally left blank.
-
Page 79: Probes
Probes Probes 10.1 Probes Probe Mode Probe Figure i3P, i3PA, z3P, z3Ps, z3Pt, e3P, e3Ps, e3Pt, a3Px i5M, z5M, z5Ms, z5Mt, e5M, e5Ms, e5Mt, a5Mx NOTE For disinfected probes, refer to your hospital policy and procedures for details of storage times and conditions. -
Page 80: Procedures For Operating
Probes Orientation mark Mark 10.3 Procedures for Operating The proper clinical technique to be used for operating the transducer should be selected on the basis of specialized training and clinical experience. Inspection before examination Connection to the system Examination Power off the probe Wiping off the ultrasound gel Thoroughly cleaning the probe Drying the probe... -
Page 81: Cleaning And Disinfection Overview
Probes CAUTION ● No cleaning and disinfecting may result in the probe becoming a source of infection. ● Please follow the disinfectant manufacturer’s manual for performing cleaning and disinfection, including preparing sterile water and cleaning and disinfection time. NOTE: ● After the examination, wipe off the ultrasound gel thoroughly. -
Page 82: Processing Non-Critical Probes
Probes How to Select a Processing Method Non-critical Body surface Contaminated Clean intact skin Non-intact skin intact skin No cover Single-use cover Non-sterile gel Sterile gel • Cleaning • Cleaning • LLD • LLD* NOTE ● LLD marked with * indicates that those categories must undergo low-level disinfectants that are effective against the mycobacteria and bloodborne pathogens. -
Page 83: Compatible Cleaner And Disinfectants
Excessive vibration • Heat generators When the probe is sent to MINDRAY Customer Service Department or sales representative for repair, be sure to disinfect it and keep it in the carrying case to prevent infection. Disinfection the carrying case as necessary. - Page 84 This page intentionally left blank.
-
Page 85: System Maintenance
The responsibility for maintenance and management of the product after delivery resides with the customer who has purchased the product. If you have any questions, please contact Mindray Customer Service Department or sales representative. WARNING ●... -
Page 86: Checking The Air Capsule
11.2 Troubleshooting If any persistent system malfunction is experienced, e.g., an on-screen error message, blank imaging screen, absent menus, see the table below. If the failure cannot be resolved, contact the Mindray Customer Service Department or a sales representative. Failure... -
Page 87: Iscanhelper
iScanHelper iScanHelper By providing the referential information, such as, the ultrasonic image, the anatomic graphic, scanning pictures/other scanning tips or diagnosis comments, the system helps the doctors to operate the scanning by iScanHelper. Furthermore, it is a good platform for the self-learning and training of ultrasound scanning technique for doctors. -
Page 88: Basic Screen And Operation
iScanHelper 12.3 Basic Screen and Operation 12.3.1 View Selecting Area Exam mode Displays the current exam mode. Section selecting box Tap to select a section. Ultrasonic image It is used to compare with images scanned by the operator. Exit button Tap to exit iScanhelper status. -
Page 89: Acoustic Output
Acoustic Output Acoustic Output This section of the operator’s manual applies to the overall system including the main unit, probes, accessories and peripherals. This section contains important safety information for operators of the device, pertaining to acoustic output and how to control patient exposure through use of the ALARA (as low as reasonably achievable) principle. -
Page 90: Mi/Ti Explanation
Acoustic Output 13.4 MI/TI Explanation 13.4.1 Basic Knowledge of MI and TI Mechanical Bioeffect and Thermal Bioeffect The relationship of various ultrasound output parameters (frequency, acoustic pressure and intensity, etc.) to bioeffects is not fully understood presently. It is recognized that two fundamental mechanisms may induce bioeffects. -
Page 91: Acoustic Power Setting
Acoustic Output NOTE If there is a value of MI or TI exceeds 1.0, you must be careful to practice the ALARA principle. The display precision is 0.1. Real-time Display accuracy: MI within ± 28.5%, TI within ± 38.7%. 13.5 Acoustic Power Setting Acoustic Power Adjustment Use the [A.power] to adjust the acoustic power percentage, and its value is displayed at the top of the... -
Page 92: Direct Controls
Acoustic Output 13.6.1 Direct Controls It is possible to control, if necessary, the acoustic output with the “A.power” item. In this case, the maximum value of the acoustic output never exceeds an MI of 1.9, TI of 6 and an ISPTA.3 of 720 mW/ cm2 in any mode of operation. -
Page 93: Differences Between Actual And Displayed Mi And Ti
Acoustic Output Application (W/cm (mW/cm spta.3 sppa.3 Regions (except eyes) ≤720 ≤190 ≤ 1.9 13.7.3 Differences Between Actual and Displayed MI and TI In operation, the system will display to the operator the Acoustic Output Parameters Thermal Index, TI, or Mechanical Index, MI (or sometimes both parameters simultaneously). These parameters were developed as general indicators of risk from either thermal or mechanical action of the ultrasound wave. - Page 94 This page intentionally left blank.
-
Page 95: Emc Guidance And Manufacturer's Declaration
TE Air,including cables specified by the manufacturer. Otherwise, degradation of the performance of this equipment could result. ● TE Air needs special precautions regarding EMC and needs to be installed and put into service according to the EMC information provided below. ●... - Page 96 To ensure that there is no unacceptable risk that the operator is viewing the live image during an endoscopic procedure, rather than a recorded image. If the basic performance of TE Air is lost or degraded, adjust the operating environment based on the ELECTROMAGNETIC ENVIRONMENT- GUIDANCE from “Table 14-1”...
- Page 97 Table 14-1 GUIDANCE AND MINDRAY DECLARATION-ELECTROMAGNETIC EMISSION The Probe which integrated in TE Air is intended for use in the electromagnetic environment specified below. The customer or the user of system should assure that it is used in such an environment.
- Page 98 EMC Guidance and Manufacturer’s Declaration Table 14-2 GUIDANCE AND MINDRAY DECLARATION-ELECTROMAGNETIC EMISSIONS TE Air is intended for use in the electromagnetic environment specified below. The customer or the user of system should assure that it is used in such an environment. IMMUNITY TEST...
- Page 99 EMC Guidance and Manufacturer’s Declaration Table 14-3 GUIDANCE AND MINDRAY DECLARATION-ELECTROMAGNETIC IMMUNITY TE Air is intended for use in the electromagnetic environment specified below. The customer or the user of system should assure that it is used in such an environment. IMMUNITY TEST...
- Page 100 EMC Guidance and Manufacturer’s Declaration GUIDANCE AND MINDRAY DECLARATION-ELECTROMAGNETIC IMMUNITY a: The ISM (industrial, scientific, and medical) bands between 150 kHz and 80 MHz are 6,765 MHz to 6,795 MHz; 13,553 MHz to 13,567 MHz; 26,957 MHz to 27,283 MHz; and 40,66 MHz to 40,70 MHz.
- Page 101 Recommended separation distances between portable and mobile RF communications equipment and system TE Air is intended for use in an electromagnetic environment in which radiated RF disturbances are controlled. The customer or the user of system can help prevent electromagnetic interference by maintaining a minimum distance between portable and mobile RF communications equipment (transmitters) and TE Air as recommended below, according to the maximum output power of the communications equipment.
- Page 102 Shielded Electromagnetic Radiation Exposure TE Air has passed the test and met the FCC and CE safety restrictions on electromagnetic radiation exposure. However, the use of accessories not included in the claimed product may cause electromagnetic radiation exposure to exceed expectations.
-
Page 103: Wireless Lan
Other non-medical devices in the same frequency band may cause interference, please be cautious. ● Wireless network designing, deploying, debugging, and maintenance should be executed by Mindray service personnel or authorized technicians. ● Always set the wireless network according to local wireless regulations. ●... - Page 104 Wireless LAN Item Specifications Network interruption : Wireless signal not connected alarm : Strong wireless signal : Normal wireless signal : Weak wireless signal If DICOM or other data transfer fails, a window will pop up for alarm and LOG recording. Coexist &...
-
Page 105: Acoustic Power Data And Surface Temperature Data
Acoustic Power Data and Surface Temperature Data Acoustic Power Data and Surface Temperature Data This manual gives all the transducers Acoustic Output Power data and Surface Temperature Data for this Diagnostic Ultrasound System. Please refer to correlative tables in use. 16.1 Description of Symbols Used in Acoustic Output Tables Symbol... -
Page 106: Transducer Maximum Surface Temperature
According to the requirements of the section 201.11 in the standard IEC 60601-2-37: 2015, the transducer surface temperature has been tested in two kinds of conditions: the transducer suspended in still air or transducer contacting human-tissue mimicking material. The measurement data were obtained under the test conditions employed at Mindray. Transducer model Maximum surface temperature(°C) - Page 107 Acoustic Power Data and Surface Temperature Data z5M(Linear) 41.1 34.0 z5Ms(Linear) 41.0 34.3 z5Mt(Linear) 41.4 34.4 a3Px 41.3 33.6 41.2 33.2 e3Ps 41.4 33.5 e3Pt 41.0 33.5 41.3 33.7 z3Ps 41.1 33.4 z3Pt 40.8 33.8 Operator's Manual...
-
Page 108: Acoustic Output Reporting Table (Iec 60601-2-37: 2015)
Acoustic Power Data and Surface Temperature Data 16.3 Acoustic Output Reporting Table (IEC 60601-2-37: 2015) 16.3.1 i3P Transducer Model: i3P Imaging Mode: M-mode Index label At surface Below At surface Below surface surface Maximum index value 1.44 0.07 0.35 0.23 Index component 0.02 0.07... - Page 109 Acoustic Power Data and Surface Temperature Data Transducer Model: i3P Imaging Mode: B-mode/Tissue Harmonic Imaging Index label At surface Below At surface Below surface surface Maximum index value 1.40 0.02 0.13 0.12 Index component value 0.02 0.02 0.13 0.02 Acoustic Parameters pr,α...
- Page 110 Acoustic Power Data and Surface Temperature Data Transducer Model: i3P Imaging Mode: PW-mode/TVD-mode Index label At surface Below At surface Below surface surface Maximum index value 0.84 0.13 0.98 0.18 Index component value 0.02 0.13 0.19 0.98 Acoustic Parameters pr,α at z (MPa) 1.13 P (mW)
- Page 111 Acoustic Power Data and Surface Temperature Data Transducer Model: i3P Imaging Mode: Color+B-Mode / Power+B-Mode /TVI+B/TEI+B Index label At surface Below At surface Below surface surface Maximum index value 1.40 0.03 0.03 0.27 Index component value 0.03 0.03 0.03 0.03 Acoustic Parameters pr,α...
-
Page 112: I3Pa
Acoustic Power Data and Surface Temperature Data 16.3.2 i3PA Transducer Model: i3PA Imaging Mode: M-mode Index label At surface Below At surface Below surface surface Maximum index value 1.41 0.07 0.35 0.12 Index component value 0.02 0.07 0.12 0.35 Acoustic Parameters pr,α... - Page 113 Acoustic Power Data and Surface Temperature Data Transducer Model: i3PA Imaging Mode: B-mode/Tissue Harmonic Imaging Index label At surface Below At surface Below surface surface Maximum index value 1.38 0.02 0.13 0.12 Index component value 0.02 0.02 0.13 0.02 Acoustic Parameters pr,α...
- Page 114 Acoustic Power Data and Surface Temperature Data Transducer Model: i3PA Imaging Mode: PW-mode/TVD-mode Index label At surface Below At surface Below surface surface Maximum index value 0.82 0.13 0.98 0.18 Index component value 0.02 0.13 0.19 0.98 Acoustic Parameters pr,α at z (MPa) 1.09 P (mW)
- Page 115 Acoustic Power Data and Surface Temperature Data Transducer Model: i3PA Imaging Mode: Color+B-Mode / Power+B-Mode /TVI+B/TEI+B Index label At surface Below At surface Below surface surface Maximum index value 1.40 0.03 0.03 0.27 Index component value 0.03 0.03 0.03 0.03 Acoustic Parameters pr,α...
-
Page 116: Z5M (Convex)
Acoustic Power Data and Surface Temperature Data 16.3.3 z5M (Convex) Transducer Model: z5M (Convex) Imaging Mode: M-mode Index label Below Below surface surface surface surface Maximum index value 1.18 0.56 2.10 2.07 Index component value 0.56 0.51 0.77 2.10 1.75 pr,α... - Page 117 Acoustic Power Data and Surface Temperature Data Transducer Model: z5M (Convex) Imaging Mode: B-mode/Tissue Harmonic Imaging Index label Below Below surface surface surface surface Maximum index value 1.14 0.25 0.25 1.06 Index component value 0.25 0.25 0.25 0.25 pr,α at z (MPa) 1.69 P (mW)
- Page 118 Acoustic Power Data and Surface Temperature Data Transducer Model: z5M (Convex) Imaging Mode: PW-mode/TVD-mode Index label Below Below surface surface surface surface Maximum index value 1.06 1.32 3.37 2.64 Index component value 1.32 0.99 0.99 3.37 pr,α at z (MPa) 1.57 P (mW) 101.14...
- Page 119 Acoustic Power Data and Surface Temperature Data Transducer Model: z5M (Convex) Imaging Mode: Color+B-Mode / Power+B-Mode /TVI+B/TEI+B Index label Below Below At surface surface surface surface Maximum index value 0.88 0.54 0.54 1.92 Index component value 0.54 0.54 0.54 0.54 pr,α...
-
Page 120: I5M (Convex)
Acoustic Power Data and Surface Temperature Data 16.3.4 i5M (Convex) Transducer Model: i5M (Convex) Imaging Mode: M-mode Index label Below Below surface surface surface surface Maximum index value 1.16 0.56 2.61 2.07 Index component value 0.56 0.52 0.66 2.61 1.72 pr,α... - Page 121 Acoustic Power Data and Surface Temperature Data Transducer Model: i5M (Convex) Imaging Mode: B-mode/Tissue Harmonic Imaging Index label Below Below surface surface surface surface Maximum index value 1.13 0.25 0.25 1.06 Index component value 0.25 0.25 0.25 0.25 pr,α at z (MPa) 1.67 P (mW)
- Page 122 Acoustic Power Data and Surface Temperature Data Transducer Model: i5M (Convex) Imaging Mode: PW-mode/TVD-mode Index label Below Below surface surface surface surface Maximum index value 1.06 1.32 3.40 2.64 Index component value 1.32 0.99 0.99 3.40 pr,α at z (MPa) 1.57 P (mW) 101.14...
- Page 123 Acoustic Power Data and Surface Temperature Data Transducer Model: i5M (Convex) Imaging Mode: Color+B-Mode / Power+B-Mode /TVI+B/TEI+B Index label Below Below At surface surface surface surface Maximum index value 1.36 0.54 0.54 1.92 Index component value 0.54 0.54 0.54 0.54 pr,α...
-
Page 124: E5M (Convex)
Acoustic Power Data and Surface Temperature Data 16.3.5 e5M (Convex) Transducer Model: e5M (Convex) Imaging Mode: M-mode Index label Below Below surface surface surface surface Maximum index value 1.18 0.60 2.67 2.15 Index component value 0.60 0.55 0.71 2.67 Acoustic 1.78 pr,α... - Page 125 Acoustic Power Data and Surface Temperature Data Transducer Model: e5M (Convex) Imaging Mode: B-mode/Tissue Harmonic Imaging Index label Below Below surface surface surface surface Maximum index value 1.15 0.27 0.27 1.10 Index component value 0.27 0.27 0.27 0.27 pr,α at z (MPa) 1.73 P (mW)
- Page 126 Acoustic Power Data and Surface Temperature Data Transducer Model: e5M (Convex) Imaging Mode: PW-mode/TVD-mode Index label Below Below surface surface surface surface Maximum index value 1.08 1.42 3.48 2.75 Index component value 1.42 1.05 1.07 3.48 pr,α at z (MPa) 1.63 P (mW) 105.36...
- Page 127 Acoustic Power Data and Surface Temperature Data Transducer Model: e5M (Convex) Imaging Mode: Color+B-Mode / Power+B-Mode /TVI+B/TEI+B Index label Below Below At surface surface surface surface Maximum index value 1.39 0.58 0.58 2.00 Index component value 0.58 0.58 0.58 0.58 pr,α...
-
Page 128: A5Mx (Convex)
Acoustic Power Data and Surface Temperature Data 16.3.6 a5Mx (Convex) Transducer Model: a5Mx (Convex) Imaging Mode: M-mode Index label Below Below surface surface surface surface Maximum index value 1.18 0.64 2.73 2.22 Index component value 0.64 0.57 0.75 2.73 1.81 pr,α... - Page 129 Acoustic Power Data and Surface Temperature Data Transducer Model: a5Mx (Convex) Imaging Mode: B-mode/Tissue Harmonic Imaging Index label Below Below surface surface surface surface Maximum index value 1.15 0.29 0.29 1.13 Index component value 0.29 0.29 0.29 0.29 pr,α at z (MPa) 1.75 P (mW)
- Page 130 Acoustic Power Data and Surface Temperature Data Transducer Model: a5Mx (Convex) Imaging Mode: PW-mode/TVD-mode Index label Below Below surface surface surface surface Maximum index value 1.08 1.50 3.56 2.83 Index component value 1.50 1.10 1.13 3.56 pr,α at z (MPa) 1.65 P (mW) 108.52...
- Page 131 Acoustic Power Data and Surface Temperature Data Transducer Model: a5Mx (Convex) Imaging Mode: Color+B-Mode / Power+B-Mode /TVI+B/TEI+B Index label Below Below At surface surface surface surface Maximum index value 1.40 0.61 0.61 2.06 Index component value 0.61 0.61 0.61 0.61 pr,α...
-
Page 132: E5Ms (Convex)
Acoustic Power Data and Surface Temperature Data 16.3.7 e5Ms (Convex) Transducer Model: e5Ms (Convex) Imaging Mode: M-mode Index label Below Below surface surface surface surface Maximum index value 1.20 0.60 2.15 2.15 Index component value 0.60 0.55 0.82 2.15 pr,α at z (MPa) 1.81 P (mW) - Page 133 Acoustic Power Data and Surface Temperature Data Transducer Model: e5Ms (Convex)) Imaging Mode: B-mode/Tissue Harmonic Imaging Index label Below Below surface surface surface surface Maximum index value 1.16 0.27 0.27 1.10 Index component value 0.27 0.27 0.27 0.27 pr,α at z (MPa) 1.75 P (mW)
- Page 134 Acoustic Power Data and Surface Temperature Data Transducer Model: e5Ms (Convex) Imaging Mode: PW-mode/TVD-mode Index label Below Below surface surface surface surface Maximum index value 1.08 1.42 3.45 2.75 Index component value 1.42 1.05 1.06 3.45 pr,α at z (MPa) 1.63 P (mW) 105.36...
- Page 135 Acoustic Power Data and Surface Temperature Data Transducer Model: e5Ms (Convex) Imaging Mode: Color+B-Mode / Power+B-Mode/TVI+B/TEI+B Index label Below Below At surface surface surface surface Maximum index value 0.90 0.58 0.58 2.00 Index component value 0.58 0.58 0.58 0.58 pr,α at z (MPa) 1.34 P (mW)
-
Page 136: E5Mt (Convex)
Acoustic Power Data and Surface Temperature Data 16.3.8 e5Mt (Convex) Transducer Model: e5Mt (Convex) Imaging Mode: M-mode Index label Below Below surface surface surface surface Maximum index value 1.20 0.60 2.18 2.15 Index component value 0.60 0.55 0.82 2.18 1.80 pr,α... - Page 137 Acoustic Power Data and Surface Temperature Data Transducer Model: e5Mt (Convex) Imaging Mode: B-mode/Tissue Harmonic Imaging Index label Below Below surface surface surface surface Maximum index value 1.16 0.27 0.27 1.10 Index component value 0.27 0.27 0.27 0.27 pr,α at z (MPa) 1.75 P (mW)
- Page 138 Acoustic Power Data and Surface Temperature Data Transducer Model: e5Mt (Convex) Imaging Mode: PW-mode/TVD-mode Index label Below Below surface surface surface surface Maximum index value 1.08 1.42 3.47 2.75 Index component value 1.42 1.05 1.07 3.47 pr,α at z (MPa) 1.62 P (mW) 105.36...
- Page 139 Acoustic Power Data and Surface Temperature Data Transducer Model: e5Mt (Convex) Imaging Mode: Color+B-Mode / Power+B-Mode /TVI+B/TEI+B Index label Below Below At surface surface surface surface Maximum index value 1.11 0.58 0.58 2.00 Index component value 0.58 0.58 0.58 0.58 pr,α...
-
Page 140: Z5Ms (Convex)
Acoustic Power Data and Surface Temperature Data 16.3.9 z5Ms (Convex) Transducer Model: z5Ms (Convex) Imaging Mode: M-mode Index label Below Below surface surface surface surface Maximum index value 1.20 0.63 2.19 2.22 Index component value 0.63 0.57 0.87 2.19 1.83 pr,α... - Page 141 Acoustic Power Data and Surface Temperature Data Transducer Model: z5Ms (Convex) Imaging Mode: B-mode/Tissue Harmonic Imaging Index label Below Below surface surface surface surface Maximum index value 1.16 0.29 0.29 1.13 Index component value 0.29 0.29 0.29 0.29 pr,α at z (MPa) 1.77 P (mW)
- Page 142 Acoustic Power Data and Surface Temperature Data Transducer Model: z5Ms (Convex) Imaging Mode: PW-mode/TVD-mode Index label Below Below surface surface surface surface Maximum index value 1.08 1.50 3.53 2.83 Index component value 1.50 1.10 1.13 3.53 pr,α at z (MPa) 1.65 P (mW) 108.52...
- Page 143 Acoustic Power Data and Surface Temperature Data Transducer Model: z5Ms (Convex) Imaging Mode: Color+B-Mode / Power+B-Mode /TVI+B/TEI+B Index label Below Below At surface surface surface surface Maximum index value 0.90 0.61 0.61 2.06 Index component value 0.61 0.61 0.61 0.61 pr,α...
-
Page 144: Z5Mt (Convex)
Acoustic Power Data and Surface Temperature Data 16.3.10 z5Mt (Convex) Transducer Model: z5Mt (Convex) Imaging Mode: M-mode Index label Below Below surface surface surface surface Maximum index value 1.17 0.56 2.14 2.07 Index component value 0.56 0.51 0.77 2.14 1.74 pr,α... - Page 145 Acoustic Power Data and Surface Temperature Data Transducer Model: z5Mt (Convex) Imaging Mode: B-mode/Tissue Harmonic Imaging Index label Below Below surface surface surface surface Maximum index value 1.14 0.25 0.25 1.06 Index component value 0.25 0.25 0.25 0.25 Acoustic pr,α at z (MPa) 1.69 Parameters...
- Page 146 Acoustic Power Data and Surface Temperature Data Transducer Model: z5Mt (Convex) Imaging Mode: PW-mode/TVD-mode Index label Below Below surface surface surface surface Maximum index value 1.06 1.32 3.39 2.64 Index component value 1.32 0.99 0.99 3.39 pr,α at z (MPa) 1.56 P (mW) 101.14...
- Page 147 Acoustic Power Data and Surface Temperature Data Transducer Model: z5Mt (Convex) Imaging Mode: Color+B-Mode / Power+B-Mode /TVI+B/TEI+B Index label Below Below At surface surface surface surface Maximum index value 1.08 0.54 0.54 1.92 Index component value 0.54 0.54 0.54 0.54 pr,α...
-
Page 148: A5Mx (Linear)
Acoustic Power Data and Surface Temperature Data 16.3.11 a5Mx (Linear) Transducer Model: a5Mx (Linear) Imaging Mode: M-mode Index label Below Below surface surface surface surface Maximum index value 1.30 0.19 0.46 0.52 Index component value 0.19 0.12 0.19 0.46 2.52 pr,α... - Page 149 Acoustic Power Data and Surface Temperature Data Transducer Model: a5Mx (Linear) Imaging Mode: B-mode/Tissue Harmonic Imaging Index label Below Below surface surface surface surface Maximum index value 1.28 0.08 0.08 0.16 Index component value 0.08 0.08 0.08 0.08 pr,α at z (MPa) 2.48 P (mW)
- Page 150 Acoustic Power Data and Surface Temperature Data Transducer Model: a5Mx (Linear) Imaging Mode: PW-mode Index label Below Below surface surface surface surface Maximum index value 1.23 1.51 2.37 1.85 Index component value 1.51 0.93 1.21 2.37 pr,α at z (MPa) 2.45 P (mW) 70.35...
- Page 151 Acoustic Power Data and Surface Temperature Data Transducer Model: a5Mx (Linear) Imaging Mode: Color+B-Mode / Power+B-Mode Index label Below Below At surface surface surface surface Maximum index value 1.29 0.66 0.66 1.36 Index component value 0.66 0.66 0.66 0.66 pr,α at z (MPa) 2.59 P (mW)
-
Page 152: E5Ms (Linear)
Acoustic Power Data and Surface Temperature Data 16.3.12 e5Ms (Linear) Transducer Model: e5Ms (Linear) Imaging Mode: M-mode Index label Below Below surface surface surface surface Maximum index value 1.30 0.17 0.45 0.50 Index component value 0.17 0.11 0.17 0.45 2.47 pr,α... - Page 153 Acoustic Power Data and Surface Temperature Data Transducer Model: e5Ms (Linear) Imaging Mode: B-mode/Tissue Harmonic Imaging Index label Below Below surface surface surface surface Maximum index value 1.27 0.08 0.08 0.15 Index component value 0.08 0.08 0.08 0.08 Acoustic pr,α at z (MPa) 2.43 Parameters...
- Page 154 Acoustic Power Data and Surface Temperature Data Transducer Model: e5Ms (Linear) Imaging Mode: PW-mode Index label Below Below surface surface surface surface Maximum index value 1.11 1.42 2.31 1.79 Index component value 1.42 0.89 1.14 2.31 pr,α at z (MPa) 2.20 P (mW) 68.30...
- Page 155 Acoustic Power Data and Surface Temperature Data Transducer Model: e5Ms (Linear) Imaging Mode: Color+B-Mode / Power+B-Mode Index label Below Below At surface surface surface surface Maximum index value 1.23 0.62 0.62 1.32 Index component value 0.62 0.62 0.62 0.62 pr,α at z (MPa) 2.44 P (mW)
-
Page 156: E5Mt (Linear)
Acoustic Power Data and Surface Temperature Data 16.3.13 e5Mt (Linear) Transducer Model: e5Mt (Linear) Imaging Mode: M-mode Index label Below Below surface surface surface surface Maximum index value 1.31 0.17 0.43 0.50 Index component value 0.17 0.11 0.17 0.43 2.48 pr,α... - Page 157 Acoustic Power Data and Surface Temperature Data Transducer Model: e5Mt (Linear) Imaging Mode: B-mode/Tissue Harmonic Imaging Index label Below Below surface surface surface surface Maximum index value 1.28 0.08 0.08 0.15 Index component value 0.08 0.08 0.08 0.08 pr,α at z (MPa) 2.42 P (mW)
- Page 158 Acoustic Power Data and Surface Temperature Data Transducer Model: e5Mt (Linear) Imaging Mode: PW-mode Index label Below Below surface surface surface surface Maximum index value 1.13 1.42 2.25 1.79 Index component value 1.42 0.89 1.14 2.25 pr,α at z (MPa) 2.21 P (mW) 68.30...
- Page 159 Acoustic Power Data and Surface Temperature Data Transducer Model: e5Mt (Linear) Imaging Mode: Color+B-Mode / Power+B-Mode Index label Below Below At surface surface surface surface Maximum index value 1.23 0.62 0.62 1.32 Index component value 0.62 0.62 0.62 0.62 pr,α at z (MPa) 2.44 P (mW)
-
Page 160: E5M (Linear)
Acoustic Power Data and Surface Temperature Data 16.3.14 e5M (Linear) Transducer Model: e5M (Linear) Imaging Mode: M-mode Index label Below Below surface surface surface surface Maximum index value 1.31 0.17 0.45 0.50 Index component value 0.17 0.11 0.17 0.45 2.48 pr,α... - Page 161 Acoustic Power Data and Surface Temperature Data Transducer Model: e5M (Linear) Imaging Mode: B-mode/Tissue Harmonic Imaging Index label Below Below surface surface surface surface Maximum index value 1.29 0.08 0.08 0.15 Index component value 0.08 0.08 0.08 0.08 pr,α at z (MPa) 2.45 P (mW)
- Page 162 Acoustic Power Data and Surface Temperature Data Transducer Model: e5M (Linear) Imaging Mode: PW-mode Index label Below Below surface surface surface surface Maximum index value 1.22 1.42 2.31 1.79 Index component value 1.42 0.89 1.14 2.31 pr,α at z (MPa) 2.41 P (mW) 68.30...
- Page 163 Acoustic Power Data and Surface Temperature Data Transducer Model: e5M (Linear) Imaging Mode: Color+B-Mode / Power+B-Mode Index label Below Below At surface surface surface surface Maximum index value 1.29 0.62 0.62 1.32 Index component value 0.62 0.62 0.62 0.62 pr,α at z (MPa) 2.55 P (mW)
-
Page 164: I5M (Linear)
Acoustic Power Data and Surface Temperature Data 16.3.15 i5M (Linear) Transducer Model: i5M (Linear) Imaging Mode: M-mode Index label Below Below surface surface surface surface Maximum index value 1.28 0.16 0.44 0.48 Index component value 0.16 0.11 0.16 0.44 2.40 pr,α... - Page 165 Acoustic Power Data and Surface Temperature Data Transducer Model: i5M (Linear) Imaging Mode: B-mode/Tissue Harmonic Imaging Index label Below Below surface surface surface surface Maximum index value 1.26 0.07 0.07 0.15 Index component value 0.07 0.07 0.07 0.07 pr,α at z (MPa) 2.37 P (mW)
- Page 166 Acoustic Power Data and Surface Temperature Data Transducer Model: i5M (Linear) Imaging Mode: PW-mode Index label Below Below surface surface surface surface Maximum index value 1.20 1.32 2.26 1.72 Index component value 1.32 0.84 1.07 2.26 pr,α at z (MPa) 2.32 P (mW) 65.57...
- Page 167 Acoustic Power Data and Surface Temperature Data Transducer Model: i5M (Linear) Imaging Mode: Color+B-Mode / Power+B-Mode Index label Below Below At surface surface surface surface Maximum index value 1.26 0.58 0.58 1.27 Index component value 0.58 0.58 0.58 0.58 pr,α at z (MPa) 2.46 P (mW)
-
Page 168: Z5Ms (Linear)
Acoustic Power Data and Surface Temperature Data 16.3.16 z5Ms (Linear) Transducer Model: z5Ms (Linear) Imaging Mode: M-mode Index label Below Below surface surface surface surface Maximum index value 1.30 0.18 0.46 0.52 Index component value 0.18 0.11 0.18 0.46 2.51 pr,α... - Page 169 Acoustic Power Data and Surface Temperature Data Transducer Model: z5Ms (Linear) Imaging Mode: B-mode/Tissue Harmonic Imaging Index label Below Below surface surface surface surface Maximum index value 1.27 0.08 0.08 0.16 Index component value 0.08 0.08 0.08 0.08 pr,α at z (MPa) 2.46 P (mW)
- Page 170 Acoustic Power Data and Surface Temperature Data Transducer Model: z5Ms (Linear) Imaging Mode: PW-mode Index label Below Below surface surface surface surface Maximum index value 1.11 1.50 2.36 1.85 Index component value 1.50 0.93 1.21 2.36 pr,α at z (MPa) 2.24 P (mW) 70.35...
- Page 171 Acoustic Power Data and Surface Temperature Data Transducer Model: z5Ms (Linear) Imaging Mode: Color+B-Mode / Power+B-Mode Index label Below Below At surface surface surface surface Maximum index value 1.23 0.66 0.66 1.36 Index component value 0.66 0.66 0.66 0.66 pr,α at z (MPa) 2.48 P (mW)
-
Page 172: Z5Mt (Linear)
Acoustic Power Data and Surface Temperature Data 16.3.17 z5Mt (Linear) Transducer Model: z5Mt (Linear) Imaging Mode: M-mode Index label Below Below surface surface surface surface Maximum index value 1.28 0.15 0.42 0.48 Index component value 0.15 0.10 0.15 0.42 2.39 pr,α... - Page 173 Acoustic Power Data and Surface Temperature Data Transducer Model: z5Mt (Linear) Imaging Mode: B-mode/Tissue Harmonic Imaging Index label Below Below surface surface surface surface Maximum index value 1.25 0.07 0.07 0.15 Index component value 0.07 0.07 0.07 0.07 pr,α at z (MPa) 2.34 P (mW)
- Page 174 Acoustic Power Data and Surface Temperature Data Transducer Model: z5Mt (Linear) Imaging Mode: PW-mode Index label Below Below surface surface surface surface Maximum index value 1.10 1.33 2.20 1.72 Index component value 1.33 0.84 1.07 2.20 pr,α at z (MPa) 2.13 P (mW) 65.57...
- Page 175 Acoustic Power Data and Surface Temperature Data Transducer Model: z5Mt (Linear) Imaging Mode: Color+B-Mode / Power+B-Mode Index label Below Below At surface surface surface surface Maximum index value 1.20 0.58 0.58 1.27 Index component value 0.58 0.58 0.58 0.58 pr,α at z (MPa) 2.35 P (mW)
-
Page 176: Z5M (Linear)
Acoustic Power Data and Surface Temperature Data 16.3.18 z5M (Linear) Transducer Model: z5M (Linear) Imaging Mode: M-mode Index label Below Below surface surface surface surface Maximum index value 1.27 0.15 0.44 0.48 Index component value 0.15 0.10 0.15 0.44 2.39 pr,α... - Page 177 Acoustic Power Data and Surface Temperature Data Transducer Model: z5M (Linear) Imaging Mode: B-mode/Tissue Harmonic Imaging Index label Below Below surface surface surface surface Maximum index value 1.25 0.07 0.07 0.15 Index component value 0.07 0.07 0.07 0.07 pr,α at z (MPa) 2.35 P (mW)
- Page 178 Acoustic Power Data and Surface Temperature Data Transducer Model: z5M (Linear) Imaging Mode: PW-mode Index label Below Below surface surface surface surface Maximum index value 1.09 1.32 2.25 1.72 Index component value 1.32 0.84 1.06 2.25 pr,α at z (MPa) 2.13 P (mW) 65.57...
- Page 179 Acoustic Power Data and Surface Temperature Data Transducer Model: z5M (Linear) Imaging Mode: Color+B-Mode / Power+B-Mode Index label Below Below At surface surface surface surface Maximum index value 1.20 0.58 0.58 1.27 Index component value 0.58 0.58 0.58 0.58 pr,α at z (MPa) 2.35 P (mW)
-
Page 180: A3Px
Acoustic Power Data and Surface Temperature Data 16.3.19 a3Px Transducer Model: a3Px Imaging Mode: M-mode Index label Below Below surface surface surface surface Maximum index value 1.41 0.07 0.34 0.12 Index component value 0.02 0.07 0.12 0.34 1.88 pr,α at z (MPa) P (mW) 22.00... - Page 181 Acoustic Power Data and Surface Temperature Data Transducer Model: a3Px Imaging Mode: B-mode/Tissue Harmonic Imaging Index label Below Below surface surface surface surface Maximum index value 1.37 0.02 0.13 0.12 Index component value 0.02 0.02 0.13 0.02 pr,α at z (MPa) 1.84 P (mW)
- Page 182 Acoustic Power Data and Surface Temperature Data Transducer Model: a3Px Imaging Mode: PW-mode/TVD-mode Index label Below Below surface surface surface surface Maximum index value 0.82 0.13 0.94 0.18 Index component value 0.02 0.13 0.19 0.94 pr,α at z (MPa) 1.09 P (mW) 30.00 28.00...
- Page 183 Acoustic Power Data and Surface Temperature Data Transducer Model: a3Px Imaging Mode: Color+B-Mode / Power+B-Mode /TVI+B/TEI+B Index label Below Below At surface surface surface surface Maximum index value 1.40 0.03 0.03 0.27 Index component value 0.03 0.03 0.03 0.03 pr,α at z (MPa) 2.00 P (mW)
-
Page 184: E3P
Acoustic Power Data and Surface Temperature Data 16.3.20 e3P Transducer Model: e3P Imaging Mode: M-mode Index label Below Below surface surface surface surface Maximum index value 0.75 0.08 0.43 0.13 Index component value 0.01 0.08 0.13 0.43 0.99 pr,α at z (MPa) P (mW) 22.17... - Page 185 Acoustic Power Data and Surface Temperature Data Transducer Model: e3P Imaging Mode: B-mode/Tissue Harmonic Imaging Index label Below Below surface surface surface surface Maximum index value 0.75 0.02 0.17 0.17 Index component value 0.02 0.02 0.17 0.02 pr,α at z (MPa) 0.99 P (mW)
- Page 186 Acoustic Power Data and Surface Temperature Data Transducer Model: e3P Imaging Mode: PW-mode/TVD-mode Index label Below Below surface surface surface surface Maximum index value 0.77 0.28 1.90 0.58 Index component value 0.05 0.28 0.58 1.90 pr,α at z (MPa) 1.19 P (mW) 79.00 90.12...
- Page 187 Acoustic Power Data and Surface Temperature Data Transducer Model: e3P Imaging Mode: Color+B-Mode / Power+B-Mode /TVI+B/TEI+B Index label Below Below At surface surface surface surface Maximum index value 0.95 0.08 0.08 0.59 Index component value 0.08 0.08 0.08 0.08 pr,α at z (MPa) 1.28 P (mW)
-
Page 188: E3Ps
Acoustic Power Data and Surface Temperature Data 16.3.21 e3Ps Transducer Model: e3Ps Imaging Mode: M-mode Index label Below Below surface surface surface surface Maximum index value 0.74 0.08 0.44 0.13 Index component value 0.01 0.08 0.13 0.44 0.97 pr,α at z (MPa) P (mW) 22.50... - Page 189 Acoustic Power Data and Surface Temperature Data Transducer Model: e3Ps Imaging Mode: B-mode/Tissue Harmonic Imaging Index label Below Below surface surface surface surface Maximum index value 0.74 0.02 0.18 0.18 Index component value 0.02 0.02 0.18 0.02 pr,α at z (MPa) 0.98 P (mW)
- Page 190 Acoustic Power Data and Surface Temperature Data Transducer Model: e3Ps Imaging Mode: PW-mode/TVD-mode Index label Below Below surface surface surface surface Maximum index value 0.73 0.36 1.68 0.52 Index component value 0.07 0.36 0.52 1.68 pr,α at z (MPa) 1.12 P (mW) 102.31 80.09...
- Page 191 Acoustic Power Data and Surface Temperature Data Transducer Model: e3Ps Imaging Mode: Color+B-Mode / Power+B-Mode /TVI+B/TEI+B Index label Below Below At surface surface surface surface Maximum index value 0.90 0.09 0.09 0.62 Index component value 0.09 0.09 0.09 0.09 pr,α at z (MPa) 1.21 P (mW)
-
Page 192: E3Pt
Acoustic Power Data and Surface Temperature Data 16.3.22 e3Pt Transducer Model: e3Pt Imaging Mode: M-mode Index label Below Below surface surface surface surface Maximum index value 0.75 0.08 0.44 0.13 Index component value 0.01 0.08 0.13 0.44 0.99 pr,α at z (MPa) P (mW) 22.23... - Page 193 Acoustic Power Data and Surface Temperature Data Transducer Model: e3Pt Imaging Mode: B-mode/Tissue Harmonic Imaging Index label Below Below surface surface surface surface Maximum index value 0.76 0.02 0.18 0.18 Index component value 0.02 0.02 0.18 0.02 pr,α at z (MPa) 1.00 P (mW)
- Page 194 Acoustic Power Data and Surface Temperature Data Transducer Model: e3Pt Imaging Mode: PW-mode/TVD-mode Index label Below Below surface surface surface surface Maximum index value 0.79 0.40 1.89 0.57 Index component value 0.07 0.40 0.57 1.89 pr,α at z (MPa) 1.21 P (mW) 113.14 88.57...
- Page 195 Acoustic Power Data and Surface Temperature Data Transducer Model: e3Pt Imaging Mode: Color+B-Mode / Power+B-Mode /TVI+B/TEI+B Index label Below Below At surface surface surface surface Maximum index value 0.93 0.09 0.09 0.62 Index component value 0.09 0.09 0.09 0.09 pr,α at z (MPa) 1.26 P (mW)
-
Page 196: Z3P
Acoustic Power Data and Surface Temperature Data 16.3.23 z3P Transducer Model: z3P Imaging Mode: M-mode Index label Below Below surface surface surface surface Maximum index value 1.48 0.07 0.34 0.12 Index component value 0.02 0.07 0.12 0.34 pr,α at z (MPa) 2.06 P (mW) - Page 197 Acoustic Power Data and Surface Temperature Data Transducer Model: z3P Imaging Mode: B-mode/Tissue Harmonic Imaging Index label Below Below surface surface surface surface Maximum index value 1.49 0.02 0.13 0.12 Index component value 0.02 0.02 0.13 0.02 pr,α at z (MPa) 2.09 P (mW)
- Page 198 Acoustic Power Data and Surface Temperature Data Transducer Model: z3P Imaging Mode: PW-mode/TVD-mode Index label Below Below surface surface surface surface Maximum index value 0.88 0.13 0.93 0.18 Index component value 0.03 0.13 0.19 0.93 pr,α at z (MPa) 1.22 P (mW) 30.00 28.00...
- Page 199 Acoustic Power Data and Surface Temperature Data Transducer Model: z3P Imaging Mode: Color+B-Mode / Power+B-Mode /TVI+B/TEI+B Index label Below Below At surface surface surface surface Maximum index value 1.50 0.03 0.03 0.27 Index component value 0.03 0.03 0.03 0.03 pr,α at z (MPa) 2.22 P (mW)
-
Page 200: Z3Ps
Acoustic Power Data and Surface Temperature Data 16.3.24 z3Ps Transducer Model: z3Ps Imaging Mode: M-mode Index label Below Below surface surface surface surface Maximum index value 1.53 0.07 0.36 0.12 Index component value 0.02 0.07 0.12 0.36 pr,α at z (MPa) 2.03 P (mW) - Page 201 Acoustic Power Data and Surface Temperature Data Transducer Model: z3Ps Imaging Mode: B-mode/Tissue Harmonic Imaging Index label Below Below surface surface surface surface Maximum index value 1.49 0.02 0.13 0.12 Index component value 0.02 0.02 0.13 0.02 pr,α at z (MPa) 1.98 P (mW)
- Page 202 Acoustic Power Data and Surface Temperature Data Transducer Model: z3Ps Imaging Mode: PW-mode/TVD-mode Index label Below Below surface surface surface surface Maximum index value 0.89 0.13 1.01 0.18 Index component value 0.02 0.13 0.19 1.01 pr,α at z (MPa) 1.17 P (mW) 30.00 28.00...
- Page 203 Acoustic Power Data and Surface Temperature Data Transducer Model: z3Ps Imaging Mode: Color+B-Mode / Power+B-Mode /TVI+B/TEI+B Index label Below Below At surface surface surface surface Maximum index value 1.52 0.03 0.03 0.27 Index component value 0.03 0.03 0.03 0.03 pr,α at z (MPa) 2.14 P (mW)
-
Page 204: Z3Pt
Acoustic Power Data and Surface Temperature Data 16.3.25 z3Pt Transducer Model: z3Pt Imaging Mode: M-mode Index label Below Below At surface surface surface surface Maximum index value 1.49 0.07 0.36 0.12 Index component value 0.02 0.07 0.12 0.36 pr,α at z (MPa) 1.98 P (mW) - Page 205 Acoustic Power Data and Surface Temperature Data Transducer Model: z3Pt Imaging Mode: B-mode/Tissue Harmonic Imaging Index label Below Below surface surface surface surface Maximum index value 1.45 0.02 0.13 0.12 Index component value 0.02 0.02 0.13 0.02 pr,α at z (MPa) 1.94 P (mW)
- Page 206 Acoustic Power Data and Surface Temperature Data Transducer Model: z3Pt Imaging Mode: PW-mode/TVD-mode Index label Below Below surface surface surface surface Maximum index value 0.87 0.13 1.00 0.18 Index component value 0.02 0.13 0.19 1.00 pr,α at z (MPa) 1.15 P (mW) 30.00 28.00...
- Page 207 Acoustic Power Data and Surface Temperature Data Transducer Model: z3Pt Imaging Mode: Color+B-Mode / Power+B-Mode /TVI+B/TEI+B Index label Below Below At surface surface surface surface Maximum index value 1.48 0.03 0.03 0.27 Index component value 0.03 0.03 0.03 0.03 pr,α at z (MPa) 2.10 P (mW)
- Page 208 This page intentionally left blank.
-
Page 209: Indications For Use
Indications For Use Indications For Use Intended Use: Diagnostic ultrasound imaging or fluid flow analysis of the human body as follows: Clinical Application Mode of Operation General(Track 1 Specific (Track Color Power Combined Other (Specify) Only) 1 & 3) Doppler Doppler (specify) Ophthalmic... - Page 210 Indications For Use Transducer: i3P,i3PA, z3P、z3Ps、z3Pt、e3P、e3Ps、e3Pt、a3Px Intended Use: Diagnostic ultrasound imaging or fluid flow analysis of the human body as follows: Clinical Application Mode of Operation General(Track 1 Specific (Track 1 & 3) Color Power Combined Other (Specify) Only) Doppler Doppler (specify) Ophthalmic...
- Page 211 Indications For Use Transducer: i5M, z5M、z5Ms、z5Mt、e5M、e5Ms、e5Mt、a5Mx(linear) Intended Use: Diagnostic ultrasound imaging or fluid flow analysis of the human body as follows: Clinical Application Mode of Operation General(Track 1 Only) Specific (Track 1 & 3) Color Combined Power Doppler Other (Specify) Doppler (specify) Ophthalmic...
- Page 212 Indications For Use Transducer: i5M, z5M、z5Ms、z5Mt、e5M、e5Ms、e5Mt、a5Mx(convex) Intended Use: Diagnostic ultrasound imaging or fluid flow analysis of the human body as follows: Clinical Application Mode of Operation General(Track 1 Only) Specific (Track Color PWD CWD Power Doppler Combined (specify) Other (Specify) 1 &...
- Page 214 PN: 046-024376-02 (1.0)
Need help?
Do you have a question about the TE Air and is the answer not in the manual?
Questions and answers