Table of Contents
Advertisement
Quick Links
Advertisement
Chapters
Table of Contents

Related Manuals for Rohde & Schwarz ESR


Summary of Contents for Rohde & Schwarz ESR
- Page 1 ® R&S EMI Test Receiver User Manual (;ÙÔÒ2) 1175706802 Version 13...
- Page 2 Rohde & Schwarz GmbH & Co. KG. Trade names are trademarks of the owners. ® 1175.7068.02 | Version 13 | R&S Throughout this manual, products from Rohde & Schwarz are indicated without the ® symbol , e.g. R&S ® ESR is indicated as R&S ESR.
-
Page 3: Table Of Contents
® Contents R&S Contents 1 Safety and Regulatory Information............ 19 Safety Instructions......................19 Warning Messages in the Documentation..............22 Korea certification class A..................22 2 Documentation Overview..............23 Getting Started Manual....................23 User Manuals and Help....................23 Service Manual......................23 Instrument Security Procedures................24 Basic Safety Instructions................... - Page 4 Unpacking and Checking................... 36 Choosing the Operating Site..................37 Setting up the R&S ESR..................... 37 Placing the R&S ESR on a Bench Top..............37 Mounting the R&S ESR in a Rack................38 Connecting the AC Power..................39 Connecting to a DC Power Source (Optional)............39 Switching the Instrument On and Off................40...
- Page 5 ® Contents R&S 7 Basic Operations..................51 Information in the Diagram Area................51 7.1.1 Channel Display......................52 7.1.2 Display of Hardware Settings..................53 7.1.3 Measurement Settings Information................54 7.1.4 Diagram-specific and Trace Information............... 55 7.1.5 Instrument and Status Information................57 Means of User Interaction..................58 7.2.1 Toolbar..........................
- Page 6 ® Contents R&S 8 Basic Measurement Examples............81 Measuring a Sinusoidal Signal.................. 81 8.1.1 Measuring the Level and Frequency Using Markers.............81 8.1.1.1 Increasing the Frequency Resolution................82 8.1.1.2 Setting the Reference Level..................83 8.1.2 Measuring the Signal Frequency Using the Frequency Counter........84 Measuring Harmonics of Sinusoidal Signals............
- Page 7 ® Contents R&S 10.1.3.1 Stepped Scans in the Frequency Domain..............115 10.1.3.2 Time Domain Scans in the Frequency Domain............116 10.1.3.3 The Scan Table......................116 10.1.3.4 Scan on a Fixed Frequency..................118 10.1.4 Peak List and Data Reduction..................118 10.1.5 Final Measurement..................... 120 10.1.6 Spectrogram........................121 10.1.6.1...
- Page 8 ® Contents R&S 10.3.6 Controlling Inputs and Outputs..................157 10.3.7 Test Automation......................158 10.3.7.1 Overview........................158 10.3.7.2 Scan Table........................160 10.3.7.3 Peak Search........................162 10.3.7.4 Peak Lists........................164 10.3.7.5 Trace / Final Meas.......................166 10.3.7.6 LISN Settings......................166 10.4 Common Analysis Functions...................168 10.4.1 Trace Configuration.....................168 10.4.2 Markers........................
- Page 9 ® Contents R&S 11.1.1.7 Measuring the Power in Zero Span................264 11.1.1.8 Performing EMI Measurements.................. 267 11.1.1.9 CISPR APD Measurement (Amplitude Probability Distribution)........277 11.1.1.10 Calculating Signal Amplitude Statistics............... 282 11.1.1.11 Measuring the Third Order Intercept Point (TOI)............300 11.1.1.12 Measuring the AM Modulation Depth................306 11.1.1.13 Measuring Harmonic Distortion...................307 11.1.2...
- Page 10 ® Contents R&S 11.2.7 Configuring the Sweep Mode – SWEEP Key..............339 11.2.7.1 Softkeys of the Sweep Menu..................339 11.2.7.2 Specifying the Sweep Settings..................344 11.2.8 Triggering the Sweep – TRIG Key................344 11.2.8.1 Softkeys of the Trigger Menu..................344 11.2.8.2 Specifying the Trigger Settings................... 351 11.2.8.3 Using Gated Sweep Operation...................
- Page 11 13 Tracking Generator................446 13.1 Softkeys of the Tracking Generator Menu.............. 446 13.2 Connecting External Tracking Generators............. 451 13.2.1 Overview of Generators Supported by the R&S ESR..........452 13.3 Configuring Tracking Generators................455 13.3.1 Internal Tracking Generator..................455 13.3.2 External Tracking Generator..................457 13.4...
- Page 12 ® Contents R&S 14.1 Manual Operation – Local Menu................472 14.2 User-Defined Menu – USER key................473 14.3 Instrument Setup and Interface Configuration – SETUP Key....... 474 14.3.1 Softkeys of the Setup Menu..................475 15 Data Management and Documentation..........499 15.1 Saving and Recalling Settings Files –...
- Page 13 The IECWIN tool......................563 16.2 Controlling the R&S ESR Remotely................ 565 16.2.1 Setting Up Windows Remote Desktop................ 565 16.2.1.1 Configuring the R&S ESR for Remote Operation............566 16.2.1.2 Configuring the Controller................... 567 16.2.1.3 Starting and Terminating Remote Operation...............569 16.2.1.4 Deactivating the R&S ESR via Remote Operation............571 16.2.2...
- Page 14 ® Contents R&S 16.4.1 Measurements and Result Displays................605 16.4.1.1 Display Configuration....................605 16.4.1.2 Bargraph Control......................606 16.4.1.3 Scan Control....................... 608 16.4.1.4 Final Measurements and Automated Test Sequence Control........610 16.4.1.5 Trace Data and Result Query..................612 16.4.1.6 Fixed Frequency Scans....................616 16.4.1.7 Demodulating Analog Signals..................616 16.4.1.8 Spectrogram Control....................
- Page 15 ® Contents R&S 16.5.1.4 Measuring Spurious Emissions...................717 16.5.1.5 Testing Against a Spectrum Emission Mask............... 728 16.5.1.6 Performing EMI Measurements.................. 747 16.5.1.7 Measuring the Modulation Depth................753 16.5.1.8 Measuring the Harmonic Distortion................755 16.5.1.9 Measuring the Carrier-to-Noise Ratio................. 759 16.5.1.10 Measuring the Third Order Intercept Point..............759 16.5.1.11 Measuring Statistics....................
- Page 16 Checking the System Configuration................893 16.9.3 Coupling Parameters....................896 16.9.4 Controlling In- and Ouputs..................900 16.9.5 Configuring the Reference Frequency................ 903 16.9.6 Calibrating the R&S ESR.................... 904 16.9.7 Using Service Functions..................... 907 16.10 Data Management..................... 909 16.10.1 Managing Data Files....................909 16.10.2 Saving and Restoring Customized Data..............
- Page 17 ® Contents R&S 16.16.5 Controlling the Negative Transition Part..............966 16.16.6 Controlling the Positive Transition Part............... 966 16.17 Remote Control – Programming Examples............967 16.17.1 Service Request......................968 16.17.1.1 Initiate Service Request....................968 16.17.1.2 Waiting for the Arrival of a Service Request..............970 16.17.1.3 Waiting Without Blocking the Keyboard and Mouse...........
- Page 18 ® Contents R&S 16.17.14 Averaging I/Q Data....................1002 16.17.15 Using IQ Gating......................1003 16.17.16 Usage of Four Spectrum Instances................1008 16.18 GPIB Commands of HP Models 856xE, 8566A/B, 8568A/B and 8594E....1010 16.18.1 GPIB languages......................1010 16.18.2 Command set of models 8560E, 8561E, 8562E, 8563E, 8564E, 8565E, 8566A/B, 8568A/B, 8591E, 8594E, 71100C, 71200C, and 71209A.........
-
Page 19: Safety And Regulatory Information
® Safety and Regulatory Information R&S Safety Instructions 1 Safety and Regulatory Information The product documentation helps you use the product safely and efficiently. Follow the instructions provided here and in the following chapters. Intended use The product is intended for the development, production and verification of electronic components and devices in industrial, administrative, and laboratory environments. - Page 20 ® Safety and Regulatory Information R&S Safety Instructions move or carry the product. Do not lift by the accessories mounted on the product. Accessories are not designed to carry the weight of the product. To move the product safely, you can use lifting or transporting equipment such as lift trucks and forklifts.
- Page 21 ® Safety and Regulatory Information R&S Safety Instructions ● Only use intact cables and route them carefully so that they cannot be damaged. Check the power cables regularly to ensure that they are undamaged. Also ensure that nobody can trip over loose cables. ●...
-
Page 22: Warning Messages In The Documentation
® Safety and Regulatory Information R&S Korea certification class A 1.2 Warning Messages in the Documentation A warning message points out a risk or danger that you need to be aware of. The sig- nal word indicates the severity of the safety hazard and how likely it will occur if you do not follow the safety precautions. -
Page 23: Documentation Overview
R&S ESR product page at: www.rohde-schwarz.com/manual/esr 2.1 Getting Started Manual Introduces the R&S ESR and describes how to set up and start working with the prod- uct. Includes basic operations, typical measurement examples, and general informa- tion, e.g. safety instructions, etc. -
Page 24: Instrument Security Procedures
Application Notes, Application Cards, White Papers, etc. https://gloris.rohde-schwarz.com). 2.4 Instrument Security Procedures Deals with security issues when working with the R&S ESR in secure areas. It is avail- able for download on the Internet. 2.5 Basic Safety Instructions Contains safety instructions, operating conditions and further important information. -
Page 25: Conventions Used In The Documentation
® Conventions Used in the Documentation R&S Notes on Screenshots 3 Conventions Used in the Documentation 3.1 Typographical Conventions The following text markers are used throughout this documentation: Convention Description "Graphical user interface ele- All names of graphical user interface elements on the screen, such as ments"... -
Page 26: Instrument Tour
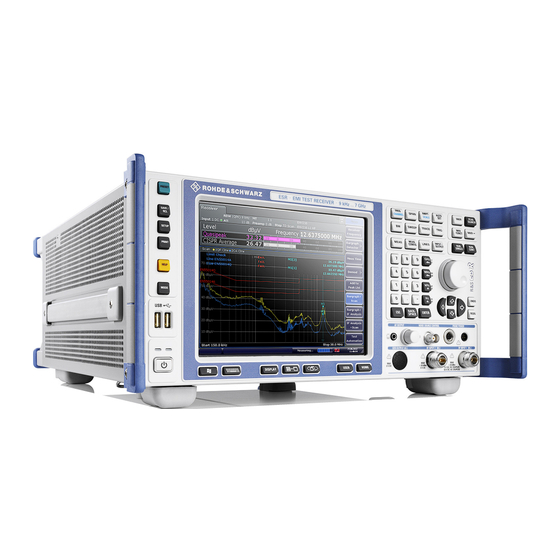
4 Instrument Tour On the instrument tour, you can learn about the different control elements and connec- tors on the front and back panel of the R&S ESR. 4.1 The Front Panel The front panel of the R&S ESR is shown in Figure 4-1. -
Page 27: Touchscreen Display
The Front Panel 4.1.1 Touchscreen Display The touchscreen on the front panel of the R&S ESR displays the measurement results. Additionally, the screen display provides status and setting information and allows you to switch between various measurement tasks. The screen is touch-sensitive, offering an alternative means of user interaction for quick and easy handling of the instrument. -
Page 28: Function Keys On The Front Panel
6 "Instrument Functions" of the Operating Manual. Table 4-1: Function keys Turns the instrument on and off. Restores the default configuration of the R&S ESR. Provides functionality to save, restore and manage instrument settings and other files. - Page 29 ® Instrument Tour R&S The Front Panel Selects alphanumeric characters. Opens a dialog box to turn screen elements on or off. Switches between maximized and split display of focus area. Switches focus area between table and diagram. Allows you to define and use softkeys to load custom configurations. Opens the root menu of the current application.
-
Page 30: Usb Interface
● the scan and final measurement (in Receiver mode) ● the AF demodulation (in Receiver mode) ● IF analysis (in Receiver mode with option R&S ESR-K56) ● the realtime spectrum (in Realtime mode) ● the spectrogram measurement (in Realtime mode) ●... -
Page 31: Noise Source Control
The R&S ESR provides two RF inputs for connection of a device under test (DUT) to the R&S ESR. The DUT is connected to the RF Input via cable and an approriate con- nector (for example a male N connector). -
Page 32: Tracking Generator Output (Optional)
Rear Panel View 4.1.8 Tracking Generator Output (Optional) The R&S ESR is equipped with an optional tracking generator and therefore provides a tracking generator output connector. The output of the tracking generator is connected to the DUT via a cable equipped with a male N connector. -
Page 33: Ac Power Supply Connection And Main Power Switch
39. 4.2.2 LAN The LAN interface can be used to connect the R&S ESR to a local network for remote control, printouts and data transfer. The assignment of the RJ-45 connector supports twisted-pair category 5 UTP/STP cables in a star configuration (UTP stands for unshielded twisted pair, and STP for shielded twisted pair). -
Page 34: Gpib Interface
You can control the trigger output with the functionality provided in the "In-/Output" menu ([INPUT/OUTPUT] key). The trigger output also controls signals by the frequency mask trigger available in real- time mode (R&S ESR-K55). 4.2.9 IF / Video The female BNC connector can be used for various outputs: ●... -
Page 35: Ocxo Option (R&S Fsv-B4)
4.2.13 Device ID The unique device identifier is provided as a barcode sticker on the rear panel of the R&S ESR. It consists of the device order number and a serial number. The serial number is used to define the default instrument name, which is: <Type><variant>-<serial_number>... -
Page 36: Preparing For Use
Unpacking and Checking..................36 ● Choosing the Operating Site................... 37 ● Setting up the R&S ESR..................37 ● Placing the R&S ESR on a Bench Top..............37 ● Mounting the R&S ESR in a Rack................38 ● Connecting the AC Power..................39 ●... -
Page 37: Choosing The Operating Site
● "Intended use" on page 19 5.5 Placing the R&S ESR on a Bench Top To place the product on a bench top 1. Place the product on a stable, flat and level surface. Ensure that the surface can support the weight of the product. For information on the weight, see the data sheet. -
Page 38: Mounting The R&S Esr In A Rack
Mount the adapter kit. Follow the assembly instructions provided with the adapter kit. 2. Lift the R&S ESR to shelf height. 3. Grab the handles and push the R&S ESR onto the shelf until the rack brackets fit closely to the rack. User Manual 1175.7068.02 ─ 13... -
Page 39: Connecting The Ac Power
1. Loosen the screws at the rack brackets. 2. Remove the R&S ESR from the rack. 3. If placing the R&S ESR on a bench top again, unmount the adapter kit from the R&S ESR. Follow the instructions provided with the adapter kit. -
Page 40: Switching The Instrument On And Off
Ready green To switch on the R&S ESR The R&S ESR is off but connected to power. 1. Set the switch on the power supply to position [I]. Chapter 4.2.1, "AC Power Supply Connection and Main Power Switch", on page 33. -
Page 41: Connecting To Lan
The operating system shuts down. The LED changes to orange. If the instrument temperature exceeds the limit specified in the data sheet, the R&S ESR automatically shuts down to protect the instrument from damage. To disconnect from power The R&S ESR is in the standby state. -
Page 42: Connecting A Keyboard
Changing IP addresses ● Exchanging hardware Errors can affect the entire network. Connect the R&S ESR to the LAN via the LAN interface on the rear panel of the instrument. Windows automatically detects the network connection and activates the required drivers. -
Page 43: Windows Operating System
6. In the configuration dialog box, you can switch from the internal monitor (laptop icon) to the external monitor (monitor icon), or both (double monitor icon). If the external monitor is selected, the R&S ESR display is disabled. The screen content (measurement screen) formerly displayed on the R&S ESR is displayed on the external screen. -
Page 44: Logging On
5.14 Logging On Microsoft Windows requires that users identify themselves by entering a user name and password in a login window. By default, the R&S ESR provides two user accounts: ● "NormalUser": a standard user account with limited access... - Page 45 In this case, you must enter the new password manually to log on. Deactivating the automatic login function 1. Select the "Windows" icon on the front panel to access the operating system of the R&S ESR (see also "To access the "Start" menu" on page 44).
-
Page 46: Checking The Supplied Options
However, you can switch the user account to be used even when the auto-login function is active. 1. Select the "Windows" icon on the front panel to access the operating system of the R&S ESR (see also "To access the "Start" menu" on page 44). -
Page 47: Considerations For Test Setup
Information on signal levels is provided in the data sheet and on the instrument, next to the connector. Keep the signal levels within the specified ranges to avoid damage to the R&S ESR and connected devices. User Manual 1175.7068.02 ─ 13... -
Page 48: Firmware Update And Installation Of Firmware Options
® Firmware Update and Installation of Firmware Options R&S Firmware Update 6 Firmware Update and Installation of Firm- ware Options This chapter describes how to update the firmware and how to activate optional firm- ware packages. Updating the firmware or installing optional firmware requires administrator rights (see Chapter 5.13, "Windows Operating System", on page 43). -
Page 49: Activating Firmware Options
® Firmware Update and Installation of Firmware Options R&S Activating Firmware Options Performing a remote installation from a Windows PC This method requires a LAN connection from the instrument to a Windows PC (see Chapter 16.2.4.1, "Connecting the instrument to the network", on page 573). - Page 50 With time-limited licenses, a message box appears if an option is about to expire. Press the "OK" button to resume using the R&S ESR. If an option has already expired, a message box appears for you to confirm. In this case, all instrument functions are unavailable (including remote control) until the R&S ESR is rebooted.
-
Page 51: Basic Operations
Information in the Diagram Area 7 Basic Operations This chapter gives an overview on how to work with the R&S ESR. It describes what kind of information is displayed in the diagram area, how to operate the R&S ESR via the front panel keys and other interaction methods, and how to use the Online Help. -
Page 52: Channel Display
11 = Softkeys 7.1.1 Channel Display Using the R&S ESR you can handle several different measurement tasks (channels) at the same time (although they can only be performed asynchronously). For each chan- nel, a separate tab is displayed on the screen. In order to switch from one channel dis- play to another, simply press the corresponding tab. -
Page 53: Display Of Hardware Settings
All settings that are displayed in the channel bar can easily be edited by touching the setting in the display (with a finger or mouse pointer). The corresponding (edit) dialog box is displayed where you can edit the setting. In receiver mode, the R&S ESR shows the following settings: Demod Active AF demodulation. -
Page 54: Measurement Settings Information
In Receiver mode, the R&S ESR shows the following information. Trigger source (for details see trigger settings in the "TRIG" menu in the Operating manual) ●... -
Page 55: Diagram-Specific And Trace Information
® Basic Operations R&S Information in the Diagram Area Label Description The sweep is set to single sweep mode. Sweep Count The current signal count for measurement tasks that involve a specific number of subse- quent sweeps (see "Sweep Count" setting in "Sweep" menu in the Operating manual) Trigger source (for details see trigger settings in the "TRIG"... - Page 56 ® Basic Operations R&S Information in the Diagram Area Trace color Color of trace display in diagram Trace no. Trace number (1 to 6) Detector Selected detector: AUTOPEAK detector MAX PEAK detector MIN PEAK detector SAMPLE detector AVERAGE detector RMS detector QUASIPEAK detector CISPR Average detector RMS Average detector...
-
Page 57: Instrument And Status Information
® Basic Operations R&S Information in the Diagram Area Signal track active NOIse Noise measurement active MDepth Measurement of the AM modulation depth active TOI measurement active Marker Information in Marker Table In addition to the marker information displayed within the diagram grid, a separate marker table may be displayed beneath the diagram. -
Page 58: Means Of User Interaction
® Basic Operations R&S Means of User Interaction Hiding the status bar You can hide the status bar display, e.g. in order to enlarge the display area for the measurement results. 1. Press the [DISPLAY] key. 2. In the "Display Settings" dialog box, select "Status Bar State: Off". The status bar is no longer displayed. -
Page 59: Toolbar
® Basic Operations R&S Means of User Interaction All tasks necessary to operate the instrument can be performed using this user inter- face. Apart from instrument specific keys, all other keys that correspond to an external keyboard (e.g. arrow keys, ENTER key) operate conform to Microsoft. For most tasks, there are at least 2 alternative methods to perform them: ●... -
Page 60: Touchscreen
® Basic Operations R&S Means of User Interaction Icon Description Prints the current measurement screen Saves the current measurement screen as a file (screenshot) Reverts last operation. Repeats previously reverted operation. Selection mode: the cursor can be used to select (and move) markers in a zoomed display Zoom mode: displays a dotted rectangle in the diagram that can be expanded to define the zoom area. -
Page 61: On-Screen Keyboard
® Basic Operations R&S Means of User Interaction 7.2.3 On-screen Keyboard The on-screen keyboard is an additional means of interacting with the instrument with- out having to connect an external keyboard. The on-screen keyboard display can be switched on and off as desired using the "On- Screen Keyboard"... -
Page 62: Rotary Knob
® Basic Operations R&S Means of User Interaction In the case of level entries (e.g. in dB) or dimensionless values, all units have the value "1" as mulitplying factor. Thus, they have the same function as an ENTER key. The same is true for an alphanumeric entry. ●... -
Page 63: Arrow Keys, Undo/Redo Keys
® Basic Operations R&S Means of User Interaction 7.2.6 Arrow Keys, UNDO/REDO Keys The arrow keys are used for navigation. The [UNDO]/[REDO] keys support you during input. UPARROW/DNARROW keys The [UPARROW] or [DNARROW] keys do the following: ● In a numeric edit dialog box, increase or decrease the instrument parameter. ●... -
Page 64: Softkeys
® Basic Operations R&S Means of User Interaction 7.2.7 Softkeys Softkeys are virtual keys provided by the software. Thus, more functions can be provi- ded than those that can be accessed directly via the function keys on the device. Soft- keys are dynamic, i.e. -
Page 65: Context-Sensitive Menus
® Basic Operations R&S Means of User Interaction Hiding softkeys You can hide the softkey display, e.g. when using remote control, in order to enlarge the display area for the measurement results. When you press a function key on the front panel, the softkeys are displayed temporarily, enabling you to perform a certain task with the softkeys. -
Page 66: Dialog Boxes
► To close the menu, press the ESC key or click in the display outside of the menu. 7.2.9 Dialog Boxes In most cases, the R&S ESR dialog boxes are designed to enter a numeric value. In the documentation, these dialog boxes are called "edit dialog boxes". Dialog boxes that are not only designed for parameter entry have a more complex structure and, in the documentation, are called "dialog boxes". -
Page 67: Setting Parameters
The optional third line shows status and error messages which always refer to the current entry. 7.3 Setting Parameters This section describes how to perform the following basic tasks in the R&S ESR: ● Chapter 7.3.1, "Entering Numeric Parameters",... - Page 68 ® Basic Operations R&S Setting Parameters Alternatively, you can use the keypad. Every alphanumeric key provides several char- acters and one number. The decimal point key (.) provides special characters, and the sign key (-) toggles between capital and small letters. For the assignment refer to Table 7-2.
-
Page 69: Navigating In Dialog Boxes
® Basic Operations R&S Setting Parameters Key name Series of (special) characters and number provided (upper inscription) D E F 9 É G H I 4 J K L 5 M N O 6 Ň Ö P Q R S 1 T U V 2 Ü... - Page 70 ® Basic Operations R&S Setting Parameters Changing the focus The focus on the graphical user interface is moved by pressing an element on the screen, or via the rotary knob. The focused area is marked with a blue frame (see Fig- 7-3).
- Page 71 In some cases, e.g. if you want to install a printer, original Windows dialog boxes are used. In these dialog boxes, the navigation behavior is different to the one you are used to from R&S ESR applications. In the following, the important differences and useful tips are listed:...
-
Page 72: Changing The Display
When working with an external monitor or operating via remote control on a computer, it is useful to be able to interact with the R&S ESR without requiring the keypad and keys located on the front panel of the instrument. Therefore, a "Soft Front Panel" dis- play is available, which simulates the entire front panel of the instrument (except for the external connectors) on the screen. - Page 73 This window can be closed auto- matically after pressing a key, or remain open, as desired. Using the Mini Front Panel, the R&S ESR interface is fully operable from a monitor with a resolution of 1024x768 pixels.
- Page 74 ® Basic Operations R&S Changing the Display Working with the Soft Front Panel Basic operation with the soft Front Panel is identical to normal operation. To activate a key, either press the key on the touchscreen, or click on it with the mouse pointer. To simulate the use of the rotary knob, use the additional keys displayed between the key- pad and the arrow keys: Icon...
-
Page 75: Enlarging The Display Area
® Basic Operations R&S Changing the Display Auto close option By default, the "Auto close" option is activated and the Mini Front Panel window closes automatically after you select a key. This is useful if you only require the Front Panel display to press a single function key. -
Page 76: Displaying The Toolbar
® Basic Operations R&S Changing the Display 7.4.5 Displaying the Toolbar Standard file functions can be performed via the icons in the toolbar at the top of the screen (see the Chapter 7.2.1, "Toolbar", on page 59). By default, this toolbar is not displayed. - Page 77 ® Basic Operations R&S Changing the Display 3. Drag the lower right corner of the rectangle (either via touchscreen or a mouse pointer) to define the area in the diagram to be enlarged. 4. Repeat these steps, if necessary, to enlarge the diagram further. Scrolling in the zoomed display You can scroll the diagram area to display the entire diagram using the scrollbars at the right and at the bottom of the diagram.
-
Page 78: Adding A Title To The Diagram Header
® Basic Operations R&S Changing the Display To return to selection mode in the diagram While you are in zoom mode, touching the screen changes the zoom area. In order to select or move a trace or marker, you must switch back to selection mode: ►... -
Page 79: Selecting A Theme
® Basic Operations R&S Changing the Display 3. Press the "Annotation On/Off" softkey. The footer is displayed beneath the diagram or removed from display. 7.4.9 Selecting a Theme You can select a theme for the screen display. The theme defines the colors used for keys and screen elements, for example. -
Page 80: Changing The Display Update Rate
® Basic Operations R&S Changing the Display 7.4.11 Changing the Display Update Rate When performance is poor due to slow data transfer (for example during remote con- trol), it may be helpful to decrease the frequency with which the screen display is upda- ted. -
Page 81: Basic Measurement Examples
If you measure signals higher than +30 dBm (= 1 W), insert a power attenuator before the RF input of the analyzer. 2. Connect the RF output of the signal generator to the RF input of R&S ESR. Table 8-1: Signal generator settings (e.g. R&S SMU) -
Page 82: Increasing The Frequency Resolution
® Basic Measurement Examples R&S Measuring a Sinusoidal Signal 1. Reset the instrument by pressing the [PRESET] key. 2. Select "Spectrum" mode. 3. Connect the signal to be measured to the RF INPUT analyzer input on the instru- ment front panel. 4. -
Page 83: Setting The Reference Level
Low Reference Levels If the selected reference level is lower than the highest signal that occurs in the spec- trum, the signal path in the R&S ESR is overloaded. In this case, the message "IFOVL" is displayed in the error message field. -
Page 84: Measuring The Signal Frequency Using The Frequency Counter
The frequency sweep is stopped at the marker, and the R&S ESR measures the frequency of the signal at the marker position. In the following example, the frequency of the generator at 128 MHz is shown by using the marker. -
Page 85: Measuring Harmonics Of Sinusoidal Signals
Measuring the Suppression of the First and Second Harmonic of an Input Signal 1. Set the signal analyzer to the default state by pressing the [PRESET] key. The R&S ESR is in the default state. User Manual 1175.7068.02 ─ 13... - Page 86 Press the "Start" softkey and enter 100 MHz. c) Press the "Stop" softkey and enter 400 MHz. The R&S ESR displays the fundamental and the first and second harmonics of the input signal. 4. To average (smooth) the noise, reduce the video bandwidth.
- Page 87 ® Basic Measurement Examples R&S Measuring Harmonics of Sinusoidal Signals Figure 8-2: Measuring the harmonic suppression of the internal reference generator. Delta markers D2 [1] and D3 [1] show the offset of the first and second harmonics from the fundamental. Reducing Noise The signal analyzer offers three methods to differentiate the harmonics of a signal from the noise effectively:...
- Page 88 ® Basic Measurement Examples R&S Measuring Harmonics of Sinusoidal Signals This smoothes the noise significantly, and the sweep time is increased to 200 ms. In other words, the measurement will take significantly more time. The video band- width that is displayed is marked with a bullet to indicate that it is no longer coupled to the resolution bandwidth (see Figure 8-3).
-
Page 89: Measuring Signal Spectra With Multiple Signals
® Basic Measurement Examples R&S Measuring Signal Spectra with Multiple Signals Reducing the noise by reducing the measurement bandwidth The noise is reduced in proportion to the bandwidth by reducing the resolution band- width, i.e. reducing the resolution bandwidth by a factor of 10 also reduces the noise by a factor of 10 (which corresponds to 10 dB). - Page 90 128,03 MHz 1. Set the signal analyzer to the default state by pressing the [PRESET] key. The R&S ESR is set to its default state. 2. Select "Spectrum" mode. 3. Set the center frequency to 128.015 MHz and the frequency span to 300 kHz.
- Page 91 The level drop is located exactly in the center of the screen only if the generator frequencies match the frequency display of the R&S ESR exactly. To achieve exact matching, the frequencies of the generators and the R&S ESR must be synchron- ized.
- Page 92 ® Basic Measurement Examples R&S Measuring Signal Spectra with Multiple Signals Figure 8-5: Measurement of two equally-leveled RF sinusoidal signals with a resolution band- width which is larger than their frequency spacing Note: Reducing the resolution bandwidth. The resolution bandwidth (RBW) can be reduced again by turning the rotary knob counterclockwise, thus yielding a higher frequency resolution.
-
Page 93: Measuring The Modulation Depth Of An Am-Modulated Carrier (Span > 0)
Since the dynamic range of a signal ana- lyzer is very large, extremely small modulation depths can also be measured precisely. For this purpose, the R&S ESR provides measurement routines that output the modu- lation depth numerically in % directly. -
Page 94: Measuring Am-Modulated Signals
Press the "More" key. c) Press the "AM Mod Depth" softkey. The R&S ESR automatically sets a marker to the carrier signal in the center of the diagram and one delta marker each to the upper and lower AM sidebands. - Page 95 Press the "Trg/Gate Level" softkey and enter 50%. The trigger level is displayed as a horizontal line across the entire measure- ment diagram. The R&S ESR displays the 1 kHz AF signal as a static image in zero span. Use a headset to listen to the AF.
-
Page 96: Measurements In Zero Span
Press the [SPAN] key and enter 0 Hz, or press the "Zero Span" softkey. 4. Set the reference level of the R&S ESR to 10 dBm (= level of the signal generator +10 dB) and set the attenuation to 20 dB. - Page 97 Press the "Trg/Gate Source" softkey and select "Video" using the arrow keys. c) Press the "Trg/Gate Level" softkey and enter 70%. The R&S ESR shows a static image with the GSM burst at the start of the trace. The trigger level is displayed as a horizontal line labeled with the abso- lute level for the trigger threshold in the measurement diagram.
-
Page 98: Measuring The Edges Of A Gsm Burst With High Time Resolution
Measuring the Edges of a GSM Burst with High Time Resolution Because of the high time resolution of the R&S ESR at the 0 Hz display range, the edges of TDMA bursts can be measured precisely. The edges can be shifted to the screen area by using the trigger offset. - Page 99 By turning the rotary knob counterclockwise, move the trigger offset until the burst edge can be seen in the center of the screen, or enter -50 µs. The R&S ESR displays the rising edge of the GSM burst. Figure 8-9: Rising edge of the GSM burst displayed with high time resolution 4.
-
Page 100: Measuring The Signal-To-Noise Ratio Of Burst Signals
For this purpose, the R&S ESR provides the function for measuring absolute and relative power in zero span. In the following example, the measurement is performed using a GSM burst. - Page 101 Press the [BW] key. d) Press the "Res BW Manual" softkey and enter 1 MHz. 4. Set the reference level of the R&S ESR to 0 dBm (= level of the signal generator) by pressing the [AMPT] key and entering 0 dBm.
- Page 102 Using the rotary knob, move the second vertical line to the end of the burst. The R&S ESR displays the power during the activation phase of the burst. Figure 8-11: Power measurement during the activation phase of the burst 8.
-
Page 103: Measuring Fm-Modulated Signals
Measurements in Zero Span b) Switch the "Trg/Gate Polarity" softkey to "Neg." The R&S ESR initiates triggering in response to the falling edge of the burst. This shifts the burst to the left-hand half of the measurement diagram. The power is measured in the deactivation phase. The start of the burst is shifted to the center of the screen and the power during the deactivation phase is mea- sured. - Page 104 1 kHz AF 1. Set the signal analyzer to the default state by pressing the [PRESET] key. The R&S ESR is set to its default state. 2. Select "Spectrum" mode. 3. Set the center frequency to 127.50 MHz and the span to 300 kHz.
- Page 105 Figure 8-13: Display of the filter edge of the 300 kHz filter as an FM discriminator character- istic 6. Set the FM deviation to 50 kHz on the signal generator. 7. Set the span to 0 Hz on the R&S ESR. a) Press the [SPAN] key. b) Press the "Zero Span" softkey.
- Page 106 ® Basic Measurement Examples R&S Measurements in Zero Span c) Press the "Trg/Gate Level" softkey and enter 50%. A static image for the FM AF signal is produced. Result: (-10 ( 5) dB; this yields a deviation of 100 kHz when the steepness of the demodulator characteristic is 5 dB/100 kHz.
-
Page 107: Storing And Loading Instrument Settings
Storing and Loading Instrument Settings 8.5 Storing and Loading Instrument Settings The R&S ESR can store complete instrument settings together with instrument config- urations and measurement data in a settings file. The data is stored on the built-in hard disk or - if selected - on a USB device (e.g. memory stick) or on a network drive. The hard disk has the drive letter C:. -
Page 108: Storing Traces
® Basic Measurement Examples R&S Storing and Loading Instrument Settings If the path is not changed, the default path for the instrument configurations (C:\R_S\Instr\user) is used. Note: The selected directory is automatically used for any further save and recall operations. 5. -
Page 109: Configuring Automatic Loading
8.5.4 Configuring Automatic Loading If the R&S ESR is switched on in the factory default state, it loads the instrument set- tings that it had when switched off (provided that it was switched off using the power button on the front panel;... -
Page 110: Measurement Modes
2. To activate a different mode, press the corresponding softkey. 9.1 Receiver Mode In Receiver mode, the R&S ESR measures the signal level at a particular frequency. It also provides tools (e.g. detectors or bandwidths) necessary to measure the signal according to EMC standards. -
Page 111: I/Q Analyzer Mode
TRACe<n>:IQ[:STATe] 9.4 Real Time Mode In Real Time mode, the R&S ESR performs measurements in the frequency spectrum of a test signal without losing any signal data. You can evaluate the measurement results in several result displays that are designed for the realtime analysis and com- plement one another. -
Page 112: Receiver Mode
Measurements and Result Displays 10 Receiver Mode In receiver mode, the R&S ESR measures the level at the set frequency with a selected bandwidth and measurement time. Signal weighting is by means of detectors. A frequency scan can be performed after setting the start and stop frequency and the step width. -
Page 113: If Spectrum Analysis
Measurements and Result Displays Up to four bargraphs with different detector weighting can be displayed simultaneously. The R&S ESR assigns a different color to each detector. This provides an easy way to compare the signal level with different weighting factors. -
Page 114: Scans
10.1.3 Scans In scan mode, the R&S ESR measures in a predefined frequency range with selectable step width and measurement time for each frequency. A scan is either based on the current receiver settings or on the settings defined in the "Scan Table"... -
Page 115: Stepped Scans In The Frequency Domain
In time domain measurement systems, up to 30 MHz of the spectrum at the receiver input are measured in parallel by using fast fourier transform (FFT) of fre- quency sections. Time Domain scans require options R&S ESR-K53 and R&S ESR-B50. -
Page 116: Time Domain Scans In The Frequency Domain
In the scan table, up to 10 subranges can be defined within one scan. They need not be next to each other. The subranges are then scanned by R&S ESR one after the other. Measurement ranges should not overlap. The parameters to be measured in each subrange can be selected independently. - Page 117 = Frequency stepsize within the scan range. If you define a stepsize that is larger than the range itself, the R&S ESR only measures the start and stop frequencies of the scan range. The step size is available if the Step Mode is either linear or logarithmic.
-
Page 118: Scan On A Fixed Frequency
10.1.4 Peak List and Data Reduction Peak List The Peak Search function of the R&S ESR can be used to create a peak list containing only the measurement values of high interferers. In a fast prescan the signal is mea-... - Page 119 ® Receiver Mode R&S Measurements and Result Displays sured against a limit line, and the level values above the set margin are written into the peak list. The resulting peak list then is used for the final measurement where only the frequencies in the peak list are measured with the required detector.
-
Page 120: Final Measurement
It is then still possible to perform the measurement in a reasonable time frame. During the final measurement, the R&S ESR performs a measurement on each fre- quency in the peak list. When done, it updates the preliminary results in the peak list with those found during the final measurement. -
Page 121: Spectrogram
Note that if you use the Scan or IF Analysis result displays, the R&S ESR saves spec- trogram data even if the spectrogram result display is off. -
Page 122: Color Map
Each color in the spectrogram corresponds to a particular power level that is shown in the color map in the title bar of the result display. The color the R&S ESR assigns to each power level depends on: ●... - Page 123 Measurements and Result Displays You can access the Color Mapping dialog via the "Color Mapping" softkey or by tap- ping on the color map. For the spectrogram the R&S ESR maps power levels (dBm). Selecting the color scheme Before adjusting the details of the color map, you should select the color scheme you are most comfortable with.
- Page 124 -90 dBm. To do so, you have to enter 10% in the Start field. The R&S ESR shifts the start point 10% to the right, to -90 dBm. In the spectrogram, cutting the range as far as possible is also a good way if you want to observe and put the focus on signals with a certain amplitude only.
- Page 125 Changing the reference level and level range also affects the color scheme in the spectrogram. Make sure, however, that you never adjust in a way that could overload the R&S ESR. Defining the shape of the color curve Now that the color scheme and range of the color map suit your needs, you can improve the color map even more by changing the shape of the color curve.
-
Page 126: Measurement Control
INITiate<n>[:IMMediate] 10.1.7.2 Selecting the Result Display The R&S ESR allows you to display the results in various combinations. You can display up to three results simultaneously, for example the Bargraph, the Scan diagram and the Spectrogram. The "Meas" menu contains the basic measurement settings and the selection of result displays. -
Page 127: Bargraph Control
® Receiver Mode R&S Measurements and Result Displays The submenu contains more result displays. Note that the Spectrogram is available for the Scan display and the IF Analysis. To add the Spectrogram, either Scan or IF Analysis have to be turned on already. If you are using the Scan and IF Analysis simultaneously, the Spectrogram is unavailable. -
Page 128: Scan Control
DISPlay:BARGraph:PHOLd:RESet 10.1.7.4 Scan Control At the start of a scan, the R&S ESR opens a softkey menu to control the measure- ment. Interrupting a scan The R&S ESR allows to interrupt a scan any time. If you interrupt it, the scan stops immediately. - Page 129 ® Receiver Mode R&S Measurements and Result Displays Hold Scan........................129 Continue at Rec Frequency..................129 Continue at Hold......................129 Continue at Frame...................... 129 Stop Scan........................129 Hold Scan Interrupts the scan and opens a submenu that contains functionality to control the scan.
-
Page 130: Final Measurement Control
At the start of a final measurement, the R&S ESR opens a softkey menu to control the measurement. The measurement configuration is as defined in the scan table. - Page 131 6. The R&S ESR moves to the next frequency in the peak list, positions the marker on that frequency etc.
-
Page 132: Measurement Settings
The "Meas" menu contains the basic measurement settings and the selection of result displays (Chapter 10.1.7.2, "Selecting the Result Display", on page 126). ► Press the [MEAS] key. The R&S ESR opens the "Measurement" menu. Receiver Frequency....................132 Bargraph Detector.......................133 └... - Page 133 Matches the scan trace number to the number of the bargraph. ● Matches the color of the scan trace to a particular bargraph detector. If you couple bargraph and scan trace, the R&S ESR replaces the detectors of all other active scan traces with the new detector type. Remote command:...
-
Page 134: Spectrogram Configuration
R&S ESR. History Depth Defines the amount of frames that the R&S ESR is able to store in its memory. The R&S ESR can store a maximum of 100.000 frames. However, the actual size of the history buffer depends on the measurement configuration. - Page 135 ® Receiver Mode R&S Measurements and Result Displays Color Mapping Opens a dialog box to define the color map of the spectrogram. For more information see Chapter 10.1.6.2, "Color Map", on page 122. 1 = Color map: shows the current color distribution 2 = Preview pane: shows a preview of the spectrogram with any changes that you make to the color scheme 3 = Color curve pane: graphic representation of all settings available to customize the color scheme...
-
Page 136: Measurement Basics
BW ≤ f Additional 6 dB bandwidths Installing option R&S ESR-B29 adds additional 6 dB bandwidths that are specified for and comply to MIL, DO and automotive standards. The resolution filters are implemented as digital Gaussian bandpass filters. Concerning the attenuation characteristic, the filters behave like analog filters, but their measure- ment speed is much higher than the measurement speed of comparable analog filters. -
Page 137: Detectors
For small measurement bandwidths, the measurement time increases. Bandwidths and detectors If you use the Quasipeak, CISPR Average or RMS Average detector, the R&S ESR by default couples the resolution bandwidth to the receiver frequency. If you need a different bandwidth, you can decouple the bandwidth from the frequency. - Page 138 ® Receiver Mode R&S Measurement Basics Average detector The average detector yields the average level of the samples of the samples measured during the set measurement time. With average detection selected, the video voltage (envelope of IF signal) is averaged during the measurement time.
- Page 139 The quasipeak detector yields the maximum detected value weighted to CISPR 16-1-1 that was detected during the measurement time. Depending on the set frequency, the R&S ESR automatically selects the detectors and IF bandwidths defined for bands A, B and C/D listed in the following table:...
- Page 140 With measurement times shorter than 20 ms the detector weighting changes to plain average weighting. When you change the receiver frequency or the attenuation, the R&S ESR waits until the the lowpass filter has settled before starting the measurement. The measurement time in that case depends on the resolution bandwidth and the characteristics of the signal.
-
Page 141: Trace Modes
DISPlay[:WINDow<n>]:TRACe<t>:MODE on page 652 Max Hold The maximum value is determined over several sweeps and displayed. The R&S ESR saves the sweep result in the trace memory only if the new value is greater than the previous one. This mode is especially useful with modulated or pulsed signals. The signal spectrum is filled up upon each sweep until all signal components are detected in a kind of enve- lope. -
Page 142: Af Demodulation
If the level range or reference level is changed, the R&S ESR automatically adapts the measured data to the changed display range. This allows an amplitude zoom to be made after the measurement in order to show details of the trace. -
Page 143: V-Networks Control (Lisn)
A squelch function that is linked to the video trigger defines the level that the signal must at least have to be demodulated. If you turn the squelch on, the R&S ESR auto- matically turns on the video trigger. The squelch level and trigger level are the same. - Page 144 You can also use a direct connection without a filter, e.g. when you use the R&S ESR in a shielded room. In that case, you can use the following cables.
-
Page 145: Transducers
These characteristics are defined in a transducer factor or transducer sets. The transducer factor can be stored in the R&S ESR and automatically has the correct unit during level measurement. -
Page 146: Preamplifier
® Receiver Mode R&S Measurement Basics Transducer management The R&S ESR provides functionality to store and use the transducer factors during a measurement. For more information on creating and managing transducer factors see "Transducer" on page 477. 10.2.7 Preamplifier Switching on the preamplifer reduces the noise figure of the R&S ESR, thus increasing the sensitivity. -
Page 147: Formats For Returned Values: Ascii Format And Binary Format
® Receiver Mode R&S Measurement Basics Transducer;Antenna;;;;;;; Active transducer(s) Scan <x>: Results for scan range <x> Start;150000.000000;Hz Start frequency of scan range <x> Stop;30000000.000000;Hz Stop frequency of scan range <x> Step;4000.000000;Hz Frequency stepsize in scan range <x> RBW;9000.000000;Hz Resolution bandwidth in scan range <x> Meas time;0.001000;s Measurement time in scan range <x>... - Page 148 ® Receiver Mode R&S Measurement Basics Binary Format (FORMat REAL,32) The command reads out binary data (Definite Length Block Data according to IEEE 488.2), each measurement value being formatted in 32 Bit IEEE 754 Floating-Point- Format. Depending on the number of samples to be transferred, 2 different kinds of syntax are used: For <10 samples:...
-
Page 149: Common Measurement Settings
"Auto Coarse" The step size is coupled to the receiver frequency. When you change the frequency with the rotary knob, the R&S ESR increases or decreases the 4th digit of the receiver frequency. When you change the frequency with the cursor keys, the R&S ESR increases or decreases the 2nd digit of the receiver frequency. -
Page 150: Start / Stop Frequency
"Auto Fine" The step size is coupled to the receiver frequency. When you change the frequency with the rotary knob, the R&S ESR increases or decreases the 7th digit of the receiver frequency. When you change the frequency with the cursor keys, the R&S ESR increases or decreases the 5th digit of the receiver frequency. -
Page 151: Configuring The Level Display And The Rf Input
® Receiver Mode R&S Common Measurement Settings Last Span Sets the span to the previous value. With this function e.g. a fast change between overview measurement and detailed measurement is possible. Remote command: Signal Track Opens a submenu to define and enable the signal tracking: ●... - Page 152 If off, the R&S ESR uses the manual RF attenuation that you have defined. If on, the R&S ESR defines an attenuation level that results in a good S/N ration with- out overloading the receiver stages. Note that it is possible that the R&S ESR does not utilize the maximum possible dynamic range.
- Page 153 ® Receiver Mode R&S Common Measurement Settings Unit Selects the unit displayed on the vertical axis. The unit on the vertical axis represents the unit the results are evaluated in. You can select one of the following units: dBm, dBµV, dBpW, dBµA, dBmV, dBpT. Remote command: on page 636 CALCulate<n>:UNIT:POWer...
-
Page 154: Selecting The Bandwidth
Opens an input field to define the measurement or resolution bandwidth. The R&S ESR supports a selected set of resolution bandwidths. If you enter a number that is not supported, the R&S ESR rounds the value up to next available bandwidth. -
Page 155: Configuring The Scan
Filter Type Selects the filter type. The available resolution bandwidths depend on the filter selection. The R&S ESR provides the following filter types: ● EMI CISPR / MIL Gaussian filter with a 6 bandwidth. 6 dB bandwidths that comply with CISPR and MIL standards are available. -
Page 156: Configuring The Trigger
® Receiver Mode R&S Common Measurement Settings Edit Scan Table Opens a dialog box to create or edit a scan table. For more information see Chapter 10.1.3.3, "The Scan Table", on page 116 Freq Axis (Lin Log) Switches between linear and logarithmic frequency axis. Remote command: on page 634 DISPlay[:WINDow<n>]:TRACe<t>:X:SPACing... -
Page 157: Controlling Inputs And Outputs
9 kHz to 1 GHz and an attenuation range from 10 dB to 75 dB. Attenuation levels smaller than 10 dB are not possible at RF Input 2. With option R&S ESR-B29, the minimum frequency is extended to 20 Hz at both RF inputs. -
Page 158: Test Automation
INITiate<n>:FMEasurement Peak Search In addition to the "Peak Search" button, you can initiate a peak search with the [PEAK SEARCH] key on the R&S ESR front panel. 10.3.7.1 Overview The "Overview" tab in the "Test Automation" dialog box contains general functions to configure automated test sequences. - Page 159 Selects the configuration the scan is based on. "Scan Table" The scan is performed based on the settings defineds of the scan table. "Current" The scan is performed based on the current setting of the R&S ESR. Remote command: not supported User Manual 1175.7068.02 ─ 13...
-
Page 160: Scan Table
Start frequency: on page 635 [SENSe:]FREQuency:STARt Stop frequency: on page 635 [SENSe:]FREQuency:STOP Step Mode Selects the mode for frequency steps. Note that the frequency stepsize for time domain scans (R&S ESR-K53) is always selected automatically. User Manual 1175.7068.02 ─ 13... - Page 161 Turns the time domain scan on and off. For more information see Chapter 10.1.3.2, "Time Domain Scans in the Frequency Domain", on page 116. Note that time domain scans are available with option R&S ESR-K53. Remote command: on page 635 [SENSe:]FREQuency:MODE Adjust Axis Adjusts the scale of the horizontal axis if the overall scan range is different than the scan range defined by the scan subranges.
-
Page 162: Peak Search
® Receiver Mode R&S Common Measurement Settings ● Meas Time ● Auto Ranging ● RF Attenuation ● Preamplifier ● Receiver Input For more information see Chapter 10.1.3.3, "The Scan Table", on page 116. Remote command: Chapter 16.4.6.2, "Scan Table", on page 643 RF input: on page 641 INPut:TYPE... - Page 163 CALCulate<n>:PEAKsearch|PSEarch:METHod No Of Peaks Defines the number of peaks the R&S ESR looks for during a peak search. The range is from 1 to 500 peaks. The number of peaks only takes effect if the peak search mode is "Peaks".
-
Page 164: Peak Lists
® Receiver Mode R&S Common Measurement Settings "Deselect all Traces" Turns the limit check on and off. "Limitcheck (On Off)" 10.3.7.4 Peak Lists The peak list dialog box is available for the prescan results and the final measurement results. Both dialog boxes contain the same elements. Peak List........................ - Page 165 ® Receiver Mode R&S Common Measurement Settings Remote command: on page 648 CALCulate<n>:PEAKsearch|PSEarch:ADD Delete Frequency Deletes the currently selected peak list table row (grey highlighting). Remote command: not supported Sort by Delta Limit Sort the entries of the peak list according to the delta limit results. The delta limit is the distance of a peak to a limit line, if one has been assigned.
-
Page 166: Trace / Final Meas
Final Measurement Time Defines the measurement time for the final measurement. The measurement time is the time during which the R&S ESR measures the input sig- nal and forms a measurement result weighted by the selected detector. The measure- ment time does not include settling times of the synthesizer and the IF filter. The R&S ESR automatically waits until transients are over. - Page 167 ® Receiver Mode R&S Common Measurement Settings LISN Type........................167 Prescan Phase......................167 Final Test Phase......................167 150 kHz Highpass Filter....................168 LISN Type Selects the V-network to be controlled via the user port. For more information see Chapter 10.2.5, "V-Networks Control (LISN)", on page 143.
-
Page 168: Common Analysis Functions
The TRACE key is used to configure the data acquisition for measurement and the analysis of the measurement data. The R&S ESR is capable of displaying up to six different traces at a time in a diagram. A trace consists of a maximum of 691 displayed measurement points on the horizontal axis (frequency or time). - Page 169 Chap- ter 10.2.3, "Trace Modes", on page 141. Note: When you select detector type "None" for the final measurement, the R&S ESR ignores peaks found on the corresponding trace during the final measurement. Remote command: Selecting the trace mode: on page 652 DISPlay[:WINDow<n>]:TRACe<t>:MODE...
-
Page 170: Markers
10.4.2.1 Controlling Markers The markers are used for marking points on traces, reading out measurement results and for selecting a display section quickly. The R&S ESR provides 16 markers per trace. Figure 10-9: Marker types All markers can be used either as markers or delta markers. The marker that can be moved by the user is defined in the following as the active marker. - Page 171 ® Receiver Mode R&S Common Analysis Functions The measurement results of the active marker (also called marker values) are dis- played in the marker field, which is located at the upper right corner of the diagram, or in a separate table beneath the diagram. The marker information includes the follow- ing: ●...
- Page 172 ® Receiver Mode R&S Common Analysis Functions on page 665 CALCulate<n>:MARKer<m>:Y on page 670 CALCulate<n>:DELTamarker<m>[:STATe] on page 670 CALCulate<n>:DELTamarker<m>:X on page 671 CALCulate<n>:DELTamarker<m>:X:RELative? on page 671 CALCulate<n>:DELTamarker<m>:Y More Markers Opens a sub-menu to select one of up to 16 available markers. See "Marker 1 / Marker 2 / Marker 3 / …...
- Page 173 ® Receiver Mode R&S Common Analysis Functions "Ref. Marker" Reference marker for delta markers. The marker values for the delta marker are indicated relative to the specified reference marker. The reference marker can either be another active marker, or a fixed reference marker ("FXD", see "Ref Fixed"...
-
Page 174: Positioning Markers
Receiver Mode R&S Common Analysis Functions Marker Track Turns marker frequency tracking on and off. If on, the R&S ESR changes the center frequency to the marker frequency when you change the marker position. Remote command: on page 656 CALCulate<n>:MARKer<m>:COUPled[:STATe]... - Page 175 ® Receiver Mode R&S Common Analysis Functions ● "Specifying the Search Limits" on page 383 ● "Specifying the Search Range" on page 383 ● "Examining a Signal at the Center in Detail" on page 383 ● "Specifying the Suitable Peak Excursion" on page 384 Select Marker (No) Opens a submenu to select one of 16 markers and define whether the marker is a nor-...
- Page 176 ® Receiver Mode R&S Common Analysis Functions Remote command: Next Peak: CALC:MARK:MAX:LEFT (<): CALCulate<n>:MARKer<m>:MAXimum:LEFT on page 660 on page 666 CALCulate<n>:DELTamarker<m>:MAXimum:LEFT CALC:MARK:MAX:RIGH (>): CALCulate<n>:MARKer<m>:MAXimum:RIGHt on page 661 on page 667 CALCulate<n>:DELTamarker<m>:MAXimum:RIGHt CALC:DELT:MAX:NEXT (abs): CALCulate<n>:MARKer<m>:MAXimum:NEXT on page 661 on page 667 CALCulate<n>:DELTamarker<m>:MAXimum:NEXT Next Min: CALC:MARK:MIN:LEFT (>):...
-
Page 177: Markers In Spectrograms
® Receiver Mode R&S Common Analysis Functions Remote command: on page 834 CALCulate<n>:THReshold:STATe on page 834 CALCulate<n>:THReshold Use Zoom Limits ← Search Limits Restricts the marker search to the zoomed area. Note that the marker zoom is only available in Spectrum mode. Remote command: on page 833 CALCulate<n>:MARKer<m>:X:SLIMits:ZOOM... -
Page 178: Limit) Lines
● Memory Performs a search over all captured frames that are stored in the memory of the R&S ESR Remote command: on page 623 CALCulate<n>:MARKer<m>:SGRam:SARea 10.4.3 (Limit) Lines... -
Page 179: Softkeys Of The Lines Menu
® Receiver Mode R&S Common Analysis Functions The "Lines" menu and the "Select Limit Line" dialog box are displayed. For details on the "Select Limit Line" dialog box refer to Chapter 10.4.3.5, "Selecting a Limit Line", on page 185. Menu and softkey description ●... - Page 180 ® Receiver Mode R&S Common Analysis Functions └ Edit Margin....................181 └ Edit Value......................181 └ Insert Value....................181 └ Delete Value....................181 └ Save Limit Line..................... 181 Edit..........................181 Copy to........................181 Delete..........................182 Offset........................182 Offset........................182 Display Lines.......................182 └ Display Line 1 / Display Line 2..............182 └...
-
Page 181: Edit Margin
® Receiver Mode R&S Common Analysis Functions Edit Margin ← New Sets the focus on the "Margin" field to enter or change a margin for the limit line. The default setting is 0 dB (i.e. no margin). Edit Value ← New Opens an edit dialog box to change an existing x or y value, depending on the selected column. -
Page 182: Delete
® Receiver Mode R&S Common Analysis Functions Remote command: on page 675 CALCulate<n>:LIMit<k>:COPY Delete Deletes the selected limit line. Remote command: on page 675 CALCulate<n>:LIMit<k>:DELete X Offset Horizontally shifts a limit line that has been specified for relative frequencies or times (x-axis). -
Page 183: Display Lines
® Receiver Mode R&S Common Analysis Functions Remote command: on page 672 CALCulate<n>:DLINe<k> on page 673 CALCulate<n>:DLINe<k>:STATe Frequency Line 1 / Frequency Line 2 ← Display Lines Enables or disables the frequency lines 1/2 (span > 0) and opens an edit dialog box to enter the position of the lines. -
Page 184: Limit Lines (Frequency/Time Lines)
The y unit of the limit line has to be identical to the current setting with the excep- tion of dB based units; all dB based units are compatible with each other. At the time of entry, the R&S ESR immediately checks that all limit lines are in accord- ance with the following guidelines: ●... -
Page 185: Working With Lines
® Receiver Mode R&S Common Analysis Functions time range representation, negative times may also be entered. The allowed range is -1000 s to +1000 s. 10.4.3.4 Working with Lines If a line is switched on, the softkey is highlighted. Switching a line on or off 1. -
Page 186: Creating A New Limit Line
® Receiver Mode R&S Common Analysis Functions ● To display only the limit lines that are compatible, activate the "Show compatible" option. For details on compatibility refer to Chapter 10.4.3.3, "Limit Lines (Fre- quency/Time Lines)", on page 184. 10.4.3.6 Creating a New Limit Line Press the softkey to define a new limit line. - Page 187 ® Receiver Mode R&S Common Analysis Functions Setting Description Margin A fixed distance to the limit line. Margins are not as strict as limits and belong to the valid value range, but viola- tion is also indicated in the display. Position Position of data point Value...
- Page 188 ® Receiver Mode R&S Common Analysis Functions Defining a margin A margin is similar to a limit, but less strict and it still belongs to the valid data range. It can be used as a warning that the limit is almost reached. The margin is not indicated by a separate line in the display.
-
Page 189: Editing An Existing Limit Line
® Receiver Mode R&S Common Analysis Functions Shifting a limit line vertically ► Select the "Shift y" button and enter a shift width for the y value in the edit dialog box. Saving the limit line settings ► Press the "Save" button in the dialog. If an existing name is used, a message box is displayed. -
Page 190: Activating/Deactivating A Limit Line
® Receiver Mode R&S Common Analysis Functions 10.4.3.9 Activating/Deactivating a Limit Line Prerequisites: The x- and y-units of limit line and current measurement setting have to be compatible. For details refer to Chapter 10.4.3.3, "Limit Lines (Frequency/Time Lines)", on page 184. The limit line has to consist of 2 or more data points. -
Page 191: Spectrum Measurements
You can also perform conventional spectrum analysis with the R&S ESR. When you start the R&S ESR for the first time or after a preset, it starts in receiver mode. If it is inactive, press the [MODE] key and select the "Spectrum" softkey in the corresponding menu to enter the spectrum mode. -
Page 192: Softkeys Of The Power Measurement Menu
® Spectrum Measurements R&S Measurements The MEAS key is used for complex measurement functions as power measurements, occupied bandwidth, signal statistic, carrier to noise spacing, AM modulation depth, third-order intercept point, harmonics and spurious emissions. For measurement examples refer to the Quick Start Guide, "Basic Measurement Examples". The following measurements can be performed: ●... - Page 193 ® Spectrum Measurements R&S Measurements Ch Power ACLR......................193 C/N, C/No (span > 0)....................193 OBW (span > 0)......................193 Spectrum Emission Mask....................193 Spurious Emissions.....................194 Time Domain Power (zero span).................194 All Functions Off......................194 APD..........................194 CCDF.......................... 194 TOI..........................194 AM Mod Depth......................194 Harmonic Distortion.....................195 All Functions...
- Page 194 ® Spectrum Measurements R&S Measurements Spurious Emissions Opens a submenu to configure the Spurious Emissions measurement. The Spurious Emissions measurement defines a measurement that monitors unwan- ted RF products outside the assigned frequency band generated by an amplifier. For details see Chapter 11.1.1.6, "Measuring Spurious Emissions", on page 253.
-
Page 195: Measuring Channel Power And Adjacent-Channel Power
® Spectrum Measurements R&S Measurements For details see Chapter 11.1.1.12, "Measuring the AM Modulation Depth", on page 306. Remote command: on page 754 CALCulate<n>:MARKer<m>:FUNCtion:MDEPth[:STATe] on page 753 CALCulate<n>:MARKer<m>:FUNCtion:MDEPth:RESult? Harmonic Distortion Opens a submenu to determine the settings for harmonics measurement and activates the harmonic distortion measurement. - Page 196 R&S Measurements Apart from this common method, the R&S ESR also has a true power detector, i.e. an RMS detector. It correctly displays the power of the test signal within the selected reso- lution bandwidth irrespective of the amplitude distribution, without additional correction factors being required.
- Page 197 IBW method (Integration Bandwidth method). Fast ACLR Using Fast ACLR, the R&S ESR sets the center frequency to the different channel cen- ter frequencies consecutively and measures the power with the selected measurement time (= sweep time/number of channels).
- Page 198 ® Spectrum Measurements R&S Measurements Figure 11-2: Measuring the channel power and adjacent channel power ratio for CDMA2000 1X sig- nals with zero span (Fast ACP) Assuming a measurement with five channels (1 channel plus 2 lower and 2 upper adja- cent channels) and a sweep time of 100 ms, a measurement time per channel of 20 ms is required.
- Page 199 ® Spectrum Measurements R&S Measurements Figure 11-3: Repeatability of adjacent channel power measurement on CDMA2000 standard signals if the integration bandwidth method is used Figure 11-4 shows the repeatability of power measurements in the transmit chan- nel and of relative power measurements in the adjacent channels as a function of sweep time.
- Page 200 ® Spectrum Measurements R&S Measurements Results are provided for the TX channel and the number of defined adjacent channels above and below the TX channel. If more than one TX channel is defined, the carrier channel to which the relative adjacent-channel power values should be referenced must be defined.
- Page 201 Predefined standards contain the main measurement settings for standard measure- ments. When such a standard is loaded, the required channel settings are automati- cally set on the R&S ESR. However, the settings can be changed, and measurements with user-defined configurations are also possible.
- Page 202 R&S Measurements In the R&S ESR's display, only the first neighboring channel of the carrier (TX) channel is labelled "Adj" (adjacent) channel; all others are labelled "Alt" (alternate) channels. In this manual, "adjacent" refers to both adjacent and alternate channels.
- Page 203 2000 is different. These standards define the adjacent-channel spacing from the center of the transmission channel to the closest border of the adjacent channel. This defini- tion is also used for the R&S ESR if the standards marked with an asterisk *) are selected.
- Page 204 ® Spectrum Measurements R&S Measurements Configuring a Limit Check During an ACLR measurement, the power values can be checked whether they exceed user-defined limits. A relative or absolute limit can be defined, or both. Both limit types are considered, regardless whether the measured levels are absolute or rel- ative values.
- Page 205 User standards created on an analyzer of the R&S FSP family are compatible to the R&S ESR. User standards created on an R&S ESR, however, are not necessarily com- patible to the analyzers of the R&S FSP family and may not work there.
-
Page 206: Ch Power Aclr
® Spectrum Measurements R&S Measurements └ Chan Pwr/Hz..................212 └ Power Mode..................212 └ Clear/Write................212 └ Hold.................. 213 └ Select Trace..................213 └ ACLR (Abs/Rel).................. 213 └ Adjust Settings..................213 └ Sweep Time....................213 └ Fast ACLR (On/Off)..................214 └ Set CP Reference..................214 └... -
Page 207: Cp/Aclr Settings
® Spectrum Measurements R&S Measurements Remote command: on page 696 CALCulate<n>:MARKer<m>:FUNCtion:POWer:PRESet CP/ACLR Settings ← Ch Power ACLR Opens a submenu to configure the channel power and adjacent channel power mea- surement independently of the predefined standards (for details see also "Predefined CP/ACLR Standards"... -
Page 208: Bandwidth
® Spectrum Measurements R&S Measurements The dialog contains the following tabs: ● "Bandwidth" on page 208 ● "Spacing" on page 209 ● "Names" on page 210 ● "Weighting Filter" on page 210 ● "Limits" on page 211 Bandwidth ← Channel Setup ← CP/ACLR Settings ← Ch Power ACLR Define the channel bandwidths for the transmission channels and the adjacent chan- nels. -
Page 209: Aclr Reference
® Spectrum Measurements R&S Measurements If measuring according to the IBW method ("Fast ACLR Off"), the bandwidths of the different adjacent channels are to be entered numerically. Since all adjacent channels often have the same bandwidth, the other alternate channels are set to the bandwidth of the adjacent channel when it is changed. -
Page 210: Names
® Spectrum Measurements R&S Measurements Odd number of TX channels The middle TX channel is centered to center frequency. Even number of TX channels The two TX channels in the middle are used to calculate the fre- quency between those two channels. This frequency is aligned to the center frequency. -
Page 211: Limits
● The R&S ESR checks adherence to the limits irrespective of whether the limits are absolute or relative or whether the measurement is carried out with absolute or rel- ative levels. If both limits are active and if the higher of both limit values is excee- ded, the measured value is marked by a preceding asterisk. -
Page 212: Relative Limit
® Spectrum Measurements R&S Measurements Remote command: on page 713 CALCulate<n>:LIMit<k>:ACPower[:STATe] on page 708 CALCulate<n>:LIMit<k>:ACPower:ACHannel:RESult CALCulate<n>:LIMit<k>:ACPower:ALTernate<channel>[:RELative] on page 711 Relative Limit ← Limits ← Channel Setup ← CP/ACLR Settings ← Ch Power ACLR Defines a limit relative to the carrier signal. Remote command: CALC:LIM:ACP ON, see CALCulate<n>:LIMit<k>:ACPower[:STATe]... - Page 213 ® Spectrum Measurements R&S Measurements Remote command: CALC:MARK:FUNC:POW:MODE WRIT, see CALCulate<n>:MARKer<m>:FUNCtion: on page 692 POWer:MODE Max Hold ← Power Mode ← CP/ACLR Settings ← Ch Power ACLR If this mode is activated, the power values are calculated from the current trace and compared with the previous power value using a maximum algorithm.
- Page 214 Switches between the IBW method ("Fast ACLR Off") and the zero span method ("Fast ACLR On"). When switched on, the R&S ESR sets the center frequency consecutively to the differ- ent channel center frequencies and measures the power with the selected measure- ment time (= sweep time/number of channels).
- Page 215 697 CALCulate<n>:MARKer<m>:FUNCtion:POWer:STANdard:SAVE Delete ← User Standard ← Ch Power ACLR Deletes the user standard that you select in the corresponding dialog box. Note that the R&S ESR deletes the file without further notice. Remote command: on page 697 CALCulate<n>:MARKer<m>:FUNCtion:POWer:STANdard:DELete Noise Correction ←...
- Page 216 Adjusts the reference level to the measured channel power. This ensures that the set- tings of the RF attenuation and the reference level are optimally adjusted to the signal level without overloading the R&S ESR or limiting the dynamic range by a too small S/N ratio.
- Page 217 2000 is different. These standards define the adjacent-channel spacing from the center of the transmission channel to the closest border of the adjacent channel. This defini- tion is also used for the R&S ESR if the standards marked with an asterisk *) are selected.
- Page 218 ® Spectrum Measurements R&S Measurements The frequency span must at least cover the channels to be measured plus a mea- surement margin of approx. 10 %. If the frequency span is large in comparison to the channel bandwidth (or the adja- cent-channel bandwidths) being examined, only a few points on the trace are avail- able per channel.
-
Page 219: Measuring The Carrier-To-Noise Ratio
216). 11.1.1.3 Measuring the Carrier-to-Noise Ratio The R&S ESR can easily determine the carrier-to-noise ratio, also normalized to a 1 Hz bandwidth. The largest signal in the frequency span is the carrier. It is searched when the C/N or C/NO function is activated (see "C/N, C/No"... - Page 220 ® Spectrum Measurements R&S Measurements For this measurement, the RMS detector is activated. The carrier-to-noise measurements are only available in the frequency domain (span >0). There are two methods to measure the carrier-to-noise ratio: ● The carrier is outside the examined channel: In this case, it is sufficient to switch on the desired measurement function and to set the channel bandwidth.
- Page 221 ® Spectrum Measurements R&S Measurements You can also query the determined carrier-to-noise ratio via the remote command CALC:MARK:FUNC:POW:RES? CN or CALC:MARK:FUNC:POW:RES? CN0, see on page 690. CALCulate<n>:MARKer<m>:FUNCtion:POWer:RESult? Softkeys for Carrier-to-Noise Ratio Measurements C/N, C/No........................221 └ C/N........................221 └ C/No......................221 └ Channel Bandwidth ..................221 └...
-
Page 222: Measuring The Occupied Bandwidth
® Spectrum Measurements R&S Measurements Note that in the I/Q Analyzer the channel bandwidth does not change the measure- ment span or sampling rate; it merely defines the range for the carrier-to-noise analy- sis. Remote command: on page 698 [SENSe:]POWer:ACHannel:ACPairs Adjust Settings ←... - Page 223 Span ≥ 2 to 3 x occupied bandwidth Some of the measurement specifications (e.g. PDC, RCR STD-27B) require measure- ment of the occupied bandwidth using a peak detector. The detector setting of the R&S ESR has to be changed accordingly then. User Manual 1175.7068.02 ─ 13...
- Page 224 ® Spectrum Measurements R&S Measurements A remote control programming example is described in Chapter 16.17.5, "Occupied Bandwidth Measurement", on page 984. To determine the occupied bandwidth 1. Press the softkey to activate the measurement of the occupied bandwidth. The corresponding submenu is displayed. 2.
- Page 225 ® Spectrum Measurements R&S Measurements This measurement is not available in zero span. The measurement is performed on the trace with marker 1. In order to evaluate another trace, marker 1 must be placed on another trace (see the Marker to Trace soft- key in the "Marker"...
-
Page 226: Measuring With Spectrum Emission Masks
"Provided XML Files for the Spectrum Emission Mask Measurement" on page 242). In order to improve the performance of the R&S ESR for spectrum emission mask measurements, a "Fast SEM" mode is available. For details see "Fast Spectrum Emis- sion Mask Measurements"... - Page 227 ® Spectrum Measurements R&S Measurements Format Description of Spectrum Emission Mask XML Files........245 ASCII File Export Format (Spectrum Emission Mask)..........250 Fast Spectrum Emission Mask Measurements............251 Softkeys for Spectrum Emission Mask (SEM) Measurements Spectrum Emission Mask....................228 └ Sweep List....................228 └...
-
Page 228: Softkeys For Spectrum Emission Mask (Sem) Measurements Spectrum Emission Mask
® Spectrum Measurements R&S Measurements Spectrum Emission Mask Opens a submenu to configure the Spectrum Emission Mask measurement. The Spectrum Emission Mask (SEM) measurement defines a measurement that moni- tors compliance with a spectral mask. The SEM measurement of the base unit allows a flexible definition of all parameters in the SEM measurement. -
Page 229: Range Start / Range Stop
® Spectrum Measurements R&S Measurements The changes of the sweep list are only kept until you load another parameter set (by pressing PRESET or by loading an XML file). If you want a parameter set to be availa- ble permanently, create an XML file for this configuration (for details refer to "Format Description of Spectrum Emission Mask XML Files"... -
Page 230: Vbw
® Spectrum Measurements R&S Measurements VBW ← Sweep List dialog box ← Sweep List ← Spectrum Emission Mask Sets the VBW value for this range. Remote command: on page 732 [SENSe:]ESPectrum:RANGe<range>:BANDwidth:VIDeo Sweep Time Mode ← Sweep List dialog box ← Sweep List ← Spectrum Emission Mask Activates or deactivates the auto mode for the sweep time. -
Page 231: Limit Check 1-4
® Spectrum Measurements R&S Measurements Limit Check 1-4 ← Sweep List dialog box ← Sweep List ← Spectrum Emission Mask Sets the type of limit check for all ranges. For details on limit checks see "Working with Limit Lines in SEM Measurements" on page 241. -
Page 232: Close Sweep List
® Spectrum Measurements R&S Measurements This parameter is only available if the limit check is set accordingly (see "Sweep List dialog box" on page 228). Remote command: [SENSe:]ESPectrum:RANGe<range>:LIMit<source>:RELative:STOP on page 737 Close Sweep List ← Sweep List ← Spectrum Emission Mask Closes the "Sweep List"... -
Page 233: Symmetric └ └ List Evaluation
® Spectrum Measurements R&S Measurements Note: If "Fast SEM" mode is deactivated while "Symmetric Setup" mode is on, "Sym Setup" mode is automatically also deactivated. If "Fast SEM" mode is activated while "Symmetric Setup" mode is on, not all range set- tings can be set automatically. -
Page 234: List Evaluation (On/Off)
® Spectrum Measurements R&S Measurements List Evaluation (On/Off) ← List Evaluation ← Spectrum Emission Mask Activates or deactivates the list evaluation. Remote command: Turning list evaluation on and off: on page 727 CALCulate<n>:PEAKsearch|PSEarch:AUTO Querying list evaluation results: on page 694 TRACe<n>:DATA Margin ←... -
Page 235: Edit Reference Range
® Spectrum Measurements R&S Measurements Decim Sep ← Save Evaluation List ← List Evaluation ← Spectrum Emission Mask Selects the decimal separator with floating-point numerals for the ASCII Trace export to support evaluation programs (e.g. MS-Excel) in different languages. The values '.' (decimal point) and ',' (comma) can be set. -
Page 236: Edit Power Classes
® Spectrum Measurements R&S Measurements Edit Power Classes ← Spectrum Emission Mask Opens a dialog box to modify the power class settings. Used Power Classes ← Edit Power Classes ← Spectrum Emission Mask Choose the power classes to be used from this dropdown menu. It is only possible to select either one of the defined power classes or all of the defined power classes together. -
Page 237: Sweep
® Spectrum Measurements R&S Measurements Remote command: on page 744 CALCulate<n>:LIMit<k>:ESPectrum:PCLass<Class>:MINimum on page 744 CALCulate<n>:LIMit<k>:ESPectrum:PCLass<Class>:MAXimum Sweep List ← Edit Power Classes ← Spectrum Emission Mask "Sweep List" on page 228 Add/Remove ← Edit Power Classes ← Spectrum Emission Mask Activates or deactivates power classes to be defined. Up to four power classes can be defined. - Page 238 ® Spectrum Measurements R&S Measurements Result Evaluation As a result of the Spectrum Emission Mask measurement, the measured signal levels, the result of the limit check (mask monitoring) and the defined limit line are displayed in a diagram (see also "Working with Limit Lines in SEM Measurements"...
- Page 239 ® Spectrum Measurements R&S Measurements Label Description Range Up Frequency range stop for range the peak value belongs to RBW of the range Frequency Frequency Power Abs Absolute power level Power Rel Power level relative to the TX channel power ΔLimit Deviation of the power level from the defined limit In which detail the data is displayed in the result table can be defined in the...
- Page 240 ® Spectrum Measurements R&S Measurements ● ● ● Sweep time ● Sweep points ● Reference level ● Attenuator settings ● Limit values Via the sweep list, you define the ranges and their settings. For details on settings refer "Sweep List dialog box" on page 228.
- Page 241 Measurements Working with Limit Lines in SEM Measurements Using the R&S ESR, the spectrum emission mask is defined using limit lines. Limit lines allow you to check the measured data against specified limit values. Generally, it is possible to define limit lines for any measurement in Spectrum mode using the [Lines] key.
- Page 242 ® Spectrum Measurements R&S Measurements Limit check type Pass/fail criteria Indicated limit line Abs and Rel Only if the power exceeds both the The less strict (higher) limit line is displayed absolute and the relative limits, the for each range. check fails.
- Page 243 ® Spectrum Measurements R&S Measurements Table 11-1: Provided XML files Path XML file name Displayed standard character- istics* cdma2000\DL default0.xml CDMA2000 BC0 DL default1.xml CDMA2000 BC1 DL cdma2000\UL default0.xml CDMA2000 BC0 UL default1.xml CDMA2000 BC1 UL WCDMA\3GPP\DL PowerClass_31_39.xml W-CDMA 3GPP (31,39)dBm DL PowerClass_39_43.xml W-CDMA 3GPP (39,43)dBm DL PowerClass_43_INF.xml...
- Page 244 ® Spectrum Measurements R&S Measurements Path XML file name Displayed standard character- istics* IEEE.xml IEEE.802.11j WLAN\802_11j_20MHz ETSI.xml IEEE 802.11j IEEE.xml IEEE 802.11j EUTRA-LTE\DL\CategoryA\ BW_01_4_MHz__CFhigher1GHz.xm LTE Cat. A >1GHz DL EUTRA-LTE\DL\CategoryA\ BW_01_4_MHz__CFlower1GHz.xml LTE Cat. A <1GHz DL EUTRA-LTE\DL\CategoryA\ BW_03_0_MHz__CFhigher1GHz.xm LTE Cat. A >1GHz DL EUTRA-LTE\DL\CategoryA\ BW_03_0_MHz__CFlower1GHz.xml LTE Cat.
-
Page 245: Format Description Of Spectrum Emission Mask Xml Files
Figure 11-5: Example Spectrum emission mask standard file (PowerClass_39_43.xml) Be sure to follow the structure exactly as shown below or else the R&S ESR is not able to interpret the XML file and error messages are shown on the screen. Therefore, we... - Page 246 The maximum num- ber of ranges is 20. Note that the R&S ESR uses the same ranges in each power class. Therefore, the contents of the ranges of each defined power class have to be identical to the first power class.
- Page 247 ® Spectrum Measurements R&S Measurements ● The "BaseFormat" element is structured as follows: – <RS_SEM_ACP_FileFormat Version=""1.0.0.0""> <Name>"Standard"</Name> <Instrument> <Type>"Instrument Type"</Type> <Application>"Application"</Application> </Instrument> <LinkDirection Name=""Name""> <ReferencePower> <Method>"Method"</Method> </ReferencePower> <PowerClass Index=""n""> <!-- For contents of the PowerClass node see Table 11-3 --> <!-- Define up to four PowerClass nodes -->...
- Page 248 ® Spectrum Measurements R&S Measurements </Limit> <RBW Bandwidth=""Bandwidth"" Type=""FilterType""/> <VBW Bandwidth=""Bandwidth""/> <Detector>"Detector"</Detector> <Sweep Mode=""SweepMode"" Time=""SweepTime""/> <Amplitude> <ReferenceLevel Unit=""dBm"" Value=""Value""/> <RFAttenuation Mode=""Auto"" Unit=""dB"" Value=""Value""/> <Preamplifier State=""State""/> </Amplitude> </Range> Table 11-2: Attributes and child nodes of the BaseFormat element Child Node Attribute Value Parameter Description Mand.
- Page 249 ® Spectrum Measurements R&S Measurements Child Node Attribute Value Parameter Description Mand. InclusiveFlag false DefaultLimitFailMode Absolute | Relative | Absolute and Rel- ative | Absolute or Relative Table 11-4: Attributes and child nodes of the Range element (normal ranges) Child Node Attribute Value Parameter Description...
-
Page 250: Ascii File Export Format (Spectrum Emission Mask)
® Spectrum Measurements R&S Measurements Child Node Attribute Value Parameter Description Mand. Unit dBm/Hz | dBm | Sets the unit of the stop dBc | dBr | dB value LimitFailMode Absolute | Relative If used, it has to be identical | Absolute and Rel- to DefaultLimitFailMode ative | Absolute or... -
Page 251: Fast Spectrum Emission Mask Measurements
<limit fail (pass = 0, fail =1)>; Fast Spectrum Emission Mask Measurements In order to improve the performance of the R&S ESR for spectrum emission mask measurements, a "Fast SEM" mode is available. If this mode is activated, several con- secutive ranges with identical sweep settings are combined to one sweep internally, which makes the measurement considerably more efficient. - Page 252 ® Spectrum Measurements R&S Measurements Activating Fast SEM mode "Fast SEM" mode is activated in the sweep list (see "Fast SEM" on page 229) or using a remote command. Activating the mode for one range automatically activates it for all ranges in the sweep list.
-
Page 253: Measuring Spurious Emissions
® Spectrum Measurements R&S Measurements Example Figure 11-6: Sweep list using Fast SEM mode Figure 11-6, a sweep list is shown for which Fast SEM is activated. The formerly 5 separately defined ranges are combined to 2 sweep ranges internally. 11.1.1.6 Measuring Spurious Emissions The Spurious Emissions measurement defines a measurement that monitors unwan-... - Page 254 ® Spectrum Measurements R&S Measurements Spurious Emissions measurements are performed using the "Spurious Emissions" softkey in the "Measurement" menu (see "Spurious Emissions" on page 259). Most parameters are defined in the "Sweep List" dialog box (see "Sweep List dialog box" on page 259).
- Page 255 ® Spectrum Measurements R&S Measurements Defining ranges by remote control In Spurious Emissions measurements, there are no remote commands to insert new ranges between existing ranges directly. However, you can delete or re-define the existing ranges to create the required order. A remote command example for defining parameters and ranges in spurious emissions measurements can be found in chapter 7 "Remote Control –...
- Page 256 ® Spectrum Measurements R&S Measurements Furthermore, you can save the evaluation list to a file ("Save Evaluation List"). Retrieving Results via Remote Control The spurious measurement results can be retrieved using the CALC:PSE? command from a remote computer (see CALCulate<n>:PEAKsearch|PSEarch[: for a detailed description).
- Page 257 ® Spectrum Measurements R&S Measurements As for general limit lines, the results of each limit line check are displayed (here: "_SPURIOUS_LINE_ABS"), as well as the combined result for all defined limit lines ("Limit Check"). In addition to the limit line itself, the largest deviations of the absolute power from the limit line for each range are displayed in the evaluation list if the limit check is activa- ted.
- Page 258 ® Spectrum Measurements R&S Measurements The limit values are absolute values for the absolute power level. 4. Set the "Limit Check" setting to "Absolute" to activate the limit check. 5. Close the "Sweep List" dialog box. The limit line and the result of the limit check are displayed in the diagram and the result table displays the largest deviations from the limit for each range.
- Page 259 ® Spectrum Measurements R&S Measurements └ Adjust Ref Lvl (span > 0)................264 └ Adjust X-Axis....................264 └ Meas Start/Stop.................... 264 Spurious Emissions Opens a submenu to configure the Spurious Emissions measurement and immediately starts a measurement. For general information on performing Spurious Emissions measurements see Chap- ter 11.1.1.6, "Measuring Spurious Emissions",...
- Page 260 ® Spectrum Measurements R&S Measurements RBW ← Sweep List dialog box ← Sweep List ← Spurious Emissions Sets the RBW value for this range. Remote command: on page 718 [SENSe:]LIST:RANGe<range>:BANDwidth[:RESolution] VBW ← Sweep List dialog box ← Sweep List ← Spurious Emissions Sets the VBW value for this range.
- Page 261 Stop After Sweep ← Sweep List dialog box ← Sweep List ← Spurious Emissions This command configures the sweep behavior. "ON" The R&S ESR stops after one range is swept and continues only if you confirm (a message box is displayed). "OFF"...
- Page 262 ® Spectrum Measurements R&S Measurements Remote command: on page 724 [SENSe:]LIST:RANGe<range>:LIMit:STOP Close Sweep List ← Sweep List ← Spurious Emissions Closes the "Sweep List" dialog box and updates the measurement results. Insert before Range ← Sweep List ← Spurious Emissions Inserts a new range to the left of the currently focused range.
- Page 263 ® Spectrum Measurements R&S Measurements Remote command: on page 727 CALCulate<n>:PEAKsearch|PSEarch:AUTO on page 694 TRACe<n>:DATA Details On/Off ← List Evaluation ← Spurious Emissions Configures the list contents. Displays the whole list contents. Displays only the highest peaks (one peak per range). Remote command: on page 726 CALCulate<n>:ESPectrum:PEAKsearch|PSEarch:DETails...
-
Page 264: Measuring The Power In Zero Span
11.1.1.7 Measuring the Power in Zero Span Using the power measurement function, the R&S ESR determines the power of the signal in zero span by summing up the power at the individual measurement points and dividing the result by the number of measurement points. Thus it is possible to measure the power of TDMA signals during transmission, for example, or during the muting phase. - Page 265 ® Spectrum Measurements R&S Measurements Mode Description Peak Peak value from the points of the displayed trace or a segment thereof. RMS value from the points of the displayed trace or a segment thereof. Mean Mean value from the points of the displayed trace or a segment thereof.
- Page 266 ® Spectrum Measurements R&S Measurements Time Domain Power Activates the power measurement in zero span and opens a submenu to configure the power measurement. For more details see also Chapter 11.1.1.7, "Measuring the Power in Zero Span", on page 264. Remote command: on page 770 CALCulate<n>:MARKer<m>:FUNCtion:SUMMary[:STATe]...
-
Page 267: Performing Emi Measurements
CALCulate<n>:MARKer<m>:X:SLIMits:RIGHT 11.1.1.8 Performing EMI Measurements The R&S ESR features EMI measurement functionality in Spectrum mode. This func- tionality is suitable for measurements according to EMS standards. The EMI functionality is integrated into the measurement and marker functions that are available in Spectrum mode. - Page 268 10 Hz to 100 Hz, the distance is a few Hz. Between 100 MHz and 1 GHz, the distance is several MHz. The R&S ESR supports a maximum of 200000 sweep points. This number is based on typical bands measured with a single resolution bandwidth. There are sufficient sweep points to make sure that a signal is found when doing the final evaluation.
- Page 269 ® Spectrum Measurements R&S Measurements Using Transducer Factors For more information on transducer factors see Chapter 10.2.6, "Transducers", on page 145. Performing a Peak Search The purpose of a peak search is to find signals with a high interference level quickly. Usually the peak search is done with a fast detector like the peak or average detector.
- Page 270 Defining a Dwell Time for the Final Measurement The dwell time defines for how long the R&S ESR measures the signal at the frequen- cies of the marker positions. Thus the dwell time defines the amount of data that is included in the detection of the displayed results.
- Page 271 Res BW Mil Std / MIL Std (6 dB) Selects the measurement bandwidths for military EMC standards. If you select the bandwidth with the "Res BW Mil Std" softkey, the R&S ESR automati- cally changes the filter type to a 6 dB bandwidth.
- Page 272 ® Spectrum Measurements R&S Measurements Sweep Points Opens an edit dialog box to enter the number of measured values collected during a single measurement. For more information see "Setting the Number of Sweep Points" on page 268. Remote command: on page 803 [SENSe:]SWEep:POINts Freq (Lin Log) Turns logarithmic scaling of the frequency axis on and off.
- Page 273 ® Spectrum Measurements R&S Measurements For more information see Chapter 10.2.5, "V-Networks Control (LISN)", on page 143. Remote command: LISN type: on page 655 INPut:LISN[:TYPE] Phase: on page 655 INPut:LISN:PHASe Highpass filter: on page 654 INPut:LISN:FILTer:HPAS[:STATe] Peak Search The reference section contains an overview of all functions that are part of the chapter and lists the associated elements of the user interface.
- Page 274 ® Spectrum Measurements R&S Measurements ● Selected Selects one of the markers. The currently selected marker is highlighted in orange color. The label indicates the marker type and its number. ● State Turns the marker on and off. ● Type Selects the marker type.
- Page 275 ® Spectrum Measurements R&S Measurements ● Detector Selects the detector for the final measurement. For more information see Chapter 10.2.2, "Detectors", on page 137. ● Auto Peak Turns automatic peak search for all markers on and off. For more information see "Performing a Peak Search"...
- Page 276 ® Spectrum Measurements R&S Measurements ● Type Shows the marker type. The marker type is either a normal marker (N) or delta marker (D). ● Shows the reference marker. Applicable only for delta markers. ● Trace Trace number the marker is positioned on. You can turn on a maximum of six traces at the same time.
-
Page 277: Cispr Apd Measurement (Amplitude Probability Distribution)
It allows you to measure unsteady levels. APD vs CISPR APD Note that the R&S ESR also provides an APD measurement for general purposes. This general APD function does not comply with CISPR 16-1-1 in various aspects and cannot be used for CISPR APD measurements. - Page 278 The R&S ESR records the probability of time for each of the 625 disturbance lev- els. Examples of CISPR APD APD of the inherent noise of the R&S ESR The following example shows the APD of the inherent noise of the R&S ESR (input ter- minated by 50 Ω. User Manual 1175.7068.02 ─ 13...
- Page 279 ® Spectrum Measurements R&S Measurements The example is based on the following configuration. Center frequency 100 MHz Span Zero span (0 Hz) Unit Reference Level -30 dBm Attenuation 20 dB 1 MHz (EMI) 10 MHz Sweep time 100 ms Detector Auto Peak All other settings are in their default (preset) state.
- Page 280 ® Spectrum Measurements R&S Measurements APD of a pulse signal The following example shows the APD of a pulse signal. The pulse period is 100 ms and the pulse width is 1 ms, so the pulse is transmitted within 1 % of the time. The example is based on the following configuration.
- Page 281 ® Spectrum Measurements R&S Measurements The second picture shows the corresponding CISPR APD function. The probability of time at 10e-2 corresponds to the duty cycle of 1 %. The maximum level of -20.145 dBm corresponds to the peak level that has been measured in spec- trum mode.
-
Page 282: Calculating Signal Amplitude Statistics
R&S ESR is set into zero span mode automatically. The R&S ESR measures the statistics of the signal applied to the RF input with the defined resolution bandwidth. To avoid affecting the peak amplitudes the video bandwidth is automatically set to 10 times the resolution bandwidth. - Page 283 Selecting the number of samples For statistics measurements with the R&S ESR, the number of samples to be mea- sured is defined instead of the sweep time. Since only statistically independent sam- ples contribute to statistics, the acquisition or sweep time is calculated automatically and displayed in the channel bar (AQT).
- Page 284 ® Spectrum Measurements R&S Measurements Figure 11-7: Amplitude probability distribution of white noise In addition to the histogram, a result table is displayed containing the following informa- tion: ● Number of samples used for calculation ● For each displayed trace: –...
- Page 285 ® Spectrum Measurements R&S Measurements Figure 11-8: CCDF of white noise A red line indicates the ideal Gaussian distribution for the measured amplitude range (white noise). The displayed amplitude range is indicated as "Mean Pwr + <x dB>" In addition to the histogram, a result table is displayed containing the following informa- tion: ●...
- Page 286 ® Spectrum Measurements R&S Measurements Softkeys for APD Measurements APD..........................286 └ BW......................286 └ # of Samples....................286 └ Scaling......................287 └ x-Axis Ref Level..................287 └ x-Axis Range..................287 └ Range Log 100 dB..............287 └ Range Log 50 dB..............287 └ Range Log 10 dB..............287 └...
- Page 287 ® Spectrum Measurements R&S Measurements For details see "Selecting the number of samples" on page 283. Remote command: on page 762 CALCulate<n>:STATistics:NSAMples Scaling ← APD Opens a submenu to change the scaling parameters of x- and y-axis. x-Axis Ref Level ← Scaling ← APD Opens an edit dialog box to enter the reference level in the currently active unit (dBm, dBµV, etc).
- Page 288 ® Spectrum Measurements R&S Measurements Remote command: Logarithmic scaling: DISP:WIND:TRAC:Y:SPAC LOG, see DISPlay[:WINDow<n>]:TRACe<t>:Y: on page 636 SPACing Display range: DISP:WIND:TRAC:Y 10DB, see DISPlay[:WINDow<n>]:TRACe<t>:Y[:SCALe] on page 813 Range Log 5 dB ← x-Axis Range ← Scaling ← APD Sets the level display range to 5 dB. Remote command: Logarithmic scaling: DISP:WIND:TRAC:Y:SPAC LOG, see...
- Page 289 ® Spectrum Measurements R&S Measurements Range Lin. Unit ← x-Axis Range ← Scaling ← APD Selects linear scaling in dB for the level display range, i.e. the horizontal lines are labeled in dB. Markers are displayed in the selected unit ("Unit" softkey). Delta markers are displayed in dB referenced to the power value at the position of marker 1.
- Page 290 ® Spectrum Measurements R&S Measurements Adjust Settings ← Scaling ← APD Adjusts the level settings according to the measured difference between peak and min- imum power for APD measurement or peak and mean power for CCDF measurement in order to obtain maximum power resolution. Adjusts the reference level to the current input signal.
- Page 291 ® Spectrum Measurements R&S Measurements Sets the stopping point for range 1 on trace 1 at 5 ms. SWE:EGAT:TRAC1:PER 5ms (see [SENSe:]SWEep:EGATe:TRACe<k>: PERiod on page 764) Defines the period for gated triggering to 5 ms. Adjust Settings ← APD Adjusts the level settings according to the measured difference between peak and min- imum power for APD measurement or peak and mean power for CCDF measurement in order to obtain maximum power resolution.
- Page 292 ® Spectrum Measurements R&S Measurements 0,1 % Level values over 0,1 % above mean power Level values over 1 % above mean power 10 % Level values over 10 % above mean power In addition, a red reference line indicating the calculated Gauss distribution is dis- played.
- Page 293 ® Spectrum Measurements R&S Measurements x-Axis Ref Level ← Scaling ← CCDF Opens an edit dialog box to enter the reference level in the currently active unit (dBm, dBµV, etc). The function of this softkey is identical to the "Ref Level" softkey in the "Amplitude"...
- Page 294 ® Spectrum Measurements R&S Measurements Range Log 5 dB ← x-Axis Range ← Scaling ← CCDF Sets the level display range to 5 dB. Remote command: Logarithmic scaling: DISP:WIND:TRAC:Y:SPAC LOG, see DISPlay[:WINDow<n>]:TRACe<t>:Y: on page 636 SPACing Display range: DISP:WIND:TRAC:Y 5DB, see DISPlay[:WINDow<n>]:TRACe<t>:Y[:SCALe] on page 813 Range Log 1 dB ←...
- Page 295 ® Spectrum Measurements R&S Measurements Remote command: DISP:TRAC:Y:SPAC LDB, see DISPlay[:WINDow<n>]:TRACe<t>:Y:SPACing on page 636 y-Axis Max Value ← Scaling ← CCDF Opens an edit dialog box to define the upper limit of the displayed probability range. Values on the y-axis are normalized which means that the maximum value is 1.0. The y-axis scaling is defined via the y-Unit % / Abs softkey.
- Page 296 ® Spectrum Measurements R&S Measurements Gated Trigger (On/Off) ← CCDF Activates and deactivates the gating for statistics functions for the ACP and the CCDF channel. The trigger source is changed to "EXTERN" if this function is switched on. The gate ranges are defined using the "Gate Ranges"...
- Page 297 ® Spectrum Measurements R&S Measurements Adjust Settings ← CCDF Adjusts the level settings according to the measured difference between peak and min- imum power for APD measurement or peak and mean power for CCDF measurement in order to obtain maximum power resolution. Adjusts the reference level to the current input signal.
- Page 298 ® Spectrum Measurements R&S Measurements Defining gated triggering 1. Press the "Gated Trigger" softkey to activate gated triggering (see "Gated Trigger (On/Off)" on page 290). 2. Press the "Gate Ranges" softkey to open the "Gate Ranges" dialog (see "Gate Ranges" on page 290).
- Page 299 ® Spectrum Measurements R&S Measurements 4. Optionally, define a description of the trace in the "Comment" field. 5. Activate tracing for the range by selecting "On" in the "Range <number> Use" field for the corresponding range and trace. The start and stop time edit fields are ready for input. Note: The time values have full numerical resolution and are only rounded for dis- play.
-
Page 300: Measuring The Third Order Intercept Point (Toi)
In order to measure the third order intercept point (TOI), a two-tone signal with equal carrier levels is expected at the R&S ESR input. Marker 1 and marker 2 (both normal markers) are set to the maximum of the two signals. Marker 3 and marker 4 are placed on the intermodulation products. - Page 301 ® Spectrum Measurements R&S Measurements Figure 11-9: Intermodulation products PU1 and PU2 The intermodulation product at f is generated by mixing the 2nd harmonic of useful signal P and signal P , the intermodulation product at f by mixing the 2nd harmonic of useful signal P and signal P = 2 ×...
- Page 302 ® Spectrum Measurements R&S Measurements Figure 11-10: Dependency of intermodulation level on useful signal level The useful signals at the two-port output increase proportionally with the input level as long as the two-port is in the linear range. A level change of 1 dB at the input causes a level change of 1 dB at the output.
- Page 303 (= signal level – set RF attenuation) at different useful signal offsets. Figure 11-11: Intermodulation-free range of the R&S ESR as a function of level at the input mixer and the set resolution bandwidth (Useful signal offset = 1 MHz, DANL = -145 dBm/Hz, TOI = 15 dBm;...
- Page 304 R&S Measurements Figure 11-12: Intermodulation-free dynamic range of the R&S ESR as a function of level at the input mixer and of the selected resolution bandwidth (Useful signal offset = 10 to 100 kHz, DANL = -145 dBm/Hz, TOI = 15 dBm; typical val- ues at 2 GHz).
- Page 305 Opens a submenu and activates the measurement of the 3rd order intercept point. A two-tone signal with equal carrier levels is expected at the R&S ESR input. Marker 1 and marker 2 (both normal markers) are set to the maximum of the two signals. Marker 3 and marker 4 are placed on the intermodulation products.
-
Page 306: Measuring The Am Modulation Depth
The markers can be adjusted man- ually, if necessary. The R&S ESR calculates the power at the marker positions from the measured levels. The AM modulation depth is calculated as the ratio between the power values at the reference marker and at the delta markers. -
Page 307: Measuring Harmonic Distortion
® Spectrum Measurements R&S Measurements Deltamarker 3, on the other hand, can be moved for fine adjustment irrespective of marker 2. Marker 1 can also be moved manually for re-adjustment without affecting the position of the deltamarkers. For general information on measuring the AM modulation depth see Chapter 11.1.1.12, "Measuring the AM Modulation Depth",... - Page 308 ® Spectrum Measurements R&S Measurements As a result, the zero span sweeps on all harmonics are shown, as well as the RMS values and the THD (total harmonic distortion). About Harmonics Distortion Measurement Measuring the harmonics of a signal is a frequent problem which can be solved best using a signal analyzer.
- Page 309 The sweep time is, therefore, also increased con- siderably. In this case, the measurement of individual harmonics is carried out with the R&S ESR set to a small span. Only the frequency range around the harmonics will then be measured with a small resolution bandwidth.
- Page 310 ® Spectrum Measurements R&S Measurements Measurement Results As a result of the harmonics distortion measurement, the zero span sweeps on all detected harmonics are shown in the diagram, separated by red display lines. This pro- vides a very good overview of the measurement. In addition, a result table is displayed providing the following information: ●...
-
Page 311: Measurement Configuration - Meas Config Key
® Spectrum Measurements R&S Configuration Remote command: on page 757 CALCulate<n>:MARKer<m>:FUNCtion:HARMonics:NHARmonics Harmonic Sweep Time ← Harmonic Distortion For details refer to the Sweeptime Manual softkey in the "Bandwidth" menu. Harmonic RBW Auto ← Harmonic Distortion Enables/disables the automatic adjustment of the resolution bandwidth for filter types Normal (3dB) (Gaussian) and 5-Pole filters. -
Page 312: Initializing The Configuration - Preset Key
® Spectrum Measurements R&S Configuration mode other than Spectrum mode, be sure to check the specific measurement or mode description for settings that may deviate from these common settings. 11.2.1 Initializing the Configuration – PRESET Key The PRESET key resets the instrument to the default setting and therefore provides a defined initial state as a known starting point for measurements. - Page 313 ® Spectrum Measurements R&S Configuration The parameter set of the initial configuration can be customized using the "Startup Recall" softkey in the "Save/Rcl" menu. For further information refer to Chapter 15.1, "Saving and Recalling Settings Files – SAVE/RCL Key", on page 499. Table 11-5: Initial configuration Parameter Setting...
-
Page 314: Selecting The Frequency And Span - Freq Key
® Spectrum Measurements R&S Configuration 11.2.2 Selecting the Frequency and Span – FREQ Key The FREQ key is used to configure the frequency axis, to set the frequency offset and the signal track function. You can configure the frequency axis either by the start and stop frequency or the center frequency and the span. - Page 315 ® Spectrum Measurements R&S Configuration └ Track BW (span > 0)..................318 └ Track Threshold (span > 0)................318 └ Select Trace (span > 0).................318 Center Opens an edit dialog box to enter the center frequency. The allowed range of values for the center frequency depends on the frequency span.
- Page 316 ® Spectrum Measurements R&S Configuration Remote command: FREQ:CENT:STEP:LINK SPAN, see [SENSe:]FREQuency:CENTer:STEP:LINK on page 792 FREQ:CENT:STEP:LINK:FACT 50PCT, see [SENSe:]FREQuency:CENTer:STEP: on page 793 LINK:FACTor 0.5*RBW (span > 0) ← CF Stepsize Sets the step size for the center frequency to 50 % of the resolution bandwidth. Remote command: FREQ:CENT:STEP:LINK RBW, see [SENSe:]FREQuency:CENTer:STEP:LINK...
- Page 317 ® Spectrum Measurements R&S Configuration Remote command: on page 634 [SENSe:]FREQuency:CENTer:STEP Start Opens an edit dialog box to define the start frequency. The following range of values is allowed: ≤ f ≤ f – span start and span are specified in the data sheet. Remote command: on page 794 [SENSe:]FREQuency:STARt...
-
Page 318: Specifying The Frequency Axis By The Start And Stop Frequency
® Spectrum Measurements R&S Configuration Remote command: on page 795 CALCulate<n>:MARKer<m>:FUNCtion:STRack[:STATe] Track BW (span > 0) ← Signal Track (span > 0) Opens an edit dialog box to set the search bandwidth for signal tracking. The fre- quency range is calculated as a function of the center frequency. Remote command: CALCulate<n>:MARKer<m>:FUNCtion:STRack:BANDwidth|BWIDth on page 795... -
Page 319: Modifying The Frequency Axis By An Offset
® Spectrum Measurements R&S Configuration a) If span > 0: Press "0.1*Span", "0.5*Span" or "x*Span" to define the step size for the center frequency as percentage of the span (see Stepsize). b) If span = 0: Press "0.1*RBW", "0.5*RBW", or "x*RBW" to define the step size for the center frequency as percentage of the resolution bandwidth (see Stepsize). -
Page 320: Softkeys Of The Span Menu
® Spectrum Measurements R&S Configuration Menu and softkey description ● Chapter 11.2.3.1, "Softkeys of the Span Menu", on page 320 Task ● Chapter 11.2.3.2, "Specifying the Span (Alternatives)", on page 320 11.2.3.1 Softkeys of the Span Menu The following chapter describes all softkeys available in the "Span" menu. It is possible that your instrument configuration does not provide all softkeys. -
Page 321: Setting The Level Display And Configuring The Rf Input - Ampt Key
® Spectrum Measurements R&S Configuration 3. In zero span, the span corresponds to the sweep time. In that case, press the Sweeptime Manual softkey and enter a sweep time. 11.2.4 Setting the Level Display and Configuring the RF Input – AMPT Key The AMPT key is used to set the reference level, the level range and unit, the scaling and the RF attenuation. -
Page 322: Ref Level
® Spectrum Measurements R&S Configuration Noise Correction......................325 Input (AC/DC)......................325 Input 50 Ω/75 Ω ......................325 Ref Level Opens an edit dialog box to enter the reference level in the current unit (dBm, dBµV, etc). The reference level is the maximum value the AD converter can handle without distor- tion of the measured value. -
Page 323: Range Log 5 Db
® Spectrum Measurements R&S Configuration Remote command: Logarithmic scaling: DISP:WIND:TRAC:Y:SPAC LOG, see DISPlay[:WINDow<n>]:TRACe<t>:Y: on page 636 SPACing Display range: DISP:WIND:TRAC:Y 10DB, see DISPlay[:WINDow<n>]:TRACe<t>:Y[:SCALe] on page 813 Range Log 5 dB ← Range Sets the level display range to 5 dB. Remote command: Logarithmic scaling: DISP:WIND:TRAC:Y:SPAC LOG, see... -
Page 324: Range Lin. Unit
® Spectrum Measurements R&S Configuration Range Lin. Unit ← Range Selects linear scaling in dB for the level display range, i.e. the horizontal lines are labeled in dB. Markers are displayed in the selected unit ("Unit" softkey). Delta markers are displayed in dB referenced to the power value at the position of marker 1. -
Page 325: Ref Level Position
Remote command: on page 715 [SENSe:]POWer:NCORrection Input (AC/DC) Toggles the RF input of the R&S ESR between AC and DC coupling. Remote command: on page 641 INPut:COUPling Input 50 Ω/75 Ω Uses 50 Ω or 75 Ω as reference impedance for the measured levels. Default setting is 50 Ω. -
Page 326: Specifying The Amplitude
® Spectrum Measurements R&S Configuration The setting 75 Ω should be selected if the 50 Ω input impedance is transformed to a higher impedance using a 75 Ω adapter of the RAZ type (= 25 Ω in series to the input impedance of the instrument). - Page 327 When you select an auto adjust function a measurement is performed to determine the optimal settings. If you select an auto adjust funtion for a triggered measurement, you can select how the R&S ESR should behave: ● (default:) The measurement for adjustment waits for the next trigger ●...
- Page 328 ® Spectrum Measurements R&S Configuration Remote command: on page 798 [SENSe:]ADJust:FREQuency Auto Level Defines the optimal reference level for the current measurement automatically. The measurement time for automatic leveling can be defined using the Settings soft- key. You can define a threshold that the signal must exceed before the reference level is adjusted, see "Upper Level Hysteresis"...
- Page 329 ® Spectrum Measurements R&S Configuration In frequency sweep mode, the analyzer provides several possible methods of sweep- ing: ● "Sweep" on page 329 ● "FFT" on page 329 (not available with 5-Pole filters, channel filters or RRC filters, Chapter 11.2.6.3, "Selecting the Appropriate Filter Type", on page 336) ●...
-
Page 330: Setting The Bandwidths And Sweep Time - Bw Key
® Spectrum Measurements R&S Configuration 11.2.6 Setting the Bandwidths and Sweep Time – BW Key The BW key is used to set the resolution bandwidth, video bandwidth (VBW) and sweep time (SWT). The values available for resolution bandwidth and video bandwidth depend on the selected filter type. -
Page 331: Res Bw Manual
® Spectrum Measurements R&S Configuration Coupling Ratio......................334 └ RBW/VBW Sine [1/1]..................334 └ RBW/VBW Pulse [.1]..................334 └ RBW/VBW Noise [10]................... 334 └ RBW/VBW Manual..................335 └ Span/RBW Auto [100]...................335 └ Span/RBW Manual..................335 └ Default Coupling................... 335 Filter Type........................336 Res BW Manual Opens an edit dialog box to enter a value for the resolution bandwidth. -
Page 332: Video Bw Auto
In this case, the R&S ESR displays the error message "UNCAL" and marks the indicated sweep time with a red bullet. -
Page 333: Sweeptime Auto
(RBW) (not available for zero span). If you change the span, resolution bandwidth or video bandwidth, the sweep time is automatically adjusted. The R&S ESR always selects the shortest sweep time that is possible without falsifying the signal. The maximum level error is < 0.1 dB, compared to using a longer sweep time. -
Page 334: Fft Filter Mode
® Spectrum Measurements R&S Configuration FFT Filter Mode ← Sweep Type Defines the filter mode to be used for FFT filters by defining the partial span size. The partial span is the span which is covered by one FFT analysis. Auto ←... - Page 335 Span/RBW Auto [100] ← Coupling Ratio Sets the following coupling ratio: "resolution bandwidth = span/100" This coupling ratio is the default setting of the R&S ESR. This setting takes effect if you define the resolution bandwidth automatically (Res BW Auto).
-
Page 336: Specifying The Bandwidth
® Spectrum Measurements R&S Configuration Filter Type Opens a submenu to select the filter type. When measuring Spurious Emissions, using this softkey automatically opens the "Sweep List" dialog (see "Sweep List dialog box" on page 259). The submenu contains the following softkeys: ●... -
Page 337: List Of Available Rrc And Channel Filters
® Spectrum Measurements R&S Configuration ● Channel filters For details see Chapter 11.2.6.4, "List of Available RRC and Channel Filters", on page 337 . Channel filters do not support FFT mode. ● RRC filters For details see Chapter 11.2.6.4, "List of Available RRC and Channel Filters", on page 337 . - Page 338 ® Spectrum Measurements R&S Configuration Filter Bandwidth Filter Type Application 10 kHz CFILter 12.5 kHz CFILter CDMAone 14 kHz CFILter ETS300 113 (20 kHz channels) 15 kHz CFILter 16 kHz CFILter ETS300 113 (25 kHz channels) 18 kHz, a=0.35 TETRA 20 kHz CFILter 21 kHz...
-
Page 339: Configuring The Sweep Mode - Sweep Key
® Spectrum Measurements R&S Configuration Filter Bandwidth Filter Type Application 28 MHz CFILter 40 MHz CFILter 11.2.7 Configuring the Sweep Mode – SWEEP Key The SWEEP key is used to configure the sweep mode. Continuous sweep or single sweep is possible. The sweep time and the number of measured values are set. To open the Sweep menu ●... - Page 340 In this case, the R&S ESR displays the error message "UNCAL" and marks the indicated sweep time with a red bullet.
- Page 341 (RBW) (not available for zero span). If you change the span, resolution bandwidth or video bandwidth, the sweep time is automatically adjusted. The R&S ESR always selects the shortest sweep time that is possible without falsifying the signal. The maximum level error is < 0.1 dB, compared to using a longer sweep time.
- Page 342 In the "Average Sweep Count" dialog box, enter 10. ● Press the "Single Sweep" on page 340 softkey: R&S ESR performs the "Max Hold" function over 10 sweeps. Remote command: on page 803 [SENSe:]SWEep:COUNt Sweep Points Opens an edit dialog box to enter the number of measured values to be collected dur- ing one sweep.
- Page 343 Opens a dialog box to set the number of frames to be captured in a single sweep. Therefore, the frame count defines the number of traces the R&S ESR plots in the Spectrogram result display in a single sweep. The maximum number of possible frames depends on the history depth (see CALCulate<n>:SGRam:HDEPth...
-
Page 344: Specifying The Sweep Settings
® Spectrum Measurements R&S Configuration This softkey is available in single sweep mode. Remote command: on page 826 CALCulate<n>:SGRam:FRAMe:COUNt Spectrogram Clear For spectrogram measurements only. Resets the Spectrogram result display and clears its history buffer. Remote command: on page 618 CALCulate<n>:SGRam:CLEar[:IMMediate] 11.2.7.2 Specifying the Sweep Settings... - Page 345 ® Spectrum Measurements R&S Configuration with a special option, model or (measurement) mode, this information is provided in the corresponding softkey description. Trg/Gate Source......................345 └ Free Run....................... 345 └ External......................345 └ Video......................346 └ Power...................... 346 └ IF Power/BB Power..................346 └ Time......................347 Trg/Gate Level......................347 Trg/Gate...
- Page 346 IF Power/BB Power ← Trg/Gate Source Defines triggering of the measurement using the second intermediate frequency. For this purpose, the R&S ESR uses a level detector at the second intermediate fre- quency. The available trigger levels depend on the RF attenuation and preamplification. A refer- ence level offset, if defined, is also considered.
- Page 347 Note: Be aware that in auto sweep type mode, due to a possible change in sweep types, the bandwidth may vary considerably for the same RBW setting. The R&S ESR is triggered as soon as the trigger level is exceeded around the selected frequency (= start frequency in the frequency sweep).
- Page 348 ® Spectrum Measurements R&S Configuration Trigger Offset Opens an edit dialog box to enter the time offset between the trigger signal and the start of the sweep. offset > 0: Start of the sweep is delayed offset < 0: Sweep starts earlier (pre-trigger) Only possible for span = 0 (e.g.
- Page 349 ® Spectrum Measurements R&S Configuration This softkey requires the following "Trigger Mode" (see "Trg/Gate Source" on page 345): span > 0 External IF Power/BB PowerIF Power span = 0 External IF Power/BB PowerIF Power Video If a different mode is active, the IF Power/BB Power trigger mode is automatically selected.
- Page 350 ® Spectrum Measurements R&S Configuration Remote command: on page 810 [SENSe:]SWEep:EGATe:HOLDoff Gate Length (Gate Mode Edge) ← Gate Settings Opens an edit dialog box to enter the gate length. The gate length in relation to the sweep is indicated by a line labeled "GL". The length of the gate signal defines if the sweep is to be interrupted.
-
Page 351: Specifying The Trigger Settings
® Spectrum Measurements R&S Configuration 11.2.8.2 Specifying the Trigger Settings 1. Press the "Trg/Gate Source" softkey to select the trigger mode (for details see "Trg/ Gate Source" on page 345. 2. Press the Trg/Gate Level softkey to set the trigger level. 3. - Page 352 ® Spectrum Measurements R&S Configuration Figure 11-14: TDMA signal with GATE OFF Figure 11-15: Timing diagram for GATE, GATE DELAY and GATE LENGTH User Manual 1175.7068.02 ─ 13...
-
Page 353: Input/Output Configuration - Input/Output Key
® Spectrum Measurements R&S Configuration Figure 11-16: TDMA signal with GATE ON 11.2.9 Input/Output Configuration – INPUT/OUTPUT Key The [INPUT/OUTPUT] key is used to configure input and output sources for measure- ment functions. 11.2.9.1 Softkeys of the Input/Output Menu The following table shows all softkeys available in the "Input/Output" menu. It is possi- ble that your instrument configuration does not provide all softkeys. - Page 354 Output....................... 354 Trigger Out........................354 Probe Config....................... 354 Input (AC/DC) Toggles the RF input of the R&S ESR between AC and DC coupling. Remote command: on page 641 INPut:COUPling Preselector (On Off) Turns the preselector on and off. Remote command:...
-
Page 355: Using Active Probes For Input
By default, when you press the probe's micro button, the R&S ESR is set to single sweep mode and a single sweep is performed. This allows you to start a measurement whilst applying the probe to a certain pin on the board under test. - Page 356 2. Connect the adapter's USB cable to a USB connector on the R&S ESR. 3. Connect the probe to the adapter. Once the probe and adapter have been connected to the R&S ESR correctly and the analyzer has recognized the probe, the "Generic Probe" transducer is activated and you can start a measurement.
-
Page 357: Analysis
® Spectrum Measurements R&S Analysis State..........................357 Name...........................357 Serial Number......................357 Part number........................ 357 Micro Button Action..................... 357 State Activates a connected probe. Use this command to switch off the probe and measure the digital input without considering the transducer factor of the probe. Remote command: on page 791 PROBe[:STATe]... -
Page 358: Trace Configuration
The TRACE key is used to configure the data acquisition for measurement and the analysis of the measurement data. The R&S ESR is capable of displaying up to six different traces at a time in a diagram. A trace consists of a maximum of 691 displayed measurement points on the horizontal axis (frequency or time). - Page 359 ® Spectrum Measurements R&S Analysis ● "ASCII Trace Export" on page 169 ● "Decim Sep" on page 170 Functions to configure traces exclusive in Spectrum mode Trace 1/Trace 2/Trace 3/Trace 4/Trace 5/Trace 6............359 └ Clear Write....................359 └ Hold.......................360 └ Hold......................360 └...
- Page 360 If the level range or reference level is changed, the R&S ESR automatically adapts the measured data to the changed display range. This allows an amplitude zoom to be made after the measurement in order to show details of the trace.
- Page 361 ® Spectrum Measurements R&S Analysis Remote command: DISP:TRAC:MODE VIEW, see DISPlay[:WINDow<n>]:TRACe<t>:MODE on page 652 Blank ← Trace 1/Trace 2/Trace 3/Trace 4/Trace 5/Trace 6 Hides the selected trace. Remote command: DISP:TRAC OFF, see on page 818 DISPlay[:WINDow<n>]:TRACe<t>[:STATe] Hold/Cont ← Trace 1/Trace 2/Trace 3/Trace 4/Trace 5/Trace 6 Switches the reset of the traces in Min Hold, Max Hold and Average mode after some specific parameter changes have been made on and off.
- Page 362 ® Spectrum Measurements R&S Analysis Trace mode Detector Max Hold Max Peak Min Hold Min Peak Remote command: on page 822 [SENSe:][WINDow:]DETector<trace>[:FUNCtion]:AUTO Auto Peak ← Detector ← Trace 1/Trace 2/Trace 3/Trace 4/Trace 5/Trace 6 Selects the "Auto Peak" detector. The "Auto Peak" detector determines the maximum and minimum value within a mea- surement point.
- Page 363 This low average value is usually corrected in noise power measurements by a 2.5 dB factor. Therefore the R&S ESR offers the selection of linear averaging. The trace data is converted to linear values prior to averaging, then averaged and reconverted to loga- rithmic values.
- Page 364 ® Spectrum Measurements R&S Analysis This averaging method only takes effect if the grid is set to a logarithmic scale ("Range" softkey), i.e. the unit of the data is dBm. In this case the values are averaged in dBm. Otherwise (i.e. with linear scaling), the behavior is the same as with linear averaging (see softkey).
-
Page 365: Configuring Traces
® Spectrum Measurements R&S Analysis Remote command: CALC:MATH:MODE LIN, see on page 817 CALCulate<n>:MATH:MODE Log ← Trace Math Mode Activates logarithmic subtraction. This subtraction method only takes effect if the grid is set to a logarithmic scale (see Range softkey), i.e. the unit of the data is dBm. In this case the values are subtracted in dBm. - Page 366 ® Spectrum Measurements R&S Analysis 2. For each trace you can define the following settings: ● Display Mode Clear Write ● Max Hold ● Min Hold ● Average ● View ● Blank For details see Chapter 10.2.3, "Trace Modes", on page 141. Detector Auto Select Activates automatic detector selection (see Auto Select...
-
Page 367: Specifying The Trace Settings
® Spectrum Measurements R&S Analysis Preset All Traces Trace 1: Clear Write Trace 2-6: Blank Select Max | Avg | Min Trace 1: Max Hold Trace 2: Average Trace 3: Min Hold Trace 4-6: Blank Select Max | ClrWrite | Min Trace 1: Max Hold Trace 2:... - Page 368 ® Spectrum Measurements R&S Analysis means that with linear level display the average is formed over linear amplitude values. The sweep mode (continuous or single sweep, for details see Chapter 11.2.7, "Config- uring the Sweep Mode – SWEEP Key", on page 339) and running averaging apply to the average display analogously.
-
Page 369: Detector Overview
The measurement detector for the individual display modes can be selected directly by the user or set automatically by the R&S ESR. The detector activated for the specific trace is indicated in the corresponding trace display field by an abbreviation. - Page 370 ® Spectrum Measurements R&S Analysis several columns (depending on measurement) which are also separated by a semico- lon. Exporting a single trace vs exporting all traces Note that the file containing the trace data has a slightly different structure when you export all traces compared to exporting a single trace only.
- Page 371 ® Spectrum Measurements R&S Analysis Data section (traces) Trace 1: Trace Mode;CLR/WRITE; Trace mode Detector;MAX PEAK; Detector type X-Unit;Hz; Unit of the x-axis Y-Unit;Hz; Unit of the y-axis Values;1343; Number of measurement points 150000.000000;3.541122; String of results 154500.000000;5.776306;[...] Trace 2: (…) Blue font: Information provided when you export a single trace Green font: Information provided when you export all traces...
-
Page 372: Spectrogram
® Spectrum Measurements R&S Analysis Data section (traces) Trace 1: Trace Mode;CLR/WRITE; Trace mode Detector;MAX PEAK; Detector type X-Unit;Hz; Unit of the x-axis Y-Unit;Hz; Unit of the y-axis Preamplifier;OFF; State of the preamplifier Transducer;OFF; Transducer information Values;691; Number of measurement points 150000.000000;3.541122;... - Page 373 ® Spectrum Measurements R&S Analysis Figure 11-20: Screen layout of the spectrogram result display 1 = Spectrum result display 2 = Spectrogram result display 3 = Frame indicator 4 = Time stamp / frame number 5 = Color map 6 = Marker 7 = Deltamarker 8 = Marker list ●...
- Page 374 Spectrogram indicates the currently selected frame. The actual number of the currently selected frame is shown below the diagram (4). If the time stamp is active, the R&S ESR shows the time stamp instead of the frame number (see Time Stamp (On Off).
-
Page 375: Softkeys Of The Spectrogram Menu
Sweep Points (see "General Information" on page 372). If the memory is full, the R&S ESR deletes the oldest frames stored in the memory and replaces them with the new data. User Manual 1175.7068.02 ─ 13... -
Page 376: Markers
11.3.3 Markers 11.3.3.1 Controlling Markers The markers are used for marking points on traces, reading out measurement results and for selecting a display section quickly. The R&S ESR provides 16 markers per trace. To open the Marker menu ● Press the MKR key. - Page 377 ® Spectrum Measurements R&S Analysis Tasks ● "Basic Marker Functions" on page 378 Softkeys of the Marker Menu Functions to control markers described elsewhere: ● "Marker 1 / Marker 2 / Marker 3 / … Marker 16,/ Marker Norm/Delta" on page 171 ●...
- Page 378 The zoomed display range is then configured and the new settings are used by the R&S ESR for further measurements. If the display has not yet been switched to the new frequency display range and you press the softkey, the procedure is aborted.
- Page 379 ® Spectrum Measurements R&S Analysis ● To switch to another marker, click on the marker label in the diagram. Alternatively, select the corresponding softkey. If necessary, select the More Markers softkey first to open a submenu that contains all marker numbers. ●...
- Page 380 ® Spectrum Measurements R&S Analysis ● To zoom into the display around a marker, press the "Marker Zoom (span > 0)" on page 378 softkey and enter a span. ● To link the delta marker1 to marker1, so if the x-axis value of the marker 1 is changed, the delta marker 1 follows on the same x-position, press the Link Mkr1 and Delta1...
-
Page 381: Positioning Markers (Mkr➙ Key)
® Spectrum Measurements R&S Analysis Func Activated marker or measurement function Func.Result Result of the active marker or measurement function 11.3.3.2 Positioning Markers (MKR➙ Key) The MKR➙ key is used for search functions of measurement markers, assignment of the marker frequency as center frequency, restriction of the search area and character- ization of maxima and minima. - Page 382 ® Spectrum Measurements R&S Analysis ● "Next Min" on page 175 ● "Next Mode" on page 175 ● "Search Limits" on page 176 ● "Peak Excursion" on page 177 ● Spectrogram: Chapter 10.4.2.3, "Markers in Spectrograms", on page 177 Functions to position markers exclusive in Spectrum mode Center =Mkr Freq (span >...
- Page 383 0 Hz in the marker search functions. Examining a Signal at the Center in Detail 1. Press the [PRESET] key to set the R&S ESR to the default setting. 2. Press the [MKR ->] key to open the "Marker To" menu.
- Page 384 ® Spectrum Measurements R&S Analysis 9. Reduce the span, e.g. using the rotary knob. Specifying the Suitable Peak Excursion 1. If the Peak Excursion softkey is used, the default value is sufficient, since, in this mode, the next lower maximum or next higher minimum will always be detected. 2.
-
Page 385: Performing Peak Searches With Markers - Peak Search Key
® Spectrum Measurements R&S Analysis The detected signals and their order are different depending on the peak excursion setting and the peak search method (whether the next lower maximum or the next rela- tive maximum is searched). The following results are obtained. All tests start with the marker set to signal 1 by pressing the Peak softkey. -
Page 386: Measuring With Markers (Mkr Func Key)
® Spectrum Measurements R&S Analysis 11.3.3.4 Measuring with Markers (MKR FUNC Key) The [MKR FUNC] key provides various functions for markers, e.g. ● Phase Noise measurements ● Setting reference points ● Marker demodulation ● Defining Marker peak lists ● Signal counts ●... - Page 387 ® Spectrum Measurements R&S Analysis └ Ref. Fixed On/Off..................389 └ Ref Point Level....................389 └ Ref Point Frequency (span > 0)/Ref Point Time (zero span)......389 └ Peak Search....................390 Marker Demod......................390 └ Mkr Demod On/Off..................390 └ AM.........................390 └ FM.........................390 └...
- Page 388 ® Spectrum Measurements R&S Analysis Remote command: on page 839 CALCulate<n>:MARKer<m>:COUNt on page 839 CALCulate<n>:MARKer<m>:COUNt:FREQuency? Noise Meas On/Off Switches the noise measurement for the active marker on or off. The corresponding marker becomes the normal marker. For more information on noise measurement see "Measurement of Noise Density"...
- Page 389 ® Spectrum Measurements R&S Analysis Ph. Noise Auto Peak Search ← Phase Noise Activates an automatic peak search for the reference fixed marker 1 at the end of each particular sweep. This function can be used to track a drifting source during a phase noise measure- ment.
- Page 390 ® Spectrum Measurements R&S Analysis Remote command: on page 837 CALCulate<n>:DELTamarker<m>:FUNCtion:FIXed:RPOint:X Peak Search ← Ref Fixed Sets the maximum value of the selected trace as the reference point. Remote command: CALCulate<n>:DELTamarker<m>:FUNCtion:FIXed:RPOint:MAXimum[:PEAK] on page 836 Marker Demod The marker demodulation function sends the AM data at the current marker frequency (in a bandwidth corresponding to the RBW) to the audio output.
- Page 391 ® Spectrum Measurements R&S Analysis For more information see "AF Demodulation" on page 395. Remote command: CALCulate<n>:MARKer<m>:FUNCtion:DEModulation:CONTinuous on page 843 Squelch ← Marker Demod Activates the squelch function, i.e. the audible AF is cut off below a defined threshold level. Thus, you avoid hearing noise at the audio output when no signal is available. The squelch function activates the video trigger function (see "Video"...
- Page 392 ® Spectrum Measurements R&S Analysis Remote command: CALC:MARK1:FUNC:NDBD:STAT ON, see CALCulate<n>:MARKer<m>:FUNCtion: on page 847 NDBDown:STATe CALC:MARK1:FUNC:NDBD 3dB, see CALCulate<n>:MARKer<m>:FUNCtion: on page 845 NDBDown CALC:MARK1:FUNC:NDBD:RES? , see CALCulate<n>:MARKer<m>:FUNCtion: on page 846 NDBDown:RESult? CALC:MARK:FUNC:NDBD:QFAC?, see CALCulate<n>:MARKer<m>:FUNCtion: on page 846 NDBDown:QFACtor CALC:MARK1:FUNC:NDBD:FREQ? (span > 0), see CALCulate<n>:MARKer<m>: on page 845 FUNCtion:NDBDown:FREQuency?
- Page 393 ® Spectrum Measurements R&S Analysis Peak Excursion ← Marker Peak List Opens an edit dialog box for level measurements to enter the minimum level value by which a signal must rise or fall so that it will be identified as a maximum or a minimum by the search functions.
- Page 394 ® Spectrum Measurements R&S Analysis Decim Sep ← Marker Peak List Selects the decimal separator with floating-point numerals for the ASCII Trace export to support evaluation programs (e.g. MS-Excel) in different languages. The values '.' (decimal point) and ',' (comma) can be set. Remote command: on page 819 FORMat:DEXPort:DSEParator...
- Page 395 5. To change to continuous demodulation for span > 0, press the Continuous Demod (span > 0) softkey. AF Demodulation The R&S ESR provides demodulators for AM and FM signals. With these demodula- tors, a displayed signal can be identified acoustically by using headphones. User Manual 1175.7068.02 ─ 13...
- Page 396 Frequency Measurement with the Frequency Counter In order to accurately determine the frequency of a signal, the R&S ESR is equipped with a frequency counter which measures the frequency of the RF signal at the inter- mediate frequency. Using the measured IF, the R&S ESR calculates the frequency of the RF input signal by applying the known frequency conversion factors.
- Page 397 µV/Hz, the noise current density in µA/Hz or the noise power density in µW/Hz. In the default setting, the R&S ESR uses the sample detector for the noise function. With the sample detector, the trace can additionally be set to AVERAGE to stabilize the measured values.
- Page 398 Spectrum Measurements R&S Analysis The R&S ESR noise figure can be calculated from the measured power density level. It is calculated by deducting the set RF attenuation (RF Att) from the displayed noise level and adding 174 to the result.
-
Page 399: Lines
® Spectrum Measurements R&S Analysis All markers can be defined as band power markers, each with a different span. When a band power marker is activated, if no marker is active yet, marker 1 is activated. Other- wise, the currently active marker is used as a band power marker (all other marker functions for this marker are deactivated). -
Page 400: Advanced Measurement Examples
Signals..............418 11.4.1 Test Setup All of the following examples are based on the standard settings of the R&S ESR. These are set with the PRESET key. A complete listing of the standard settings can be found in chapter "Instrument Functions", section "Initializing the Configuration – PRE- SET Key". -
Page 401: Measurement Of Harmonics
The internal 64 MHz reference generator is now on. The R&S ESR's RF input is switched off. 2. Switch on the RF input again for normal operation of the R&S ESR. Two ways are possible: a) Press the PRESET key. - Page 402 ® Spectrum Measurements R&S Advanced Measurement Examples Figure 11-22: Fundamental wave and the frequency and level reference point 5. Make the step size for the center frequency equal to the signal frequency a) Press the [FREQ] key. b) Press the "CF-Stepsize" softkey and press the "= Marker" softkey in the sub- menu.
-
Page 403: Measuring The Spectra Of Complex Signals
® Spectrum Measurements R&S Advanced Measurement Examples Figure 11-23: Measuring the level difference between the fundamental wave (= reference point level) and the 2nd harmonic The other harmonics are measured with steps 5 and 6, the center frequency being incremented or decremented in steps of 128 MHz using the [UPARROW] or [DNARROW] key. -
Page 404: Intermodulation Measurements
60 dB bandwidth to the 3 dB bandwidth (= shape factor). For the R&S ESR, the shape factor for bandwidths is < 5, i.e. the 60 dB bandwidth of the 30 kHz filter is <150 kHz. - Page 405 (TOI)measurement func- tion 1. Press the [MEAS] key and then the "TOI" softkey. The R&S ESR activates four markers to measure the intermodulation distance. Two markers are positioned on the useful signals and two on the intermodulation products. The 3 order intercept is calculated from the level difference between the useful signals and the intermodulation products.
-
Page 406: Measuring Signals In The Vicinity Of Noise
20 dB. The noise level is, however, increased by 10 dB. Increase the RF attenuation to 20 dB to reduce intermodulation products. The R&S ESR's intrinsic intermodulation products disappear below the noise floor. 11.4.4 Measuring Signals in the Vicinity of Noise The minimum signal level a signal analyzer can measure is limited by its intrinsic noise. -
Page 407: Measurement Example - Measuring Level At Low S/N Ratios
The R&S ESR has bandwidth settings in 1, 2, 3, 5 sequence. Increasing the bandwidth by a factor of 3 increases the displayed noise by approx. 5 dB (4.77 dB precisely). If the bandwidth is increased by a factor of 10, the displayed noise increases by a factor of 10, i.e. - Page 408 Figure 11-25: Sine wave signal with low S/N ratio. The signal is measured with the auto peak detector and is completely hidden in the intrinsic noise of the R&S ESR. 3. To suppress noise spikes the trace can be averaged.
- Page 409 Select "Average" in the "Trace Mode" drop-down menu of the selected trace. The traces of consecutive sweeps are averaged. To perform averaging, the R&S ESR automatically switches on the sample detector. The RF signal, there- fore, can be more clearly distinguished from noise.
- Page 410 ® Spectrum Measurements R&S Advanced Measurement Examples e) Press the "Video BW Manual" softkey and enter "10 kHz". The RF signal can be more clearly distinguished from noise. Figure 11-27: RF sine wave signal with low S/N ratio if a smaller video bandwidth is selected. 5.
-
Page 411: Noise Measurements
® Spectrum Measurements R&S Advanced Measurement Examples a) In the "Bandwidth" menu press the "Res BW Manual" softkey and enter "100 kHz". The displayed noise is reduced by approx. 10 dB. The signal, therefore, emerges from noise by about 10 dB. Compared to the previous setting, the video bandwidth has remained the same, i.e. -
Page 412: Measuring Noise Power Density
► Connect no signal to the RF input; terminate RF input with 50 Ω. Procedure: 1. Set the R&S ESR to its default state by pressing the PRESET key. The R&S ESR is in its default state. 2. Set the center frequency to 1.234 GHz and the span to 1 MHz. - Page 413 Determining the noise figure The noise figure of amplifiers or of the R&S ESR alone can be obtained from the noise power display. Based on the known thermal noise power of a 50 Ω resistor at room...
-
Page 414: Measurement Of Noise Power Within A Transmission Channel
= gain of DUT in dB Example: The measured internal noise power of the R&S ESR at an attenuation of 0 dB is found to be -143 dBm/1 Hz. The noise figure of the R&S ESR is obtained as follows... - Page 415 1.23 MHz Channel Bandwidth with the Channel Power Function Test setup: ► Leave the RF input of the R&S ESR open-circuited or terminate it with 50 Ω. Procedure: 1. Set the R&S ESR to its default state by pressing the [PRESET] key.
-
Page 416: Measuring Phase Noise
The settings for the frequency span, the bandwidth (RBW and VBW) and the detector are automatically set to the optimum values required for the measure- ment. Figure 11-30: Measurement of the R&S ESR's intrinsic noise power in a 1.23 MHz channel bandwidth. 6. Stabilize the measurement result by increasing the sweep time. - Page 417 5. Set the frequency offset to 10 kHz for determining phase noise by entering "10 kHz". The R&S ESR displays the phase noise at a frequency offset of 10 kHz. The mag- nitude of the phase noise in dBc/Hz is displayed in the delta marker output field at the top right of the screen (Phn2).
-
Page 418: Measurements On Modulated Signals
® Spectrum Measurements R&S Advanced Measurement Examples Figure 11-31: Measuring phase noise with the phase-noise marker function The frequency offset can be varied by moving the marker with the rotary knob or by entering a new frequency offset as a number. 11.4.6 Measurements on Modulated Signals 11.4.6.1 Measuring Channel Power and Adjacent Channel Power... - Page 419 Gaussian amplitude distribution is correct. Apart from this common method, the R&S ESR also has a true power detector, i.e. an RMS detector. It correctly displays the power of the test signal within the selected reso- lution bandwidth irrespective of the amplitude distribution, without additional correction factors being required.
- Page 420 Modulation: CDMA2000 Procedure: 1. Set the R&S ESR to its default state by pressing the [PRESET] key. The R&S ESR is in its default state. 2. Press the [FREQ] key and enter "850 MHz" as the center frequency. 3. Press the [SPAN] key and enter "4 MHz".
- Page 421 Test setup: Signal generator settings (e.g. R&S SMW): Frequency: 1950 MHz Level: 4 dBm Modulation: 3 GPP W-CDMA Reverse Link Procedure: 1. Set the R&S ESR to its default state by pressing the [PRESET] key. User Manual 1175.7068.02 ─ 13...
- Page 422 4. Set the optimum reference level and the RF attenuation for the applied signal level. a) Press the "Adjust Ref Level" softkey. The R&S ESR sets the optimum RF attenuation and the reference level for the power in the transmission channel to obtain the maximum dynamic range. The following figure shows the result of the measurement.
- Page 423 Set "Fast ACLR" softkey to "On". b) Press the "Adjust Ref Level" softkey. The R&S ESR measures the power of the individual channels with zero span. A root raised cosine filter with the parameters α = 0.22 and chip rate 3.84 Mcps (= receive filter for 3GPP W-CDMA) is used as channel filter.
- Page 424 R&S Advanced Measurement Examples Figure 11-35: The R&S ESR's dynamic range for adjacent channel power measurements on W-CDMA uplink signals is a function of the mixer level. The level of the W-CDMA signal at the input mixer is shown on the horizontal axis, i.e.
-
Page 425: Amplitude Distribution Measurements
Measurement Example – Measuring the APD and CCDF of White Noise Gener- ated by the R&S ESR 1. Set the R&S ESR to its default state by pressing the PRESET key. The R&S ESR is in its default state. 2. Configure the R&S ESR for APD measurement a) Press the AMPT key and enter "-60 dBm". - Page 426 ® Spectrum Measurements R&S Advanced Measurement Examples Figure 11-36: Amplitude probability distribution of white noise 3. Switch to the CCDF display mode. a) Press the "UP" key. b) Press the "CCDF" softkey. The CCDF display mode is switched on. User Manual 1175.7068.02 ─ 13...
- Page 427 ® Spectrum Measurements R&S Advanced Measurement Examples Figure 11-37: CCDF of white noise The CCDF trace indicates the probability that a level will exceed the mean power. The level above the mean power is plotted along the x-axis of the graph. The origin of the axis corresponds to the mean power level.
-
Page 428: Q Analyzer
® I/Q Analyzer R&S 12 I/Q Analyzer The I/Q Analyzer provides functions to capture, visualize and evaluate I/Q data. These functions include: ● capturing data from the RF input ● displaying I/Q data in various result types, e.g. separate Real/Imag diagrams or as an I/Q-vector Menu and softkey description The "I/Q Analyzer"... -
Page 429: Softkeys And Parameters Of The I/Q Analyzer Menu
® I/Q Analyzer R&S Softkeys and Parameters of the I/Q Analyzer Menu Further information ● Some general information on working with I/Q data can be found in Chapter 12.5, "Working with I/Q Data", on page 443. 12.1 Softkeys and Parameters of the I/Q Analyzer Menu This section describes the softkeys and parameters of the "I/Q Analyzer"... - Page 430 Data Acquisition ← I/Q Analyzer Opens a dialog box to configure data acquisition in I/Q Analyzer mode. Sample Rate ← Data Acquisition ← I/Q Analyzer Defines the I/Q data sample rate of the R&S ESR. Remote command: on page 860 TRACe<n>:IQ:SRATe...
- Page 431 ® I/Q Analyzer R&S Softkeys and Parameters of the I/Q Analyzer Menu "Magnitude" Shows the values in time domain "Spectrum" Displays the frequency spectrum of the captured I/Q samples. User Manual 1175.7068.02 ─ 13...
- Page 432 ® I/Q Analyzer R&S Softkeys and Parameters of the I/Q Analyzer Menu "I/Q-Vector" Displays the captured samples in an I/Q-plot. The samples are con- nected by a line. "Real/Imag Displays the I and Q values in separate diagrams. (I/Q)" Remote command: on page 857 CALCulate<n>:FORMat C/N, C/No ←...
- Page 433 ® I/Q Analyzer R&S Softkeys and Parameters of the I/Q Analyzer Menu Carrier-to-noise measurements are not available in zero span mode. Note: Carrier-to-noise measurements are also available in the I/Q Analyzer, but only for Spectrum displays (see "Display Config" on page 430). For general information on performing carrier-to-noise ratio measurements see Chap- ter 11.1.1.3, "Measuring the Carrier-to-Noise...
-
Page 434: Softkeys Of The Amplitude Menu In I/Q Analyzer Mode
® I/Q Analyzer R&S Softkeys of the Amplitude Menu in I/Q Analyzer Mode Remote command: on page 693 [SENSe:]POWer:ACHannel:PRESet 12.2 Softkeys of the Amplitude Menu in I/Q Analyzer Mode In I/Q Analyzer mode, the "Amplitude" menu, which is displayed when you select the [AMPT] key, contains the following functions. - Page 435 ® I/Q Analyzer R&S Softkeys of the Amplitude Menu in I/Q Analyzer Mode This command is only available if the display configuration for the I/Q Analyzer is set to "I/Q Vector" or "Real/Imag (I/Q)", see "Display Config" on page 430. Range Opens a submenu to define the display range of the level axis.
- Page 436 ® I/Q Analyzer R&S Softkeys of the Amplitude Menu in I/Q Analyzer Mode Remote command: Logarithmic scaling: DISP:WIND:TRAC:Y:SPAC LOG, see DISPlay[:WINDow<n>]:TRACe<t>:Y: on page 636 SPACing Display range: DISP:WIND:TRAC:Y 5DB, see DISPlay[:WINDow<n>]:TRACe<t>:Y[:SCALe] on page 813 Range Log 1 dB ← Range Sets the level display range to 1 dB.
- Page 437 ® I/Q Analyzer R&S Softkeys of the Amplitude Menu in I/Q Analyzer Mode Unit Opens the "Unit" submenu to select the unit for the level axis. The default setting in spectrum mode is dBm. If a transducer is switched on, the softkey is not available. In general, the signal analyzer measures the signal voltage at the RF input.
- Page 438 Remote command: on page 715 [SENSe:]POWer:NCORrection Input (AC/DC) Toggles the RF input of the R&S ESR between AC and DC coupling. Remote command: on page 641 INPut:COUPling Input 50 Ω/75 Ω Uses 50 Ω or 75 Ω as reference impedance for the measured levels. Default setting is 50 Ω.
-
Page 439: Softkeys Of The Marker To Menu In I/Q Analyzer Mode
® I/Q Analyzer R&S Softkeys of the Trigger Menu in I/Q Analyzer Mode 12.3 Softkeys of the Marker To Menu in I/Q Analyzer Mode In I/Q Analyzer mode, The "Marker To" menu is identical to the one in Spectrum mode (see "Softkeys of the Marker To Menu"... - Page 440 ® I/Q Analyzer R&S Softkeys of the Trigger Menu in I/Q Analyzer Mode Remote command: on page 808 TRIGger<n>[:SEQuence]:SOURce on page 811 [SENSe:]SWEep:EGATe:SOURce Free Run ← Trg/Gate Source The start of a sweep is not triggered. Once a measurement is completed, another is started immediately.
- Page 441 Note: Be aware that in auto sweep type mode, due to a possible change in sweep types, the bandwidth may vary considerably for the same RBW setting. The R&S ESR is triggered as soon as the trigger level is exceeded around the selected frequency (= start frequency in the frequency sweep).
- Page 442 ® I/Q Analyzer R&S Softkeys of the Trigger Menu in I/Q Analyzer Mode The sweep starts after a positive or negative edge of the trigger signal. The default set- ting is "Pos". The setting applies to all modes with the exception of the "Free Run" and "Time"...
-
Page 443: Working With I/Q Data
The I/Q data is written to a single memory, the data acquisition is hardware-triggered. Figure 12-1: Block diagram illustrating the R&S ESR signal processing Maximum number of samples The maximum number of samples for RF input is 200 MS. -
Page 444: Sample Rate And Maximum Usable Bandwidth (Rf Input)
Usable I/Q (Analysis) bandwidth: the bandwidth range in which the signal remains undistorted in regard to amplitude characteristic and group delay; this range can be used for accurate analysis by the R&S ESR For the I/Q data acquisition, digital decimation filters are used internally. The passband of these digital filters determines the maximum usable I/Q bandwidth. - Page 445 ® I/Q Analyzer R&S Working with I/Q Data Figure 12-2: Relation between maximum usable bandwidth and sample rate (RF input) User Manual 1175.7068.02 ─ 13...
-
Page 446: Tracking Generator
The generated signal is sent to the DUT, thus allowing the analyzer to control the input frequency of the device directly. When you equip the R&S ESR with option R&S FSV-B10, you are also able to control various commercially available generators as a tracking generator. - Page 447 ® Tracking Generator R&S Softkeys of the Tracking Generator Menu └ Power Sweep Start..................450 └ Power Sweep Stop..................450 Source Config......................451 Source RF Internal (On/ Off) Switches the selected tracking generator on or off. Default setting is off. The currently selected generator is indicated on the softkey.
- Page 448 By default, the reference line corresponds to a difference of 0 dB between the currently measured trace and the reference trace. If a 10 dB attenuation is inserted into the signal path between DUT and R&S ESR input, for example after a source calibration, the measurement trace is moved down by 10 dB.
- Page 449 ® Tracking Generator R&S Softkeys of the Tracking Generator Menu Save As Trd Factor ← Source Cal Uses the normalized measurement data to generate a transducer factor with up to 625 points. The trace data is converted to a transducer with unit dB and stored in a file with the specified name and the suffix.trd under "c:\r_s\instr\trd".
- Page 450 ® Tracking Generator R&S Softkeys of the Tracking Generator Menu Remote command: on page 872 SOURce<n>:AM:STATe on page 872 SOURce<n>:DM:STATe on page 873 SOURce<n>:FM:STATe Power Sweep Opens a submenu to define power sweep settings. This softkey is only available if the (internal) Tracking Generator option (B9) is instal- led.
-
Page 451: Connecting External Tracking Generators
The external tracking generator is controlled either via a LAN connection or via the – optional – second GPIB interface of the R&S ESR (= IEC2, supplied with the option). Using GPIB, with some Rohde & Schwarz generators, additionally the TTL synchroni- zation interface included in the AUX interface of the R&S ESR can be used. -
Page 452: Overview Of Generators Supported By The R&S Esr
R&S ESR and that you enable usage of the external reference on the R&S ESR via "SETUP" >"Reference EXT". - Page 453 ® Tracking Generator R&S Connecting External Tracking Generators Generator Interface Type Generator Min Generator Max Generator Min Generator Max Freq Freq Power Power SMC100A3 9 kHz 3.2 GHz -145 SME02 5 kHz 1.5 GHz -144 SME03 5 kHz 3.0 GHz -144 SME06 5 kHz...
- Page 454 ® Tracking Generator R&S Connecting External Tracking Generators Generator Interface Type Generator Min Generator Max Generator Min Generator Max Freq Freq Power Power 10 MHz 50 GHz SMR50B11 -130 SMR60 1 GHz 60 GHz -130 10 MHz 60 GHz SMR60B11 -130 SMP02 10 MHz...
-
Page 455: Configuring Tracking Generators
® Tracking Generator R&S Configuring Tracking Generators Generator Interface Type Generator Min Generator Max Generator Min Generator Max Freq Freq Power Power HP ESG-A Ser- GPIB 250 kHz 4 GHz -136 ies 1000A, 2000A, 3000A, 4000A HP ESG-D GPIB 250 kHz 3 GHz -136 SERIES... - Page 456 ® Tracking Generator R&S Configuring Tracking Generators The configuration dialog box contains the following fields: Select Selects the internal tracking generator as the current tracking generator source. "Inter- nal" is displayed as the source on the "Source RF" softkey. All tracking generator func- tions are performed with the currently selected source.
-
Page 457: External Tracking Generator
Frequency Offset Constant frequency offset between the output signal of the tracking generator and the input frequency of the R&S ESR. Possible offsets are in a range of ±1 GHz in 0.1 Hz steps. The default setting is 0 Hz. Offsets <> 0 Hz are marked with the enhancement label "FRQ"... - Page 458 ® Tracking Generator R&S Configuring Tracking Generators The configuration dialog box contains the following fields: Select Selects the specified external tracking generator as the current tracking generator source. "External 1" or "External 2" is displayed as the source on the "Source RF" soft- key.
- Page 459 Figure 13-2: Output frequency of the generator Note: Make sure that the frequencies resulting from the start and stop frequency of the R&S ESR do not exceed the allowed generator range: ● If the start frequency lies below F MIN, the generator is only switched on when F MIN is reached.
- Page 460 Type Generator type. See also Chapter 13.2.1, "Overview of Generators Supported by the R&S ESR", on page 452. Remote command: on page 883 SYSTem:COMMunicate:RDEVice:GENerator<generator>:TYPE User Manual 1175.7068.02 ─ 13...
- Page 461 Selects internal or external reference for the generator (default: internal). Note: Using the TTL interface allows for considerably higher measurement rates than pure GPIB control, because the frequency stepping of the R&S ESR is directly coupled with the frequency stepping of the generator.
-
Page 462: Tracking Generator Functions
® Tracking Generator R&S Tracking Generator Functions Frequency Min. For reference only: Lower frequency limit for the generator. Frequency Max. For reference only: Upper frequency limit for the generator. Power Min. For reference only: Lower power limit for the generator. Power Max. -
Page 463: Calibrating For Transmission And Reflection Measurement
At a reference level of -10 dBm and at a tracking generator output level of the same value, the R&S ESR operates without overrange reserve. That means the R&S ESR is in danger of being overloaded if a signal is applied whose amplitude is higher than the reference line. -
Page 464: Transmission Measurement
It is connected to the input connector of the DUT. The input of the R&S ESR is fed from the output of the DUT. A calibration can be carried out to compensate for the effects of the test setup (e.g. - Page 465 ® Tracking Generator R&S Tracking Generator Functions Figure 13-5: Normalized display CORR ON, see on page 871 [SENSe:]CORRection[:STATe] User Manual 1175.7068.02 ─ 13...
- Page 466 ® Tracking Generator R&S Tracking Generator Functions Figure 13-6: Normalized measurement, shifted with Reference Value Position= 50% DISP:WIND:TRAC:Y:RPOS 10PCT, see DISPlay[:WINDow<n>]:TRACe<t>:Y[: on page 815 SCALe]:RPOSition User Manual 1175.7068.02 ─ 13...
- Page 467 ® Tracking Generator R&S Tracking Generator Functions Figure 13-7: Measurement with Reference Value: +10dB and Reference Value Position = 50% After the reference line has been shifted by entering +10 dB as the "Reference Value" on page 448, deviations from the nominal value can be displayed with high resolution (e.g.
-
Page 468: Modulation (Internal Tracking Generator Only)
® Tracking Generator R&S Tracking Generator Functions Figure 13-8: Measurement of a 10-dB attenuator pad with 2dB/Div DISP:WIND:TRAC:Y:RVAL +10dB, see DISPlay[:WINDow<n>]:TRACe<t>:Y[: on page 858 SCALe]:RVALue 13.4.6 Modulation (internal Tracking Generator only) The time characteristics of the tracking generator output signal can be influenced by means of external signals (input voltage range -1 V to +1 V). - Page 469 ® Tracking Generator R&S Tracking Generator Functions Table 13-2: Simultaneous modes of modulation (tracking generator) Modulation Frequency offset EXT AM EXT FM EXT I/Q ● ● ● Frequency offset ● ● EXT AM ● ● EXT FM ● EXT I/Q ●...
-
Page 470: Displayed Information And Errors
® Tracking Generator R&S Displayed Information and Errors Figure 13-9: I/Q modulation I/Q modulation is performed by means of the built-in quadrature modulator. The RF sig- nal is divided into two orthogonal I and Q components (in phase and quadrature phase). - Page 471 ® Tracking Generator R&S Displayed Information and Errors Label Description APX (approximation) Normalization on; Deviation from the reference setting occurs Aborted normalization For details on measurement accuracy levels, see Chapter 13.4.5, "Normalization", on page 464. Error and status messages Message Description "Ext.
-
Page 472: System Configuration
® System Configuration R&S Manual Operation – Local Menu 14 System Configuration 14.1 Manual Operation – Local Menu When switched on, the instrument is always in the manual measurement mode and can be operated via the front panel. As soon as the instrument receives a remote com- mand, it is switched to the remote control mode. -
Page 473: User-Defined Menu - User Key
® System Configuration R&S User-Defined Menu – USER key The instrument switches from remote to manual operation, but only if the local lock- out function has not been activated in the remote control mode. 14.2 User-Defined Menu – USER key The USER key displays a user-defined menu. -
Page 474: Instrument Setup And Interface Configuration - Setup Key
® System Configuration R&S Instrument Setup and Interface Configuration – SETUP Key For each user-definable softkey (1–8), you can define a key label and assign a settings file that is to be loaded when the softkey is selected. SCPI command: on page 956 MMEMory:USER<Softkey>... -
Page 475: Softkeys Of The Setup Menu
® System Configuration R&S Instrument Setup and Interface Configuration – SETUP Key 14.3.1 Softkeys of the Setup Menu The following table shows all softkeys available in the "Setup" menu. It is possible that your instrument configuration does not provide all softkeys. If a softkey is only available with a special option, model or (measurement) mode, this information is delivered in the corresponding softkey description. - Page 476 ® System Configuration R&S Instrument Setup and Interface Configuration – SETUP Key └ Time+Date....................488 └ Configure Monitor..................488 └ Soft Frontpanel..................... 489 Display Setup......................489 └ Tool Bar State (On/Off)................. 490 └ Status Bar..................... 490 └ Screen Title (On/Off)..................490 └...
- Page 477 If the reference signal is missing after switching to an external reference, the message "NO REF" is displayed to indicate that no synchronization is performed. The R&S ESR can use the internal reference source or an external reference source as frequency standard from which all internal oscillators are derived. A 10 MHz crystal oscillator is used as internal reference source.
- Page 478 ® System Configuration R&S Instrument Setup and Interface Configuration – SETUP Key Basically, the dialog box contains three elements. ● A list of available transducer factors or transducer sets. The list shows the name of the transducer factor or set, its unit and its state. ●...
- Page 479 7 = Button to shift all data points of the transducer factor horizontally by a certain amount 8 = Button to shift all data points of the transducer factor vertically by a certain amount 9 = Button to save and store the transducer factor on the internal hard disk of the R&S ESR (➙"Save Factor" softkey) Note that there are softkeys for several elements of the dialog box as mentioned in the legend above.
- Page 480 (using the "Ref Level Adjust (Man Auto)" soft- key), the R&S ESR restores the original dynamic range as best as possible. It does so by changing the reference level by the maximum level shift defined in the active trans- ducer factor.
- Page 481 Opens a submenu with the available functions for recording, displaying and activating the data for self-alignment. The R&S ESR determines the correction data and characteristics required for the alignment automatically. It compares the results at different settings with the known characteristics of the high-precision calibration signal source at 65.83 MHz.
- Page 482 ® System Configuration R&S Instrument Setup and Interface Configuration – SETUP Key Remote command: on page 884 *CAL? Show Align Results ← Alignment Opens a dialog box that displays the correction data of the alignment: ● Date and time of last correction data record ●...
- Page 483 ® System Configuration R&S Instrument Setup and Interface Configuration – SETUP Key IP Address ← Network Address ← General Setup Opens an edit dialog box to enter the IP address via the keypad. The TCP/IP protocol is preinstalled with the IP address 10.0.0.10. If the DHCP server is available ("DHCP On"), the dialog box entry is read-only.
- Page 484 SYSTem:IDENtify[:STRing] Compatibility Mode ← GPIB ← General Setup Sets the R&S ESR in a state compatible to previous R&S devices, enabling the usage of existing external control applications. In particular, the number of measurement points and available bandwidths are adjusted to the settings of other devices.
- Page 485 486 ● "Sweep Repeat (On/Off)" on page 486 ● "Coupling (FSx/HP)" on page 487 "Default" Standard R&S ESR operation, see "Mode Default" on page 485 "R&S FSP" Compatible to R&S FSP, see "Mode R&S FSP" on page 485 "R&S FSU"...
- Page 486 ® System Configuration R&S Instrument Setup and Interface Configuration – SETUP Key Language Comment 8564E 8565E 8566A Command sets A and B are available. Command sets A and B differ in the rules regarding the command structure. 8566B 8568A Command sets A and B are available. Command sets A and B differ in the rules regarding the command structure.
- Page 487 ® System Configuration R&S Instrument Setup and Interface Configuration – SETUP Key Coupling (FSx/HP) ← Compatibility Mode ← GPIB ← General Setup Controls the default coupling ratios in the HP emulation mode for: ● Span and resolution bandwidth (Span/RBW) and ●...
- Page 488 In the configuration dialog box, you can switch from the internal monitor (laptop icon) to the external monitor (monitor icon), or both (double monitor icon). For external, the R&S ESR display is disabled (turns dark). The screen content formerly displayed on the R&S ESR is displayed on the external screen.
- Page 489 Activates or deactivates the display of the instrument emulation. deactivated Only the measurement screen is displayed. This is the setting for working at the R&S ESR. activated In addition to the measurement screen, the whole front panel is displayed, i.e. the hardkeys and other hardware controls of the device are simulated on the screen.
- Page 490 ® System Configuration R&S Instrument Setup and Interface Configuration – SETUP Key ● "Annotation (On/Off)" on page 491 ● "Theme Selection" on page 491 ● "Screen Colors" on page 491 ● "Print Colors" on page 492 ● "Display Pwr Save (On/Off)" on page 493 Tool Bar State (On/Off) ←...
- Page 491 ® System Configuration R&S Instrument Setup and Interface Configuration – SETUP Key Annotation (On/Off) ← Display Setup Activates/deactivates the display of the frequency information in the diagram footer. For example, to protect confidential data it can be useful to hide the frequency informa- tion.
- Page 492 ® System Configuration R&S Instrument Setup and Interface Configuration – SETUP Key Remote command: on page 947 DISPlay:CMAP<item>:HSL on page 929 HCOPy:CMAP<item>:HSL Predefined Colors ← Screen Colors ← Display Setup In the "Color Setup" dialog box, displays the "Predefined Colors" (alternatively to the "Predefined Colors"...
- Page 493 ® System Configuration R&S Instrument Setup and Interface Configuration – SETUP Key Screen colors (Print) Selects the current screen colors for the printout. The background is always printed in white and the grid in black. Screen colors (Hardcopy) Selects the current screen colors without any changes for a hard- copy.
- Page 494 Installed hardware and firmware options "Open Source Acknowledgment: Displays a PDF file containing information on open source code Open" used by the R&S ESR firmware. For details on options, refer to Chapter 5.15, "Checking the Supplied Options", on page 46.
- Page 495 ® System Configuration R&S Instrument Setup and Interface Configuration – SETUP Key Remote command: on page 895 SYSTem:ERRor:CLEar:ALL Parameter Coupling Opens a dialog box to couple or decouple various parameters. If the coupling of a parameter is on, its value is transferred when you switch from receiver into another operating mode and vice versa.
- Page 496 Install Option by XML ← Option Licenses Opens an edit dialog to install an additional option to the R&S ESR using an XML file. Enter or browse for the name of an XML file on the instrument that contains the option key and press "Select".
- Page 497 497 ● "Calibration Frequency RF" on page 497 RF ← Input Source ← Service Switches the input of the R&S ESR to the RF input connector (normal position). This is the default setting. Remote command: on page 906 DIAGnostic<n>:SERVice:INPut[:SELect] Calibration Frequency RF ←...
- Page 498 ® System Configuration R&S Instrument Setup and Interface Configuration – SETUP Key Password ← Service Opens an edit dialog box to enter the password. This ensures that the service func- tions are only used by authorized personnel. Remote command: on page 909 SYSTem:PASSword[:CENable] Service Function ←...
-
Page 499: Data Management And Documentation
Configuration files cannot be transferred from an R&S ESR with a larger frequency range to one with a smaller frequency range ● Configuration files created on a R&S ESR with certain options in use will not work on an R&S ESR without these options ●... -
Page 500: Softkeys Of The Save/Rcl Menu
® Data Management and Documentation R&S Saving and Recalling Settings Files – SAVE/RCL Key To open the Save/Recall menu ► Press the [SAVE/RCL] key. The "Save/Recall" menu is displayed. Menu and softkey description ● Chapter 15.1.1, "Softkeys of the SAVE/RCL Menu", on page 500 Further information... - Page 501 ® Data Management and Documentation R&S Saving and Recalling Settings Files – SAVE/RCL Key └ Date....................505 └ Extension.................... 505 └ Size.....................505 └ File Lists (1/2)....................505 └ Current File List (1/2)..................505 └ Network Drive....................506 └ Map Network Drive................
- Page 502 ® Data Management and Documentation R&S Saving and Recalling Settings Files – SAVE/RCL Key In the "Recall" dialog box, the items saved in the selected file are displayed. Remote command: on page 954 MMEMory:SELect[:ITEM]:HWSettings on page 955 MMEMory:SELect[:ITEM]:LINes:ALL on page 955 MMEMory:SELect[:ITEM]:TRACe[:ACTive] on page 956 MMEMory:SELect[:ITEM]:TRANsducer:ALL...
- Page 503 ("ASCII Trace Export All Traces"). When you use single trace export, the R&S ESR exports the currently selected trace (indicated by the softkey label). Note that the exported ASCII file has a slightly different structure compared to a single trace export.
- Page 504 ® Data Management and Documentation R&S Saving and Recalling Settings Files – SAVE/RCL Key Decim Sep ← Export Selects the decimal separator with floating-point numerals for the ASCII Trace export to support evaluation programs (e.g. MS-Excel) in different languages. The values '.' (decimal point) and ',' (comma) can be set.
- Page 505 ® Data Management and Documentation R&S Saving and Recalling Settings Files – SAVE/RCL Key Remote command: on page 913 MMEMory:MDIRectory Copy ← File Manager Copies the selected item to the clipboard. The item can be copied later using the Paste softkey.
-
Page 506: File Selection Dialog Boxes
The "Save" and "Recall" dialog boxes are used to save and recall settings and data files. The "File Manager" allows you to copy, delete or rename data files on the R&S ESR. These and other file selection dialog boxes are very similar. User Manual 1175.7068.02 ─ 13... - Page 507 ® Data Management and Documentation R&S Saving and Recalling Settings Files – SAVE/RCL Key Drive The data is stored on the internal flash disk or, if selected, on a memory stick or net- work drive. The mass media are assigned to the volume names as follows: Drive Designation Comment...
-
Page 508: Importing And Exporting I/Q Data
In addition to instrument settings and displayed traces, also captured I/Q data can be exported to a file on the R&S ESR. The stored data can then be imported again at a later time, also by different applications, for further processing. - Page 509 ® Data Management and Documentation R&S Saving and Recalling Settings Files – SAVE/RCL Key Contained files An iq-tar file must contain the following files: ● I/Q parameter XML file, e.g. xyz.xml Contains meta information about the I/Q data (e.g. sample rate). The filename can be defined freely, but there must be only one single I/Q parameter XML file inside an iq-tar file.
- Page 510 ® Data Management and Documentation R&S Saving and Recalling Settings Files – SAVE/RCL Key <PreviewData>...</PreviewData> </RS_IQ_TAR_FileFormat> Element Description RS_IQ_TAR_FileFormat The root element of the XML file. It must contain the attribute fileFormatVersion that contains the number of the file format definition. Currently, fileFormatVersion "2"...
- Page 511 Optional: contains further XML elements that provide a preview of the I/Q data. The preview data is determined by the routine that saves an iq-tar file (e.g. R&S ESR). For the definition of this element refer to the RsIqTar.xsd schema. Note that the preview can be only displayed by current web browsers that have JavaScript enabled and if the XSLT stylesheet open_IqTar_xml_file_in_web_browser.xslt is available.
- Page 512 ® Data Management and Documentation R&S Saving and Recalling Settings Files – SAVE/RCL Key <float>-41</float> <float>0</float> </ArrayOfFloat> </Max> </PowerVsTime> <Spectrum> <Min> <ArrayOfFloat length="256"> <float>-107</float> <float>-96</float> <float>-94</float> </ArrayOfFloat> </Min> <Max> <ArrayOfFloat length="256"> <float>-25</float> <float>1</float> <float>1</float> </ArrayOfFloat> </Max> </Spectrum> </Channel> </ArrayOfChannel> </PreviewData> I/Q Data Binary File The I/Q data is saved in binary format according to the format and data type specified in the XML file (see Format element and DataType element).
-
Page 513: Measurement Documentation - Print Key
® Data Management and Documentation R&S Measurement Documentation – PRINT Key I[0][3], Q[0][3], // Channel 0, Complex sample 3 I[1][3], Q[1][3], // Channel 1, Complex sample 3 I[2][3], Q[2][3], // Channel 2, Complex sample 3 15.2 Measurement Documentation – PRINT Key The PRINT key is used to select and configure the printer and to customize the screen printout. - Page 514 ® Data Management and Documentation R&S Measurement Documentation – PRINT Key ● To use a preconfigured network printer, select the "Printer" option. Note: The "Name", "Print to File" and "Orientation" fields are only available if the "Printer" option is selected. You can perform the following steps only with the "Printer"...
- Page 515 ® Data Management and Documentation R&S Measurement Documentation – PRINT Key with a special option, model or (measurement) mode, this information is delivered in the corresponding softkey description. Print Screen........................ 515 Device Setup.......................515 Device (1/2).........................516 Colors..........................516 └ Select Print Color Set..................516 └...
- Page 516 ® Data Management and Documentation R&S Measurement Documentation – PRINT Key on page 934 SYSTem:COMMunicate:PRINter:ENUMerate:FIRSt? on page 934 SYSTem:COMMunicate:PRINter:ENUMerate[:NEXT]? Device (1/2) Selects the tab of the device in the "Device Setup" dialog box. The analyzer is able to manage two print settings independently of each other. For each device the print set- ting is displayed on the corresponding tab of the "Device Setup"...
-
Page 517: Working With Test Reports
517. 15.3 Working with Test Reports The R&S ESR features a test report generator. A test report is a document that sum- marizes the results and configuration of measurements. A test report is made up out of one or more datasets. Each dataset contains the results and configuration of one measurement. - Page 518 ® Data Management and Documentation R&S Working with Test Reports You can select to include the following types of information. (Note that the Spectrum application does not support all elements.) ● Header Adds a page header to the dataset. For more information see "Designing the Header of the Test Report"...
- Page 519 ® Data Management and Documentation R&S Working with Test Reports Adds a screenshot of the spectrogram trace to the dataset. ● IF Analysis Spectrogram Adds a screenshot of the IF analysis spectrogram trace to the dataset. ● Markers Adds the marker information to the dataset. ●...
- Page 520 ® Data Management and Documentation R&S Working with Test Reports Reports in rtf format support pictures in bmp or jpg format. Reports in pdf format sup- port pictures in bmp, jpg and png format. Similar to the alphanumeric lines in the header, you can select the visibility for the logo as well.
-
Page 521: Creating A Test Report
15.3.2 Creating a Test Report ► In the "Test Report" softkey menu, press the "Save" button. The R&S ESR opens the "Test Report Content Selection" dialog box that contains all necessary functions to create a test report. Test report limitations The size of the test report is limited to about 50.000 measurement points. - Page 522 The "Remove Selection" removes all currently selected datasets. Note that a test report has to contain at least one dataset. When you add a dataset ("New" or "Append"), the R&S ESR opens a dialog box to define the values of the header variables.
- Page 523 To make selecting datasets easier, the R&S ESR provides the "Select All" (selects all datasets), "Deselect All" (selects no dataset) and "Invert Selection" (selects all cur- rently deselected datasets and vice versa) buttons.
-
Page 524: Remote Control
® Remote Control R&S Remote Control - Basics 16 Remote Control ● Remote Control - Basics..................524 ● Controlling the R&S ESR Remotely..............565 ● Selecting the Operating Mode................603 ● Remote Commands in Receiver Mode..............605 ● Remote Commands in Spectrum Analyzer Mode.......... - Page 525 ® Remote Control R&S Remote Control - Basics Table 16-1: Remote control interfaces and protocols Interface Remarks Protocols, VISA address string Local Area Protocols: A LAN connector is located on the rear panel of the instrument. ● HiSLIP High-Speed Network The interface is based on TCP/IP and supports various proto- LAN Instrument (LAN)
-
Page 526: Visa Libraries
® Remote Control R&S Remote Control - Basics tions. Tables provide a fast overview of the bit assignment in the status registers. The tables are supplemented by a comprehensive description of the status registers. 16.1.1.1 VISA Libraries VISA is a standardized software interface library providing input and output functions to communicate with instruments. -
Page 527: Lan Interface
® Remote Control R&S Remote Control - Basics – Common commands: their function and syntax are precisely defined in stan- dard IEEE 488.2. They are employed identically on all instruments (if imple- mented). They refer to functions such as management of the standardized sta- tus registers, reset and self-test. - Page 528 ® Remote Control R&S Remote Control - Basics ● TCPIP designates the network protocol used ● host address is the IP address or host name of the device ● LAN device name defines the protocol and the instance number of a sub-instru- ment;...
- Page 529 ® Remote Control R&S Remote Control - Basics ● High performance as with raw socket network connections ● Compatible IEEE 488.2 support for Message Exchange Protocol, Device Clear, Serial Poll, Remote/Local, Trigger, and Service Request ● Uses a single IANA registered port (4880), which simplifies the configuration of fire- walls ●...
-
Page 530: Gpib Interface (Iec 625/Ieee 418 Bus Interface)
® Remote Control R&S Remote Control - Basics RSIB interface functions The RSIB library functions are adapted to the interface functions of National Instru- ments for GPIB programming. The functions supported by the libraries are listed in the following table. Function Description RSDLLibfind() - Page 531 ® Remote Control R&S Remote Control - Basics ● Up to 15 instruments can be connected ● The total cable length is restricted to a maximum of 15 m or 2 m times the number of devices, whichever is less; the cable lenth between two instruments should not exceed 2 m.
- Page 532 ® Remote Control R&S Remote Control - Basics Figure 16-1: Communication lines used by the GPIB interface User Manual 1175.7068.02 ─ 13...
- Page 533 For remote control, addresses 0 through 30 are allowed. The GPIB address is maintained after a reset of the instrument settings. Setting the GPIB address 1. On the R&S ESR, press the [SETUP] key. 2. Press the "General Setup" softkey. 3. Press the "GPIB" softkey.
-
Page 534: Starting A Remote Control Session
Switching to manual mode is only possible via remote control then. This function is only available for the GPIB interface. 5. To enable the keys of the R&S ESR again, switch the instrument to local mode (GTL - Go to Local), i.e. deactivate the REN line of the remote control interface. -
Page 535: Returning To Manual Operation
*RST RESET Resets the instrument. *ESE EVENT STATUS ENABLE Sets the bits of the event status enable registers. *ESR? EVENT STATUS QUERY Queries the contents of the event status register. *IDN? IDENTIFICATION QUERY Queries the instrument identification string. User Manual 1175.7068.02 ─ 13... -
Page 536: Syntax For Instrument-Specific Commands
® Remote Control R&S Remote Control - Basics 16.1.4.2 Syntax for instrument-specific commands Not all commands used in the following examples are necessarily implemented in the instrument. For demonstration purposes only, assume the existence of the following commands for this section: ●... -
Page 537: Scpi Parameters
® Remote Control R&S Remote Control - Basics Example: Definition: HCOPy:PAGE:DIMensions:QUADrant[<N>] Command: HCOP:PAGE:DIM:QUAD2 This command refers to the quadrant 2. Different numbering in remote control For remote control, the suffix may differ from the number of the corresponding selec- tion used in manual operation. SCPI prescribes that suffix counting starts with 1. Suffix 1 is the default state and used when no specific suffix is specified. - Page 538 ® Remote Control R&S Remote Control - Basics ● Numeric values..................... 538 ● Special numeric values..................538 ● Boolean parameters....................539 ● Text parameters....................539 ● Character strings....................539 ● Block data......................540 Numeric values Numeric values can be entered in any form, i.e. with sign, decimal point and exponent. Values exceeding the resolution of the instrument are rounded up or down.
- Page 539 ® Remote Control R&S Remote Control - Basics ● INF and NINF: INFinity and Negative INFinity (NINF) represent the numeric values 9.9E37 or -9.9E37, respectively. INF and NINF are only sent as instrument respon- ses. ● NAN: Not A Number (NAN) represents the value 9.91E37. NAN is only sent as an instrument response.
-
Page 540: Overview Of Syntax Elements
® Remote Control R&S Remote Control - Basics Example: HCOP:ITEM:LABel "Test1" HCOP:ITEM:LABel 'Test1' Block data Block data is a format which is suitable for the transmission of large amounts of data. For example, a command using a block data parameter has the following structure: FORMat:READings:DATA #45168xxxxxxxx The ASCII character # introduces the data block. -
Page 541: Structure Of A Command Line
® Remote Control R&S Remote Control - Basics Table 16-4: Special characters Parameters A pipe in parameter definitions indicates alternative possibilities in the sense of "or". The effect of the command differs, depending on which parameter is used. Example: Definition:HCOPy:PAGE:ORIentation LANDscape | PORTrait Command HCOP:PAGE:ORI LAND specifies landscape orientation Command HCOP:PAGE:ORI PORT specifies portrait orientation Mnemonics... -
Page 542: Responses To Queries
® Remote Control R&S Remote Control - Basics Example: HCOP:ITEM ALL;:HCOP:IMM This command line contains two commands. Both commands are part of the HCOP command system, i.e. they have one level in common. If the successive commands belong to the same system, having one or several levels in common, the command line can be abbreviated. -
Page 543: Command Sequence And Synchronization
® Remote Control R&S Remote Control - Basics 16.1.5 Command Sequence and Synchronization IEEE 488.2 defines a distinction between overlapped and sequential commands: ● A sequential command is one which finishes executing before the next command starts executing. Commands that are processed quickly are usually implemented as sequential commands. -
Page 544: Preventing Overlapping Execution
Assuming that INITiate[:IMMediate] takes longer to execute than *OPC, sending the following command sequence results in initiating a sweep and, after some time, setting the OPC bit in the ESR: INIT; *OPC. Sending the following commands still initiates a sweep: INIT;... - Page 545 *OPC with a service request 1. Execute *ESE 1 Sets the OPC mask bit (bit No. 0) of the Standard Event Status Register (ESR) to 1 2. Execute *SRE 32 Sets the Event Status Bit (ESB - bit No. 5) of the Service Request Enable Register (SRE) to 1 to enable ESB service request.
-
Page 546: Status Reporting System
● ESR, SCPI registers The STB receives its information from the following registers: – The Event Status Register (ESR) with the associated mask register standard Event Status Enable (ESE) – The STATus:OPERation and STATus:QUEStionable registers which are defined by SCPI and contain detailed information on the instrument ●... - Page 547 ® Remote Control R&S Remote Control - Basics Figure 16-2: The status-register model Description of the five status register parts The five parts of a SCPI status register have different properties and functions: ● CONDition The CONDition part is written directly by the hardware or it mirrors the sum bit of the next lower register.
-
Page 548: Contents Of The Status Register
® Remote Control R&S Remote Control - Basics read by the user. Reading the register clears it. This part is often equated with the entire register. ● ENABle The ENABle part determines whether the associated EVENt bit contributes to the sum bit (see below). - Page 549 ® Remote Control R&S Remote Control - Basics Figure 16-3: Overview of status registers in receiver mode Status byte (STB) and service request enable register (SRE) The STatus Byte (STB) is already defined in IEEE 488.2. It provides a rough over- view of the instrument status by collecting the pieces of information of the lower regis- ters.
- Page 550 ® Remote Control R&S Remote Control - Basics The STB can thus be compared with the CONDition part of an SCPI register and assumes the highest level within the SCPI hierarchy. The STB is read using the command or a serial poll. *STB? The STatus Byte (STB) is linked to the Service Request Enable (SRE) register.
- Page 551 This bit is set if a remote command is undefined or has a incorrect syntax. The R&S ESR adds a number to the error queue. The number is in the range between -100 and -200 and indicates the error type in greater detail.
- Page 552 This bit is always 0. STATus:QUEStionable Register The STATus:QUEStionable register contains information about states that may occur if the R&S ESR is operated without meeting the specifications. You can read out the state of the register with STATus:QUEStionable:CONDition? and STATus:QUEStionable[:EVENt]?.
- Page 553 ® Remote Control R&S Remote Control - Basics Bit No. Meaning LMARgin (device-specific) This bit is set if a margin is violated (see "STATus:QUEStionable:LMARgin Register" on page 554) Not used ACPLimit (device-specific) This bit is set if a limit for the adjacent channel power measurement is violated (see "STA- Tus:QUEStionable:ACPLimit Register"...
- Page 554 ® Remote Control R&S Remote Control - Basics Table 16-11: Meaning of the bits used in the STATus:QUEStionable:LIMit register Bit No. Meaning LIMit 1 FAIL This bit is set if limit line 1 is violated. LIMit 2 FAIL This bit is set if limit line 2 is violated. LIMit 3 FAIL This bit is set if limit line 3 is violated.
- Page 555 Not used This bit is always 0. STATus:QUEStionable:POWer Register The STATus:QUEStionable:POWer register contains information about possible over- load situations that may occur during operation of the R&S ESR. You can read out the registers with STATus:QUEStionable:POWer:CONDition? STATus:QUEStionable:POWer[:EVENt]?. Table 16-13: Meaning of the bits used in the STATus:QUEStionable:POWer register Bit No.
- Page 556 ® Remote Control R&S Remote Control - Basics Table 16-14: Meaning of the bits used in the STATus:QUEStionable:TRANsducer register Bit No. Meaning Range 1 This bit is set if subrange 1 has been reached. Range 2 This bit is set if subrange 2 has been reached. Range 3 This bit is set if subrange 3 has been reached.
- Page 557 Figure 16-4: Overview of status registers in spectrum mode STATus:OPERation Register The STATus:OPERation register contains information on current activities of the R&S ESR. It also contains information on activities that have been executed since the last read out. You can read out the register with...
- Page 558 ® Remote Control R&S Remote Control - Basics Table 16-15: Meaning of the bits used in the STATus:OPERation register Bit No. Meaning CALibrating This bit is set as long as the instrument is performing a calibration. Not used SWEeping Sweep is being performed; identical to bit 4 MEASuring Measurement is being performed;...
- Page 559 Remote Control - Basics Bit No. Meaning CALibration This bit is set if the R&S ESR is unaligned ("UNCAL" display) LIMit (device-specific) This bit is set if a limit value is violated. STATus:QUEStionable:LIMit Register provides more information on the error type.
-
Page 560: Application Of The Status Reporting System
® Remote Control R&S Remote Control - Basics Bit No. Meaning 7 to 14 Unused This bit is always 0. 16.1.6.4 Application of the Status Reporting System The purpose of the status reporting system is to monitor the status of one or several devices in a measuring system. - Page 561 SRQ. Decimal representation of a bit pattern The STB and ESR registers contain 8 bits, the SCPI registers 16 bits. The contents of a status register are specified and transferred as a single decimal number. To make this possible, each bit is assigned a weighted value.
-
Page 562: Reset Values Of The Status Reporting System
Tem:PRE Power-On-Status- (Device Clear Clear, Selected Device Effect Clear) Clear STB, ESR Clear SRE, ESE Clear PPE Clear EVENt parts of the regis- ters Clear ENABle parts of all OPERation and QUEStionable registers; Fill ENABle parts of all other registers with "1". -
Page 563: General Programming Recommendations
16.1.8 The IECWIN tool The R&S ESR is delivered with IECWIN installed, an auxiliary tool provided free of charge by R&S. IECWIN is a program to send SCPI commands to a measuring instru- ment either interactively or from a command script. - Page 564 IECWIN tool is installed on to the R&S ESR you want to control. If you are using the tool directly on the R&S ESR, you can use an NT Pipe (COM Parser) connection, which requires no further configuration. For help on setting up other connection types, check the tool's online help (by clicking the "Help"...
-
Page 565: Controlling The R&S Esr Remotely
The R&S ESR is connected via a LAN, in which case the Windows operating system also supports a connection via a modem. This section describes the configuration of the R&S ESR and the Remote Desktop Client of the controller. Details on how to set up a modem connection are described in the Windows documentation. -
Page 566: Configuring The R&S Esr For Remote Operation
When a DHCP server is used, a new IP address is assigned each time the instrument is restarted. This address must first be determined on the instrument itself. Thus, using a DHCP server is not suitable for remote operation of the R&S ESR via Remote Desk- top. -
Page 567: Configuring The Controller
Chapter 16.2.6.2, "Creating Users", on page 581. c) Select "OK" to confirm the settings. 6. The R&S ESR is now ready for connection setup with the Remote Desktop pro- gram of the controller. 16.2.1.2 Configuring the Controller Remote Desktop Client The Windows Remote Desktop Client is part of the operating system and can be accessed via "Start >... - Page 568 7. Open the "Local Resources" tab for enabling printers, local drives and serial inter- faces. 8. If you will need to access drives of the controller from the R&S ESR (e.g. in order to store settings or to copy files from the controller to the R&S ESR), select "More", then enable the "Drives"...
-
Page 569: Starting And Terminating Remote Operation
10. Open the "Display" tab. The options for configuring the R&S ESR screen display are displayed. 11. Under "Remote desktop size", you can set the size of the R&S ESR window on the desktop of the controller. 12. Under "Colors", do not change the settings. - Page 570 7. After a few moments, the R&S ESR screen is displayed. If a dark screen appears or a dark square appears in the upper left-hand corner of the screen, you must restart the R&S ESR in order to see the modified screen res- olution.
-
Page 571: Deactivating The R&S Esr Via Remote Operation
Restoring the connection to the R&S ESR Follow the instructions above for setting up a connection to the R&S ESR. If the con- nection is terminated and then restored, the R&S ESR remains in the same state. -
Page 572: Configuring The Gpib Interface
A GPIB interface is integrated on the rear panel of the instrument. You can set the GPIB address and the ID response string. The GPIB language is set as SCPI by default and cannot be changed for the R&S ESR. Displaying the GPIB submenu 1. -
Page 573: Setting Up A Network (Lan) Connection
A LAN connection is the prerequisite for all network operations. The LAN connection settings can be configured directly in the Windows operating system. The R&S ESR is equipped with a network interface and can be connected to an Ether- net LAN (local area network). Provided the network administrator has assigned you the... -
Page 574: Assigning The Ip Address
® Remote Control R&S Controlling the R&S ESR Remotely Risk of network failure Consult your network administrator before performing the following tasks: ● Connecting the instrument to the network ● Configuring the network ● Changing IP addresses ● Exchanging hardware Errors can affect the entire network. - Page 575 ® Remote Control R&S Controlling the R&S ESR Remotely 3. Press the "Network Address" softkey. The submenu is displayed. 4. Toggle the "DHCP On/Off" softkey to the required mode. If DHCP is "Off", you must enter the IP address manually, as described in the fol- lowing steps.
- Page 576 8. Confirm the displayed message ("Yes" button) to restart the instrument. Using a DNS server to determine the IP address If a DNS server is configured on the R&S ESR, the server can determine the current IP address for the connection using the permanent computer name.
-
Page 577: Using Computer Names
® Remote Control R&S Controlling the R&S ESR Remotely The items used by the LAN connection are displayed. 5. Tap the entry named "Internet Protocol Version 4 (TCP/IPv4)" to highlight it. 6. Select the "Properties" button. 7. On the "General" tab, select "Use the following DNS server addresses" and enter your own DNS addresses. -
Page 578: Changing The Windows Firewall Settings
® Remote Control R&S Controlling the R&S ESR Remotely The default instrument name is a non-case-sensitive string with the following syntax: <Type><variant>-<serial_number> The serial number can be found on the rear panel of the instrument. It is the third part... -
Page 579: Lan Configuration
® Remote Control R&S Controlling the R&S ESR Remotely The instrument home page displays device information, including the VISA resource string, in read-only format. The most important control elements in the navigation pane of the browser interface are the following: ●... -
Page 580: Configuring The Network
® Remote Control R&S Controlling the R&S ESR Remotely Advanced LAN configuration The "LAN Configuration > Advanced LAN Configuration" parameters are used as fol- lows: ● "mDNS and DNS-SD" are two additional protocols: Multicast DNS and DNS Ser- vice Discovery. They are used for device communication in zero configuration net- works working without DNS and DHCP ●... -
Page 581: Operating The Instrument Without A Network
® Remote Control R&S Controlling the R&S ESR Remotely 16.2.6.1 Operating the Instrument Without a Network To operate the instrument without a network connection either temporarily or perma- nently, no special measures are necessary. Windows automatically detects the inter- ruption of the network connection and does not set up the connection when the instru- ment is switched on. -
Page 582: Mapping Network Drives
Windows and on the network. 16.2.6.4 Mapping Network Drives 1. Press the [SAVE/ RCL] key on the front panel of the R&S ESR. 2. Press the "File Manager" softkey. 3. Press the "More" softkey. -
Page 583: Sharing Directories (Only With Microsoft Networks)
The drive is displayed in the Explorer. Note: Only networks that you authorized to access are connected. Disconnecting network drives 1. Press the [SAVE/ RCL] key on the front panel of the R&S ESR. 2. Press the "File Manager" softkey. 3. Press the "More" softkey. -
Page 584: Brief Introduction To Remote Control
® Remote Control R&S Controlling the R&S ESR Remotely The drive is shared and can be accessed by the selected users. 16.2.7 Brief Introduction to Remote Control The following programming examples are structured hierarchically, i.e. the later exam- ples are based on the preceding ones. This allows you to easily assemble a well-func- tioning program by using the modules of the program examples. - Page 585 ® Remote Control R&S Controlling the R&S ESR Remotely The modules visa32.bas and vpptype.bas can be found under <VXIpnpPath>\WinNT\include (typically C:\VXIpnp\WinNt\include). As an alternative, a reference to the VISA32.DLL can be added to the project. ● Creating a response buffer...
- Page 586 ® Remote Control R&S Controlling the R&S ESR Remotely CALL CheckError(vi, status) End Sub Public Sub InstrRead(ByVal vi As Long, Response As String, _ ByVal count As Long, retCount As Long) Dim status As Long 'Initialize response string Response = Space(count) '...and read...
- Page 587 ® Remote Control R&S Controlling the R&S ESR Remotely Initializing the Remote Control Session REM ------------ Initializing the remote control session ------------------- Public SUB Initialize() Dim status As Long 'CALL viOpenDefaultRM to get the resource manager handle 'Store this handle in defaultRM.
- Page 588 ® Remote Control R&S Controlling the R&S ESR Remotely REM************************************************************************* REM ------------ Switching off the screen display -------------------------- Public SUB DisplayOff() CALL InstrWrite(analyzer, "SYST:DISP:UPD OFF") 'Switch off screen display END SUB REM************************************************************************* Configuring the Power Save Function for the Display During remote control operation, it is often unnecessary to display the measurement results on screen.
- Page 589 ® Remote Control R&S Controlling the R&S ESR Remotely Reading Out Instrument Settings The settings made above can now be read out. To do so, the abbreviated commands are used. REM --------- Reading out instrument settings ------------------------------ PUBLIC SUB ReadSettings()
- Page 590 ® Remote Control R&S Controlling the R&S ESR Remotely REM --------- Commands for command synchronization ------------------------ PUBLIC SUB SweepSync() Dim retCount as Long Dim SRQWaitTimeout As Long Dim eventType As Long Dim eventVi As Long REM The command INITiate[:IMMediate] starts a single sweep if the REM command INIT:CONT OFF has already been sent.
-
Page 591: Detailed Programming Examples
In the following sections, typical programming examples for setting measurement parameters and functions, general settings, printout and data management are provi- ded. Default Setting of the R&S ESR The following settings provide typical examples of how to change the default setting of the R&S ESR. - Page 592 ® Remote Control R&S Controlling the R&S ESR Remotely End Sub REM ************************************************************************ Default Settings for Measurements REM ************************************************************************ Public Sub SetupInstrument() '--------- Default setting f the R&S FSV --------------------------------- CALL SetupStatusReg 'Configure status registers CALL InstrWrite(analyzer,"*RST") 'Reset instrument CALL InstrWrite(analyzer,"SYST:DISP:UPD ON")
- Page 593 ® Remote Control R&S Controlling the R&S ESR Remotely CALL InstrWrite(analyzer,"DISP:TRAC6 OFF") 'Trace6 blank CALL InstrWrite(analyzer,"CALC:MATH:STAT OFF") 'Trace difference off CALL InstrWrite(analyzer,"DET1 RMS") 'Detector Trace1 CALL InstrWrite(analyzer,"DET2:AUTO ON") 'Detector Trace2 CALL InstrWrite(analyzer,"DET3:AUTO ON") 'Detector Trace3 CALL InstrWrite(analyzer,"DET4:AUTO ON") 'Detector Trace4 CALL InstrWrite(analyzer,"DET5:AUTO ON")
- Page 594 ® Remote Control R&S Controlling the R&S ESR Remotely 'Switch to single sweep CALL InstrWrite(analyzer,"CALC:MARK:PEXC 6DB") 'Define peak excursion CALL InstrWrite(analyzer,"CALC:MARK:STAT ON") 'Enable marker 1 CALL InstrWrite(analyzer,"CALC:MARK:TRAC 1") 'Set marker 1 to trace 1 CALL InstrWrite(analyzer,"INIT;*WAI") 'Perform sweep with sync CALL InstrWrite(analyzer,"CALC:MARK:MAX;X?;Y?")
- Page 595 R&S ESR. Nevertheless, to measure the harmonic suppression, the level setting must be changed to higher sensitivity when measuring the harmonics. In this case, it may be necessary to suppress the carrier by using a notch filter in order to prevent the RF input of the R&S ESR from being overloaded.
- Page 596 First, a high reference level is used on the carrier frequency, and then a low reference level is used on the frequency of the third harmonic. The default setting of the R&S ESR for measurements ("SetupInstrument") is also used as a starting point here, after which adaptations for the measurement are carried out.
- Page 597 Remote Control R&S Controlling the R&S ESR Remotely When noise is measured, the measured absolute level is related to a bandwidth of 1 The following example is also based on a signal at 100 MHz with a level of -30 dBm.
- Page 598 The function declaration must be added to a module (.bas) as follows: Array dimensions The arrays for the measured data are dimensioned so they provide sufficient space for trace data of the R&S ESR (691 measurement points). REM ************************************************************************ Public Sub ReadTrace() '--------- Creating variables ----------------------------------------------...
- Page 599 ® Remote Control R&S Controlling the R&S ESR Remotely CALL InstrWrite(analyzer,"INIT:CONT OFF") 'Switch to single sweep CALL InstrWrite(analyzer,"INIT;*WAI") 'Perform sweep with sync '--------- Defining the frequency range for output ------------------------- CALL InstrWrite(analyzer,"FREQ:STARt?") 'Read start frequency CALL InstrRead(analyzer,startFreq$, 100, retCount) startFreq = Val(startFreq$) CALL InstrWrite(analyzer,"FREQ:SPAN?")
- Page 600 ® Remote Control R&S Controlling the R&S ESR Remotely Storing and Loading Instrument Settings Settings and measured data can be stored and loaded. You can define which data set is loaded when the instrument is preset or started. Storing Instrument Settings In the following example, the settings/measured data to be stored are defined initially, in which case only the hardware settings are stored.
- Page 601 REM ************************************************************************ Setting the Data Record for Startup Recall In the following example, the first step is to change the R&S ESR to the default state. In the next step, the TEST1 data record stored under C:\R_S\Instr\user is selected for the startup recall function, i.e. the data record is then set after each *RST, presetting and each time the instrument is started.
- Page 602 ® Remote Control R&S Controlling the R&S ESR Remotely FOR i = 0 TO 49 Devices$(i) = Space$(50) 'Preallocate buffer for printer name NEXT i '--------- Default setting of the R&S FSV ------------------------------- CALL SetupStatusReg 'Configure status register CALL InstrWrite(analyzer,"*RST") 'Reset instrument CALL InstrWrite(analyzer,"INIT:CONT OFF")
-
Page 603: Selecting The Operating Mode
® Remote Control R&S Selecting the Operating Mode CALL viEnableEvent(vi, VI_EVENT_SERVICE_REQ, VI_QUEUE, 0) 'Enable the event for service request CALL InstrWrite(analyzer,"HCOP;*OPC") 'Start printout SRQWaitTimeout = 5000 'Allow 5s for completion 'Now wait for the service request statusSRQ = viWaitOnEvent(vi, VI_EVENT_SERVICE_REQ, SRQWaitTimeout, _ eventType, eventVi) CALL viClose(eventVi) 'Close the context before continuing... - Page 604 ® Remote Control R&S Selecting the Operating Mode INSTrument:CREate[:NEW] <ChannelType>, <ChannelName> This command adds an additional spectrum display. You can add up to three additional spectrum displays. Also see ● on page 604 INSTrument[:SELect] ● on page 604 INSTrument:DELete ● Remote program example: Chapter 16.17.16, "Usage of Four Spectrum Instances",...
-
Page 605: Remote Commands In Receiver Mode
® Remote Control R&S Remote Commands in Receiver Mode SANalyzer Spectrum mode Spectrum 2 | Spectrum 3 | Spectrum 4 Selects one of the additional spectrum displays. The first spec- trum display is always active. You can select it with SANalyzer. A spectrum display must exist in order to be able to select it. -
Page 606: Bargraph Control
® Remote Control R&S Remote Commands in Receiver Mode Suffix: <n> 1...3 Selects the measurement window. Parameters: <ResultDisplay> 'NONE' Removes the window selected with the suffix <n>. 'XTIM:SPECtrum' Selects the IF analysis result display. 'XTIM:BARGraph' Selects the bargraph. Note that the Bargraph always has to be in window 1. 'XFRequency[:SPECtrum]' Selects the scan result display. - Page 607 ® Remote Control R&S Remote Commands in Receiver Mode DISPlay:BARGraph:PHOLd[:STATe] <State> This command switches the indication of the maxhold value of the bar graph measure- ment on or off. Parameters: <State> *RST: Example: DISP:BARG:PHOL ON Manual operation: "Bargraph Maxhold" on page 128 DISPlay:BARGraph:PHOLd:RESet This command resets the maxhold value of the numeric indication of the bargraph measurement.
-
Page 608: Scan Control
® Remote Control R&S Remote Commands in Receiver Mode NEGative Selects the Min Peak detector. POSitive Selects the Max Peak detector. QPEak Selects the Quasipeak detector. Selects the RMS detector. *RST: AVERage Example: DET:REC POS,AVER,QPE Selects the peak, average and quasipeak detectors. Manual operation: "Bargraph Detector"... - Page 609 ® Remote Control R&S Remote Commands in Receiver Mode HOLD This command interrupts a running scan measurement. To resume the scan, use INITiate<n>[:IMMediate]. Example: HOLD Interrupts the scan. Manual operation: "Hold Scan" on page 129 "Continue at Rec Frequency" on page 129 "Hold Final Measurement"...
-
Page 610: Final Measurements And Automated Test Sequence Control
Remote Commands in Receiver Mode INITiate<n>[:IMMediate] The command initiates a new measurement. In case of a single measurement, the R&S ESR stops measuring when it has reached the end frequency. When you start a continuous measurement, it stops only if you abort it deliberately. - Page 611 ® Remote Control R&S Remote Commands in Receiver Mode Example: INIT2:FME Starts the final measurement. Usage: Event [SENSe:]DETector<t>:FMEasurement <Detector> This command selects the detector for the final measurement. Parameters: <Detector> AVERage Selects the Average detector. CAVerage Selects the CISPR Average detector. CRMS Selects the CISPR RMS detector.
-
Page 612: Trace Data And Result Query
® Remote Control R&S Remote Commands in Receiver Mode [SENSe:]FMEasurement:TIME <Time> This command defines the time each frequency in the peak list is measured during the final measurement. Parameters: <Time> *RST: Example: FME:TIME 1us Defines a measurement time of 1 µs. 16.4.1.5 Trace Data and Result Query This section contains information on the TRACe:DATA command and a detailed... - Page 613 ® Remote Control R&S Remote Commands in Receiver Mode Each result is made up out of two values: ● Absolute level ● Frequency The order of detectors is as shown in the user interface: maximum peak, minimum peak, quasipeak, average, RMS. Inactive detectors are ignored. Example: TRAC? PHOLD Querying scan characteristics...
- Page 614 ® Remote Control R&S Remote Commands in Receiver Mode Querying results for a peak search The SCPI parameters PLIST1 | ... | PLIST6 returns the results of a peak search for a particular trace or detector (1 to 6). Each result is made up out of three values: ●...
- Page 615 ® Remote Control R&S Remote Commands in Receiver Mode ber of frames depends on the size of the history depth. The power level depends on the unit you have currently set. FORMat:DEXPort:TRACes <Selection> This command selects the data to be included in a data export file. Parameters: <Selection>...
-
Page 616: Fixed Frequency Scans
® Remote Control R&S Remote Commands in Receiver Mode TRACe<n>:IF[:DATA] <ResultType> This command queries current trace data and measurement results for IF analysis. The data format depends on FORMat[:DATA]. Suffix: <n> 1..n irrelevant Parameters: <ResultType> TRACE1 | ... | TRACE3 Returns the level values displayed on the corresponding trace. - Page 617 ® Remote Control R&S Remote Commands in Receiver Mode [SENSe:]DEMod <Demod> This command turns analog demodulation at the receiver frequency on and off and selects the type of analog demodulation. Parameters: <Demod> Turns demodulation off. Turns AM demodulation on. Turns FM demodulation on. *RST: Example: DEM FM...
-
Page 618: Spectrogram Control
® Remote Control R&S Remote Commands in Receiver Mode Parameters: <State> ON | OFF *RST: Example: DEM:SQU ON Signals below the level threshold are not sent to the audio out- put. Usage: SCPI confirmed Manual operation: "Squelch" on page 134 "Squelch"... - Page 619 ® Remote Control R&S Remote Commands in Receiver Mode Usage: Event DISPlay:WINDow:SGRam:COLor:LOWer <Percentage> This command sets the lower percentage boundary of the spectrogram. Parameters: <Percentage> Statistical frequency percentage. Range: 0 to 66 *RST: Default unit: % Example: DISP:WIND:SGR:COL:LOW 10 Sets the start of the color map to 10%. Manual operation: "Color Mapping"...
- Page 620 *RST: Example: DISP:WIND:SGR:COL GRAY Changes the color scheme of the spectrogram to black and white. CALCulate<n>:SGRam:HDEPth <HistoryDepth> This command sets the number of frames to be stored in the R&S ESR's memory. Suffix: <n> 1...4 Selects the measurement window. Parameters: <HistoryDepth>...
- Page 621 ® Remote Control R&S Remote Commands in Receiver Mode CALCulate<n>:SGRam:TSTamp:DATA? <Mode> This command queries the time stamp of the frames. All available frame results are returned by on page 694. TRACe<n>:DATA Suffix: <n> 1...4 Selects the measurement window. Query parameters: <Mode>...
- Page 622 ® Remote Control R&S Remote Commands in Receiver Mode Using Markers Commands useful to work with markers in the spectrogram described elsewhere: ● on page 660 CALCulate<n>:MARKer<m>:MAXimum:LEFT ● on page 661 CALCulate<n>:MARKer<m>:MAXimum:NEXT ● on page 661 CALCulate<n>:MARKer<m>:MAXimum[:PEAK] ● on page 661 CALCulate<n>:MARKer<m>:MAXimum:RIGHt ●...
- Page 623 ® Remote Control R&S Remote Commands in Receiver Mode Example: CALC:MARK:SGR:FRAM -20 Sets the marker on the 20th frame before the present. CALC:MARK2:SGR:FRAM 2 s Sets second marker on the frame 2 seconds ago. CALCulate<n>:MARKer<m>:SGRam:SARea <SearchArea> This command defines the marker search area. The command is available for the spectrogram.
- Page 624 ® Remote Control R&S Remote Commands in Receiver Mode Usage: Event CALCulate<n>:MARKer<m>:SGRam:XY:MINimum[:PEAK] This command positions the specified marker on the current minimum level of the spectrogram. The possible position depends on the marker search area. The command is available for the spectrogram. For more information, seeCALCulate<n>:MARKer<m>:SGRam:SARea on page 623 .
- Page 625 ® Remote Control R&S Remote Commands in Receiver Mode The command is available for the spectrogram. Suffix: <n> 1...4 Selects the measurement window. <m> 1...16 Selects the marker. Example: CALC:MARK2:SGR:Y:MAX Activates and positions marker 2 on the peak level of the y-axis. CALC:MARK2:SGR:Y:MAX:BEL Positions marker 2 on the next higher level found in the diagram area below the current marker position.
- Page 626 ® Remote Control R&S Remote Commands in Receiver Mode Example: CALC:MARK2:SGR:Y:MAX Activates and positions marker 2 on the peak level of the y-axis. Usage: Event CALCulate<n>:MARKer<m>:SGRam:Y:MINimum:ABOVe This command positions the specified marker on the next minimum level of the vertical axis.
- Page 627 ® Remote Control R&S Remote Commands in Receiver Mode CALCulate<n>:MARKer<m>:SGRam:Y:MINimum:NEXT This command positions the specified marker on the next minimum level of the vertical axis. The search includes frames above and below the current marker position. It does not change the horizontal position of the marker. The command is available for the spectrogram.
- Page 628 ® Remote Control R&S Remote Commands in Receiver Mode ● on page 669 CALCulate<n>:DELTamarker<m>:MINimum[:PEAK] ● on page 669 CALCulate<n>:DELTamarker<m>:MINimum:RIGHt Command exclusive to position markers in the spectrogram: ............628 CALCulate<n>:DELTamarker<m>:SGRam:FRAMe ............628 CALCulate<n>:DELTamarker<m>:SGRam:SARea ........629 CALCulate<n>:DELTamarker<m>:SGRam:XY:MAXimum[:PEAK] ........629 CALCulate<n>:DELTamarker<m>:SGRam:XY:MINimum[:PEAK] ......... 630 CALCulate<n>:DELTamarker<m>:SGRam:Y:MAXimum:ABOVe ..........630 CALCulate<n>:DELTamarker<m>:SGRam:Y:MAXimum:BELow...
- Page 629 ® Remote Control R&S Remote Commands in Receiver Mode The command is available for the spectrogram. Suffix: <n> 1...4 Selects the measurement window. <m> 1...16 Selects the marker. Parameters: <SearchArea> VISible Performs a search in the visible frames. Note that VISible is ignored if Spectrogram is not visible for any reason (e.g.
- Page 630 ® Remote Control R&S Remote Commands in Receiver Mode For more information, see CALCulate<n>:DELTamarker<m>:SGRam:SARea on page 628. Suffix: <n> 1...4 Selects the measurement window. <m> 1...16 Selects the marker. Example: CALC:DELT3:SGR:SAR VIS CALC:DELT3:SGR:XY:MIN Activates and positions delta marker 3 on the minimum level in the visible Spectrogram.
- Page 631 ® Remote Control R&S Remote Commands in Receiver Mode Example: CALC:DELT2:SGR:Y:MAX Activates and positions delta marker 2 on the peak level of the y- axis. CALC:DELT2:SGR:Y:MAX:BEL Positions delta marker 2 on the next higher level found in the diagram area below the current marker position. Usage: Event CALCulate<n>:DELTamarker<m>:SGRam:Y:MAXimum:NEXT...
- Page 632 ® Remote Control R&S Remote Commands in Receiver Mode CALCulate<n>:DELTamarker<m>:SGRam:Y:MINimum:ABOVe This command positions the specified delta marker on the next minimum level of the vertical axis. The search includes only frames above the current marker position. It does not change the horizontal position of the delta marker. The command is available for the spectrogram.
-
Page 633: Defining The Frequency
® Remote Control R&S Remote Commands in Receiver Mode The command is available for the spectrogram. Suffix: <n> 1...4 Selects the measurement window. <m> 1...16 Selects the marker. Example: CALC:DELT2:SGR:Y:MIN Activates and positions delta marker 2 on the minimum level of the y-axis. - Page 634 ® Remote Control R&S Remote Commands in Receiver Mode DISPlay[:WINDow<n>]:TRACe<t>:X:SPACing <Scale> This command selects the scale of the frequency axis. Parameters: <Scale> LINear Linear scale of the frequency axis. LOGarithmic Logarithmic scale of the frequency axis. *RST: LOGarithmic Example: DISP:TRAC:X:SPAC LIN Selects linear scale for the frequency axis.
- Page 635 • on page 634 [SENSe:]FREQuency:CENTer TDOMain Selects time domain scans in the frequency domain. See SCAN on how to define the frequency. Time domain scans are available with options R&S ESR-B50 and R&S ESR-K53. *RST: TDOMain Example: FREQ:MODE SCAN Selects stepped scans.
-
Page 636: Configuring The Vertical Axis
® Remote Control R&S Remote Commands in Receiver Mode Manual operation: "Start / Stop Frequency" on page 150 16.4.3 Configuring the Vertical Axis ................... 636 CALCulate<n>:UNIT:POWer ............636 DISPlay[:WINDow<n>]:TRACe<t>:Y[:SCALe]:BOTTom ..............636 DISPlay[:WINDow<n>]:TRACe<t>:Y:SPACing ......................637 INPut:ATTenuation ....................637 INPut:ATTenuation:AUTO ................638 INPut:ATTenuation:PROTection[:STATe] ......................638 INPut:GAIN:AUTO ...................... - Page 637 151 INPut:ATTenuation:AUTO <State> This command turns automatic configuration of the attenuation on and off. If on, the R&S ESR selects an attenuation that results in a good signal-to-noise ratio without overloading the receiver. User Manual 1175.7068.02 ─ 13...
- Page 638 ® Remote Control R&S Remote Commands in Receiver Mode Parameters: <State> ON | OFF *RST: Example: INP:ATT:AUTO ON Turns the auto ranging function on. Manual operation: "Auto Range (On Off)" on page 152 INPut:ATTenuation:PROTection[:STATe] <State> This command turns the availability of attenuation levels of 10 dB or less on and off. Parameters: <State>...
-
Page 639: Selecting The Bandwidth
® Remote Control R&S Remote Commands in Receiver Mode 75 Ω should be selected if the 50 Ω input impedance is transformed to a higher impe- dance using a 75 Ω adapter of the RAZ type (= 25 Ω in series to the input impedance of the instrument). - Page 640 ® Remote Control R&S Remote Commands in Receiver Mode Manual operation: "Res BW Manual" on page 154 "Res BW CISPR / CISPR (6 dB)" on page 271 "Res BW Mil Std / MIL Std (6 dB)" on page 271 "Res BW" on page 286 "Res BW Manual"...
-
Page 641: Controlling Inputs And Outputs
"Res BW Mil Std / MIL Std (6 dB)" on page 271 16.4.5 Controlling Inputs and Outputs ......................641 INPut:COUPling ........................641 INPut:TYPE INPut:COUPling <CouplingType> Toggles the RF input of the R&S ESR between AC and DC coupling. Parameters: <CouplingType> AC | DC *RST: Example: INP:COUP DC Manual operation: "Input (AC/DC)"... -
Page 642: General Scan Configuration
® Remote Control R&S Remote Commands in Receiver Mode 16.4.6.1 General Scan Configuration ....................642 [SENSe:]SWEep:COUNt ..................642 [SENSe:]SWEep:COUNt:CURRent ..................642 TRACe<n>:FEED:CONTrol<t> ......................643 TRACe<n>:POINts [SENSe:]SWEep:COUNt <SweepCount> This command defines the number of scans performed during a single sweep. Parameters: <SweepCount> Range: 0 to 32767 *RST: Example: SWE:COUN 64... -
Page 643: Scan Table
® Remote Control R&S Remote Commands in Receiver Mode <t> Selects a trace. Parameters: <Occasion> ALWays Block data transmission is on. NEVer Block data transmission is off. *RST: NEVer Example: TRAC:FEED:CONT ALW Switches to single sweep mode. TRACe<n>:POINts LIMit, <Points> This command defines the maximum number of measurement pointsthat are transfer- red in one block after using TRAC? SCAN. - Page 644 ® Remote Control R&S Remote Commands in Receiver Mode Parameters: <Bandwidth> Range: 10 Hz to 10 MHz *RST: 9 kHz Example: SCAN4:BAND:RES 1MHz Defines a measurement bandwidth of 1 MHz for the 4th scan range. [SENSe:]SCAN<range>:INPut:ATTenuation <Attenuation> This command defines the attenuation level for a particular scan range. Suffix: <range>...
- Page 645 This command defines the number of scan ranges. Parameters: <Ranges> Number of ranges in the scan table. If you enter the value "0", the R&S ESR ignores the configura- tion of the scan table. instead, it performs the measurement based on the current receiver configuration. Range:...
- Page 646 Defines a stop frequency of 500 MHz for the 4th scan range. [SENSe:]SCAN<range>:TIME <Time> This command defines the measurement time for a particular scan range. Note that for time domain scans (R&S ESR-K53), the available measurement time range depends on the resolution bandwidth. Suffix: <range>...
-
Page 647: Peak Search
® Remote Control R&S Remote Commands in Receiver Mode Parameters: <Time> Range: 10 µs to 100 s *RST: 1 ms Example: SCAN4:TIME 1 ms Defines a measurement time of 1 ms for the 4th scan range. [[SENSe:]SWEep:SPACing <Spacing> This command selects the frequency step mode. Note that the command has no effect on the scale and display of the frequency axis. - Page 648 ® Remote Control R&S Remote Commands in Receiver Mode Parameters: <Excursion> The peak excursion is the distance to a trace maximum that must be attained before a new maximum is recognized, or the distance to a trace minimum that must be attained before a new minimum is recognized *RST: 6 dB...
- Page 649 "Margin" on page 163 "Margin" on page 234 "Margin" on page 263 CALCulate<n>:PEAKsearch|PSEarch:METHod <Method> This command selects the way the R&S ESR creates a peak list. Suffix: <n> irrelevant Parameters: <Method> SUBRange Divides the scan range into smaller subranges and looks for a particular number of peaks in each subrange.
-
Page 650: Peak Lists
® Remote Control R&S Remote Commands in Receiver Mode Example: CALC:PEAK:METH SUBR CALC:PEAK:SUBR 25 Selects a subrange search and defines 25 subranges. Manual operation: "No Of Peaks" on page 163 "No of Subranges / Peaks per Subrange" on page 163 CALCulate<n>:PEAKsearch|PSEarch:SUBRanges:PCOunt <Peaks>... -
Page 651: Trace Configuration
® Remote Control R&S Remote Commands in Receiver Mode Manual operation: "Symbols (On Off)" on page 165 MMEMory:STORe:FINal <FileName> This command exports the contents of the final measurement peak list to a file in ASCII format. Parameters: <FileName> String containg the file name. The extension of the file is *.dat. Example: :MMEM:STOR:FIN 'A:\TEST.DAT' Usage:... - Page 652 ® Remote Control R&S Remote Commands in Receiver Mode Manual operation: "Trace 1 to 6" on page 166 DISPlay[:WINDow<n>]:TRACe<t>:MODE <Mode> This command defines the type of display and the evaluation of the traces. WRITE cor- responds to the Clr/Write mode of manual operation. The trace is switched off (= BLANK in manual operation) with DISPlay[:WINDow<n>]:TRACe<t>[:STATe].
-
Page 653: Lisn Settings
® Remote Control R&S Remote Commands in Receiver Mode Manual operation: "Clear Write" on page 141 "Max Hold" on page 141 "Min Hold" on page 142 "Average" on page 142 "View" on page 142 "Trace 1 to 6" on page 166 "Trace 1 - 6"... - Page 654 ® Remote Control R&S Remote Commands in Receiver Mode [SENSe:]FMEasurement:LISN[:TYPE] <Type> This command turns automatic control of the network used for the final measurement on and off. It also selects the type of network in use. Parameters: <Type> ENV216 R&S ENV 216: two phases and highpass are controllable. ENV432 R&S ENV 432: four phases are controllable.
- Page 655 ® Remote Control R&S Remote Commands in Receiver Mode INPut:LISN:PHASe <Phase>, [<Phase>] This command selects the phase of the network used for the premeasurement. Parameters: <Phase> Available for networks with four phases (R&S ESH2Z5, R&S ENV4200 and R&S ENV432) Available for networks with four phases (R&S ESH2Z5, R&S ENV4200 and R&S ENV432) *RST: INP:LISN:PHAS L1,L2...
-
Page 656: Working With Markers
® Remote Control R&S Remote Commands in Receiver Mode Example: INP:LISN TWOP Turns automatic control of the network on and selects the R&S ESH3-Z5 network. Manual operation: "LISN Type" on page 167 "LISN Control" on page 272 16.4.7 Working with Markers ●... - Page 657 ® Remote Control R&S Remote Commands in Receiver Mode Example: CALC:MARK2:FUNC:CENT Sets the center frequency to the frequency of marker 2. Manual operation: "Tune to Marker" on page 173 "Center =Mkr Freq (span > 0)" on page 382 CALCulate<n>:MARKer<m>:FUNCtion:CSTep This command matches the frequency step size to the current marker frequency. The command turns delta markers into normal markers.
- Page 658 ® Remote Control R&S Remote Commands in Receiver Mode Parameters: <State> ON | OFF *RST: Example: CALC:MARK:SCO ON Couples the scan range settings to the marker frequency. Manual operation: "Settings Coupled" on page 174 CALCulate<n>:MARKer<m>:X:SLIMits:LEFT <Limit> This command sets the left limit of the marker search range. If the power measurement in zero span is active, this command limits the evaluation range to the trace.
- Page 659 ® Remote Control R&S Remote Commands in Receiver Mode Parameters: <Limit> The value range depends on the span or sweep time. The unit is Hz for frequency domain measurements and s for time domain measurements. Range: 0 to MAX *RST: left diagram border Example: CALC:MARK:X:SLIM ON...
-
Page 660: Using Markers
® Remote Control R&S Remote Commands in Receiver Mode 16.4.7.2 Using Markers ..................660 CALCulate<n>:MARKer<m>:AOFF ..............660 CALCulate<n>:MARKer<m>:MAXimum:LEFT ..............661 CALCulate<n>:MARKer<m>:MAXimum:NEXT ..............661 CALCulate<n>:MARKer<m>:MAXimum[:PEAK] ..............661 CALCulate<n>:MARKer<m>:MAXimum:RIGHt ..............662 CALCulate<n>:MARKer<m>:MINimum:LEFT ..............662 CALCulate<n>:MARKer<m>:MINimum:NEXT ..............663 CALCulate<n>:MARKer<m>:MINimum[:PEAK] ..............663 CALCulate<n>:MARKer<m>:MINimum:RIGHt ................663 CALCulate<n>:MARKer<m>[:STATe] ................664 CALCulate<n>:MARKer<m>:TRACe ..................664 CALCulate<n>:MARKer<m>:X .................. - Page 661 ® Remote Control R&S Remote Commands in Receiver Mode CALCulate<n>:MARKer<m>:MAXimum:NEXT This command positions the marker to the next smaller trace maximum. If no next smaller maximum value is found on the trace (level spacing to adjacent val- ues < peak excursion), an execution error (error code: -200) is produced. Suffix: <n>...
- Page 662 ® Remote Control R&S Remote Commands in Receiver Mode Example: CALC:MARK2:MAX:RIGH Positions marker 2 to the next lower maximum value to the right of the current value. Usage: Event Manual operation: "Next Mode" on page 175 CALCulate<n>:MARKer<m>:MINimum:LEFT This command positions a marker to the next higher trace minimum on the left of the current value (i.e.
- Page 663 ® Remote Control R&S Remote Commands in Receiver Mode CALCulate<n>:MARKer<m>:MINimum[:PEAK] This command positions the marker on the current trace minimum. The corresponding marker is activated first or switched to marker mode, if necessary. If no minimum value is found on the trace (level spacing to adjacent values < peak excursion), an execution error (error code: -200) is produced.
- Page 664 ® Remote Control R&S Remote Commands in Receiver Mode Parameters: <State> ON | OFF *RST: Example: CALC:MARK3 ON Switches on marker 3 or switches to marker mode. Manual operation: "Marker 1 / Marker 2 / Marker 3 / … Marker 16,/ Marker Norm/Delta"...
-
Page 665: Using Delta Markers
® Remote Control R&S Remote Commands in Receiver Mode Manual operation: "Marker 1 / Marker 2 / Marker 3 / … Marker 16,/ Marker Norm/Delta" on page 171 CALCulate<n>:MARKer<m>:Y <MarkerPosition> This command queries the measured value of a marker. If necessary, the command activates the marker or turns a delta marker into a normal marker. - Page 666 ® Remote Control R&S Remote Commands in Receiver Mode ............667 CALCulate<n>:DELTamarker<m>:MAXimum[:PEAK] ............667 CALCulate<n>:DELTamarker<m>:MAXimum:RIGHt ............668 CALCulate<n>:DELTamarker<m>:MINimum:LEFT ............668 CALCulate<n>:DELTamarker<m>:MINimum:NEXT ............669 CALCulate<n>:DELTamarker<m>:MINimum[:PEAK] ............669 CALCulate<n>:DELTamarker<m>:MINimum:RIGHt ................. 669 CALCulate<n>:DELTamarker<m>:MODE ................ 670 CALCulate<n>:DELTamarker<m>[:STATe] .................670 CALCulate<n>:DELTamarker<m>:TRACe ................. 670 CALCulate<n>:DELTamarker<m>:X ..............671 CALCulate<n>:DELTamarker<m>:X:RELative? ................. 671 CALCulate<n>:DELTamarker<m>:Y CALCulate<n>:DELTamarker<m>:AOFF This command turns all active delta markers off.
- Page 667 ® Remote Control R&S Remote Commands in Receiver Mode If no next higher minimum value is found on the trace (level spacing to adjacent values < peak excursion), an execution error (error code: -200) is produced. Suffix: <n> Selects the measurement window. <m>...
- Page 668 ® Remote Control R&S Remote Commands in Receiver Mode If no next higher minimum value is found on the trace (level spacing to adjacent values < peak excursion), an execution error (error code: -200) is produced. Suffix: <n> Selects the measurement window. <m>...
- Page 669 ® Remote Control R&S Remote Commands in Receiver Mode CALCulate<n>:DELTamarker<m>:MINimum[:PEAK] This command positions the delta marker to the current trace minimum. The corre- sponding delta marker is activated first, if necessary. Suffix: <n> Selects the measurement window. <m> Selects the marker. Example: CALC:DELT3:MIN Sets delta marker 3 to the minimum value of the associated...
- Page 670 ® Remote Control R&S Remote Commands in Receiver Mode CALCulate<n>:DELTamarker<m>[:STATe] <State> This command turns delta markers on and off. If the corresponding marker was a normal marker, it is turned into a delta marker. No suffix at DELTamarker turns on delta marker 1. Suffix: <n>...
- Page 671 ® Remote Control R&S Remote Commands in Receiver Mode If fixed reference is active, the position is relative to the fixed reference (CALCulate<n>:DELTamarker<m>:FUNCtion:FIXed[:STATe] is ON). A query always returns the absolute position. Suffix: <n> Selects the measurement window. <m> Selects the marker. Parameters: <Position>...
-
Page 672: Limit Lines
® Remote Control R&S Remote Commands in Receiver Mode Table 16-19: Base unit Parameter, measuring function or result display Output unit DBM | DBPW | DBUV | DBMV | DBUA dB (lin/log) WATT | VOLT | AMPere dB (lin), % (log) statistics function (APD or CCDF) on dimensionless output Suffix:... -
Page 673: Using Frequency Lines
® Remote Control R&S Remote Commands in Receiver Mode Manual operation: "Display Line 1 / Display Line 2" on page 182 CALCulate<n>:DLINe<k>:STATe <State> This command turns a display line on and off. Suffix: <n> Selects the measurement window. <k> 1 | 2 Selects the display line. -
Page 674: Using Limit Lines
® Remote Control R&S Remote Commands in Receiver Mode Parameters: <State> ON | OFF *RST: Example: CALC:FLIN2:STAT ON Manual operation: "Frequency Line 1 / Frequency Line 2 " on page 183 CALCulate:TFLine:STATe <State> This command turns a frequency line coupled to the receiver frequency on and off. Parameters: <State>... - Page 675 ® Remote Control R&S Remote Commands in Receiver Mode CALCulate<n>:LIMit<k>:COMMent <Comment> This command defines a comment for the selected limit line in all windows. Suffix: <n> irrelevant <k> Selects the limit line. Parameters: <Comment> String containing the comment. The maximum number of char- acters the string may contain is 40.
- Page 676 ® Remote Control R&S Remote Commands in Receiver Mode CALCulate<n>:LIMit<k>:NAME <Name> This command selects a limit line that already exists or defines a name for a new limit line. Suffix: <n> irrelevant <k> 1...8 (NF: 1...6) Selects the limit line. Parameters: <Name>...
- Page 677 ® Remote Control R&S Remote Commands in Receiver Mode Parameters: <Unit> DBM | DBPW | WATT | DBUV | DBMV | VOLT | DBUA | AMPere | DB | DBUV_M | DBUA_M | DEG | RAD | S | HZ | PCT | (unitless) If you select dB as the limit line unit, the command automatically turns the limit line into a relative limit line.
- Page 678 Note that the number of horizontal values has to be the same as the number of vertical values set with CALCulate<n>: LIMit<k>:LOWer[:DATA] CALCulate<n>:LIMit<k>: UPPer[:DATA]. If not, the R&S ESR either adds missing val- ues or ignores surplus values. The unit is Hz or s, depending on CALCulate<n>:LIMit<k>: CONTrol:DOMain.
- Page 679 ® Remote Control R&S Remote Commands in Receiver Mode RELative Limit line is defined by relative values related to the center fre- quency (frequency domain) or the left diagram border (time domain). *RST: ABSolute Example: CALC:LIM2:CONT:MODE REL Defines the x-axis of limit line 2 as relatively scaled. CALCulate<n>:LIMit<k>:CONTrol:OFFSet <Offset>...
- Page 680 Note that the number of horizontal values has to be the same as the number of vertical values set with CALCulate<n>: LIMit<k>:CONTrol[:DATA]. If not, the R&S ESR either adds missing values or ignores surplus values. The unit depends on CALCulate<n>:LIMit<k>:UNIT.
- Page 681 ® Remote Control R&S Remote Commands in Receiver Mode <k> 1...8 Selects the limit line. Parameters: <Margin> Numeric value that defines the margin. In spectrum mode, the unit is always dB. *RST: Example: CALC:LIM:LOW:MARG 10dB CALCulate<n>:LIMit<k>:LOWer:MODE <Mode> This command selects the vertical limit line scaling. Suffix: <n>...
- Page 682 ® Remote Control R&S Remote Commands in Receiver Mode CALCulate<n>:LIMit<k>:LOWer:SHIFt <Distance> This command moves a complete lower limit line vertically. Compared to defining an offset, this command actually changes the limit line definition points by the value you define. Suffix: <n>...
- Page 683 CALC:LIM4:LOW:STAT ON Switches on limit line 4 (lower limit). CALCulate<n>:LIMit<k>:LOWer:THReshold <Threshold> This command defines a threshold for relative limit lines. The R&S ESR uses the threshold for the limit check, if the limit line violates the thresh- old. Suffix: <n>...
- Page 684 ® Remote Control R&S Remote Commands in Receiver Mode CALCulate<n>:LIMit<k>:UPPer:MARGin <Margin> This command defines an area around a upper limit line where limit check violations are still tolerated. Suffix: <n> irrelevant <k> 1...8 Selects the limit line. Parameters: <Margin> Numeric value that defines the margin. In spectrum mode, the unit is always dB.
- Page 685 ® Remote Control R&S Remote Commands in Receiver Mode Parameters: <Offset> Numeric value that defines the offset. *RST: Example: CALC:LIM2:UPP:OFFS 3dB Shifts limit line 2 by 3 dB upwards. Manual operation: "Y Offset" on page 182 CALCulate<n>:LIMit<k>:UPPer:SHIFt <Value> This command moves a complete upper limit line vertically. Compared to defining an offset, this command actually changes the limit line definition points by the value you define.
- Page 686 CALC:LIM4:UPP:STAT ON Switches on limit line 4 (upper limit). CALCulate<n>:LIMit<k>:UPPer:THReshold <Threshold> This command defines a threshold for relative limit lines. The R&S ESR uses the threshold for the limit check, if the limit line violates the thresh- old. Suffix: <n>...
- Page 687 ® Remote Control R&S Remote Commands in Receiver Mode Usage: Event CALCulate<n>:LIMit<k>:FAIL? This command queries the result of a limit check. Note that for SEM measurements, the limit line suffix <k> is irrelevant, as only one spe- cific SEM limit line is checked for the currently relevant power class. To get a valid result, you have to perform a complete measurement with synchroniza- tion to the end of the measurement before reading out the result.
-
Page 688: Remote Commands In Spectrum Analyzer Mode
® Remote Control R&S Remote Commands in Spectrum Analyzer Mode 16.5 Remote Commands in Spectrum Analyzer Mode The following remote commands configure and perform spectrum measurements. They are available in spectrum analyzer mode only. ● Measurements and Result Displays..............688 ● Configuring Spectrum Measurements..............791 ●... - Page 689 ® Remote Control R&S Remote Commands in Spectrum Analyzer Mode Note: If CPOWer is selected, the number of adjacent channels ( [SENSe:]POWer: ACHannel:ACPairs) is set to 0. If ACPower is selected, the number of adjacent channels is set to 1, unless adjacent-channel power measurement is switched on already.
- Page 690 ® Remote Control R&S Remote Commands in Spectrum Analyzer Mode CALCulate<n>:MARKer<m>:FUNCtion:POWer:RESult? <ResultType> This command queries the result of the performed power measurement in the window specified by the suffix <n>. If necessary, the measurement is switched on prior to the query.
- Page 691 ® Remote Control R&S Remote Commands in Spectrum Analyzer Mode Measurement of carrier-to-noise ratio referenced to 1 Hz band- width. The carrier-to-noise ratio in dB/Hz is returned. CPOWer Channel power measurement In a Spectrum Emission Mask measurement, the query returns the power result for the reference range, if this power reference type is selected.
- Page 692 ® Remote Control R&S Remote Commands in Spectrum Analyzer Mode Example: For an example of channel/adjacent-channel power mea- surement see Chapter 16.17.4, "Measuring the Channel and Adjacent Channel Power", on page 981. Example of occupied bandwidth measurement POW:BAND 90PCT Defines 90 % as the percentage of the power to be contained in the bandwidth range to be measured.
- Page 693 ® Remote Control R&S Remote Commands in Spectrum Analyzer Mode <m> Selects the marker. Parameters: <Mode> WRITe | MAXHold WRITe The channel power and the adjacent channel powers are calcu- lated directly from the current trace MAXHold The power values are calculated from the current trace and compared with the previous power value using a maximum algo- rithm.
- Page 694 TRACe<n>:DATA <Trace>, <Data> | <ResultType> This command queries current trace data and measurement results. If you use it as a setting command, it transfers trace data from an external source to the R&S ESR. The data format depends on FORMat[:DATA]. Parameters: <Trace>...
-
Page 695: Measuring Channel Power
® Remote Control R&S Remote Commands in Spectrum Analyzer Mode LIST Returns the results of the peak list evaluation for Spurious Emis- sion and Spectrum Emission Mask measurements. SPURious Returns the peak list of Spurious Emission measurements. Return values: <TraceData> For more information see tables below. - Page 696 ® Remote Control R&S Remote Commands in Spectrum Analyzer Mode ● Checking Limits.....................705 ● Analyzing Results....................713 ● Predefined CP/ACLR Standards................716 Managing Measurement Configurations The following commands control measurement configurations for ACLR measure- ments............. 696 CALCulate<n>:MARKer<m>:FUNCtion:POWer:PRESet ........697 CALCulate<n>:MARKer<m>:FUNCtion:POWer:STANdard:CATalog? ........697 CALCulate<n>:MARKer<m>:FUNCtion:POWer:STANdard:DELete ........697 CALCulate<n>:MARKer<m>:FUNCtion:POWer:STANdard:SAVE...
- Page 697 ® Remote Control R&S Remote Commands in Spectrum Analyzer Mode NONE not yet defined with <string> being the name of a user standard. Note that pre- defined standards go without quotes, while user standards have to be in quotes ('user standard'). For further details refer to "Predefined CP/ACLR Standards"...
- Page 698 ® Remote Control R&S Remote Commands in Spectrum Analyzer Mode Manual operation: "Save" on page 215 Configuring ACLR Channels The following commands configure channels for channel power and ACLR measure- ments................. 698 [SENSe:]POWer:ACHannel:ACPairs ..........698 [SENSe:]POWer:ACHannel:BANDwidth|BWIDth:ACHannel .........699 [SENSe:]POWer:ACHannel:BANDwidth|BWIDth:ALTernate<channel> ........ 699 [SENSe:]POWer:ACHannel:BANDwidth|BWIDth[:CHANnel<channel>] ..............699 [SENSe:]POWer:ACHannel:NAME:ACHannel...
- Page 699 ® Remote Control R&S Remote Commands in Spectrum Analyzer Mode Manual operation: "Bandwidth" on page 208 [SENSe:]POWer:ACHannel:BANDwidth|BWIDth:ALTernate<channel> <Bandwidth> This command defines the channel bandwidth of the specified alternate adjacent chan- nels of the radio transmission system. If the channel bandwidth of one alternate adja- cent channel is changed (e.g.
- Page 700 ® Remote Control R&S Remote Commands in Spectrum Analyzer Mode Parameters: <Name> *RST: Example: POW:ACH:NAME:ACH 'XYZ' Defines the name of the adjacent channel as 'XYZ'. Manual operation: "Names" on page 210 [SENSe:]POWer:ACHannel:NAME:ALTernate<channel> <Name> This command defines a name for the specified alternate channel. The name is dis- played in the result diagram and the result table.
- Page 701 ® Remote Control R&S Remote Commands in Spectrum Analyzer Mode Example: POW:ACH:SPAC 33kHz Sets the spacing between the carrier signal and the adjacent channel to 33 kHz, the alternate adjacent channel 1 to 66 kHz, the alternate adjacent channel 2 to 99 kHz, and so on. Manual operation: "Spacing"...
- Page 702 ® Remote Control R&S Remote Commands in Spectrum Analyzer Mode The command is available only for multicarrier channel and adjacent-channel power measurements with span > 0 (see CALCulate<n>:MARKer<m>:FUNCtion:POWer: on page 688). SELect Parameters: <Number> 1 to 18 *RST: Example: POW:ACH:TXCH:COUN 3 Manual operation: "# of TX Chan"...
- Page 703 ® Remote Control R&S Remote Commands in Spectrum Analyzer Mode Suffix: <channel> 1...11 the alternate channel Parameters: <Alpha> <numeric value> *RST: 0,22 Example: POW:ACH:FILT:ALPH:ALT3 0,35 Sets the alpha value for the weighting filter for the alternate channel 3 to 0,35. Manual operation: "Weighting Filter"...
- Page 704 ® Remote Control R&S Remote Commands in Spectrum Analyzer Mode Parameters: <State> ON | OFF *RST: Example: POW:ACH:FILT:ALT3 ON Activates the weighting filter for alternate channel 3. Manual operation: "Weighting Filter" on page 210 [SENSe:]POWer:ACHannel:FILTer[:STATe]:CHANnel<channel> <State> This command activates the weighting filter for the specified TX channel. Suffix: <channel>...
- Page 705 ® Remote Control R&S Remote Commands in Spectrum Analyzer Mode [SENSe:]POWer:ACHannel:REFerence:TXCHannel:AUTO <Channel> This command activates the automatic selection of a transmission channel to be used as a reference channel in relative adjacent-channel power measurements. The transmission channel with the highest power, the transmission channel with the lowest power, or the transmission channel nearest to the adjacent channels can be defined as a reference channel.
- Page 706 ® Remote Control R&S Remote Commands in Spectrum Analyzer Mode ............. 706 CALCulate<n>:LIMit<k>:ACPower:ACHannel:ABSolute ........... 706 CALCulate<n>:LIMit<k>:ACPower:ACHannel:ABSolute:STATe ............707 CALCulate<n>:LIMit<k>:ACPower:ACHannel[:RELative] ......... 708 CALCulate<n>:LIMit<k>:ACPower:ACHannel[:RELative]:STATe ............708 CALCulate<n>:LIMit<k>:ACPower:ACHannel:RESult ........709 CALCulate<n>:LIMit<k>:ACPower:ALTernate<Channel>:ABSolute ......710 CALCulate<n>:LIMit<k>:ACPower:ALTernate<Channel>:ABSolute:STATe ........711 CALCulate<n>:LIMit<k>:ACPower:ALTernate<channel>[:RELative] ......711 CALCulate<n>:LIMit<k>:ACPower:ALTernate<Channel>[:RELative]:STATe ........712 CALCulate<n>:LIMit<k>:ACPower:ALTernate<Channel>:RESult? ............... 713 CALCulate<n>:LIMit<k>:ACPower[:STATe] CALCulate<n>:LIMit<k>:ACPower:ACHannel:ABSolute <LowerLimit>, <UpperLimit>...
- Page 707 ® Remote Control R&S Remote Commands in Spectrum Analyzer Mode Parameters: <State> ON | OFF *RST: Example: CALC:LIM:ACP:ACH 30DB, 30DB Sets the relative limit value for the power in the lower and upper adjacent channel to 30 dB below the channel power. CALC:LIM:ACP:ACH:ABS -35DBM, -35DBM Sets the absolute limit value for the power in the lower and upper adjacent channel to -35 dBm.
- Page 708 ® Remote Control R&S Remote Commands in Spectrum Analyzer Mode CALCulate<n>:LIMit<k>:ACPower:ACHannel[:RELative]:STATe <State> This command activates the limit check for the relative limit value of the adjacent chan- nel when adjacent-channel power measurement is performed. Before this command, the limit check must be activated using CALCulate<n>:LIMit<k>:ACPower[: STATe].
- Page 709 ® Remote Control R&S Remote Commands in Spectrum Analyzer Mode Return values: Result The result is returned in the form <result>, <result> where <result> = PASSED | FAILED, and where the first returned value denotes the lower, the second denotes the upper adjacent chan- nel.
- Page 710 ® Remote Control R&S Remote Commands in Spectrum Analyzer Mode CALCulate<n>:LIMit<k>:ACPower:ALTernate<Channel>:ABSolute:STATe <State> This command activates the limit check for the alternate adjacent channels for adja- cent-channel power measurement (Adjacent Channel Power). Before the command, the limit check must be globally switched on for the channel/ adjacent-channel power with the CALCulate<n>:LIMit<k>:ACPower[:STATe] command.
- Page 711 ® Remote Control R&S Remote Commands in Spectrum Analyzer Mode CALCulate<n>:LIMit<k>:ACPower:ALTernate<channel>[:RELative] <LowerLimit>, <UpperLimit> This command defines the limit for the alternate adjacent channels for adjacent chan- nel power measurements. The reference value for the relative limit value is the mea- sured channel power.
- Page 712 ® Remote Control R&S Remote Commands in Spectrum Analyzer Mode Parameters: <State> ON | OFF *RST: Example: CALC:LIM:ACP:ALT2 30DB, 30DB Sets the relative limit value for the power in the lower and upper second alternate adjacent channel to 30 dB below the channel power.
- Page 713 ® Remote Control R&S Remote Commands in Spectrum Analyzer Mode Example: CALC:LIM:ACP:ALT2 30DB, 30DB Sets the relative limit value for the power in the lower and upper second alternate adjacent channel to 30 dB below the channel power. CALC:LIM:ACP:ALT2:ABS -35DBM, -35DBM Sets the absolute limit value for the power in the lower and upper second alternate adjacent channel to -35 dBm.
- Page 714 ® Remote Control R&S Remote Commands in Spectrum Analyzer Mode ..........714 CALCulate<n>:MARKer<m>:FUNCtion:POWer:RESult:PHZ .................. 714 [SENSe:]POWer:ACHannel:MODE ....................715 [SENSe:]POWer:HSPeed ..................715 [SENSe:]POWer:NCORrection CALCulate<n>:MARKer<m>:FUNCtion:POWer:RESult:PHZ <State> This command switches the query response of the power measurement results between output of absolute values and output referred to the measurement bandwith. The measurement results are output with the CALCulate<n>:MARKer<m>: command.
- Page 715 [SENSe:]POWer:NCORrection <Mode> This command turns noise cancellation on and off. If noise cancellation is on, the R&S ESR performs a reference measurement to deter- mine its inherent noise and subtracts the result from the channel power measurement result (first active trace only).
-
Page 716: Measuring The Occupied Bandwidth
® Remote Control R&S Remote Commands in Spectrum Analyzer Mode Predefined CP/ACLR Standards Parameter Standard W-CDMA 3GPP FWD W-CDMA 3.84 MHz forward W-CDMA 3GPP REV W-CDMA 3.84 MHz reverse CDMA IS95A FWD CDMA IS95A forward CDMA IS95A REV CDMA IS95A reverse CDMA IS95C Class 0 FWD CDMA IS95C Class 0 forward CDMA IS95C Class 0 REV... -
Page 717: Measuring Spurious Emissions
® Remote Control R&S Remote Commands in Spectrum Analyzer Mode ● [SENSe:]POWer:ACHannel:BANDwidth|BWIDth[:CHANnel<channel>] on page 699 ● on page 693 [SENSe:]POWer:ACHannel:PRESet ● on page 694 [SENSe:]POWer:ACHannel:PRESet:RLEVel ● on page 694 TRACe<n>:DATA ................717 [SENSe:]POWer:BANDwidth|BWIDth [SENSe:]POWer:BANDwidth|BWIDth <Percentage> This command defines the percentage of the power with respect to the total power. This value is the basis for the occupied bandwidth measurement (see [SENSe: on page 693). - Page 718 ® Remote Control R&S Remote Commands in Spectrum Analyzer Mode MMEMory:STORe<n>:SPURious <FileName> This command exports the marker peak list available for spurious emission measure- ments to a file. Suffix: <n> irrelevant Parameters: <FileName> String containing the path and name of the target file. Example: MMEM:STOR:SPUR 'test' Saves the current marker peak list in the file test.dat.
- Page 719 Suffix: <range> 1...20 range Parameters: <State> The R&S ESR stops after one range is swept and continues only if you confirm (a message box is displayed). The R&S ESR sweeps all ranges in one go. *RST: Example: LIST:RANG:BRE ON Configures a stop after each range.
- Page 720 ® Remote Control R&S Remote Commands in Spectrum Analyzer Mode Example: LIST:RANG:COUNt? Returns the number of defined ranges. [SENSe:]LIST:RANGe<range>:DELete This command deletes the specified range. The range numbers are updated accord- ingly. The reference range cannot be deleted. A minimum of three ranges is manda- tory.
- Page 721 ® Remote Control R&S Remote Commands in Spectrum Analyzer Mode Suffix: <range> 1...20 range Parameters: <Type> NORMal Gaussian filters CFILter channel filters RRC filters 5 Pole filters *RST: NORM The available bandwidths of the filters are specified in the data sheet.
- Page 722 ® Remote Control R&S Remote Commands in Spectrum Analyzer Mode Suffix: <range> 1...20 range Parameters: <Frequency> see rules in chapter 4, "Ranges and settings" *RST: -2.52 MHz (range 1), 2.52 MHz (range 2), 250.0 MHz (range 3) Example: LIST:RANG3:STOP 10000000 Sets the stop frequency for range 2 to 10 MHz.
- Page 723 ® Remote Control R&S Remote Commands in Spectrum Analyzer Mode Suffix: <range> 1...20 range Parameters: <State> ON | OFF *RST: Example: LIST:RANG3:INP:GAIN:STATe ON Switches the preamplifier for range 3 on or off. Manual operation: "Preamp" on page 260 [SENSe:]LIST:RANGe<range>:LIMit:STARt <Limit> This command sets an absolute limit value at the start frequency of the specified range.
- Page 724 ® Remote Control R&S Remote Commands in Spectrum Analyzer Mode [SENSe:]LIST:RANGe<range>:LIMit:STOP <Limit> This command sets an absolute limit value at the stop frequency of the specified range. Different from manual operation, this setting is independent of the defined limit check type. Suffix: <range>...
- Page 725 ® Remote Control R&S Remote Commands in Spectrum Analyzer Mode [SENSe:]LIST:RANGe<range>:SWEep:TIME This command sets the sweep time for the specified range. Suffix: <range> 1...20 range Parameters: <SweepTime> Allowed values depend on the ratio of span to RBW and RBW to VBW.
- Page 726 If you want to read out the values peak values including the delta to a limit, you have to switch on the limit again. This command is only for FSP compatibility, and not necessary to use on the R&S ESR. Suffix: <n>...
- Page 727 ® Remote Control R&S Remote Commands in Spectrum Analyzer Mode CALCulate<n>:PEAKsearch|PSEarch:AUTO <State> This command activates or deactivates the list evaluation. Suffix: <n> Selects the measurement window. Parameters: <State> ON | OFF *RST: Example: CALC:ESP:PSE:AUTO OFF Deactivates the list evaluation. Manual operation: "List Evaluation (On/Off)"...
-
Page 728: Testing Against A Spectrum Emission Mask
® Remote Control R&S Remote Commands in Spectrum Analyzer Mode Retrieving Results The following commands analyze and retrieve measurement results for spurious emis- sion measurements. ● on page 687 CALCulate<n>:LIMit<k>:FAIL? ● on page 694 TRACe<n>:DATA 16.5.1.5 Testing Against a Spectrum Emission Mask The following commands configure and perform spectrum emission mask (SEM) mea- surements. - Page 729 ® Remote Control R&S Remote Commands in Spectrum Analyzer Mode Example: ESP:PRES 'WCDMA\3GPP\DL\PowerClass_31_39.xml' Selects the PowerClass_31_39.xml XML file in the C: \R_S\instr\sem_std\WCDMA\3GPP\DL directory. ESP:PRES? W-CDMA 3GPP DL (31,39)dBm The query returns information about the selected standard, the link direction and the power class. If no standard has been selected, the query returns None.
- Page 730 ® Remote Control R&S Remote Commands in Spectrum Analyzer Mode [SENSe:]SWEep:MODE <Mode> This command selects the spurious emission and spectrum emission mask measure- ments. Parameters: <Mode> AUTO | ESPectrum | LIST AUTO Switches to "Spectrum" measurement mode or stays in the cur- rent mode if it is not ESP/LIST ESPectrum "Spectrum Emission Mask"...
- Page 731 ® Remote Control R&S Remote Commands in Spectrum Analyzer Mode [SENSe:]ESPectrum:HighSPeed <State> This command activates Fast SEM mode to accelerate spurious emission mask mea- surements. For details see "Fast Spectrum Emission Mask Measurements" on page 251. Note that in Fast SEM mode, the following parameters cannot be changed in all ranges: ●...
- Page 732 ® Remote Control R&S Remote Commands in Spectrum Analyzer Mode Example: ESP:RANG2:BAND:RES 5000 Sets the RBW for range 2 to 5 kHz. Manual operation: "RBW" on page 229 [SENSe:]ESPectrum:RANGe<range>:BANDwidth:VIDeo <Value> This command sets the VBW value for the specified range. Note that this parameter can not be set for all ranges if "Fast SEM"...
- Page 733 ® Remote Control R&S Remote Commands in Spectrum Analyzer Mode [SENSe:]ESPectrum:RANGe<range>:FILTer:TYPE <Type> This command sets the filter type for the specified range. Note that this parameter can not be set for all ranges if "Fast SEM" mode is activated (see on page 731).
- Page 734 ® Remote Control R&S Remote Commands in Spectrum Analyzer Mode Manual operation: "Range Start / Range Stop" on page 229 [SENSe:]ESPectrum:RANGe<range>[:FREQuency]:STOP <Frequency> This command sets the stop frequency for the specified range. For further details refer to the command. [SENSe:]ESPectrum:RANGe<range>[:FREQuency]:STARt Note the rules for the <Frequency>...
- Page 735 ® Remote Control R&S Remote Commands in Spectrum Analyzer Mode Suffix: <range> 1...20 range Parameters: <State> ON | OFF *RST: Example: ESP:RANG2:INP:ATT:AUTO OFF Deactivates the RF attenuation auto mode for range 2. Manual operation: "RF Att. Mode" on page 230 [SENSe:]ESPectrum:RANGe<range>:INPut:GAIN:STATe <State>...
- Page 736 ® Remote Control R&S Remote Commands in Spectrum Analyzer Mode [SENSe:]ESPectrum:RANGe<range>:LIMit<source>:ABSolute:STARt <Level> This command sets an absolute limit value at the start frequency of the specified range. Different from manual operation, this setting is independently of the defined limit check type. Suffix: <range>...
- Page 737 ® Remote Control R&S Remote Commands in Spectrum Analyzer Mode Example: ESP:RANG3:LIM:REL:STAR -20 Sets a relative limit of -20 dBc at the start frequency of the range. Manual operation: "Rel Limit Start" on page 231 [SENSe:]ESPectrum:RANGe<range>:LIMit<source>:RELative:STOP <Limit> This command sets a relative limit value at the stop frequency of the specified range. Different from manual operation, this setting is independently of the defined limit check type.
- Page 738 ® Remote Control R&S Remote Commands in Spectrum Analyzer Mode [SENSe:]ESPectrum:RANGe<range>:RLEVel <Value> This command sets the reference level for the specified range. Note that this parameter can not be set for all ranges if "Fast SEM" mode is activated (see on page 731).
- Page 739 ® Remote Control R&S Remote Commands in Spectrum Analyzer Mode Parameters: <State> ON | OFF *RST: Example: ESP:RANG3:SWE:TIME:AUTO OFF Deactivates the sweep time auto mode for range 3. Manual operation: "Sweep Time Mode" on page 230 [SENSe:]ESPectrum:RANGe<range>:TRANsducer <TransducerName> This command sets a transducer for the specified range. You can only choose a trans- ducer that fulfills the following conditions: ●...
- Page 740 ® Remote Control R&S Remote Commands in Spectrum Analyzer Mode Example: ESP:RTYP CPOW Sets the power reference type to channel power. ESP:BWID 1 MHZ Sets the Tx bandwidth to 1 MHz. Manual operation: "Edit Reference Range" on page 233 [SENSe:]ESPectrum:FILTer[:RRC]:ALPHa <Value> This command sets the alpha value of the RRC filter.
- Page 741 ® Remote Control R&S Remote Commands in Spectrum Analyzer Mode [SENSe:]ESPectrum:RTYPe <Type> This command sets the power reference type. Parameters: <Type> PEAK | CPOWer PEAK Measures the highest peak within the reference range. CPOWer Measures the channel power within the reference range (integral bandwidth method).
- Page 742 ® Remote Control R&S Remote Commands in Spectrum Analyzer Mode Example: CALC:LIM:ESP:LIM -50,50,70 Defines the following power classes: <-200, -50> <-50, 50> <50, 70> <70, 200> Query: CALC:LIM:ESP:LIM? Response: -200,-50,50,70,200 CALCulate<n>:LIMit<k>:ESPectrum:MODE <Mode> This command activates or deactivates the automatic selection of the limit line in the Spectrum Emission Mask measurement.
- Page 743 ® Remote Control R&S Remote Commands in Spectrum Analyzer Mode CALCulate<n>:LIMit<k>:ESPectrum:PCLass<Class>[:EXCLusive] <State> This command sets the power classes used in the spectrum emission mask measure- ment. It is only possible to use power classes for which limits are defined. Also, either only one power class at a time or all power classes together can be selected.
- Page 744 ® Remote Control R&S Remote Commands in Spectrum Analyzer Mode CALCulate<n>:LIMit<k>:ESPectrum:PCLass<Class>:MAXimum <Level> This command sets the upper limit level for one power class. The unit is dBm. The limit always ends at + 200 dBm, i.e. the upper limit of the last power class can not be set. If more than one power class is in use, the upper limit must equal the lower limit of the next power class.
- Page 745 ® Remote Control R&S Remote Commands in Spectrum Analyzer Mode CALCulate<n>:LIMit<k>:ESPectrum:VALue <Power> This command activates the manual limit line selection and specifies the expected power as a value. Depending on the entered value, one of the predefined limit lines is selected.
- Page 746 ® Remote Control R&S Remote Commands in Spectrum Analyzer Mode Manual operation: "Save Evaluation List" on page 234 "ASCII File Export" on page 234 "Save Evaluation List" on page 263 "ASCII File Export" on page 263 CALCulate<n>:ESPectrum:PSEarch|:PEAKsearch:[IMMediate] This command starts the list evaluation. Suffix: <n>...
-
Page 747: Performing Emi Measurements
® Remote Control R&S Remote Commands in Spectrum Analyzer Mode Parameters: <State> ON | OFF *RST: Example: CALC:ESP:PSE:PSH ON Marks all peaks with blue squares. Manual operation: "Show Peaks" on page 234 Retrieving Results The following commands analyze and retrieve measurement results for SEM measure- ments. - Page 748 ® Remote Control R&S Remote Commands in Spectrum Analyzer Mode Parameters: <State> ON | OFF Performing a Peak Search Commands useful to perform EMI measurements described elsewhere: ● on page 666 CALCulate<n>:DELTamarker<m>:AOFF ● on page 670 CALCulate<n>:DELTamarker<m>:TRACe ● on page 660 CALCulate<n>:MARKer<m>:AOFF ●...
- Page 749 ® Remote Control R&S Remote Commands in Spectrum Analyzer Mode If the marker hasn't been active yet, the command also turns the marker on. Suffix: <n> irrelevant <m> marker Parameters: <Detector> turns the marker off AVER average detector CISPR Average detector CRMS RMS Average detector maximum peak detector...
- Page 750 ® Remote Control R&S Remote Commands in Spectrum Analyzer Mode Manual operation: "Auto Peak Search" on page 273 "Marker Configuration" on page 273 Evaluating the Results ..... 750 CALCulate<n>:DELTamarker<m>:FUNCtion:FMEasurement:LIMit<k>:CONDition ? ....750 CALCulate<n>:DELTamarker<m>:FUNCtion:FMEasurement:LIMit<k>:DELTa? ......... 751 CALCulate<n>:DELTamarker<m>:FUNCtion:FMEasurement:RESult? .....751 CALCulate<n>:MARKer<m>:FUNCtion:FMEasurement:LIMit<k>:CONDition ? ......752 CALCulate<n>:MARKer<m>:FUNCtion:FMEasurement:LIMit<k>:DELTa? ........
- Page 751 ® Remote Control R&S Remote Commands in Spectrum Analyzer Mode <m> 1...16 deltamarker <k> 1...8 limit line Return values: <Amplitude> Vertical distance to the limit line in dB. Example: CALC:DELT3:FUNC:FME:LIM2:DELT? Queries the distance of deltamarker 3 to the second limit line. Usage: Query only Manual operation:...
- Page 752 ® Remote Control R&S Remote Commands in Spectrum Analyzer Mode The marker is inside the margins of a limit line. The marker has failed the limit check. Example: CALC:MARK1:FUNC:FME:LIM2:COND? Queries the condition of marker 1 in relation to limit line 2. Usage: Query only Manual operation:...
-
Page 753: Measuring The Modulation Depth
® Remote Control R&S Remote Commands in Spectrum Analyzer Mode Usage: Query only Manual operation: "Marker Table" on page 275 16.5.1.7 Measuring the Modulation Depth The following commands configure and perform AM modulation depth measurements........ 753 CALCulate<n>:MARKer<m>:FUNCtion:MDEPth:SEARchsignal ONCE ...........753 CALCulate<n>:MARKer<m>:FUNCtion:MDEPth:RESult? ........... - Page 754 ® Remote Control R&S Remote Commands in Spectrum Analyzer Mode Example: INIT:CONT OFF Switches to single sweep mode. CALC:MARK:X 10MHZ Sets the reference marker (marker 1) to the carrier signal at 10 MHz. CALC:MARK:FUNC:MDEP ON Switches on the modulation depth measurement. INIT;*WAI Starts a sweep and waits for the end.
-
Page 755: Measuring The Harmonic Distortion
® Remote Control R&S Remote Commands in Spectrum Analyzer Mode Example: CALC:MARK:X 10MHZ Sets the reference marker (marker 1) to the carrier signal at 10 MHz. CALC:MARK:FUNC:MDEP ON Switches on the modulation depth measurement. CALC:DELT2:X 10KHZ Sets delta markers 2 and 3 to the signals at 10 kHz from the car- rier signal. - Page 756 ® Remote Control R&S Remote Commands in Spectrum Analyzer Mode Manual operation: "Harmonic RBW Auto" on page 311 CALCulate<n>:MARKer<m>:FUNCtion:HARMonics:DISTortion? This command queries the total harmonic distortion of the signal. To get a valid result, you have to perform a complete measurement with synchroniza- tion to the end of the measurement before reading out the result.
- Page 757 ® Remote Control R&S Remote Commands in Spectrum Analyzer Mode Parameters: <Harmonics> Returns one value for every harmonic. The first value is the absolute power of the first harmonic. The unit is variable. The other values are power levels relative to the first harmonic.
- Page 758 ® Remote Control R&S Remote Commands in Spectrum Analyzer Mode Suffix: <n> Selects the measurement window. <m> irrelevant Example: CALC:MARK:FUNC:HARM:PRES Optimizes the device settings for the harmonic measurement. Usage: Event Manual operation: "Adjust Settings" on page 311 CALCulate<n>:MARKer<m>:FUNCtion:HARMonics[:STATe] <State> This command turns the harmonic distortion measurement on and off. Note the following: ●...
-
Page 759: Measuring The Carrier-To-Noise Ratio
® Remote Control R&S Remote Commands in Spectrum Analyzer Mode 16.5.1.9 Measuring the Carrier-to-Noise Ratio Commands useful to measure the C/N ratio described elsewhere: ● on page 690 CALCulate<n>:MARKer<m>:FUNCtion:POWer:RESult? ● on page 688 CALCulate<n>:MARKer<m>:FUNCtion:POWer:SELect ● on page 692 CALCulate<n>:MARKer<m>:FUNCtion:POWer[:STATe] ● [SENSe:]POWer:ACHannel:BANDwidth|BWIDth[:CHANnel<channel>] on page 699 ●... -
Page 760: Measuring Statistics
® Remote Control R&S Remote Commands in Spectrum Analyzer Mode The third-order intercept is calculated from the level spacing between the normal mark- ers and the delta markers. Suffix: <n> Selects the measurement window. <m> irrelevant Parameters: <State> ON | OFF *RST: Example: CALC:MARK:FUNC:TOI ON... - Page 761 ® Remote Control R&S Remote Commands in Spectrum Analyzer Mode ● Configuring Statistical Measurements..............761 ● Retrieving Results....................762 ● Using Gate Ranges for Statistical Measurements..........763 ● Scaling the Diagram....................765 Configuring Statistical Measurements The following commands configure the measurement................761 CALCulate<n>:STATistics:APD[:STATe] .................
- Page 762 ® Remote Control R&S Remote Commands in Spectrum Analyzer Mode CALCulate<n>:STATistics:NSAMples <NoMeasPoints> This command sets the number of measurement points to be acquired for the statisti- cal measurement functions. Suffix: <n> irrelevant Parameters: <NoMeasPoints> 100 to 1E9 *RST: 100000 Example: CALC:STAT:NSAM 500 Sets the number of measurement points to be acquired to 500.
- Page 763 ® Remote Control R&S Remote Commands in Spectrum Analyzer Mode CALCulate<n>:STATistics:RESult<Trace> <ResultType> This command reads out the results of statistical measurements of a recorded trace. Suffix: <n> irrelevant <Trace> 1...6 trace Parameters: <ResultType> MEAN | PEAK | CFACtor | ALL MEAN Average (=RMS) power in dBm measured during the measure- ment time.
- Page 764 ® Remote Control R&S Remote Commands in Spectrum Analyzer Mode Manual operation: "Gate Ranges" on page 290 [SENSe:]SWEep:EGATe:TRACe<k>: PERiod <Value> This command defines the length of the period to be traced using gated triggering. Suffix: <k> 1...6 trace Parameters: <Value> <numeric value>...
- Page 765 ® Remote Control R&S Remote Commands in Spectrum Analyzer Mode Parameters: <State> ON | OFF *RST: Example: SWE:EGAT:TRAC1:STAT1 ON Activates tracing for range 1 of trace 1. Manual operation: "Gate Ranges" on page 290 [SENSe:]SWEep:EGATe:TRACe<k>: STOP<range> <Value> This command defines the stopping point for the range to be traced using gated trig- gering Suffix: <k>...
- Page 766 ® Remote Control R&S Remote Commands in Spectrum Analyzer Mode y-axis upper limit: y-axis lower limit: 1E-6 Suffix: <n> irrelevant Example: CALC:STAT:PRES Resets the scaling for statistical functions Manual operation: "Default Settings" on page 289 CALCulate<n>:STATistics:SCALe:AUTO ONCE This command optimizes the level setting of the instrument depending on the mea- sured peak power, in order to obtain maximum instrument sensitivity.
- Page 767 ® Remote Control R&S Remote Commands in Spectrum Analyzer Mode CALCulate<n>:STATistics:SCALe:X:RLEVel <Value> This command defines the reference level for the x-axis of the measurement diagram. The setting is identical to the reference level setting using the DISPlay[: command. WINDow<n>]:TRACe<t>:Y[:SCALe]:RLEVel With the reference level offset <> 0 the indicated value range of the reference level is modified by the offset.
-
Page 768: Measuring In The Time Domain
® Remote Control R&S Remote Commands in Spectrum Analyzer Mode CALCulate<n>:STATistics:SCALe:Y:UPPer <Value> This command defines the upper limit for the y-axis of the diagram in statistical mea- surements. Since probabilities are specified on the y-axis, the entered numeric values are dimensionless. Suffix: <n>... - Page 769 ® Remote Control R&S Remote Commands in Spectrum Analyzer Mode The number of results required for the calculation of average is defined with [SENSe: ]AVERage<n>:COUNt. To get a valid result, you have to perform a complete measurement with synchroniza- tion to the end of the measurement before reading out the result. This is only possible for single sweeps.
- Page 770 ® Remote Control R&S Remote Commands in Spectrum Analyzer Mode Suffix: <n> Selects the measurement window. <m> Selects the marker. Parameters: <State> ON | OFF *RST: Example: CALC:MARK:FUNC:SUMM:PHOL ON Switches on the function. CALCulate<n>:MARKer<m>:FUNCtion:SUMMary:REFerence:AUTO ONCE This command sets the currently measured average value (CALCulate<n>: MARKer<m>:FUNCtion:SUMMary:MEAN[:STATe]) and RMS value (CALCulate<n>:MARKer<m>:FUNCtion:SUMMary:RMS[:STATe]) as reference...
- Page 771 ® Remote Control R&S Remote Commands in Spectrum Analyzer Mode Manual operation: "Time Domain Power (zero span)" on page 194 "Time Domain Power" on page 266 Retrieving Measurement Results The following commands analyze and retrieve measurement results for time domain power measurements.
- Page 772 ® Remote Control R&S Remote Commands in Spectrum Analyzer Mode Example: INIT:CONT OFF Switches to single sweep mode. CALC:MARK:FUNC:SUMM:MEAN ON Switches on the function. CALC:MARK:FUNC:SUMM:AVER ON Switches on the average value calculation. INIT;*WAI Starts a sweep and waits for the end. CALC:MARK:FUNC:SUMM:MEAN:AVER:RES? Outputs the result.
- Page 773 ® Remote Control R&S Remote Commands in Spectrum Analyzer Mode Suffix: <n> Selects the measurement window. <m> Selects the marker. Return values: <MeanPower> Mean power of the signal during the measurement time. Example: INIT:CONT OFF Switches to single sweep mode. CALC:MARK:FUNC:SUMM:MEAN ON Switches on the function.
- Page 774 ® Remote Control R&S Remote Commands in Spectrum Analyzer Mode <m> Selects the marker. Return values: <PeakPower> Peak power of the signal during the measurement time. Example: INIT:CONT OFF Switches to single sweep mode. CALC:MARK:FUNC:SUMM:PPE ON Switches on the function. CALC:MARK:FUNC:SUMM:AVER ON Switches on the calculation of average.
- Page 775 ® Remote Control R&S Remote Commands in Spectrum Analyzer Mode To get a valid result, you have to perform a complete measurement with synchroniza- tion to the end of the measurement before reading out the result. This is only possible for single sweeps.
- Page 776 ® Remote Control R&S Remote Commands in Spectrum Analyzer Mode To get a valid result, you have to perform a complete measurement with synchroniza- tion to the end of the measurement before reading out the result. This is only possible for single sweeps.
- Page 777 ® Remote Control R&S Remote Commands in Spectrum Analyzer Mode CALCulate<n>:MARKer<m>:FUNCtion:SUMMary:RMS:RESult? This command queries the RMS time domain power. To get a valid result, you have to perform a complete measurement with synchroniza- tion to the end of the measurement before reading out the result. This is only possible for single sweeps.
- Page 778 ® Remote Control R&S Remote Commands in Spectrum Analyzer Mode CALCulate<n>:MARKer<m>:FUNCtion:SUMMary:SDEViation:AVERage:RESult? This command queries the average standard deviation of the time domain power. The query is only possible if averaging has been activated previously using CALCulate<n>:MARKer<m>:FUNCtion:SUMMary:AVERage. To get a valid result, you have to perform a complete measurement with synchroniza- tion to the end of the measurement before reading out the result.
- Page 779 ® Remote Control R&S Remote Commands in Spectrum Analyzer Mode Example: INIT:CONT OFF Switches to single sweep mode. CALC:MARK:FUNC:SUMM:SDEV ON Switches on the function. CALC:MARK:FUNC:SUMM:PHOL ON Switches on the peak value measurement. INIT;*WAI Starts a sweep and waits for the end. CALC:MARK:FUNC:SUMM:SDEV:PHOL:RES? Outputs the result.
-
Page 780: Measuring The Pulse Power
® Remote Control R&S Remote Commands in Spectrum Analyzer Mode <m> Selects the marker. Parameters: <State> ON | OFF *RST: Example: CALC:MARK:FUNC:SUMM:SDEV ON Switches on the measurement of the standard deviation. Manual operation: "Std Dev" on page 266 16.5.1.13 Measuring the Pulse Power The commands of this subsystem are used to determine the mean burst power or peak burst power for a given number of signal bursts, and for outputting the results in a list. - Page 781 ® Remote Control R&S Remote Commands in Spectrum Analyzer Mode ● Setting up the instrument and querying the result list after synchronization to the end of measurement: With this method the control computer can be used for other activities while the instrument is performing the measurement at the cost of addi- tional time needed for synchronization via service request.
- Page 782 <TriggerSource>, <TriggerLevel>, <TriggerOffset>, <Detector>, <#OfPulses> This command configures and initiates the pulse power measurement. The R&S ESR caches all measurement parameters that you can set with this com- mand. If you use the command repeatedly, the R&S ESR only changes those settings that you have actually changed before initiating the measurement.
- Page 783 The trigger level is available for the video trigger. In that case, the level is a percentage of the diagram height. In case of an external trigger, the R&S ESR uses a fix TTL level. Range: 0 PCT to 100 PCT <TriggerOffset>...
-
Page 784: Performing List Evaluations
® Remote Control R&S Remote Commands in Spectrum Analyzer Mode Example: Sample setting: SENSe:MPOWer 935.2MHz,1MHz,434us,VIDEO,50PCT, 5us,MEAN,20 Performs a measurement sequence with the following settings: Frequency = 935.2 MHz, Resolution bandwidth = 1 MHz Measurement time = 434 µs Trigger source = VIDEO Trigger threshold = 50 % Trigger offset = 5 µs Type of measurement = MEAN power... - Page 785 ® Remote Control R&S Remote Commands in Spectrum Analyzer Mode ● Instrument setup and querying of the result list at the end of the measurement: With this method, the control computer may be used for other activities while the measurement is being performed. However, more time is needed for synchroniza- tion via service request.
- Page 786 The list can contain up to 200 entries (frequencies). You can define a different instru- ment setup for each frequency that is in the list. If you synchronize the measurement with *OPC, the R&S ESR produces a service request when all frequencies have been measured and the number of individual mea- surements has been performed.
- Page 787 ® Remote Control R&S Remote Commands in Spectrum Analyzer Mode <VBW> Defines the video bandwidth for a list entry. The value is ignored for <filter type> = "CFILter" or "RRC" Range: 1 Hz to 10 MHz in 1, 3, 10 steps <MeasTime>...
- Page 788 ® Remote Control R&S Remote Commands in Spectrum Analyzer Mode Example: SENSe:LIST:POWer 935.2 MHz,0dBm,10dB,OFF,NORM,1 MHz,3 MHz,440us, 935.4 MHz,0dBm,10dB,10dB,CFIL,30 kHz,100 kHz, 440us,0, 935.6 MHz,0dBm,10dB,20dB,CFIL,30 kHz,100 kHz, 440us,0 Performs a measurement sequence with the settings described Table 16-22. SENSe:LIST:POWer? 935.2 MHz,0dBm,10dB,OFF,NORM,1 MHz,3 MHz,440us, 935.4 MHz,0dBm,10dB,10dB,CFIL,30 kHz,100 kHz, 440us,0, 935.6 MHz,0dBm,10dB,20dB,CFIL,30 kHz,100 kHz,...
-
Page 789: Probe Configuration
® Remote Control R&S Remote Commands in Spectrum Analyzer Mode <AVGPower> ON | OFF Turns average power evaluation on and off. *RST: <TriggerSource> IMMediate | EXTernal | VIDeo | IFPower | RFPower Selects a trigger source. For more information see "Trg/Gate Source"... - Page 790 Manual operation: "Name" on page 357 PROBe:SETup:STATe? This command queries whether a probe is connected to the instrument's [RF Input] and USB connectors and was recognized by the R&S ESR. Example: PROB:SET:STAT ON Usage: Query only User Manual 1175.7068.02 ─ 13...
-
Page 791: Configuring Spectrum Measurements
Configuration.................... 805 ● Vertical Axis Configuration..................812 16.5.2.1 Frequency Settings The following commands select the frequency characteristics the R&S ESR uses for the measurement. Defining Frequency Characteristics Commands useful to define the frequency described elsewhere: ● on page 634 [SENSe:]FREQuency:CENTer:STEP .................. - Page 792 ® Remote Control R&S Remote Commands in Spectrum Analyzer Mode Parameters: <Frequency> Range: 0 to fmax *RST: fmax/2 Default unit: Hz is specified in the data sheet. min span is 10 Hz (SEM and Spurious: min span = 20 Hz) Example: FREQ:CENT 100 MHz Manual operation:...
- Page 793 ® Remote Control R&S Remote Commands in Spectrum Analyzer Mode [SENSe:]FREQuency:CENTer:STEP:LINK:FACTor <Factor> This command defines a step size factor if the center frequency step size is coupled to the span or the resolution bandwidth. Parameters: <Factor> Range: 1 to 100 *RST: Default unit: PCT FREQ:CENT:STEP:LINK:FACT 20PCT...
- Page 794 ® Remote Control R&S Remote Commands in Spectrum Analyzer Mode Parameters: <Offset> Range: -100 GHz to 100 GHz *RST: 0 Hz Default unit: Hz Example: FREQ:OFFS 1GHZ Manual operation: "Frequency Offset" on page 317 [SENSe:]FREQuency:STARt <Frequency> This command defines the start frequency for measurements in the frequency domain. Parameters: <Frequency>...
- Page 795 CALCulate<n>:MARKer<m>:FUNCtion:STRack[:STATe] <State> This command turns signal tracking on and off. When signal tracking is on, the R&S ESR determines the maximum signal after each frequency sweep. The center frequency is then set to the frequency of this signal. Thus, the center frequency follows the frequency when you measure drifting signals.
-
Page 796: Automatic Measurement Configuration
® Remote Control R&S Remote Commands in Spectrum Analyzer Mode CALCulate<n>:MARKer<m>:FUNCtion:STRack:THReshold <Level> This command defines a threshold above which the signal is tracked. Note that you have to turn on signal tracking before you can use the command (CALCulate<n>:MARKer<m>:FUNCtion:STRack[:STATe]). The unit depends on CALCulate<n>:UNIT:POWer. Suffix: <n>... - Page 797 ® Remote Control R&S Remote Commands in Spectrum Analyzer Mode [SENSe:]ADJust:ALL This command determines the ideal frequency and level configuration for the current measurement. Example: ADJ:ALL Manual operation: "Auto All" on page 327 [SENSe:]ADJust:CONFiguration:HYSTeresis:LOWer <Threshold> This command defines a lower threshold the signal must drop below before the refer- ence level is automatically adjusted when the "Auto Level"...
- Page 798 ADJ:CONF:LEV:DUR:5 Manual operation: "Meas Time Manual" on page 328 [SENSe:]ADJust:CONFigure:LEVel:DURation:MODE <Mode> This command selects the way the R&S ESR determines the length of the measure- ment that is performed while determining the ideal reference level. Parameters: <Mode> AUTO Automatically determines the measurement length.
-
Page 799: Bandwidth Settings
® Remote Control R&S Remote Commands in Spectrum Analyzer Mode Manual operation: "Auto Freq" on page 327 [SENSe:]ADJust:LEVel This command automatically sets the optimal reference level for the current measure- ment. You can define a threshold that the signal must exceed before the reference level is adjusted, see [SENSe:]ADJust:CONFiguration:HYSTeresis:UPPer [SENSe:]ADJust:CONFiguration:HYSTeresis:LOWer. - Page 800 ® Remote Control R&S Remote Commands in Spectrum Analyzer Mode [SENSe:]BANDwidth|BWIDth[:RESolution]:FFT <FilterMode> This command defines the filter mode of FFT filters by defining the partial span size. The partial span is the span which is covered by one FFT analysis. This command is only available for sweep type "FFT".
- Page 801 ® Remote Control R&S Remote Commands in Spectrum Analyzer Mode Parameters: <Bandwidth> refer to data sheet *RST: (AUTO is set to ON) Example: BAND:VID 10 kHz Manual operation: "Video BW Manual" on page 331 [SENSe:]BANDwidth|BWIDth:VIDeo:AUTO <State> This command couples and decouples the VBW to the RBW. to define the ratio VBW/RBW.
-
Page 802: Sweep Configuration
® Remote Control R&S Remote Commands in Spectrum Analyzer Mode [SENSe:]BANDwidth|BWIDth:VIDeo:TYPE <Mode> This command selects the position of the video filter in the signal path. Parameters: <Mode> LINear The video filter is applied in front of the logarithmic amplifier. In linear mode, measurements with a logarithmic level scale result in flatter falling edges compared to logarithmic mode. - Page 803 ® Remote Control R&S Remote Commands in Spectrum Analyzer Mode Suffix: <n> irrelevant Example: INIT:CONT OFF Switches to single sweep mode. DISP:WIND:TRAC:MODE AVER Switches on trace averaging. SWE:COUN 20 Setting the sweep counter to 20 sweeps. INIT;*WAI Starts the measurement and waits for the end of the 20 sweeps. INIT:CONM;*WAI Continues the measurement (next 20 sequences) and waits for the end.
- Page 804 ® Remote Control R&S Remote Commands in Spectrum Analyzer Mode [SENSe:]SWEep:TIME <Time> This command defines the sweep time. The range depends on the frequency span. If this command is used in "Spectrum" mode, automatic coupling to resolution band- width and video bandwidth is switched off. Parameters: <Time>...
-
Page 805: Trigger Configuration
® Remote Control R&S Remote Commands in Spectrum Analyzer Mode Example: SWE:TYPE FFT Selects FFT sweeps. Manual operation: "Sweep" on page 329 "FFT" on page 329 "Auto" on page 329 [SENSe:]SWEep:TYPE:USED? This command queries the sweep type if you have turned on automatic selection of the sweep type. - Page 806 ® Remote Control R&S Remote Commands in Spectrum Analyzer Mode Parameters: <Delay> Range: zero span: -sweeptime (see data sheet) to 30 s; span: 0 to 30 s *RST: Example: TRIG:HOLD 500us Manual operation: "Trigger Offset" on page 348 TRIGger<n>[:SEQuence]:IFPower:HOLDoff <Value> This command sets the holding time before the next IF power trigger event.
- Page 807 ® Remote Control R&S Remote Commands in Spectrum Analyzer Mode Suffix: <n> irrelevant Parameters: <TriggerLevel> Range: 0.5 V to 3.5 V *RST: 1.4 V Example: TRIG:LEV 2V TRIGger<n>[:SEQuence]:LEVel:IFPower <TriggerLevel> This command defines the power level at the third intermediate frequency that must be exceeded to cause a trigger event.
- Page 808 ® Remote Control R&S Remote Commands in Spectrum Analyzer Mode Manual operation: "Video" on page 156 "Trg/Gate Level" on page 347 "Trigger Level" on page 441 TRIGger<n>[:SEQuence]:SLOPe <Type> This command selects the slope of the trigger signal. The selected trigger slope applies to all trigger signal sources.
- Page 809 ® Remote Control R&S Remote Commands in Spectrum Analyzer Mode MASK Selects the frequency mask trigger. TDTRigger Selects the time domain trigger. TIME Selects the time trigger. VIDeo Selects the video trigger. The video trigger is available for time domain measurements. *RST: IMMediate Example:...
- Page 810 ® Remote Control R&S Remote Commands in Spectrum Analyzer Mode ..................811 [SENSe:]SWEep:EGATe:POLarity ..................811 [SENSe:]SWEep:EGATe:SOURce ..................812 [SENSe:]SWEep:EGATe:TYPE [SENSe:]SWEep:EGATe <State> This command switches on/off the sweep control by an external gate signal. If the external gate is selected the trigger source is automatically switched to EXTernal as well.
- Page 811 ® Remote Control R&S Remote Commands in Spectrum Analyzer Mode Manual operation: "Gate Delay" on page 349 [SENSe:]SWEep:EGATe:LENGth <TimeInterval> This command defines a gate length. Parameters: <TimeInterval> 125 ns to 30 s *RST: 400μs Example: SWE:EGAT:LENG 10ms Manual operation: "Gate Length (Gate Mode Edge)" on page 350 [SENSe:]SWEep:EGATe:POLarity <Polarity>...
-
Page 812: Vertical Axis Configuration
® Remote Control R&S Remote Commands in Spectrum Analyzer Mode [SENSe:]SWEep:EGATe:TYPE <Type> This command sets the type of triggering by the external gate signal. A delay between applying the gate signal and the start of recording measured values can be defined, see on page 810. - Page 813 ® Remote Control R&S Remote Commands in Spectrum Analyzer Mode CALCulate<n>:UNIT:POWer <Unit> This command selects the unit of the y-axis. The unit applies to all measurement windows. Suffix: <n> irrelevant Parameters: <Unit> DBM | V | A | W | DBPW | WATT | DBUV | DBMV | VOLT | DBUA | AMPere *RST: Example:...
- Page 814 ® Remote Control R&S Remote Commands in Spectrum Analyzer Mode Suffix: <n> window; For applications that do not have more than 1 measure- ment window, the suffix <n> is irrelevant. <t> irrelevant Parameters: <Mode> ABSolute absolute scaling of the y-axis RELative relative scaling of the y-axis *RST:...
- Page 815 ® Remote Control R&S Remote Commands in Spectrum Analyzer Mode Manual operation: "Ref Level Offset" on page 324 DISPlay[:WINDow<n>]:TRACe<t>:Y[:SCALe]:RPOSition <Position> This command defines the position of the reference level on the display grid.. Suffix: <n> Selects the measurement window. <t> irrelevant Parameters: <Position>...
-
Page 816: Analyzing Spectrum Measurements
® Remote Control R&S Remote Commands in Spectrum Analyzer Mode 16.5.3 Analyzing Spectrum Measurements ● Trace Configuration....................816 ● Spectrogram......................825 ● Limit Lines......................829 ● Markers......................... 830 16.5.3.1 Trace Configuration Commands to configure trace described elsewhere: ● on page 652 DISPlay[:WINDow<n>]:TRACe<t>:MODE Commands exclusive in spectrum mode .............. - Page 817 ® Remote Control R&S Remote Commands in Spectrum Analyzer Mode (TRACe1-TRACe5) Subtracts trace 5 from trace 1. (TRACe1-TRACe6) Subtracts trace 6 from trace 1. Example: CALC1:MATH (TRACe1 – TRACe2) Selects the subtraction of trace 2 from trace 1. Manual operation: "Trace Math"...
- Page 818 ® Remote Control R&S Remote Commands in Spectrum Analyzer Mode Parameters: <State> ON | OFF *RST: Example: CALC:MATH:STAT ON Switches on the trace mathematics. Manual operation: "Trace Math" on page 364 "Trace Math Off" on page 365 DISPlay[:WINDow<n>]:TRACe<t>:MODE:HCONtinuous <State> This command defines whether traces in Min Hold, Max Hold and Average mode (see on page 652) are reset after a parameter DISPlay[:WINDow<n>]:TRACe<t>:MODE is changed.
- Page 819 142 FORMat[:DATA] <Format> This command selects the data format for the data transmitted from the R&S ESR to the controlling computer. It is used for the transmission of trace data. The data format of trace data received by the instrument is automatically recognized, regardless of the format which is programmed.
- Page 820 ® Remote Control R&S Remote Commands in Spectrum Analyzer Mode MMEMory:STORe<n>:TRACe <Trace>, <FileName> This command stores the selected trace in the specified window in a file with ASCII for- mat. The file format is described in Chapter 11.3.1.6, "ASCII File Export Format", on page 369 The decimal separator (decimal point or comma) for floating-point numerals contained...
- Page 821 ® Remote Control R&S Remote Commands in Spectrum Analyzer Mode Example: SWE:CONT OFF Switching to single sweep mode. AVER:COUN 16 Sets the number of measurements to 16. AVER:STAT ON Switches on the calculation of average. INIT;*WAI Starts the measurement and waits for the end of the 16 sweeps. [SENSe:]AVERage<n>[:STATe<Trace>] <State>...
- Page 822 ® Remote Control R&S Remote Commands in Spectrum Analyzer Mode Manual operation: "Lin" on page 363 "Log" on page 363 "Power" on page 364 [SENSe:][WINDow:]DETector<trace>[:FUNCtion] <Function> This command selects the detector for the data acquisition in the selected trace. Suffix: <trace>...
- Page 823 TRACe<n>:DATA <Trace>, <Data> | <ResultType> This command queries current trace data and measurement results. If you use it as a setting command, it transfers trace data from an external source to the R&S ESR. The data format depends on FORMat[:DATA]. Parameters: <Trace>...
- Page 824 ® Remote Control R&S Remote Commands in Spectrum Analyzer Mode Table 16-23: Return values for TRACE1 to TRACE6 parameter The trace data consists of a list of power levels that have been measured. The number of power levels in the list depends on the currently selected number of sweep points. The unit depends on the measurement and on the unit you have currently set.
-
Page 825: Spectrogram
® Remote Control R&S Remote Commands in Spectrum Analyzer Mode TRACe<n>[:DATA]:X? <TraceNumber> This command reads the x-values of the selected trace. Suffix: <n> 1...4 window; For applications that have only one measurement screen, the suffix is irrelevant. Query parameters: <TraceNumber> TRACE1 | TRACE2 | TRACE3 | TRACE4 | TRACE5 | TRACE6 Trace number Example:... - Page 826 ® Remote Control R&S Remote Commands in Spectrum Analyzer Mode Example: CALC:SGR:COL GRAY Selects black and white color scheme. Manual operation: "Color Mapping" on page 376 CALCulate<n>:SGRam:CONT <State> This command determines whether the results of the last measurement are deleted before starting a new measurement in single sweep mode.
- Page 827 ® Remote Control R&S Remote Commands in Spectrum Analyzer Mode CALCulate<n>:SGRam:FRAMe:SELect <Frame> This command selects a specific frame for further analysis. The command is available only if no measurement is running or after a single sweep has ended. Suffix: <n> 1...4 Selects the measurement window.
- Page 828 ® Remote Control R&S Remote Commands in Spectrum Analyzer Mode Suffix: <n> 1...4 Selects the measurement window. Parameters: <State> ON | OFF *RST: Example: CALC:SGR ON Activates the Spectrogram result display. Manual operation: "Spectrogram (On Off)" on page 375 Configuring the Color Map Commands useful to work with markers in the spectrogram described elsewhere: ●...
-
Page 829: Limit Lines
® Remote Control R&S Remote Commands in Spectrum Analyzer Mode ● on page 626 CALCulate<n>:MARKer<m>:SGRam:Y:MINimum:BELow ● on page 627 CALCulate<n>:MARKer<m>:SGRam:Y:MINimum:NEXT ● on page 627 CALCulate<n>:MARKer<m>:SGRam:Y:MINimum[:PEAK] Using Deltamarkers Commands useful to work with markers in the spectrogram described elsewhere: ● on page 666 CALCulate<n>:DELTamarker<m>:MAXimum:LEFT ●... -
Page 830: Markers
® Remote Control R&S Remote Commands in Spectrum Analyzer Mode CALCulate<n>:TLINe<Line> <Time> This command defines the position of a time line. Suffix: <n> irrelevant <Line> 1 | 2 Selects the time line. Parameters: <Time> Range: 0 to 30000000000 *RST: (STATe to OFF) Default unit: s Example: CALC:TLIN 10ms... - Page 831 ® Remote Control R&S Remote Commands in Spectrum Analyzer Mode ● on page 657 CALCulate<n>:MARKer<m>:FUNCtion:CSTep ● on page 657 CALCulate<n>:MARKer<m>:FUNCtion:ZOOM ● on page 660 CALCulate<n>:MARKer<m>:MAXimum:LEFT ● on page 661 CALCulate<n>:MARKer<m>:MAXimum:NEXT ● on page 661 CALCulate<n>:MARKer<m>:MAXimum[:PEAK] ● on page 661 CALCulate<n>:MARKer<m>:MAXimum:RIGHt ●...
- Page 832 ® Remote Control R&S Remote Commands in Spectrum Analyzer Mode CALCulate<n>:MARKer<m>:LOEXclude <State> This command turns the local oscillator suppression during a peak search on or off. Suffix: <n> Selects the measurement window. <m> irrelevant Parameters: <State> ON | OFF *RST: Example: CALC:MARK:LOEX ON Manual operation:...
- Page 833 ® Remote Control R&S Remote Commands in Spectrum Analyzer Mode Suffix: <n> Selects the measurement window. <m> Selects the marker. Parameters: <State> ON | OFF *RST: Example: CALC:MARK:MIN:AUTO ON Activates the automatic minimum value search function for marker 1 at the end of each particular sweep. Manual operation: "Auto Max Peak/Auto Min Peak"...
- Page 834 ® Remote Control R&S Remote Commands in Spectrum Analyzer Mode *RST: POINts CALC:MARK:X:SSIZ STAN Example: Sets the measured value step size. Manual operation: "Stepsize Standard" on page 377 "Stepsize Sweep Points" on page 377 CALCulate<n>:MARKer<m>:Y:PERCent <Probability> This command positions the selected marker to the given probability. If you use the command in combination with a delta marker, that delta marker is turned into a normal marker.
- Page 835 ® Remote Control R&S Remote Commands in Spectrum Analyzer Mode Parameters: <State> ON | OFF *RST: Example: CALC:THR:STAT ON Switches on the threshold line. Manual operation: "Threshold" on page 176 "Search Lim Off" on page 177 DISPlay:MTABle <DisplayMode> This command turns the marker table on and off. Parameters: <DisplayMode>...
- Page 836 ® Remote Control R&S Remote Commands in Spectrum Analyzer Mode ● on page 671 CALCulate<n>:DELTamarker<m>:X:RELative? ● on page 671 CALCulate<n>:DELTamarker<m>:Y ................836 CALCulate<n>:DELTamarker<m>:MREF CALCulate<n>:DELTamarker<m>:MREF <RefMarkerNo> This command defines the reference marker for a delta marker other than marker 1. The reference may be another marker or the fixed reference. Suffix: <n>...
- Page 837 ® Remote Control R&S Remote Commands in Spectrum Analyzer Mode CALCulate<n>:DELTamarker<m>:FUNCtion:FIXed:RPOint:X <Reference> This command defines the horizontal position of the fixed delta marker reference point. The coordinates of the reference may be anywhere in the diagram. When measuring the phase noise, the command defines the frequency reference for delta marker 2.
- Page 838 ® Remote Control R&S Remote Commands in Spectrum Analyzer Mode Suffix: <n> Selects the measurement window. <m> Selects the marker. Parameters: <Offset> Level offset that is added to the display of all delta markers. *RST: 0 dB Example: CALC:DELT:FUNC:FIX:RPO:Y:OFFS 10dB Sets the level offset for the measurement with fixed reference value or the phase-noise measurement to 10 dB.
- Page 839 The frequency counter works for one marker only. If you perform a frequency count with another marker, the R&S ESR deactivates the frequency count of the first marker. To get a valid result, you have to perform a complete measurement with synchroniza- tion to the end of the measurement before reading out the result.
- Page 840 ® Remote Control R&S Remote Commands in Spectrum Analyzer Mode Return values: <Frequency> Frequency at the marker position. Example: INIT:CONT OFF Switches to single sweep mode. CALC:MARK ON Switches on marker 2. CALC:MARK:COUN ON Activates the frequency counter for marker 1. INIT;*WAI Starts a sweep and waits for the end.
- Page 841 "Noise Meas On/Off" on page 388 CALCulate<n>:MARKer<m>:FUNCtion:NOISe[:STATe] <State> This command turns the noise measurement for all markers on or off. If on, the R&S ESR measures the noise power density at the marker position. The result can be queried with CALCulate<n>:MARKer<m>:FUNCtion:NOISe: RESult.
- Page 842 ® Remote Control R&S Remote Commands in Spectrum Analyzer Mode Parameters: <State> ON | OFF *RST: Example: CALC:DELT:FUNC:PNO:AUTO ON Activates an automatic peak search for the reference marker in a phase-noise measurement. Manual operation: "Ph. Noise Auto Peak Search" on page 389 CALCulate<n>:DELTamarker<m>:FUNCtion:PNOise:RESult? This command queries the result of the phase noise measurement.
- Page 843 ® Remote Control R&S Remote Commands in Spectrum Analyzer Mode Parameters: <State> ON | OFF *RST: Example: CALC:DELT:FUNC:PNO ON Switches on the phase-noise measurement with all delta mark- ers. CALC:DELT:FUNC:FIX:RPO:X 128 MHZ Sets the frequency reference to 128 MHz. CALC:DELT:FUNC:FIX:RPO:Y 30 DBM Sets the reference level to +30 dBm Manual operation: "Phase Noise On/Off"...
- Page 844 ® Remote Control R&S Remote Commands in Spectrum Analyzer Mode Suffix: <n> Selects the measurement window. <m> Selects the marker. Parameters: <Duration> Range: 10 ms to 1000 s *RST: Marker demodulation = OFF Example: CALC:MARK:FUNC:DEM:HOLD 3s Manual operation: "Mkr Stop Time" on page 390 CALCulate<n>:MARKer<m>:FUNCtion:DEModulation:SELect <DemodMode>...
- Page 845 ® Remote Control R&S Remote Commands in Spectrum Analyzer Mode n dB Down Marker ............845 CALCulate<n>:MARKer<m>:FUNCtion:NDBDown ........845 CALCulate<n>:MARKer<m>:FUNCtion:NDBDown:FREQuency? ..........846 CALCulate<n>:MARKer<m>:FUNCtion:NDBDown:QFACtor ..........846 CALCulate<n>:MARKer<m>:FUNCtion:NDBDown:RESult? ..........847 CALCulate<n>:MARKer<m>:FUNCtion:NDBDown:STATe ..........847 CALCulate<n>:MARKer<m>:FUNCtion:NDBDown:TIME? CALCulate<n>:MARKer<m>:FUNCtion:NDBDown <Distance> This command defines the distance of the n dB down markers to the reference marker. The temporary markers T1 and T2 are positioned n dB below the active reference marker.
- Page 846 ® Remote Control R&S Remote Commands in Spectrum Analyzer Mode <frequency 2> absolute frequency of the n dB marker to the right of the refer- ence marker in Hz Example: INIT:CONT OFF Switches to single sweep mode. CALC:MARK:FUNC:NDBD ON Switches on the n dB down function. INIT;*WAI Starts a sweep and waits for the end.
- Page 847 ® Remote Control R&S Remote Commands in Spectrum Analyzer Mode Parameters: <Distance> The result depends on the span. In case of frequency domain measurements, the command returns the bandwidth between the two n dB down markers in Hz. In case of time domain measurements, the command returns the pulse width between the two n dB down markers in seconds.
- Page 848 ® Remote Control R&S Remote Commands in Spectrum Analyzer Mode <m> irrelevant Return values: <Time> <time 1> absolute position in time of the n dB marker to the left of the ref- erence marker in seconds <time 2> absolute position in time of the n dB marker to the right of the reference marker in seconds Example: INIT:CONT OFF...
- Page 849 ® Remote Control R&S Remote Commands in Spectrum Analyzer Mode Example: CALC:MARK:FUNC:FPE:ANN:LAB:STAT OFF Removes the peak labels from the diagram Manual operation: "Marker Number" on page 394 CALCulate<n>:MARKer<m>:FUNCtion:FPEaks:COUNt? This command queries the number of peaks that have been found during a peak search.
- Page 850 ® Remote Control R&S Remote Commands in Spectrum Analyzer Mode Suffix: <n> Selects the measurement window. <m> Selects the marker. Parameters: <NoMaxima> Range: 1 to 200 Example: INIT:CONT OFF Switches to single sweep mode INIT;*WAI Starts measurement and synchronizes to end CALC:MARK:TRAC 1 Sets marker 1 to trace 1 CALC:MARK:FUNC:FPE:SORT X...
- Page 851 ® Remote Control R&S Remote Commands in Spectrum Analyzer Mode Suffix: <n> Selects the measurement window. <m> Selects the marker. Parameters: <State> ON | OFF *RST: Example: CALC:MARK:FUNC:FPE:SEAR:AUTO ON Activates marker peak search CALCulate<n>:MARKer<m>:FUNCtion:FPEaks:SORT <SortMode> This command selects the order in which the results of a peak search are returned. Suffix: <n>...
- Page 852 ® Remote Control R&S Remote Commands in Spectrum Analyzer Mode The order depends on the sort order that has been set with CALCulate<n>: on page 851. MARKer<m>:FUNCtion:FPEaks:SORT The number of peaks on the number that has been set with CALCulate<n>: MARKer<m>:FUNCtion:FPEaks:COUNt?.
- Page 853 ® Remote Control R&S Remote Commands in Spectrum Analyzer Mode Example: CALC:MARK:FUNC:FPE:SORT Y Sets the sort mode to decreasing y values CALC:MARK:FUNC:FPE 3 Searches the 3 highest maxima for trace 1 CALC:MARK:FUNC:FPE:COUN? Queries the number of maxima found CALC:MARK:FUNC:FPE:Y? Queries the levels of the maxima found Usage: Query only Manual operation:...
- Page 854 ® Remote Control R&S Remote Commands in Spectrum Analyzer Mode Return values: <Power> Signal power over the marker bandwidth. Example: Activate the band power marker: CALC:MARK:FUNC:BPOW:STAT ON Select the density mode for the result: CALC:MARK:FUNC:BPOW:MODE DENS Query the result: CALC:MARK:FUNC:BPOW:RES? Response: 20dBm/Hz Usage:...
- Page 855 ® Remote Control R&S Remote Commands in Spectrum Analyzer Mode Example: CALC:MARK:FUNC:BPOW:STAT ON Manual operation: "Band Power On/Off" on page 394 CALCulate<n>:DELTamarker<m>:FUNCtion:BPOWer:MODE <Mode> This command selects the way the results for a band power delta marker are dis- played. Suffix: <n>...
-
Page 856: Remote Commands In I/Q Analyzer Mode
® Remote Control R&S Remote Commands in I/Q Analyzer Mode <m> irrelevant Parameters: <Span> Numeric value that defines the span in Hz. The maximum span depends on the marker position and R&S FSV model. *RST: 5% of current span Example: CALC:DELT:BPOW:SPAN 20 CALCulate<n>:DELTamarker<m>:FUNCtion:BPOWer[:STATe] <State>... - Page 857 ® Remote Control R&S Remote Commands in I/Q Analyzer Mode ..................864 TRACe<n>:IQ:DATA:MEMory? .....................865 TRACe<n>:IQ:EGATe ..................... 865 TRACe<n>:IQ:EGATe:GAP ..................866 TRACe<n>:IQ:EGATe:LENGth ................866 TRACe<n>:IQ:EGATe:NOFgateperiods ................... 866 TRACe<n>:IQ:EGATe:TYPE .......................867 TRACe<n>:IQ:EVAL ....................867 TRACe<n>:IQ[:STATe] ..................... 868 TRACe<n>:IQ:TPISample? CALCulate<n>:FORMat <Format> This command defines the display type of the IQ data. Suffix: <n>...
- Page 858 ® Remote Control R&S Remote Commands in I/Q Analyzer Mode Example: CALC4:MARK:SEAR IMAG Manual operation: "Search Settings" on page 439 DISPlay[:WINDow<n>]:TRACe<t>:Y[:SCALe]:RVALue <Value> The command defines the power value assigned to the reference position in the grid. Suffix: <n> irrelevant <t> irrelevant Parameters: <Value>...
- Page 859 TRACe<n>:IQ:SET NORM,<Placeholder>, <SampleRate>, <TriggerMode>, <TriggerSlope>, <PretriggerSamp>, <NumberSamples> This command defines the settings of the R&S ESR hardware for the measurement of I/Q data. This allows setting the sample rate, trigger conditions and the record length. If this command is omitted, the current instrument settings are used for the correspond- ing parameters.
- Page 860 ® Remote Control R&S Remote Commands in I/Q Analyzer Mode <TriggerSlope> POSitive | NEGative Used trigger slope. *RST: <PretriggerSamp> Defines the trigger offset in terms of pretrigger samples. Nega- tive values correspond to a trigger delay. This value also defines the interval between the trigger signal and the gate edge in samples.
- Page 861 ® Remote Control R&S Remote Commands in I/Q Analyzer Mode TRACe<n>:IQ:DATA This command starts a measurement with the settings defined via TRACe<n>:IQ:SET and returns the list of measurement results (I/Q samples) immediately after they are corrected in terms of frequency response. The number of measurement results depends on the settings defined with TRACe<n>:IQ:SET, the output format depends on the settings of the FORMat subsystem.
- Page 862 ® Remote Control R&S Remote Commands in I/Q Analyzer Mode Figure 16-5: IQ data formats Note: 512k corresponds to 524288 samples Suffix: <n> irrelevant Parameters: <Format> COMPatible | IQBLock | IQPair *RST: IQBL For maximum performance, the formats "Compatible" or "IQPair" should be used.
- Page 863 ® Remote Control R&S Remote Commands in I/Q Analyzer Mode TRACe<n>:IQ:AVERage:COUNt <NumberSets> This command defines the number of I/Q data sets that are to serve as a basis for averaging. Suffix: <n> irrelevant Parameters: <NumberSets> 0 to 32767 *RST: Example: TRAC:IQ ON Switches on acquisition of I/Q data.
- Page 864 ® Remote Control R&S Remote Commands in I/Q Analyzer Mode TRACe<n>:IQ:DATA:MEMory? <OffsetSamples>,<NoOfSamples> This command reads out previously acquired (and frequency response corrected) I/Q data from the memory. Furthermore, the offset related to the start of measurement and the number of I/Q samples are given. Thus, a previously acquired data set can be read out in smaller portions.
- Page 865 ® Remote Control R&S Remote Commands in I/Q Analyzer Mode Example: TRAC:IQ:STAT ON Enables acquisition of I/Q data TRAC:IQ:SET NORM,10MHz,32MHz,EXT,POS,100,4096 Measurement configuration: Sample Rate = 32 MHz Trigger Source = External Trigger Slope = Positive Pretrigger Samples = 100 Number of Samples = 4096 INIT;*WAI Starts measurement and wait for sync FORMat REAL,32...
- Page 866 ® Remote Control R&S Remote Commands in I/Q Analyzer Mode Parameters: <Samples> <numeric value> Max = MaxPreTriggerSamples * 128 MHz/sample rate pretrigger samples defined by TRACe<n>:IQ:SET; sample rate defined by TRACe<n>:IQ:SRATe) Range: 1...Max (samples) *RST: Example: TRAC:IQ:EGAT:GAP 2 TRACe<n>:IQ:EGATe:LENGth <GateLength> Defines the gate length in samples in edge mode.
- Page 867 TRACe<n>:IQ[:STATe] data evaluation mode to provide optimum performance for IQ-data acquisition. If you start the IQ Analyzer manually by selecting the "IQ Analyzer" mode in the R&S ESR, or use the command, the IQ data evaluation CALCulate<n>:FORMat mode is automatically activated.
-
Page 868: I/Q Gating
® Remote Control R&S Remote Commands in I/Q Analyzer Mode To switch trace display back on, use the command. TRACe<n>:IQ:EVAL Note: to enable the evaluation functions of the IQ Analyzer, you must also execute the command TRACe<n>:IQ:EVAL. Suffix: <n> irrelevant Parameters: <State>... -
Page 869: Remote Commands To Control The Tracking Generator
® Remote Control R&S Remote Commands to Control the Tracking Generator SCPI command: TRACE:IQ:EGATE:TYPE EDGE, see TRACe<n>:IQ:EGATe: on page 866 TYPE ● Level triggered recording After a trigger signal, all data is recorded in which the gate signal is set to 1, which means it has exceeded a level. - Page 870 ® Remote Control R&S Remote Commands to Control the Tracking Generator ..................871 [SENSe:]CORRection[:STATe] ....................872 SOURce<n>:AM:STATe ....................872 SOURce<n>:DM:STATe ..................... 873 SOURce<n>:FM:DEViation ....................873 SOURce<n>:FM:STATe ................... 874 SOURce<n>:FREQuency:OFFSet ............874 SOURce<n>:POWer[:LEVel][:IMMediate][:AMPLitude] ............. 874 SOURce<n>:POWer[:LEVel][:IMMediate]:OFFSet ....................875 SOURce<n>:POWer:MODE .................... 875 SOURce<n>:POWer:STARt .....................876 SOURce<n>:POWer:STOP OUTPut[:STATe] <State>...
- Page 871 ® Remote Control R&S Remote Commands to Control the Tracking Generator Example: INIT:CONT OFF Selects single sweep operation CORR:COLL THR;*WAI Starts the measurement of reference data using direct connec- tion between generator and device input and waits for the sweep end.
- Page 872 ® Remote Control R&S Remote Commands to Control the Tracking Generator The command is available if a tracking generator is installed and has been turned on. Parameters: <State> ON | OFF *RST: Example: CORR ON Activates normalization. Usage: SCPI confirmed Manual operation: "Normalize"...
- Page 873 ® Remote Control R&S Remote Commands to Control the Tracking Generator Example: SOUR2:DM:STAT ON Switches on the external I/Q modulation of the tracking genera- tor for screen B. Usage: SCPI confirmed Manual operation: "External I/Q" on page 449 "Modulation OFF" on page 449 "External IQ"...
- Page 874 ® Remote Control R&S Remote Commands to Control the Tracking Generator Usage: SCPI confirmed Manual operation: "External FM" on page 449 "Modulation OFF" on page 449 SOURce<n>:FREQuency:OFFSet <Offset> This command defines a frequency offset of the tracking generator. Frequency-con- verting DUTs can be measured with this setting. External I/Q modulation is switched off, if active.
- Page 875 SWEep Power sweep is on. If the power sweep is on, the R&S ESR enters the time domain (span = 0 Hz). During the sweep time, the power at the internal tracking generator is changed linearly from start power to stop power.
-
Page 876: Controlling The External Tracking Generator
® Remote Control R&S Remote Commands to Control the Tracking Generator Usage: SCPI confirmed Manual operation: "Power Sweep Start" on page 450 SOURce<n>:POWer:STOP <Power> This command defines the stop power of the power sweep. The stop value can be smaller than the start value. Suffix: <n>... - Page 877 ® Remote Control R&S Remote Commands to Control the Tracking Generator Parameters: <Name> '<name> Example: CORR:TRAN:GEN 'SMU01' Creates the transducer file C:\r_s\instr\trd\SMU01.trd. Manual operation: "Save As Trd Factor" on page 449 SOURce<n>:EXTernal<generator>:FREQuency <Frequency> This command defines a fixed source frequency for the external tracking generator. This command is only valid for the External Tracking Generator option (R&S FSV-B10).
- Page 878 ® Remote Control R&S Remote Commands to Control the Tracking Generator SOURce<n>:EXTernal<generator>:FREQuency[:FACTor]:DENominator <Value> This command defines the denominator of the factor with which the analyzer frequency is multiplied in order to obtain the transmit frequency of the selected generator. This command is only valid for the External Tracking Generator option (R&S FSV-B10). Select the multiplication factor such that the frequency range of the generator is not exceeded if the following formula is applied to the start and stop frequency of the ana- lyzer:...
- Page 879 ® Remote Control R&S Remote Commands to Control the Tracking Generator <generator> 1 | 2 tracking generator For Noise Figure measurements (K30): 1 only Parameters: <Value> <numeric value> *RST: Example: SOUR:EXT:FREQ:NUM 4" "SOUR:EXT:FREQ:DEN 3" Sets a multiplication factor of 4/3, i.e. the transmit frequency of the generator is 4/3 times the analyzer frequency.
- Page 880 ® Remote Control R&S Remote Commands to Control the Tracking Generator Manual operation: "Generator Frequency (Numerator/Denominator/Offset)" on page 459 SOURce<n>:EXTernal<generator>:FREQuency:SWEep[:STATe] <State> This command activates or deactivates the frequency sweep for the selected genera- tor. This command is requires the optional External Tracking Generator. Suffix: <n>...
- Page 881 ® Remote Control R&S Remote Commands to Control the Tracking Generator Suffix: <n> irrelevant <generator> 1 | 2 tracking generator For Noise Figure measurements (K30): 1 only Parameters: <Source> INTernal the internal reference is used EXTernal the external reference is used; if none is available, an error flag is displayed in the status bar EAUTo the external reference is used as long as it is available, then the...
- Page 882 ® Remote Control R&S Remote Commands to Control the Tracking Generator Manual operation: "Source RF Internal (On/ Off)" on page 447 SYSTem:COMMunicate:GPIB:RDEVice:GENerator<generator>:ADDRess <Number> Changes the IEC/IEEE-bus address of the external tracking generator. This command is only available if the R&S FSV-B10 option (External Tracking Genera- tor) is installed.
- Page 883 Chapter 13.2.1, "Overview of Genera- tors Supported by the R&S ESR", on page 452. If no external generator type is currently configured, the query returns "NONE". This command is only available if the R&S FSV-B10 option (External Tracking Genera- tor) is installed.
-
Page 884: Common Commands
The headers of these commands consist of "*" followed by three letters. Many common commands are related to the Status Reporting System. Available common commands: ...........................884 *CAL? ..........................885 *CLS ..........................885 *ESE ...........................885 *ESR? ..........................885 *IDN? ..........................885 *IST? ..........................886 *OPC ...........................886 *OPT? ..........................886 *PCB .......................... - Page 885 *CLS Clear status Sets the status byte (STB), the standard event register (ESR) and the EVENt part of the QUEStionable and the OPERation registers to zero. The command does not alter the mask and transition parts of the registers. It clears the output buffer.
- Page 886 ® Remote Control R&S Common commands *OPC Operation complete Sets bit 0 in the event status register when all preceding commands have been execu- ted. This bit can be used to initiate a service request. The query writes a "1" into the output buffer when all preceding commands have been executed, which is useful for command synchronization.
- Page 887 ® Remote Control R&S Common commands The contents of the status registers are preserved. Resets the status registers. *RST Reset Sets the instrument to a defined default status. The default settings are indicated in the description of commands. The command is equivalent to SYSTem:PRESet. Usage: Setting only *SRE <Contents>...
-
Page 888: System Configuration
● Coupling Parameters.................... 896 ● Controlling In- and Ouputs..................900 ● Configuring the Reference Frequency..............903 ● Calibrating the R&S ESR..................904 ● Using Service Functions..................907 16.9.1 General System Configuration ............... 889 SYSTem:APPLication:SRECovery[:STATe] ....................... 889 SYSTem:CLOGging ..................... 889 SYSTem:COMPatible ....................890... - Page 889 ® Remote Control R&S System Configuration .................... 892 SYSTem:SPEaker:VOLume ....................... 892 SYSTem:TIME ....................892 SYSTem:TIME:TSTamp? ......................892 SYSTem:VERSion? ....................893 SYSTem:DISPlay:FPANel ...................... 893 SYSTem:DEVice:ID? ......................893 SYSTem:DATE SYSTem:APPLication:SRECovery[:STATe] <State> Controls instrument behavior when switching between measurement applications, e.g. from "Spectrum" to "Analog Demod" and back. If activated, the current instrument settings are stored when you switch to a different application.
- Page 890 495 SYSTem:FORMat:IDENt <Format> This command defines the response format to the on page 885 command. This *IDN? function is intended for re-use of existing control programs together with the R&S ESR. Parameters: <Format> FSL | LEGacy | NEW LEGacy Format is compatible to the R&S FSP/FSU/FSQ family...
- Page 891 ® Remote Control R&S System Configuration *RST: not reset! SYST:FORM:IDEN LEG Example: Adapts the return value of *IDN? to the R&S FSP/FSU/FSQ fam- ily. Manual operation: "*IDN Format Leg./New" on page 488 SYSTem:KLOCk <State> This command activates the local lockout (remote control) or returns to the local mode. Parameters: <State>...
- Page 892 ® Remote Control R&S System Configuration SYSTem:SHUTdown This command shuts down the instrument. Usage: Event SYSTem:SPEaker:VOLume <Volume> This command defines the volume of the built-in loudspeaker for demodulated signals. Parameters: <Volume> Range: 0 to 1 *RST: Example: SYST:SPE:VOL 0 Switches the loudspeaker to mute. SYSTem:TIME <Time>...
-
Page 893: Checking The System Configuration
Parameters: <State> ON | OFF *RST: Example: SYST:DISP:FPAN ON Manual operation: "Soft Frontpanel" on page 489 SYSTem:DEVice:ID? Returns the unique ID of the R&S ESR instrument. Example: SYST:DEV:ID? 1307.9002K07-100123-aZ Usage: Query only SCPI confirmed Manual operation: "Versions+Options" on page 494 SYSTem:DATE <Date>... - Page 894 ® Remote Control R&S System Configuration .................... 895 SYSTem:ERRor:CLEar:ALL ....................896 SYSTem:ERRor:LIST? ....................896 SYSTem:ERRor[:NEXT]? DIAGnostic<n>:SERVice:BIOSinfo? This command queries the CPU board BIOS version. Suffix: <n> irrelevant Return values: <Version> ASCII string containing the BIOS version, e.g. 47.11. Example: DIAG:SERV:BIOS? Returns the BIOS version. Usage: Query only DIAGnostic<n>:SERVice:HWINfo?
- Page 895 Resets the response to the *IDN? query to the default value, e.g. after a user string was defined using the ID String User softkey. Example: SYST:IDEN:FACT *IDN? Response: Rohde&Schwarz,R&S ESR-7,1307.9002K07/101768, 1.05 Usage: Event SCPI confirmed Manual operation: "ID String Factory" on page 484 SYSTem:IDENtify[:STRing] <String>...
-
Page 896: Coupling Parameters
® Remote Control R&S System Configuration SYSTem:ERRor:LIST? This command reads all system messages and returns a list of comma separated strings. Each string corresponds to an entry in the table SYSTEM MESSAGES. If the error list is empty, an empty string " is returned. This command is a query and therefore has no *RST value. - Page 897 ® Remote Control R&S System Configuration *RST: INST:COUP:ATT ALL Example: Synchronizes the attenuation. INSTrument:COUPle:BANDwidth <State> This command turns synchronization of the resolution bandwidth (and filter type) between measurement channels on and off. Parameters: <State> ALL | 1 Turns on synchronization. NONE | 0 Turns on synchronization.
- Page 898 ® Remote Control R&S System Configuration INSTrument:COUPle:GAIN <State> This command turns synchronization of the preamplifier configuration between mea- surement channels on and off. Parameters: <State> ALL | 1 Turns on synchronization. NONE | 0 Turns off synchronization. *RST: NONE Example: INST:COUP:GAIN ALL Synchronizes the preamplifier configuration.
- Page 899 ® Remote Control R&S System Configuration INSTrument:COUPle:PRESel <State> This command turns synchronization of the preselector state between measurement channels on and off. Note that it is not possible to turn off the preselector in receiver mode. Thus, the prese- lector is always turned on when you enter receiver mode. Parameters: <State>...
-
Page 900: Controlling In- And Ouputs
354 INPut<ip>:UPORt:STATe <State> This command toggles the control lines of the user ports for the AUX PORT connector. This 9-pole SUB-D male connector is located on the rear panel of the R&S ESR. Suffix: <ip> 1 | 2... - Page 901 ® Remote Control R&S System Configuration OFF | 0 User port is switched to OUTPut *RST: Manual operation: "User Port" on page 157 INPut<ip>:UPORt[:VALue] This command queries the control lines of the user ports. For details see on page 902. OUTPut<up>:UPORt[:VALue] Suffix: <ip>...
- Page 902 "Trigger Out" on page 354 OUTPut<up>:UPORt:STATe <State> This command toggles the control lines of the user ports for the AUX PORT connector. This 9-pole SUB-D male connector is located on the rear panel of the R&S ESR. Suffix: <up> irrelevant Parameters: <State>...
-
Page 903: Configuring The Reference Frequency
® Remote Control R&S System Configuration 16.9.5 Configuring the Reference Frequency ..............903 [SENSe:]ROSCillator:EXTernal:FREQuency ..................903 [SENSe:]ROSCillator:SOURce ................904 [SENSe:]ROSCillator:SOURce:EAUTo? [SENSe:]ROSCillator:EXTernal:FREQuency <Frequency> This command defines the frequency of the external reference oscillator. If the external reference oscillator is selected, the reference signal must be connected to the rear panel of the instrument. -
Page 904: Calibrating The R&S Esr
Return values: <Reference> internal reference external reference Example: SENS:ROSC:SOUR:EAUT? Queries the currently available reference type. Usage: Query only 16.9.6 Calibrating the R&S ESR ......................904 CALibration:ABORt ......................904 CALibration[:ALL]? .......................905 CALibration:RESult? ......................905 CALibration:STATe ............905 DIAGnostic<n>:SERVice:INPut:PULSed:CFRequency... - Page 905 ® Remote Control R&S System Configuration Return values: <CalibrationState> The command returns a '0' if calibration was successful. Example: *CLS Resets the status management. *SRE 16 Enables MAV bit in the Service Request Enable Register. *CAL? Starts the correction data recording, and then a service request is generated.
- Page 906 <Frequency> Possible frequencies of the calibration signal are fix. If you define a frequency that is not available, the R&S ESR uses the next available frequency. Example: a frequency of 20 MHz is rounded up to the next available frequency (21.33 MHz).
-
Page 907: Using Service Functions
® Remote Control R&S System Configuration DIAGnostic<n>:SERVice:STESt:RESult? This command queries the self test results. Suffix: <n> irrelevant Parameters: <Results> String of data containing the results. The rows of the self test result table are separated by commas. Example: DIAG:SERV:STES:RES? would return, e.g.: "Total Selftest Status: PASSED", "Date (dd/mm/yyyy): 09/07/2004 TIME: 16:24:54", "Runtime: 00:06", "... - Page 908 ® Remote Control R&S System Configuration The ID of the service function is made up out of five numbers, separated by a point. • function group number • board number • function number • parameter 1 (see the Service Manual) •...
-
Page 909: Data Management
® Remote Control R&S Data Management Usage: Event SCPI confirmed Manual operation: "Reset Password" on page 497 SYSTem:PASSword[:CENable] <Password> This command enables access to the service functions by means of the password. Parameters: <Password> <password> Example: SYST:PASS XXXX Usage: Event SCPI confirmed Manual operation: "Password"... - Page 910 ® Remote Control R&S Data Management Query parameters: <Path> <path> DOS Path name The path name should be conform to DOS conventions and may also include the drive name. According to DOS convention, wild- card characters can be entered in order to query e.g. a list of all files of a certain type.
- Page 911 ® Remote Control R&S Data Management Example: MMEM:CAT:LONG? 'C:\R_S\Instr\user Returns all files in C:\R_S\Instr\user: 1776,3331993600, "autolog.txt,ASC,1520", "autologin.reg,BIN,144", "no_autologin.reg,BIN, 112" Query for the current directory: MMEM:CDIR? Response: C:\R_S\Instr\user MMEM:CAT:LONG? Returns all files in C:\R_S\Instr\user. Usage: Query only SCPI confirmed MMEMory:CDIRectory <Directory> This command changes the current directory.
- Page 912 ® Remote Control R&S Data Management MMEMory:COPY <FileSource>,<FileDestination> This command copies the files indicated in <file_source> to the destination directory indicated with <file_destination> or to the destination file indicated by <file_destination> if <file_source> is just a file. Parameters: <FileSource>,<FileDestination> <file_source>,<file_destination> = <file_name> <file_source>,<file_destination>...
- Page 913 ® Remote Control R&S Data Management MMEMory:DELete <FileName> This command deletes the indicated files. Parameters: <FileName> <file_name> = DOS file name The indication of the file name contains the path and, optionally, the drive name. Indication of the path complies with DOS con- ventions.
- Page 914 ® Remote Control R&S Data Management Manual operation: "Rename" on page 505 MMEMory:MSIS <Device> This command changes to the drive indicated. The drive may be the internal hard disk Parameters: <Device> <device> = A: | C: … Z: *RST: n.a. The path name complies with DOS conventions.
-
Page 915: Saving And Restoring Customized Data
® Remote Control R&S Data Management 16.10.2 Saving and Restoring Customized Data .....................915 MMEMory:CLEar:ALL ....................915 MMEMory:CLEar:STATe 1, ....................915 MMEMory:LOAD:AUTO ....................916 MMEMory:LOAD:STATe ..................917 MMEMory:STORe:IQ:COMM ................... 917 MMEMory:STORe:IQ:STATe ..................918 MMEMory:STORe<n>:STATe .................918 MMEMory:STORe<n>:STATe:NEXT MMEMory:CLEar:ALL This command deletes all instrument configuration files in the current directory. You can select the directory with on page 911. - Page 916 ® Remote Control R&S Data Management 1,'<file_name>' activates the startup recall function and defines the settings file to be loaded with <file_name> DOS file name with or without extension The file name includes indication of the path and may also include the drive name.
- Page 917 Remote Control R&S Data Management Example: MMEM:SEL:ALL //Save all items (User Settings, All Traces, All Limit Lines) from the R&S ESR. MMEM:LOAD:STAT 1,'C:\R_S\Instr\user\TEST01' //Reloads all items In the "Recall" dialog, select only "User Settings" and "All Limit Lines". MMEM:LOAD:STAT 1,'C:\R_S\Instr\user\TEST01' //Reloads user settings and all limit lines.
- Page 918 ® Remote Control R&S Data Management Manual operation: "IQ Export" on page 504 MMEMory:STORe<n>:STATe <State> This command stores the current device settings in a *.dfl file. Suffix: <n> irrelevant Parameters: <State> 1,<file_name> with <file_name> DOS file name with or without extension The file name includes the indication of the path and may also include the drive name.
-
Page 919: Using Transducers
® Remote Control R&S Using Transducers 16.11 Using Transducers Before making any changes to a transducer factor or set, you have to select one by name with [SENSe:]CORRection:TRANsducer:SELect. Compared to manual configuration of transducers, any changes made to a transducer factor or set via remote control are saved after the corresponding command has been sent. - Page 920 ® Remote Control R&S Using Transducers ..............922 [SENSe:]CORRection:TRANsducer:SELect ..............923 [SENSe:]CORRection:TRANsducer[:STATe] .................923 [SENSe:]CORRection:TRANsducer:UNIT ................ 923 [SENSe:]CORRection:TRANsducer:VIEW ................. 923 [SENSe:]CORRection:TSET:BREak ................924 [SENSe:]CORRection:TSET:CATalog? ................924 [SENSe:]CORRection:TSET:COMMent ................924 [SENSe:]CORRection:TSET:DELete ..............925 [SENSe:]CORRection:TSET:RANGe<range> .................925 [SENSe:]CORRection:TSET:SELect ................925 [SENSe:]CORRection:TSET[:STATe] ................... 926 [SENSe:]CORRection:TSET:UNIT [SENSe:]CORRection:TRANsducer:ADJust:RLEVel[:STATe] <State> This command turns automatic adjustment of the reference level regarding the trans- ducer factor characteristics on and off.
- Page 921 ® Remote Control R&S Using Transducers [SENSe:]CORRection:TRANsducer:CATalog? This command queries all transducer factors stored on the R&S ESR. Parameters: <FileInformation> String containg the file information. '<NameFileN>,<SizeFileN>' <NameFileN> Name of the file. <SizeFileN> Size of the file in bytes. Return values: <UsedDiskSpace>...
- Page 922 This command creates or selects a transducer factor. Parameters: <FileName> String containing the name of the transducer factor. If the name does not exist yet, the R&S ESR creates a trans- ducer factor by that name. Example: "Designing a transducer factor"...
- Page 923 ® Remote Control R&S Using Transducers [SENSe:]CORRection:TRANsducer[:STATe] <State> This command turns a transducer factor on and off. Before you can use the command, you have to select a transducer factor with [SENSe:]CORRection:TRANsducer:SELect. You can turn on up to 8 transducer factors at the same time. Parameters: <State>...
- Page 924 919. Manual operation: "Managing transducer sets" on page 480 [SENSe:]CORRection:TSET:CATalog? This command queries all transducer sets stored on the R&S ESR. Return values: <UsedDiskSpace> Size of all available files containing transducer factors in byte. <FreeDiskSpace> Remaining disk space in bytes.
- Page 925 This command creates or selects a transducer set. Parameters: <FileName> String containing the name of the transducer set. If the name does not exist yet, the R&S ESR creates a trans- ducer set by that name. Example: "Managing a transducer set"...
-
Page 926: Documentation
® Remote Control R&S Documentation Before you can use the command, you have to select a transducer set with [SENSe: ]CORRection:TSET:SELect. Parameters: <State> ON | OFF *RST: Example: "Managing a transducer set" on page 919. Manual operation: "Using transducer factors or transducer sets" on page 478 [SENSe:]CORRection:TSET:UNIT <Unit>... - Page 927 ® Remote Control R&S Documentation Suffix Description CMAP11 Marker info text CMAP12 Limit lines CMAP13 Limit and margin check 'PASS' CMAP14 Limit and margin check 'FAIL' CMAP15* Softkey text CMAP16* Softkey background CMAP17* Selected field text CMAP18* Selected field background CMAP19* Softkey 3D bright part CMAP20*...
- Page 928 ® Remote Control R&S Documentation Suffix Description CMAP44 Bargraph Quasipeak CMAP45 Bargraph Average CMAP46 Bargraph RMS CMAP47 Final measurement CMAP48 Bargraph CISPR Average CMAP49 Bargraph RMS Average * these settings can only be defined via the theme, see Chapter 16.14, "Display Configuration", on page 946, and are thus ignored in the SCPI command ......................
- Page 929 ® Remote Control R&S Documentation current screen colors with the background in white and the grid in black. optimized color set user defined color set current screen colors without any changes (setting for hardcop- ies) Example: HCOP:CMAP:DEF2 Selects the optimized color set for the color settings of a printout or a hardcopy.
- Page 930 ® Remote Control R&S Documentation HCOPy:CMAP<item>:PDEFined <Color> This command selects a predefined color for various screen elements in print jobs. The values set are not changed by *RST. Suffix: <item> Selects the display item. For more information see Table 16-25. Parameters: <Color>...
- Page 931 ® Remote Control R&S Documentation HCOPy:DEVice:COLor <State> This command turns color printing on and off. Parameters: <State> ON | OFF Color output Black and white output *RST: Example: HCOP:DEV:COL ON Usage: SCPI confirmed Manual operation: "Color (On/Off)" on page 493 HCOPy:DEVice:LANGuage<1|2>...
- Page 932 ® Remote Control R&S Documentation Manual operation: "Device Setup" on page 515 "Configuring and Printing the Test Report" on page 522 HCOPy:ITEM:ALL This command includes all screen elements in the printout. The screen elements include comments, title, time and date. Example: HCOP:ITEM:ALL Usage:...
- Page 933 ® Remote Control R&S Documentation HCOPy:TDSTamp:STATe<1|2> <State> This command includes or excludes the time and date in the printout. The suffix <1|2> selects the printing device. Parameters: <State> ON | OFF *RST: Example: HCOP:TDST:STAT OFF Manual operation: "Device Setup" on page 515 HCOPy[:IMMediate<1|2>] This command initiates a print job.
- Page 934 ® Remote Control R&S Documentation If you are printing to a file, the file name depends on MMEMory:NAME. This command adds a consecutive number to the file name. The suffix <1|2> selects the printing device. Example: HCOP:DEV:LANG BMP Selects the data format. HCOP:DEST 'MMEM' Directs the hardcopy to a file.
-
Page 935: Working With Test Reports
® Remote Control R&S Working with Test Reports Usage: Query only Manual operation: "Device Setup" on page 515 SYSTem:COMMunicate:PRINter:SELect <1|2> <PrinterName> This command selects one of the printers configured under Windows operating sys- tem, including the associated output destination. The specified printer name must be a string (entered in quotes) as returned by the commands SYSTem:COMMunicate:PRINter:ENUMerate:FIRSt? SYSTem:COMMunicate:PRINter:ENUMerate[:NEXT]? - Page 936 ® Remote Control R&S Working with Test Reports It also restores the default names of the header titles (in the "Header" tab of the "Test Report Settings" dialog box). Example: HCOP:TREP:ITEM:DEF Restores the default test report configuration. Usage: Event HCOPy:TREPort:ITEM:SELect '<Item>,<Item>,<Item>,...' This command defines the type of information that a test report is made up out of.
- Page 937 ® Remote Control R&S Working with Test Reports Table 16-27: Available <items> in spectrum application <Item> Description Default DIAGram Screenshot of the scan results. HEADer Header made up of several lines of information that is (by default) displayed on each page of the test report. PAGecount Page numbers.
-
Page 938: Designing The Header Of The Test Report
® Remote Control R&S Working with Test Reports 16.13.1.2 Designing the Header of the Test Report Commands useful to design the test report header described elsewhere: ● on page 935 HCOPy:TREPort:ITEM:DEFault ............938 HCOPy:TREPort:ITEM:HEADer:LINE<line>:CONTrol ............938 HCOPy:TREPort:ITEM:HEADer:LINE<line>:TEXT ............939 HCOPy:TREPort:ITEM:HEADer:LINE<line>:TITLe .................. - Page 939 ® Remote Control R&S Working with Test Reports to select the condition HCOPy:TREPort:ITEM:HEADer:LINE<line>:CONTrol under which each item is shown. Suffix: <line> 1...7 Selects the header line. Parameters: <Description> String containing the description of one of the value fields. By default, the value fields of the items are empty. Example: HCOP:TREP:ITEM:HEAD:LINE3:TITL 'Device under Test'...
-
Page 940: Defining The Contents Of The Title Page
® Remote Control R&S Working with Test Reports HCOPy:TREPort:ITEM:LOGO <FileName> This command selects a graphic (for example a company logo) that is shown at the top of each page in the test report. on page 940 to select the conditions HCOPy:TREPort:ITEM:LOGO:CONTrol under which the picture is shown. -
Page 941: Managing Templates
® Remote Control R&S Working with Test Reports Example: HCOP:TREP:DESC 'A short summary of the test report.' Adds a description to the test report. Manual operation: "Defining the Contents of the Title Page" on page 520 HCOPy:TREPort:PAGesize <Size> This command selects the size of the test report document. Parameters: <Size>... -
Page 942: Creating A Test Report
® Remote Control R&S Working with Test Reports Usage: Query only HCOPy:TREPort:ITEM:TEMPlate:DELete <Template> This command deletes a test report template. Parameters: <Template> String containing the name of the template. Example: HCOP:TREP:ITEM:TEMP:DEL 'myTemplate' Deletes a test report template. Usage: Event HCOPy:TREPort:ITEM:TEMPlate:LOAD <Template> This command loads a test report template. -
Page 943: Adding And Removing Datasets
® Remote Control R&S Working with Test Reports ● on page 914 MMEMory:NAME .......................943 HCOPy:MODE HCOPy:MODE <Mode> Selects the output of the command. HCOPy[:IMMediate<1|2>] Parameters: <Mode> SCReen HCOPy:IMMediate prints the current screen contents. REPort HCOPy:IMMediate generates a measurement report. *RST: SCReen Example: HCOP:MODE REPort... -
Page 944: Selecting Datasets For The Report
® Remote Control R&S Working with Test Reports The R&S ESR saves the data selected with HCOPy:TREPort:ITEM:SELect on page 936. To save the report, use on page 933. HCOPy[:IMMediate<1|2>] Example: HCOP:TREP:NEW Creates a dataset for a new test report. Usage:... -
Page 945: Deprecated Commands (Test Report)
® Remote Control R&S Working with Test Reports Parameters: <Dataset> Index number of the dataset as shown in the "Test Report Con- tent Selection" dialog box. If the index number is greater than the number of available data- sets, the command does nothing. <State>... -
Page 946: Display Configuration
® Remote Control R&S Display Configuration R&S ESU), but it is strongly recommended to use the command system in the way it is meant to be used in the R&S ESR. Legacy command Replaced by Comment HCOPy:TREPort:ITEM:HEADer: HCOPy:TREPort:ITEM:SELect Items now selected by the command parameter. - Page 947 ® Remote Control R&S Display Configuration ................952 DISPlay[:WINDow<n>]:TEXT[:DATA] ...................953 DISPlay[:WINDow<n>]:TIME ................953 DISPlay[:WINDow<n>]:TIME:FORMat .......................953 INITiate<n>:DISPlay DISPlay:ANNotation:FREQuency <State> This command switches the x-axis annotation on or off. Parameters: <State> ON | OFF *RST: Example: DISP:ANN:FREQ OFF Usage: SCPI confirmed Manual operation: "Annotation (On/Off)"...
- Page 948 ® Remote Control R&S Display Configuration BRIGHTNESS The value range is 0 to 1 for all parameters. Example: DISP:CMAP2:HSL 0.3,0.8,1.0 Changes the grid color. Usage: SCPI confirmed Manual operation: "Screen Colors" on page 491 "Select Object" on page 491 "User Defined Colors" on page 492 DISPlay:CMAP<item>:PDEFined <Color>...
- Page 949 ® Remote Control R&S Display Configuration Parameters: <State> ON | OFF *RST: Example: DISP:LOGO OFF Manual operation: "Print Logo (On/Off)" on page 490 DISPlay:PSAVe:HOLDoff <Minutes> This command sets the holdoff time for the power-save mode of the display. The avail- able value range is 1 to 60 minutes, the resolution 1 minute.
- Page 950 ® Remote Control R&S Display Configuration DISPlay:SKEYs[:STATe] <State> This command turns the softkey bar in the display on and off. Parameters: <State> ON | OFF *RST: Example: DISP:SKEY OFF DISPlay:TBAR[STATe] <State> This command turns the toolbar in the display on or off. Parameters: <State>...
- Page 951 ® Remote Control R&S Display Configuration Touch screen is deactivated for entire screen FRAMe Touch screen is deactivated for the diagram area of the screen, but active for the surrounding Softkeys, toolbars and menus. *RST: Example: DISP:TOUC:STAT ON DISPlay[:WINDow<n>][:SUBWindow<m>]:SIZE <Size> This command configures the measurement display.
- Page 952 ® Remote Control R&S Display Configuration DISPlay[:WINDow<n>][:SUBWindow<m>]:SELect This command selects which window (screen) is active for applications with more than one measurement window. For measurements with additional subwindows (e.g. SEM, ACLR), the subwindow can also be selected. Suffix: <n> 1...4 window;...
- Page 953 ® Remote Control R&S Display Configuration DISPlay[:WINDow<n>]:TIME <State> This command turns the display of date and time on and off. Suffix: <n> irrelevant Parameters: <State> ON | OFF *RST: Example: DISP:TIME ON Manual operation: "Screen Title (On/Off)" on page 490 "Time+Date (On/Off)"...
-
Page 954: Selecting Items To Store And Restore
® Remote Control R&S Display Configuration 16.14.2 Selecting Items to Store and Restore ..................954 MMEMory:SELect[:ITEM]:ALL ................... 954 MMEMory:SELect[:ITEM]:DEFault ................954 MMEMory:SELect[:ITEM]:HWSettings ................955 MMEMory:SELect[:ITEM]:LINes:ALL ..................955 MMEMory:SELect[:ITEM]:NONE ..................955 MMEMory:SEL[:ITEM]:SGRam ............... 955 MMEMory:SELect[:ITEM]:TRACe[:ACTive] ..............956 MMEMory:SELect[:ITEM]:TRANsducer:ALL ..................... 956 MMEMory:USER<Softkey> MMEMory:SELect[:ITEM]:ALL This command includes all data subsets in the list of device settings to be stored/ loaded. - Page 955 ® Remote Control R&S Display Configuration Example: MMEM:SEL:HWS ON Manual operation: "Select Items" on page 501 MMEMory:SELect[:ITEM]:LINes:ALL <State> This command includes all limit lines (activated and de-activated) in the settings file to be stored/loaded. Parameters: <State> ON | OFF *RST: Example: MMEM:SEL:LIN:ALL ON Manual operation:...
-
Page 956: Network Connection
® Remote Control R&S Network Connection MMEMory:SELect[:ITEM]:TRANsducer:ALL <State> This command includes all transducer factors and sets in the settings file to be stored/ loaded. Parameters: <State> ON | OFF *RST: Example: MMEM:SEL:TRAN:ALL ON Manual operation: "Select Items" on page 501 MMEMory:USER<Softkey>... - Page 957 ® Remote Control R&S Network Connection .................. 958 MMEMory:NETWork:USEDdrives? ............... 958 SYSTem:COMMunicate:GPIB[:SELF]:ADDRess ............958 SYSTem:COMMunicate:GPIB[:SELF]:RTERminator ......................959 SYSTem:LXI:INFo? ....................959 SYSTem:LXI:LANReset ..................... 959 SYSTem:LXI:MDEScription ....................960 SYSTem:LXI:PASSword MMEMory:NETWork:DISConnect <Drive> This command disconnects the selected drive. Parameters: <Drive> Example: MMEM:NETW:DISC 'T:' Disconnects network drive T: Usage: Event Manual operation:...
- Page 958 ® Remote Control R&S Network Connection MMEMory:NETWork:UNUSeddrives? This command lists all unused network drive names. This command is only a query and therefore has no *RST value. Example: MMEM:NETW:UNUS? Lists all unused network drive names. Usage: Query only Manual operation: "Map Network Drive"...
- Page 959 ® Remote Control R&S Network Connection Output of binary data from the instrument to the control computer does not require such a terminator change. Parameters: <Terminator> LFEOI | EOI *RST: (no influence on this parameter, factory default LFEOI) Example: SYST:COMM:GPIB:RTER EOI Manual operation: "GPIB Terminator LFEOI/EOI"...
-
Page 960: Emulating Hp Instruments
® Remote Control R&S Network Connection SYSTem:LXI:PASSword <Password> This command shows or changes the LXI password. Only user accounts with administrator rights are able to use LXI functionality. Parameters: <Password> <password> Example: SYST:LXI:PASS Manual operation: "Password" on page 483 16.15.2 Emulating HP Instruments .................... - Page 961 ® Remote Control R&S Network Connection Example: Define the system language: SYST:LANG '8563E' Query the revision: REV? Response: 920528 Set the response to 'NewRevision': SYST:REV:STR 'NewRevision' Query the response: SYST:REV:STR? Response: NewRevision Manual operation: "REV String User" on page 487 SYSTem:RSW <State>...
- Page 962 ® Remote Control R&S Network Connection Manual operation: "GPIB Language" on page 485 Note: If you use "PSA89600", you must switch to an HP language first before return- ing to SCPI (in remote operation only). For the identical language "PSA", this inter- mediate step is not necessary.
-
Page 963: Status Register
® Remote Control R&S Status Register SYSTem:TWALking <Mode> Defines how remote control programs are evaluated, in particular multiple commands in one command line. Note that the default setting is NORM; however, the setting defined by this command is retained after a [preset] (*RST) operation. Parameters: <Mode>... -
Page 964: General Status Register Commands
® Remote Control R&S Status Register ● "STATus:QUEStionable Register" on page 558 ● "STATus:QUEStionable:ACPLimit Register" on page 559 ● "STATus:QUEStionable:FREQuency Register" on page 553 ● "STATus:QUEStionable:LIMit Register" on page 553 ● "STATus:QUEStionable:LMARgin Register" on page 554 ● "STATus:QUEStionable:POWer Register" on page 555 16.16.1 General Status Register Commands ......................964 STATus:PRESet... -
Page 965: Reading Out The Condition Part
® Remote Control R&S Status Register STATus:QUEStionable:POWer[:EVENt]? STATus:QUEStionable:TRANsducer[:EVENt]? These commands read out the EVENt section of the status register. At the same time, the commands delete the contents of the EVENt section. Usage: Query only 16.16.3 Reading Out the CONDition Part For more information on the condition part see Chapter 16.1.6.2, "Structure of a SCPI status... -
Page 966: Controlling The Negative Transition Part
® Remote Control R&S Status Register 16.16.5 Controlling the Negative Transition Part For more information on the positive transition part see Chapter 16.1.6.2, "Structure of a SCPI status register", on page 546. STATus:OPERation:NTRansition <SumBit> STATus:QUEStionable:NTRansition <SumBit> STATus:QUEStionable:ACPLimit:NTRansition <SumBit> STATus:QUEStionable:FREQuency:NTRansition <SumBit> STATus:QUEStionable:LIMit<n>:NTRansition <SumBit>... -
Page 967: Remote Control - Programming Examples
® Remote Control R&S Remote Control – Programming Examples 16.17 Remote Control – Programming Examples In this chapter, more complex programming examples are given. In Chapter 16.2.7, "Brief Introduction to Remote Control", on page 584, basic steps in remote control pro- gramming are provided. -
Page 968: Service Request
' of errors ------- PUBLIC SUB SetupSRQ() CALL InstrWrite (analyzer, "*CLS") 'Reset status reporting system CALL InstrWrite (analyzer, "*SRE 168") 'Enable service request for 'STAT:OPER, STAT:QUES and ESR 'register CALL InstrWrite (analyzer, "*ESE 60") 'Set event enable bit for 'command, execution, device- 'dependent and query error CALL InstrWrite (analyzer, "STAT:OPER:ENAB 32767") - Page 969 MessageBasedSession) mbSession.TerminationCharacterEnabled = True mbSession.Write("*CLS") 'Reset status reporting system mbSession.Write("*SRE 168") 'Enable service request for 'STAT:OPER, STAT:QUES and ESR register mbSession.Write("*ESE 60") 'Set event enable bit for 'command, execution, device-dependent and query error mbSession.Write("STAT:OPER:ENAB 32767") 'Set OPERation enable bit for all events mbSession.Write("STAT:OPER:PTR 32767")
-
Page 970: Waiting For The Arrival Of A Service Request
® Remote Control R&S Remote Control – Programming Examples If (Status.EventType() = _ MessageBasedSessionEventType.ServiceRequest) Then Console.WriteLine("SRQ is recognized") 'If SRQ is recognized => subroutine for evaluation Srq() End If Catch exp As Exception Console.WriteLine(exp.Message) End Try Catch exp As InvalidCastException Console.WriteLine("Resource selected must be a message-based session") Catch exp As Exception Console.WriteLine(exp.Message) - Page 971 ® Remote Control R&S Remote Control – Programming Examples 'If SRQ is recognized => 'subroutine for evaluation '--------- Sweep in first Spectrum Tab and query marker -------------------- Dim Status = mbSession.WaitOnEvent( _ MessageBasedSessionEventType.ServiceRequest, SRQWaitTimeout) 'Wait for service request user inputs are not possible 'during the waiting time! If (Status.EventType() = MessageBasedSessionEventType.ServiceRequest) Then 'If SRQ is recognized =>...
-
Page 972: Waiting Without Blocking The Keyboard And Mouse
® Remote Control R&S Remote Control – Programming Examples 16.17.1.3 Waiting Without Blocking the Keyboard and Mouse A frequent problem with remote control programs using Visual Basic is to insert waiting times without blocking the keyboard and the mouse. If the program is to respond to user inputs also during a waiting time, control over the program events during this time must be returned to the operating system. -
Page 973: Reading Out The Output Buffer
® Remote Control R&S Remote Control – Programming Examples SRQFOUND% = 1 IF (STB% AND 16) > 0 THEN CALL Outputqueue IF (STB% AND 4) > 0 THEN CALL ErrorQueueHandler IF (STB% AND 8) > 0 THEN CALL Questionablestatus IF (STB% AND 128) > 0 THEN CALL Operationstatus IF (STB% AND 32) >... -
Page 974: Reading Error Messages
® Remote Control R&S Remote Control – Programming Examples End Try End Sub 16.17.1.6 Reading Error Messages REM -------- Subroutine for reading the error queue ----------------------- Public SUB ErrorQueueHandler() ERROR$ = SPACE$(100) 'Make space for error variable CALL InstrWrite (analyzer, "SYSTEM:ERROR?") CALL InstrRead(analyzer, ERROR$) Debug.Print "Error Description:";... -
Page 975: Evaluation Of Event Status Register
'variable CALL InstrWrite (analyzer, "*ESR?") 'Read ESR CALL InstrRead(analyzer, Esr$) IF (VAL(Esr$) AND 1) > 0 THEN Debug.Print "Operation complete" IF (VAL(Esr$) AND 2) > 0 THEN Debug.Print "Request Control" IF (VAL(Esr$) AND 4) > 0 THEN Debug.Print "Query Error"... -
Page 976: Using Marker And Delta Marker
16.17.2.1 Shape Factor Measurement (using n dB down) The n-dB-down function of the R&S ESR is used twice to determine the shape factor of a filter (ratio of bandwidths at 60 dB and 3 dB below the filter maximum). The following example is again based on a signal with a level of -30 dBm at 100 MHz. -
Page 977: Measuring The Third Order Intercept Point
MHz and 110 MHz. The intermodulation products lie at 90 MHz and 120 MHz accord- ing to the above formula. The frequency is set so that the examined mixture products are displayed in the diagram. Otherwise, the default setting of the R&S ESR is used for measurements (SetupInstrument). -
Page 978: Measuring The Am Modulation Depth
® Remote Control R&S Remote Control – Programming Examples CALL InstrWrite (analyzer, "*RST") 'Reset instrument CALL InstrWrite (analyzer, "INIT:CONT OFF") 'Single sweep CALL InstrWrite (analyzer, "SYST:DISP:UPD ON") 'ON: display on'OFF: off '--------- Set frequency --------------------------------------------------- CALL InstrWrite (analyzer, "FREQ:STARt 85 MHz;STOP 125 MHz") 'Span '--------- Set level ------------------------------------------------------- CALL InstrWrite (analyzer, "DISP:WIND:TRAC:Y:RLEV -20 dBm") -
Page 979: Limit Lines And Limit Test
® Remote Control R&S Remote Control – Programming Examples 'Assign marker1 to trace1 '--------- Measure modulation depth ----------------------------------------- CALL InstrWrite (analyzer, "CALC:MARK:MAX;FUNC:MDEP ON") 'Marker to Peak; CALL InstrWrite (analyzer, "CALC:MARK:FUNC:MDEP:RES?") 'Measure mod. depth CALL InstrRead(analyzer, result$) 'Read out result '--------- Read out result ------------------------------------------------- Print "AM Mod Depth [%]:";result$ END SUB REM ************************************************************************... - Page 980 ® Remote Control R&S Remote Control – Programming Examples 'Define comment CALL InstrWrite (analyzer, "CALC:LIM5:TRAC 1") 'Assign trace CALL InstrWrite (analyzer, "CALC:LIM5:CONT:DOM FREQ") 'Define x-axis range CALL InstrWrite (analyzer, "CALC:LIM5:CONT:MODE ABS") 'Define x-axis scaling CALL InstrWrite (analyzer, "CALC:LIM5:UNIT DB") 'Define y-axis unit CALL InstrWrite (analyzer, "CALC:LIM5:UPP:MODE REL") 'Define y-axis scaling '--------- Definition of data points and threshold -------------------------...
-
Page 981: Measuring The Channel And Adjacent Channel Power
® Remote Control R&S Remote Control – Programming Examples END IF END SUB REM ************************************************************************ 16.17.4 Measuring the Channel and Adjacent Channel Power In the following example, the channel and adjacent channel power is first measured on a signal with a level of 0 dBm at 800 MHz to IS95. Then the channel and adjacent channel power is measured on a GSM signal at 935.2 MHz with fast ACP measure- ment (FAST ACP). - Page 982 ® Remote Control R&S Remote Control – Programming Examples '--------- Example 2: Configure CP/ACP manually for GSM-------------------- result$ = Space$(100) CALL InstrWrite (analyzer, "FREQ:CENT 935.2 MHz") 'Set frequency CALL InstrWrite (analyzer, "CALC:MARK:FUNC:POW:SEL ACP") 'ACP measurement on CALL InstrWrite (analyzer, "SENS:POW:ACH:ACP 1") '1 adjacent channel CALL InstrWrite (analyzer, "SENS:POW:ACH:BAND 200 KHZ") 'Channel bandw.
- Page 983 ® Remote Control R&S Remote Control – Programming Examples Example of channel/adjacent-channel power measurement POW:ACH:ACP 3 Sets the number of adjacent/alternate channels to 3. POW:ACH:BAND 30 KHZ Sets the bandwidth of the transmission channel to 30 kHz. POW:ACH:BAND:ACH 40 KHZ Sets the bandwidth of each adjacent channel to 40 kHz.
-
Page 984: Occupied Bandwidth Measurement
® Remote Control R&S Remote Control – Programming Examples If the channel power only is to be measured, all commands relating to adjacent/alter- nate channel bandwidth and channel spacings are omitted. The number of adjacent/ alternate channels is set to 0 with [SENSe:]POWer:ACHannel:ACPairs on page 698. -
Page 985: Time Domain Power Measurement
A frequent task in mobile radio tests is measurement of a DUT at various power control levels at the highest possible speed. The R&S ESR offers two test functions for this task, which can be used depending on the signal characteristics. -
Page 986: Power Measurement With Multi-Summary Marker
® Remote Control R&S Remote Control – Programming Examples In the following, the two methods are presented by means of two examples. 16.17.7.1 Power Measurement with Multi-Summary Marker The multi-summary marker function is suitable for measuring the power of a sequence of pulses with the following characteristics: ●... -
Page 987: Multi-Burst Power Measurement
® Remote Control R&S Remote Control – Programming Examples 'Frequency setting CALL InstrWrite (analyzer, "DISP:WIND:TRAC:Y:RLEV 10 dBm") 'Set reference level to 10 dB CALL InstrWrite (analyzer, "INP:ATT 30 dB") 'Set input attenuation to 30 dB CALL InstrWrite (analyzer, "BAND:RES 1 MHz;VID 3 MHz") 'Bandwidth setting CALL InstrWrite (analyzer, "DET RMS") 'Select RMS detector CALL InstrWrite (analyzer, "TRIG:SOUR VID") 'Trigger source: video... - Page 988 ® Remote Control R&S Remote Control – Programming Examples Figure 16-7: Block diagram illustrating signal processing in analyzer Either the root-mean-square power or the peak power is measured, depending on whether the RMS detector or the PEAK detector is selected. The function always uses TRACE 1.
-
Page 989: Fast Level Measurement Using Frequency Lists
REM ************************************************************************ 16.17.8 Fast Level Measurement Using Frequency Lists A typical task for the R&S ESR is power measurement at a number of frequency points, e.g. at multiples of the fundamental (harmonics measurement), or at frequen- cies defined by a mobile radio standard (e.g. spectrum due to transients at ± 200 kHz, ±... - Page 990 ® Remote Control R&S Remote Control – Programming Examples Frequency Type 935.2 MHz GSM 900 fundamental 1805.2 MHz GSM 1800 fundamental 1870.4 MHz GSM 900 2 harmonic 2805.6 MHz GSM 900 3 harmonic 3610.4 MHz GSM 1800 2 harmonic 3740.8 MHz GSM 900 4 harmonic 5815.6 MHz...
-
Page 991: Level Correction Of Transducers
DUT. The R&S ESR offers the possibility of defining a frequency-dependent attenuation cor- rection factor (transducer factor). In the example below, a factor with the following characteristics is defined:... -
Page 992: Measuring The Magnitude And Phase Of A Signal
16.17.10 Measuring the Magnitude and Phase of a Signal Due to the R&S ESR's internal architecture, it is capable of measuring and outputting the magnitude and phase of a signal in addition to its power values. This opens up a variety of possibilities for more in-depth analysis (FFT, demodulation, etc). - Page 993 ® Remote Control R&S Remote Control – Programming Examples '--------- Default setting --------------------------------------- CALL SetupInstrument 'Default setting CALL InstrWrite (analyzer, "TRAC:IQ:STAT ON") 'Activate I/Q data 'acquisition mode; must be 'done before TRAC:IQ:SET ! 'Select number of test points '(= 512 * 1024 – 512) at 'RBW 10 MHz, 'sample rate 32 MHz, 'trigger free run, pos.
-
Page 994: Reading And Writing Files
® Remote Control R&S Remote Control – Programming Examples END SUB REM ************************************************************************ 16.17.11 Reading and Writing Files 16.17.11.1 Reading a File from the Instrument In the following example, the TEST1.R&S FSV.DFL file stored under C: \R_S\Instr\user is read from the instrument and stored in the controller. REM ************************************************************************ Public Sub ReadFile() '--------- Generate variables ----------------------------------------------... -
Page 995: Spectrum Emission Mask Measurement
® Remote Control R&S Remote Control – Programming Examples Dim digits As Long 'Number of digits of 'length information Dim fileBytes As Long 'Length of file in bytes fileSize$ = Space$(100) 'Length of file as a string result$ = Space$(100) 'Buffer for simple results '--------- Default setting of status register ------------------------------ CALL SetupStatusReg 'Configure status register '--------- Prepare the definite length block data --------------------------... -
Page 996: Defining 5 Ranges With All Parameters
® Remote Control R&S Remote Control – Programming Examples Rem the reference range for calculating the TX power CALL InstrWrite (analyzer, ":SENSe1:FREQuency:CENTer 2.2 GHz") 'Center frequency 2.2 GHz CALL InstrWrite (analyzer, ":SENSe1:DETector1 RMS") 'Set RMS detector '--------- Setting up the gated trigger ------------------------------------ CALL InstrWrite (analyzer, ":SENSe1:SWEep:EGATe ON") 'Switch on the external gate mode CALL InstrWrite (analyzer, ":SENSe1:SWEep:EGATe:SOURce EXTernal") - Page 997 ® Remote Control R&S Remote Control – Programming Examples Rem If a free run trigger is not appropriate a gated trigger can Rem the be set up (just comment in the following lines). Rem CALL InstrWrite (analyzer, ":SENSe1:SWEep:EGATe ON") Rem Switch on the external gate mode Rem CALL InstrWrite (analyzer, ":SENSe1:SWEep:EGATe:SOURce EXTernal") Rem Set enternal gate source Rem CALL InstrWrite (analyzer, ":SENSe1:SWEep:EGATe:HOLDoff 0s")
- Page 998 ® Remote Control R&S Remote Control – Programming Examples CALL InstrWrite (analyzer, ":SENSe1:ESPectrum:RANGe1:LIMit:ABSolute:STOP -50") 'Set an absolute limit of -50 dBm CALL InstrWrite (analyzer, ":SENSe1:ESPectrum:RANGe1:LIMit:RELative:STARt -70") 'Set a relative limit of -70 dBc CALL InstrWrite (analyzer, ":SENSe1:ESPectrum:RANGe1:LIMit:RELative:STOP -60") 'Set a relative limit of -60 dBc '--------- Defining the settings of range 2 -------------------------------- CALL InstrWrite (analyzer, ":SENSe1:ESPectrum:RANGe2:FREQuency:STARt -2 MHz") CALL InstrWrite (analyzer, ":SENSe1:ESPectrum:RANGe2:FREQuency:STOP -1 MHz")
-
Page 999: Spurious Emissions Measurement
® Remote Control R&S Remote Control – Programming Examples -40") CALL InstrWrite (analyzer, ":SENSe1:ESPectrum:RANGe4:LIMit:RELative:STOP -60") '--------- Defining the settings of range 5 -------------------------------- CALL InstrWrite (analyzer, ":SENSe1:ESPectrum:RANGe5:FREQuency:STARt 2 MHz") CALL InstrWrite (analyzer, ":SENSe1:ESPectrum:RANGe5:FREQuency:STOP 4 MHz") CALL InstrWrite (analyzer, ":SENSe1:ESPectrum:RANGe5:BANDwidth:RESolution 1 MHZ") CALL InstrWrite (analyzer, ":SENSe1:ESPectrum:RANGe5:FILTer:TYPE CFILter") CALL InstrWrite (analyzer, ":SENSe1:ESPectrum:RANGe5:BANDwidth:VIDeo 3 MHZ") CALL InstrWrite (analyzer, ":SENSe1:ESPectrum:RANGe5:SWEep:TIME 20 ms") - Page 1000 ® Remote Control R&S Remote Control – Programming Examples CALL InstrWrite (analyzer, "SENSe1:LIST:RANGe3:FREQuency:STARt 3000000") CALL InstrWrite (analyzer, "SENSe1:LIST:RANGe4:FREQuency:STARt 4000000") CALL InstrWrite (analyzer, "SENSe1:LIST:RANGe5:FREQuency:STARt 5000000") CALL InstrWrite (analyzer, "SENSe1:LIST:RANGe:COUNT?") 'Queries the number of defined 'ranges '--------- Querying the parameters of range 1 ------------------------------ CALL InstrWrite (analyzer, "SENSe1:LIST:RANGe1:FREQuency:STARt?") CALL InstrWrite (analyzer, "SENSe1:LIST:RANGe1:FREQuency:STOP?") CALL InstrWrite (analyzer, "SENSe1:LIST:RANGe1:FILTer:TYPE?")
Need help?
Do you have a question about the ESR and is the answer not in the manual?
Questions and answers