Advertisement
Quick Links
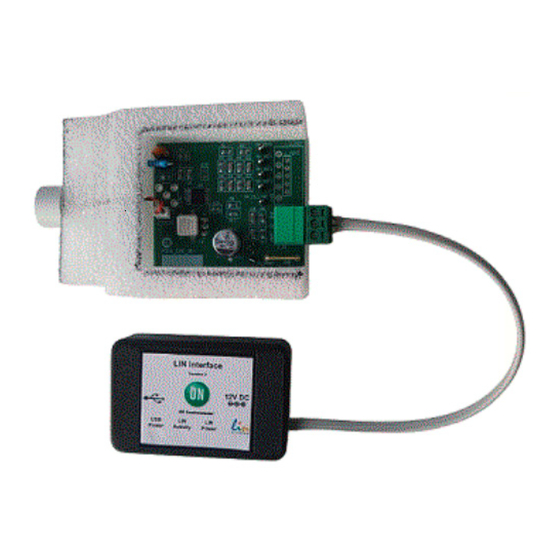
NCV75215R1GEVK –
Ultrasonic Parking Assist Kit
EVBUM2895/D
NCV75215R1GEVK is Ultrasonic Parking Assist Kit to present full
performance of the chip. User−friendly Graphical User Interface
(GUI) makes it possible to operate the evaluation kit in an easy way.
Easy access to several signals makes debugging very easy and gives
you the possibility to understand full set of features of the chip.
Features
•
Measurement Distance Range from 0.25 m to 4.5 m
(Depends on External Parts)
•
Acoustic Noise Monitoring
•
Diagnosis of Transducer Performance
•
Junction Temperature Monitoring and Thermal Shutdown
•
Transducer Center Frequency Range from 35 to 90 kHz
•
Direct and Indirect Measurement Modes
•
EEPROM Memory for Configuration Setting and User Data
•
Rx Gain Adjustable in 0.5 dB Steps in the Range from 50 to 110 dB
•
Time−dependent Threshold Values for the Sensitivity Control
•
Dynamic (Time−dependent) Gain Control
•
Tx Current Range Adjustable from 50 mA to 350 mA
•
Programmable Ultrasonic Burst Length
•
On−chip Bidirectional I/O Line
© Semiconductor Components Industries, LLC, 2024
April, 2024 − Rev. 0
EVAL BOARD USER'S MANUAL
Figure 1. Ultrasonic Parking Assist Kit
1
www.onsemi.com
Publication Order Number:
EVBUM2895/D
Advertisement

Related Manuals for onsemi NCV75215R1GEVK


Summary of Contents for onsemi NCV75215R1GEVK
- Page 1 NCV75215R1GEVK – Ultrasonic Parking Assist Kit EVBUM2895/D NCV75215R1GEVK is Ultrasonic Parking Assist Kit to present full performance of the chip. User−friendly Graphical User Interface (GUI) makes it possible to operate the evaluation kit in an easy way. Easy access to several signals makes debugging very easy and gives you the possibility to understand full set of features of the chip.
- Page 2 Functional operation above the stresses listed in the Recommended Operating Ranges is not implied. Extended exposure to stresses beyond the Recommended Operating Ranges limits may affect device reliability. NCV75215GEVK works together with USB−LIN Interface. Figure 2. Connection of NCV75215GEVK to USB−LIN Interface Figure 3. Connection of the USB−LIN to Power and PC www.onsemi.com...
- Page 3 After running the file P215.exe, you will get following The USB drivers are included in the installation window – Figure 4: package. This installation requires administrator rights. Click Connect Figure 4. Open both these windows (NCV75215 Configuration Window as well as NCV75512 Measurement Window) Figure 5. www.onsemi.com...
- Page 4 NCV75215 by clicking registers. You can configure NCV75215 by clicking on on button Read Configuration (item 2). Then you can button Write Configuration (item 1 on the picture). You can already start measurement by clicking on button Single www.onsemi.com...
- Page 5 Item 8 selects Debugging output on TST0 to TST3 periodic measurements with period 200, 500 or 1000 ms. In Item 9 you can read back chip’s temperature Item 10 Item 4 enables Magnitude data at each measurement Item 5 shows sensor status. www.onsemi.com...
- Page 6 Properly tuned coupling structure is reflected in shortest transformer, reverberation time and therefore minimum achievable distance detetcted by ultrasonic measurements. is sum of transducer capacity and value of It is recommended to check reverberation on the external capacitor Cp. TP_TST0 pin on NCV75215EVK. www.onsemi.com...
- Page 7 EVBUM2895/D Figure 10. Single ended Analog RX Output can be seen on TP_TST0 on NCV75215EVK. Figure 11. www.onsemi.com...
- Page 8 Thresholds are linearly interpolated – you can find the noise . example of the threshold curve in Figure 12. Figure 12. Figure 13. Example (1) of Setting the Threshold Curve www.onsemi.com...
- Page 9 – at 130 cm. gain, gain delta and duration for each section as it is visible Dynamic gain is used to keep echo analog signal within in the examples below. dynamic range of digital processing. Main goal is to www.onsemi.com...
- Page 10 Figure 18. Example (1) of Setting the Gain Curve Figure 19. In Figure 18 you can find example of setting the gain curve and in Figure 19 there is already a measurement with 2 detected echoes – at 64 and 130 cm. www.onsemi.com...
- Page 11 Remember that signal If you compare real measurements in Figures 19 and 21, should be set within dynamic range of digital processing. you can find how much the signals differ – if the gain curve www.onsemi.com...
-
Page 12: Additional Information
LIMITATIONS OF LIABILITY: onsemi shall not be liable for any special, consequential, incidental, indirect or punitive damages, including, but not limited to the costs of requalification, delay, loss of profits or goodwill, arising out of or in connection with the board, even if onsemi is advised of the possibility of such damages. In no event shall onsemi’s aggregate liability from any obligation arising out of or in connection with the board, under any theory of liability, exceed the purchase price paid for the board, if any.
Need help?
Do you have a question about the NCV75215R1GEVK and is the answer not in the manual?
Questions and answers