Table of Contents
Advertisement
Quick Links
Advertisement
Table of Contents

Related Manuals for LI-COR LI-7200 RS


Summary of Contents for LI-COR LI-7200 RS
- Page 1 Enclosed CO2/H2O Gas Analyzer Instruction Manual...
- Page 3 Regional Offices LI-COR Biosciences GmbH Siemensstraße 25A 61352 Bad Homburg Germany Phone: +49 (0) 6172 17 17 771 envsales-gmbh@licor.com LI-COR Biosciences UK Ltd. St. John’s Innovation Centre Cowley Road Cambridge CB4 0WS United Kingdom Phone: +44 (0) 1223 422102 envsales-UK@licor.com LI-COR Distributor Network: www.licor.com/envdistributors...
- Page 4 LIMITED TO THE IMPLIED WARRANTIES OF MERCHANTABILITY AND FITNESS FOR A PARTICULAR PURPOSE. LI-COR shall not be liable for errors contained herein or for incidental or consequential damages in con- nection with the furnishing, performance, or use of this material.
- Page 5 CE Marking: This product is a CE-marked product. For conformity information, contact LI-COR Support at envsupport@licor.com. Out- side of the U.S., contact your local sales office or distributor. LI-7200RS CO2 / H2O LI-7200RS Closed Path CO O Analyzer Part Name...
-
Page 7: Table Of Contents
Contents Section 1. Overview of the instrument What’s what LI-7200RS sensor head Head cable assembly Gas analyzer accessories LI-7550 Analyzer Interface Unit Flow module The SmartFlux® 2 System Brainboxes SW-508 network switch 1-11 Software 1-12 Windows interface application software 1-12 EddyPro®... - Page 8 Configuring gas analyzer settings Setting the system clock Setting the operating temperature range Additional eddy covariance options Connecting a LI-COR Biomet Data Acquisition System Connecting a Sutron 9210 or Campbell CR3000, CR1000, or CR6 Connecting an LI-7700 Connecting to FluxSuite...
- Page 9 Mounting with c-clamp style anemometers Mounting the LI-7550 and the flow module Mounting the GPS antenna Securing the sensor head cables and tubing Collect data on the setup 4-11 Site information 4-11 Sonic anemometer north offset 4-12 Air inlet position 4-12 Intake tube parameters 4-13...
- Page 10 Logged data files The Raw data folder The Results folder The Summaries folder The DAqM folder The Images folder The ICOS CSV folder Viewing data in FluxSuite Software Automatic file management Copying data files from USB storage Using the Download utility Using an SFTP application Viewing raw logged data 6-10...
- Page 11 Instrument software is unresponsive Issues with gas analyzer measurements Bad temperature readings Bad pressure readings Bad CO2 or H2O readings Absorptances make sense, densities don't Readings very noisy Flow restrictions Gas analyzer diagnostics 8-11 Diagnostic value in data files 8-11 CO2 signal strength 8-12 Delta signal strength...
- Page 12 Connect over Ethernet 10-1 Connect over RS-232 serial 10-4 Run disconnected 10-6 Dashboard 10-6 Instrument information and data logging status 10-7 Instrument performance and connection status 10-9 Graphs 10-10 Data display 10-11 Other software settings 10-12 Flow module options 10-12 Flow module interior control panel 10-14 Settings...
- Page 13 Appendix G. Warranty Appendix H. Index...
-
Page 15: Section 1. Overview Of The Instrument
Section 1. Overview of the instrument The LI-7200RS is a high performance closed-path CO O gas analyzer designed for use in eddy covariance flux systems. It is also suitable for profile measurements, relaxed eddy accumulation measurements, gradient flux techniques, pCO meas- urement systems, or any other application that depends on high-speed, high-pre- cision CO... -
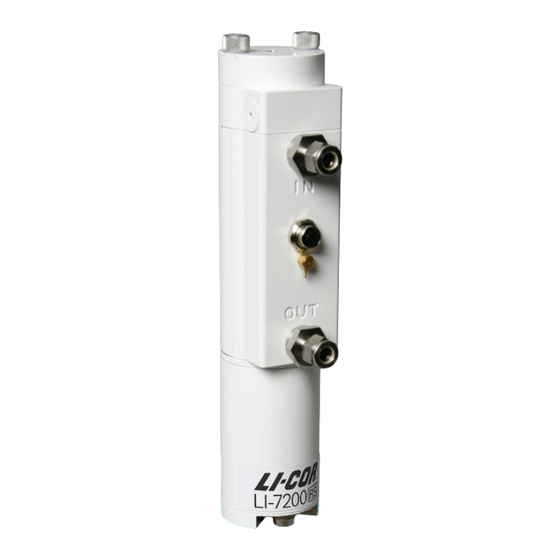
Page 16: Li-7200Rs Sensor Head
Section 1. Overview of the instrument LI-7200RS sensor head The sensor head is the gas analyzer. It includes air temperature thermocouples, a dif- ferential pressure sensor, and some electronics. Important: There are fine-wire thermocouples that measure air temperature at the air inlet and outlet ports. -
Page 17: Gas Analyzer Accessories
Section 1. Overview of the instrument Gas analyzer accessories The following accessories are available for the instrument. Some components are included with the instrument; others are sold separately as indicated. Head mounting post Included in the instrument spares kit, the mounting post is to mount the LI-7200RS Part Number: 9972-046 head in a ¾"... - Page 18 LI-7550 at the factory. Keep this sheet in case you need to re-enter these values. You can acquire a copy of your calibration certificate from the LI-COR support web site. LI-7200RS Enclosed CO₂/H₂O Analyzer...
-
Page 19: Li-7550 Analyzer Interface Unit
Section 1. Overview of the instrument LI-7550 Analyzer Interface Unit The LI-7550 Analyzer Interface Unit houses the gas analyzer electronics. There is a USB port and three Ethernet connectors inside the LI-7550. Two of the Ethernet ports are connected to the connector panel. Figure 1-2. - Page 20 Section 1. Overview of the instrument Drive not mounted; OK to remove. Off: A USB drive must be installed in order to log data. Two compatible USB Port: drives are in the spares kit. On when the instrument is warmed up and ready to measure. Ready LED: Press to restart the LI-7550 and gas analyzer.
-
Page 21: Flow Module
Section 1. Overview of the instrument Connector for LI-7200RS head thermocouple cable. SENSOR: Connector for the LI-7200RS head pressure tube. PRESSURE: LI-7550 spare parts kit The LI-7550 Analyzer Interface Unit has a spare parts kit. It includes the cables and Part Number 9975-023 mounting bracket. - Page 22 Section 1. Overview of the instrument The connector panel features an air outlet ( ), power cable connector, com- EXHAUST munications cable connector, and a ground lug. Early models (7200-101) have the intake on the bottom of the enclosure. Later models (7200-102) have the intake on top of the enclosure.
-
Page 23: The Smartflux® 2 System
Section 1. Overview of the instrument Flow module spare parts kit This kit contains replacement parts for your 7200-102. Among other items, the Part Number: 9972-087 spares kit contains tubing and the power and accessory cables. As you become famil- iar with the flow module you will learn which items to keep close at hand and which items can be stored away. - Page 24 USB flash drive may result in the loss of data. These three ports can read digital Digital I/O Terminals: data from a sonic anemometer and a LI-COR Data Acquis- ition System. Each digital I/O port has two LEDs that are visible at the top of each connector: RX LED (receiving) and TX LED (transmitting): Receiving or transmitting data.
-
Page 25: Brainboxes Sw-508 Network Switch
Section 1. Overview of the instrument The SmartFlux 2 System includes the following components: Description Quantity Part Number GPS Antenna with Mounting Bracket and 5 m cable 9979-035 GPS Mounting Bolt, Hex Head 5/16-24 x 3/4" 140-16077 GPS Mounting Nut, Hex Head 5/16-24 163-16076 Ethernet Cable, 30 cm 616-16844... -
Page 26: Software
SmartFlux System or if you want to reprocess eddy covariance raw data. File viewer software The File Viewer is a simple application for viewing raw data from LI-COR sensors. It reads compressed data files and displays plots of the data. -
Page 27: Enclosures And Accessories
The pre-configured enclosure is a large weather resistant box with mounting hard- Part Number: 7900-126 ware. It is set up for the LI-COR Biomet Data Acquisition System and other accessor- ies. It includes all of the terminal connections and DIN rails required for a complete eddy covariance system. -
Page 28: Eddy Covariance System Enclosure
Section 1. Overview of the instrument Eddy covariance system enclosure A basic enclosure with a minimal set of internal components. Includes a pre-drilled Part Number: 7900-050 internal back plate, three DIN rails for mounting components, and three strain relief fittings. It is best to pair this with the Power Distribution Kit (7900-235). Power distribution kit Includes DIN-mountable terminal connections, shorting blocks, and a 10-amp cir- Part Number:... -
Page 29: Sonic Anemometer Cables And Mounting Hardware
To mount the WindMaster/Pro and R3, use a ¾" × 1" cross-over fitting (7900-342) Part Number: 7900-342 and anemometer mounting post (900-11242). The mounting post is included with WindMaster/Pro anemometers purchased from LI-COR. The cross-over fitting is available seperately. Description Quantity... -
Page 30: Gill Hs-50 And R3-50
Section 1. Overview of the instrument Gill HS-50 and R3-50 Data and power cables The data/power cable is available in three lengths. The USB-to-RS-422 cable is used Part Number: 7900-445-x to connect the anemometer to a computer. Table 1-4. Power and data cables to connect Gill HS-50 or R3-50 anemometers with the SmartFlux 2 or 3 System. -
Page 31: Campbell Scientific Csat3
Section 1. Overview of the instrument Campbell Scientific CSAT3 Data and power cables are available in two lengths. The USB-to-RS-232 cable is used Part Numbers: 7900-454-x and to connect the anemometer to a computer. 7900-452-x Table 1-5. CSAT3 power and data cables that are compatible with the SmartFlux 2 and 3 Systems. -
Page 32: Metek Multipath Class A
Cross-arm Plate 9879-020 Cross-arm Brackets 9879-043 Cross-arm Hardware Pack 9979-018 Figure 1-7. The cross-arm plate with brackets, riser bar, and crossover fitting used to mount a Metek Class A sonic anemometer in LI-COR eddy covariance systems. 1-18 LI-7200RS Enclosed CO₂/H₂O Analyzer... -
Page 33: Metek Multipath Cage
Mount the Metek Cage anemometer with one 1" × 1" crossover fitting (7900-346). Part Number: 7900-346 Figure 1-8. A simple 1" × 1" crossover fitting can mount the Metek Cage to the LI-COR tri- pod crossarm. Metek MultiPath Cage 1-19... -
Page 34: Rm Young 81000X
Section 1. Overview of the instrument RM Young 81000x Data and power cables The data/power cable is available in three lengths. The USB-to-RS-232/RS-485 cable Part Number: 7900-472-x is used to connect the anemometer to a computer. Table 1-10. RM Young 81000 series power and data cables that are compatible with the SmartFlux 2 and 3 Systems. -
Page 35: Section 2. Initial Assembly
Section 2. Initial assembly The following section covers the basic steps you will follow to assemble the LI- 7200RS for the first time. You'll need the analyzer head, LI-7550, flow module, SmartFlux 2 System, and the accessories. Preparing the gas analyzer Begin by installing tubing and data cables that connect the head, flow module, and LI-7550. - Page 36 Section 2. Initial assembly Install the exhaust fitting (6572-047 for the 7200-101) or cylindrical exhaust screen (301-18828 for the 7200-102) in the exhaust port. The screen keeps bugs out of the flow module outlet. Tighten the fitting securely on the exhaust outlet. If using a muffler instead, see Adding a muffler to the air outlet on page 5-25.
-
Page 37: Attaching The Intake Tube
Section 2. Initial assembly Install the black Tygon tubing between the LI-7200RS head air outlet and the flow module air inlet. Connect the tubing at the hose barb on the LI-7200RS sensor head with a hose clamp from the spares kit. Connect the other end to the flow module inlet. After you install the analyzer and flow module at the site, trim the tube to a suitable length. - Page 38 (part number 392-17153), as shown in Figure 2-2 on the facing page. Contact LI-COR if you want to use the heated intake tube on an LI- 7550 manufactured before June 6, 2014 (serial numbers AIU-1279 and lower)
-
Page 39: Installing The 2-Micron Particulate Filter
Section 2. Initial assembly Figure 2-2. The auxiliary splitter cable should be used when there is both a flow module and a heated intake tube. Older versions of the splitter are T-shaped. Installing the 2-micron particulate filter An optional 2-micron Swagelok® filter (part number 9972-073) can be placed in line on the inlet tube. -
Page 40: Installing The Air Inlet
Section 2. Initial assembly Figure 2-3. On the insulated intake tube, the filter is added to the end of the tube, followed by an additional piece of tubing (2" by ¼"). Figure 2-4. On the heated intake tube, it is installed in place of the spacer. Loosen both nuts and remove the spacer. - Page 41 Section 2. Initial assembly Note: Do not expand the hose clamp more than necessary. Doing so can per- manently deform the clamp. Installing the air inlet...
-
Page 42: Connecting The Analyzer Data Cables
Section 2. Initial assembly Connecting the analyzer data cables The cable bundle has two cables and a tube. The cable with a yellow connector and a 90° bend connects to the head between the air inlet and outlet; the other end con- nects to the connector on the LI-7550. -
Page 43: Connecting The Flow Module Data Cable
Section 2. Initial assembly Connecting the flow module data cable The 5-meter accessory cable (part number 392-10092) has male and female con- nectors that attach to the flow module and LI-7550 connector panels at the con- nectors labeled ACCESSORY Figure 2-6. The flow module data cable connects the connectors labeled ACCESSORY the flow module and the LI-7550. -
Page 44: Preparing The Enclosure
Section 2. Initial assembly Preparing the enclosure In both the eddy covariance system enclosure (7900-050) and the Biomet Data Acquisition System enclosure (7900-126), install the three strain-relief couplings in the three bottom openings. In the eddy covariance system enclosure (7900-050), install the Power Distribution Kit (7900-235) on the raised DIN rail. -
Page 45: Preparing The Smartflux System And Network Switch
Section 2. Initial assembly Preparing the SmartFlux System and network switch Follow the steps below when installing the SmartFlux System in the 7900-050 Eddy Covariance System Enclosure or 7900-126 Biomet Data Acquisition System Enclos- ure. If you are using a different enclosure, connect the power and data cables sim- ilarly to what is described here. -
Page 46: Connect Power Wires And The Ethernet Cable To The Smartflux System
Section 2. Initial assembly Connect power wires and the Ethernet cable to the SmartFlux System Connect wire leads to the positive and negative terminals on the SmartFlux System. The black lead connects to negative (-), the red lead connects to positive (+). Plug in the 30 cm Ethernet cable that came with the SmartFlux System. -
Page 47: Installing The Smartflux System And Network Switch
Section 2. Initial assembly Installing the SmartFlux System and network switch Install the SmartFlux 2 or 3 System onto left side of the upper-right DIN rail. Insert the spring-loaded clip on the bottom edge of the DIN rail and compress the spring. Rotate it into place. -
Page 48: Connecting Component Power Wires
Section 2. Initial assembly Connecting component power wires The 7900-050 and 7900-126 enclosures present different wiring options. Be sure the power supplied to the enclosure is within the upper voltage limits of attached com- ponents, but capable of providing 4 to 5 amps. Keep the breaker while con- necting power wires. - Page 49 Section 2. Initial assembly 24 VDC power supply with Data Retention Module With a 24 VDC power supply, the DRM V power outputs can be used to power low-voltage components through the left 10-amp breaker and DIN terminals. Com- ponents powered in this manner include the network switch, PhenoCam, cellular gateway, satellite modem, CNF4 heater and ventilation unit (for the CNR4), or self- calibrating soil heat flux plates (HFP01SC).
- Page 50 Section 2. Initial assembly Table 2-1. Power wire connections for a system powered by a 24 VDC supply that includes a Data Retention Module. From Wire Color DRM and DAqM Ground Lugs yellow/green Enclosure Ground Lug DIN Terminal 1 (top) black DRM POWER IN GND (-) DIN Terminal 5 (top)
- Page 51 Section 2. Initial assembly 12 VDC power supply with Data Retention Module With a 12 VDC power supply, you do not need to connect the DRM power out to the breaker or terminal strips because 12 VDC is within the limits of all com- ponents.
- Page 52 Section 2. Initial assembly Table 2-2. Power wire connections for a system powered by a 12 VDC supply that includes a Data Retention Module. From Wire Color DRM and DAqM Ground Lugs yellow/green Enclosure Ground Lug DIN Terminal 11 (bottom) black DRM POWER IN GND (-) DIN Terminal 13 (bottom)
-
Page 53: 12 Vdc Power Supply With No Data Retention Module
Section 2. Initial assembly 12 VDC power supply with no Data Retention Module If your system does not have a Data Retention Module, the SmartFlux System will be powered from the enclosure power terminals rather than the DRM power out- puts. - Page 54 Section 2. Initial assembly Table 2-3. Power wire connections for a system powered by 12 VDC with no Data Retention Module. From Wire Color DRM and DAqM Ground Lugs yellow/green Enclosure Ground Lug DIN Terminal 11 (bottom) black DAqM GND (-) DIN Terminal 13 (bottom) DAqM PWR (+) DIN Terminal 11 (top)
-
Page 55: 24 Vdc Power Supply With The Tdk-Lambda Dc-Dc Converter
Section 2. Initial assembly 24 VDC power supply with the TDK-Lambda DC-DC converter The TDK-Lambda DC-DC Converter (model DPX60) regulates output voltage to about 12 VDC, which makes it possible to power low-voltage devices from a 24 VDC solar power supply. The DC-DC converter should be used to power the left 10- amp accessory breaker (and the SmartFlux System) if you have a 24 VDC power sup- ply and no DRM. - Page 56 Section 2. Initial assembly Figure 2-10. Power to a single DRM when using a 24 VDC power supply and the TDK- Lamda DC-DC Converter. 2-22 LI-7200RS Enclosed CO₂/H₂O Analyzer...
- Page 57 Section 2. Initial assembly Table 2-4. Power wire connections for a system with the TDK-Lambda DC-DC converter. From Wire Color DRM and DAqM Ground Lugs yellow/green Enclosure Ground Lug DIN Terminal 2 (top) black TDK-Lambda Input 1 (-Vi) DIN Terminal 6 (top) TDK-Lambda Input 2 (+Vi) TDK-Lambda Output 3 (COM) black...
-
Page 58: Connecting Gas Analyzer And Flow Module Power Wires
Section 2. Initial assembly Connecting gas analyzer and flow module power wires Power wires for the gas analyzer and flow module connect to terminals in the enclos- ure. With the eddy covariance system enclosure (7900-050) and Power Distribution Kit (7900-235), connect the red and black power wires leads to corresponding red and black terminals. -
Page 59: Connecting Ethernet Cables
Section 2. Initial assembly Connecting Ethernet cables Ethernet cables connect the SmartFlux 2 System and LI-7550 to the network switch. Vacant ports on the network switch are for other networked components, such as the cellular gateway, PhenoCam, LI-7700, or connecting a PC. Figure 2-11. -
Page 60: Connecting Sonic Anemometer Data And Power Cables
Section 2. Initial assembly Connecting sonic anemometer data and power cables The SmartFlux 2 System can record digital data from a number of sonic anem- ometer models. These are described below. Power for the sonic anemometer is provided through the SmartFlux System. Gill WindMaster or WindMaster Pro Part Number: A combined power and data cable is available for the Gill WindMaster/Pro sonic... -
Page 61: Gill Hs-50 Or R3-50
Section 2. Initial assembly Gill HS-50 or R3-50 Part Number: A combined power and data cable is available for the Gill HS-50 or R3-50 sonic 7900-445-x anemometers. The sonic anemometer will be configured automatically when it is connected to the SmartFlux System and selected in the software. The cable connects to one of the digital I/O ports on the SmartFlux System (port 1 recommended). -
Page 62: Campbell Scientific Csat3
Section 2. Initial assembly Campbell Scientific CSAT3 Data Cable: Power and data cables are available for the Campbell Scientific, Inc. CSAT3 sonic 7900-454-x; anemometers. The sonic anemometer will be configured automatically when it is Power Cable: connected to the SmartFlux System and selected in the software. The cable connects 7900-452-x to digital I/O Port 1 on the SmartFlux System. -
Page 63: Campbell Scientific Csat3B
Section 2. Initial assembly Campbell Scientific CSAT3B See CSAT3B and CSAT3 on page A-3 for details on the USB connection. Data Cable: You can use a Campbell Scientific, Inc. CSAT3B sonic anemometer with the data 7900-464-x; cable (part number 7900-464-x) and power cable (part number 7900-462-x). The Power Cable: CSAT3B anemometer must be configured before it will work with the SmartFlux 7900-462-x... -
Page 64: Metek Cage Or Class-A
Section 2. Initial assembly Metek Cage or Class-A Cage Cable: A combined power and data cable is available for the Metek Multi-Path Class A and 7900-482-x; Cage sonic anemometers. The Class A has an electronic box between the head and Class-A Cable: SmartFlux;... -
Page 65: Rm Young 81000X
Section 2. Initial assembly RM Young 81000x Part Number: A combined power and data cable is available for the RM Young 81000 series sonic 7900-472-x anemometers. The anemometer will be configured automatically when it is con- nected to the SmartFlux System and selected in software. The cable connects to one of the digital I/O ports on the SmartFlux System (port 1 recommended). - Page 66 Section 2. Initial assembly 2-32 LI-7200RS Enclosed CO₂/H₂O Analyzer...
-
Page 67: Section 3. Initial Configuration
Section 3. Initial configuration The LI-7200RS Windows software is used to configure the instrument. Go to licor.com/7200rs-software for the latest version and install it on your computer. Download embedded firmware and interface software for all components in the sys- tem. We recommend using the latest software for the best performance. Power on the system With everything prepared as described in Initial assembly on page 2-1, the system can be powered on. - Page 68 Section 3. Initial configuration Connect with the gas analyzer Launch the application (called ). Instruments will be listed by LI-7x00 A RS DS 8.x LI-7550 serial number (AIU-XXXX). Select one from the list and click Connect If there is a yellow dot beside the instrument ( ), update the firmware as described in Software updates on page 9-13.
- Page 69 Section 3. Initial configuration If you are connecting the instrument to an RV50X cellular gateway, set the IP address as described in the RV50X instruction manual from LI-COR. Connect with the SmartFlux 2 System Click the button. Select the SmartFlux 2 System and click...
-
Page 70: Configuring Gas Analyzer Settings
Section 3. Initial configuration The SmartFlux System uses EddyPro express settings by default. If you want to use advanced processing, additional steps must be taken to configure the system. See EddyPro processing on the SmartFlux System on page 7-1 for more information about Express and Advanced modes. -
Page 71: Setting The Operating Temperature Range
Section 3. Initial configuration Important: The setting must be set to . Time Clock sync (PTP) Automatic synchronization of the LI-7550, LI-7500DS, SmartFlux System, and LI-7700 are based on the PTP protocol. If PTP is off, the recorded data will be prone to syn- chronization problems. -
Page 72: Additional Eddy Covariance Options
Section 3. Initial configuration Additional eddy covariance options This section describes how to configure additional settings to connect a LI-COR Biomet Data Acquisition System, LI-7700 Open Path CH Analyzer, FluxSuite Soft- ware, Biomet System (Sutron Datalogger), data repository, LI-8100A, and Pheno- Cam. - Page 73 Section 3. Initial configuration IP address in the field (networked device on different subnet Datalogger IP Address mask as computer) and click Connect CR3000, CR1000, or CR6 Select , enter the IP address in the CR3000, CR1000, CR6 Datalogger IP Address field and click .
- Page 74 Section 3. Initial configuration Note: Enable the setting under to synchronize Sync clock Site Setup > Biomet the datalogger and gas analyzer clocks. When checked, the biomet system clock will be adjusted to match the LI-7250 clock every 30 minutes. Refer to the Data Acquisition System or Biomet Station Instruction Manual for more information.
-
Page 75: Connecting An Li-7700
Section 3. Initial configuration Connecting an LI-7700 To connect with an LI-7700 Open Path CH Analyzer, install an Ethernet cable between the LI-7700 and the network switch. Click the button, or under LI-7700 , click settings ( ) to open the connection window. Site Setup >... -
Page 76: Connecting To Fluxsuite
Section 3. Initial configuration Connecting to FluxSuite Any internet-connected LI-COR eddy covariance system that is running the SmartFlux 2 or 3 System can be connected to the FluxSuite Software. FluxSuite provides online results computed by your system in real time, daily email alerts based on thresholds you set, and the ability to assign collaborators to each site. -
Page 77: Connecting To A Data Repository
Section 3. Initial configuration Connecting to a data repository tab is where you configure the eddy covariance system to push Data Repository data to a server. You can push raw data (lots of data), complete EddyPro results (a moderate amount of data), or daily summary files (a small amount of data). The options available include: Check this box to enable transfer. - Page 78 Section 3. Initial configuration https://server-address sftp://server-address/path/$(filename) ftp://server-address/path/$(filename) In the examples above, the server-address is the URL of the server where SmartFlux will transfer data. Depending on how the server is set up, the path may or may not be needed. SmartFlux expects the server to ask for a username and password, so they are man- datory fields.
-
Page 79: Connecting An Li-8100A System
Section 3. Initial configuration The fields indicated by #[…] must be edited by the user The fields indicated by $(variable) are dynamically created by the software The text in bold typface must not be modified For example, for Site ID XYZab, Logger Number 1 and File Number 2, the file name template must be: XYZab_EC_$(endtimestamp)_L1_F2.csv Connecting an LI-8100A system... -
Page 80: Connecting A Phenocam Camera
Connecting a PhenoCam camera Under the PhenoCam tab, you can connect to a StarDot PhenoCam available from ® LI-COR or a CC5MPX digital camera available from Campbell Scientific, Inc. When connected, the images will be posted to FluxSuite (assuming you have registered and configured everything else). -
Page 81: Configuring The System For Cellular Communication With The Rv50X
RV50X If you are using a cellular communication system (Sierra Wireless AirLink RV50X), refer to the LI-COR cellular communication instruction manual for full details. Here, we show how to set the gas analyzer IP address, as required for the cellular communication. - Page 82 Section 3. Initial configuration the instrument after changing the network settings. Reboot Proceed to configure the RV50X as described in the included documentation. 3-16 LI-7200RS Enclosed CO₂/H₂O Analyzer...
-
Page 83: Section 4. Field Installation
Section 4. Field installation The instrument is typically installed on a tripod or tower for eddy covariance applic- ations. This section describes how to install the instrument and its associated com- ponents. Mounting the gas analyzer and sonic anemometer The LI-7200RS sensor is installed or a tripod or tower with a combination of the mounting post and the mounting kit (part number 7900-340). -
Page 84: Installing The Head Mounting Post
Section 4. Field installation Installing the head mounting post Begin by attaching the head mounting post to the analyzer head. Mounting the sensor head The mounting kit (part number 7900-340) includes a cross-over fitting, riser bar, and swivel mount. The head should be tilted at a 10 to 15° angle toward the inlet to ensure that water can flow out of the intake tube and analyzer optics. - Page 85 Section 4. Field installation Position the intake to minimize vertical and horizontal separation between the intake and the center of the sonic anemometer, while also minimizing distortion of the airflow. If the installation is high above the top of the plant canopy (1.5-2.0 m or higher), mount the intake under the sonic path to minimize the horizontal sensor separation and wind flow disturbance, as shown in Figure 4-2 below.
- Page 86 Section 4. Field installation Figure 4-3. If the system is <1.5 m above the plant canopy, you can mount the intake along- side the sonic path to minimize the vertical sensor separation. Important: Do not insert the air inlet into the anemometer path, because sig- nificant flow disturbance to all three wind components may occur, severely affect- ing flux data quality.
- Page 87 Section 4. Field installation Figure 4-4. Optional mounting with customized intake tube. For very rainy environments, tilt the analyzer even more and bend the intake tube to prevent water from being drawn into the gas analyzer. Securing the intake tube...
-
Page 88: Mounting With Mast-Style Anemometers
Section 4. Field installation Mounting with mast-style anemometers Basic installation for the Gill WindMaster/Pro or R3, RM Young 81000x, and Metek Cage in Figure 4-5 below. Figure 4-5. Installation hardware for mast-style anemometers. LI-7200RS Enclosed CO₂/H₂O Analyzer... -
Page 89: Mounting With C-Clamp Style Anemometers
Section 4. Field installation Mounting with c-clamp style anemometers Mounting hardware is available for common c-clamp style anemometers, including the Metek Class A and Gill HS are in Figure 4-6 below. Figure 4-6. Installation hardware for c-clamp style anemometers. Mounting with c-clamp style anemometers... -
Page 90: Mounting The Li-7550 And The Flow Module
Section 4. Field installation Mounting the LI-7550 and the flow module Two mounting kits (part number 9979-022) are provided to mount the LI-7550 and the flow module to a tripod or other post. You can also attach the box directly to a flat surface. -
Page 91: Mounting The Gps Antenna
Section 4. Field installation Mounting the GPS antenna Attach the GPS antenna to the mounting plate at the top of an enclosure with the included hex head bolt. Important: Do not install the antenna inside of an enclosure. The GPS antenna will not receive satellite signals and the system will be unable to set the clock if it is installed in this manner. - Page 92 Section 4. Field installation Figure 4-8. Avoid sharp bends in the tube and kinks in the cables. Sharp bends in the tube can cause flow restriction. Kinks in the cable can lead to cable failure. 4-10 LI-7200RS Enclosed CO₂/H₂O Analyzer...
-
Page 93: Collect Data On The Setup
Section 4. Field installation Collect data on the setup The final step of the site setup is to measure a number of parameters at the site. Each of the following should be recorded for later entry into the software. These values are used in flux calculations. -
Page 94: Sonic Anemometer North Offset
Section 4. Field installation Sonic anemometer north offset Determine the north offset of the anemometer. Degrees of clock-wise rotation of the North Spar or Transducer North Offset: Axis 1 from magnetic north. Air inlet position Measure the north, east, and vertical offsets. North (positive) or south (negative) distance Northward Separation (cm): between the anemometer sample volume and the gas analyzer air inlet. -
Page 95: Intake Tube Parameters
Section 4. Field installation Distance between the anemometer midline and the gas Vertical Separation (cm): analyzer air inlet. Positive value if the inlet is above the anemometer midline; negative value if the inlet is below the anemometer midline. Intake tube parameters Determine the If you have customized the intake tube, Intake tube length (cm):... - Page 96 Section 4. Field installation 4-14 LI-7200RS Enclosed CO₂/H₂O Analyzer...
-
Page 97: Section 5. Configuring The Eddy Covariance System
Section 5. Configuring the eddy covariance system The following section describes how to configure the system. To connect to the instrument with a PC, see Initial configuration on page 3-1. Configuring the site setup Site setup includes a number of settings related to log files, site information, and instruments at the site. -
Page 98: Checking The Bandwidth
Section 5. Configuring the eddy covariance system Select your preference for managing data when the USB When out of space: drive becomes full. Note: Files are split based on the instrument clock. With a file duration of 30 minutes and logging starting at 10:22, the file will be split at 10:30, 11:00, etc. All files are assigned a name using the timestamp with the format YYYY-MM- , where date and time are year, month, day, and... - Page 99 Section 5. Configuring the eddy covariance system Name of the research site. Site name: Name of the flux stations within the site. Station name: Site canopy height; meters. Canopy height (mandatory): Also referred to as zero plane displacement height, the dis- Displacement height: placement height of a vegetated surface (d) is the height at which the wind speed would go to zero if the logarithmic wind profile was maintained from the outer...
- Page 100 Section 5. Configuring the eddy covariance system Note: If you are testing the SmartFlux System in a building, the GPS signals may be too weak for the system to set the location. The system will get this inform- ation whenever it gets adequate GPS signals. Latitude and longitude coordinates are automatically GPS format (WGS84): detected by the SmartFlux System or they can be entered manually.
-
Page 101: Entering Anemometer Information
Section 5. Configuring the eddy covariance system Entering anemometer information Under , enter information about the sonic anemometer, includ- Sonic Anemometer ing the manufacturer, model, data output format, offset from true north, and height. Some of the available options (e.g., North Alignment) will change, depending on which model is selected. - Page 102 Section 5. Configuring the eddy covariance system either digital or analog inputs: Anemometers for use with SmartFlux 2 Manufacturer Model(s) Campbell Scientific CSAT3, CSAT3B Gill Instruments WindMaster/Pro, HS-50, HS-100, or R3-50 Metek uSonic-3 Class-A MP, uSonic-3 Cage MP RM Young 81000V, 8100RE, 8100VRE Anemometers for use with LI-7550 Analog Inputs Only Manufacturer...
- Page 103 Section 5. Configuring the eddy covariance system Important: EddyPro requires the offset with respect to geographic north as two pieces of information: The offset with respect to geographic north and the mag- netic declination. Currently the software does not provide an entry for magnetic declination.
-
Page 104: Entering Co2/H2O Analyzer Information
Section 5. Configuring the eddy covariance system Entering CO O analyzer information Under , enter the gas analyzer position relative to the sonic anem- CO2/H2O Analyzer ometer and select the values to log. You also set the air intake and flow parameters. The distance between the gas analyzer and sonic anemometer is used to estimate the high-frequency flux losses. -
Page 105: Selecting Co2/H2O Log Variables
Section 5. Configuring the eddy covariance system East or west distance between the inlet Eastward Separation (cm) (mandatory): and the anemometer. Vertical distance between the inlet and Vertical Separation (cm) (mandatory): the anemometer. Selecting CO O log variables Select variables to log under CO2/H2O Log Values Click to record the... -
Page 106: Configuring The Flow Module
Section 5. Configuring the eddy covariance system If you are using the heated intake tube, click the settings button ( ) next to Intake . Set the power to apply in watts. 4 Watts is recommended. In extremely Tube Power humid environments, use 6 W. -
Page 107: Entering Ch4 Analyzer Information (Optional)
Section 5. Configuring the eddy covariance system Entering CH analyzer information (optional) If the system is connected to an LI-7700 Open Path CH Analyzer, under Site Setup , specify the separation between the sonic anemometer and the LI- > CH4 Analyzer 7700 sample volume and select variables to log. -
Page 108: Begin Logging Data
Section 5. Configuring the eddy covariance system The LI-7700 data values to be logged to the USB drive are chosen under CH Values. In addition, you can enable the check Log LI-7700 status records (.status) box to collect LI-7700 STATUS records. This is for diagnostic purposes. Begin logging data , and buttons are on the main dashboard and on each tab under the... -
Page 109: System Diagnostics
Section 5. Configuring the eddy covariance system System diagnostics SmartFlux System diagnostics are supported by the combined release of win-GHG interface software v8.8.36 and SmartFlux 2/3 System embedded firmware v2.2.50. This feature serves to summarize the system performance by providing status indic- ators for components and configurations, allowing you to evaluate the system at a glance. -
Page 110: Clock
GPS 18x-LVC software ver. 4.3, for example. Compatible firmware versions are 3.8, 3.9, and 4.3 or newer. If the antenna reports 3.7 or older, 4.0, 4.1, or 4.2, replace the antenna with a newer model for reliable performance. Contact LI-COR or your representative for more details. Unknown Unable to retrieve information at this time. - Page 111 To troubleshoot time issues: Make sure the GPS receiver is not in an enclosure. Make sure you are using LI-COR approved network switch. Make sure PTP is set to on all LI-COR devices. Automatic Make sure the date and time are set correctly.
-
Page 112: Sonic Data Collection
(see Sonic data Yes/No collection information on the facing page). Copy the log to the clipboard with for consultation with a LI-COR technician. Ctrl + C Sonic File Names Consistent: The SmartFlux 2/3 System has recorded anemometer data files that have consecutive time stamps. - Page 113 Section 5. Configuring the eddy covariance system Sonic data collection information Click next to to view the logging information. Yes/No Recorded to GHG file? Table 5-1. Details of the GHG file log. Entry Description GHG file: The .ghg file that is recorded in temporary storage. Sonic type: The model, serial number, and filter setting of the anemometer.
-
Page 114: Eddypro
Unable to process most recent data set. Click to view the EddyPro run log. You can copy the log Yes/No to the clipboard with for consultation with a LI-COR Ctrl + C technician. Last File Successfully Processed: <filename> This is the last file on the SmartFlux 2/3 System that was processed without error. -
Page 115: Fluxsuite
Section 5. Configuring the eddy covariance system Issue Status Description USB write test has failed; unable to write data to the USB device. Unplug and plug back in to attempt to resolve. FluxSuite The FluxSuite diagnostics are used to troubleshoot a connection to the FluxSuite ser- vice. -
Page 116: Data Repository
The data repository files stored on the SmartFlux 2/3 System USB device are using more than the 30% allocation they were allotted. Contact LI-COR for assistance. Database Size The database in the SmartFlux 2/3 should be automatically maintained by the sys- tem. -
Page 117: Tips For Success
Section 5. Configuring the eddy covariance system Tips for success This section provides some tips for operating the instrument is difficult site con- ditions. Site maintenance schedule A good site maintenance plan will help ensure more complete data coverage. Follow these recommendations when you first deploy the site. -
Page 118: Filtering The Air Inlet
In situations where fine particle filtering is required to maintain acceptable data quality, we recommend the 2-micron filter that is included with the instrument. If additional filtration is needed, a restrictive single-micron filter can be used (LI-COR part number 9967-008). The Flow Module was designed specifically for low-power operation, and cannot be used with a single-micron filter. -
Page 119: Cleaning The Optics
Section 5. Configuring the eddy covariance system Cleaning the optics Additional action is usually not required after cleaning. If possible, however, flow dry, CO -free gas through the cell and check the zeros. If they are not close, the win- dows may need further cleaning, or the internal chemical bottles may need to be replaced. - Page 120 Section 5. Configuring the eddy covariance system However, if your site experiences condensing conditions on a daily basis, the desic- cant pack kit (part number 7550-950) can help prevent condensation from forming inside the LI-7550. It includes a bottle (part number 6572-055) and desiccant (part number 9975-042).
-
Page 121: Adding A Muffler To The Air Outlet
Section 5. Configuring the eddy covariance system Adding a muffler to the air outlet In some situations, the flow module may emit high-frequency noise through the exhaust port. This is especially noticeable when the blower motor is running close to the maximum motor drive, which can happen if there is a constriction in the flow tubing, either from a clogged filter or a kink in the tube. -
Page 122: Saving The Configuration File
Calibration Certificate. Zero and span the instrument. Loading the calibration file Acquire a calibration file for your instrument. You can get it from the LI-COR sup- port site (www.licor.com/env/support) under calibration information, or you can save it from the LI-7550 ( ). -
Page 123: Moving The Smartflux 2 System From One Irga To Another
Section 5. Configuring the eddy covariance system Moving the SmartFlux 2 System from one IRGA to another The SmartFlux 2 System can be moved from one IRGA to another, but doing so requires that you clear data from the SmartFlux 2 System first. Before moving it, copy any files that you want to keep. - Page 124 Section 5. Configuring the eddy covariance system 5-28 LI-7200RS Enclosed CO₂/H₂O Analyzer...
-
Page 125: Section 6. Viewing And Evaluating Data
Section 6. Viewing and evaluating data Real-time and recent data can be viewed in the software dashboard, including CO and H O measurements, wind speed measurements, and computed fluxes. Recent Biomet data can be checked under the tab. Biomet > Data See Dashboard on page 10-6 for details. -
Page 126: Logged Data Files
Section 6. Viewing and evaluating data Logged data files The SmartFlux 2 and 3 System records raw data and processed flux results to its USB drive. To retrieve the data, you can download it directly to a computer or you can eject the USB drive and copy files from it. - Page 127 Section 6. Viewing and evaluating data page 5-8), you may find some or all of the variables in Table 6-2 below in the data file. Typically, the file will include a smaller subset of variables. Table 6-2. Variables available for display and logging to the USB drive. Variable Description Time...
- Page 128 Section 6. Viewing and evaluating data Table 6-2. Variables available for display and logging to the USB drive. (...continued) Variable Description Diagnostic Value 2 Diagnostic value 0 or 1 (sync clocks) CO2 Signal Strength Signal Strength (S H2O Signal Strength O Signal Strength (S Average Signal Strength Delta Signal Strength...
-
Page 129: The Results Folder
Section 6. Viewing and evaluating data Table 6-2. Variables available for display and logging to the USB drive. (...continued) Variable Description CH4 (mmol/m molar density (LI-7700 required) CH4 Signal Strength (RSSI) RSSI value measured by the LI-7700 CH4 Diagnostic Value Diagnostic value output by the LI-7700 Horizontal wind speed (m/s) as measured toward the direction in line with the north spar, SmartFlux System... -
Page 130: The Images Folder
Viewing data in FluxSuite Software FluxSuite Software (fluxsuite.com) is a cloud-based application that provides near real-time access to site status information, processed flux results, biomet data, and images taken with a PhenoCam. Contact LI-COR or your distributor for more information. Automatic file management The USB drive has limited space, and with continuous data logging, it will get full if files are not removed from it periodically. -
Page 131: Copying Data Files From Usb Storage
Section 6. Viewing and evaluating data When the USB drive has <10% of space remaining, the SmartFlux System will either , or Stop logging Delete the oldest files from the Archive only Delete oldest files , depending upon the setting selected. Priorities for from Archive and then from Data automatic file deletion are given in Table 6-3 below. - Page 132 Section 6. Viewing and evaluating data instrument over a network. The utility is a component of the gas analyzer software. Click the button to launch it. Download The application should automatically connect to the instrument, but if it doesn't, click to view a list of instruments on the network.
-
Page 133: Using An Sftp Application
Section 6. Viewing and evaluating data This is where the transferred files will be saved. Ideally, this will be Destination: a directory on your computer. If you are transferring files to a server or cloud- based service such as a Dropbox, this is configured in the SmartFlux section of the application. -
Page 134: Viewing Raw Logged Data
Section 6. Viewing and evaluating data You will see all of the files in the file system. The files of interest are in a data folder. Viewing raw logged data To view raw data, copy raw data files from the SmartFlux System in one of two ways: connect the EC system to your computer or network and download the data using the gas analyzer PC application software, or eject the USB storage device from the SmartFlux System and connect it to your computer to read the data. - Page 135 Section 6. Viewing and evaluating data Figure 6-1. The file viewer plots raw data. Here it displays CO molar density and air tem- perature measurements covering a 24-hour period. The file viewer also provides options to export the dataset, which you can use at your discretion.
-
Page 136: In A Text Editor
Section 6. Viewing and evaluating data In a text editor To see text data, you can extract the data files from the compressed eddy covariance data. Copy the file of interest. Copy the files before modifying them so that you are not altering the original data. If you alter the original data, EddyPro may be unable to process it. -
Page 137: Viewing Processed Data From The Eddypro Output
Section 6. Viewing and evaluating data Viewing processed data from the EddyPro output Logged biomet data are processed by EddyPro, and in a typical eddy covariance sys- tem, these data will be recorded as 30 minute averages with flux data. The EddyPro output files include a file called something like eddypro_Demo_full-output_ . -
Page 138: Evaluating Long-Term Data In Tovi™ Software
Section 6. Viewing and evaluating data Evaluating long-term data in Tovi™ Software Tovi Software provides tools to evaluate and process the fluxes and biomet data that have been processed by EddyPro. For example, you can average redundant meas- urements, merge variables and gap fill with data from your site, gap fill with data from nearby weather stations, evaluate the quality of data, and use the biomet data to interpret flux results. -
Page 139: Section 7. Eddypro Processing On The Smartflux System
Section 7. EddyPro processing on the SmartFlux System , EddyPro uses pre-determined processing settings that are well Express Mode established and accepted in the research community. This approach dramatically reduces the need for user interaction, allowing you to get flux results with just a few clicks. -
Page 140: Express Processing
Section 7. EddyPro processing on the SmartFlux System Express processing EddyPro Express mode is the default configuration for the flux computation in the SmartFlux System. Express settings are loaded automatically unless you specify an EddyPro Advanced configuration file. Advanced processing Advanced Mode provides you with the high-level capabilities of EddyPro Advanced, computing fully corrected flux results in real-time with the processing options of your choice. -
Page 141: Configuring The Smartflux System
Section 7. EddyPro processing on the SmartFlux System Configuring the SmartFlux System ® SmartFlux Configuration mode inside the EddyPro Software is used to create an advanced configuration file for the SmartFlux System. To use this mode, check the box, and proceed through EddyPro as you normally would. - Page 142 Section 7. EddyPro processing on the SmartFlux System Set the Raw Data Directory to a .ghg file with metadata that applies to your site. Select variables and set flags as desired. Configure Advanced Settings (see Advanced processing on page 7-2). If you are creating the SmartFlux configuration file from an existing project: Click Open Project and select the project.
-
Page 143: Planar Fit, Spectral Corrections, And Timelag Optimization In The Smartflux System
Section 7. EddyPro processing on the SmartFlux System Planar fit, spectral corrections, and timelag optimization in the SmartFlux System In order to use planar-fit, in situ spectral corrections or timelag optimization in the SmartFlux System, EddyPro needs to access the respective _planar_fit_ _spec- , and... - Page 144 Section 7. EddyPro processing on the SmartFlux System Table 7-1. Recommended dataset durations for Advanced settings. EddyPro Advanced Setting Recommended Dataset Planar Fit Settings 2 weeks minimum; < 2 months Time Lag Optimization 1 to 2 months or more Spectral Corrections, Assessment of high frequency 1 month or more attenuation Thus, assuming that you have a sufficiently long .ghg dataset (Table 7-1 above), the...
-
Page 145: Advanced Processing Options
This is because inside SmartFlux, EddyPro does not need any of the information that is entered in the Project Creation page. The file type (LI-COR .ghg), the use of metadata (“embedded”) and the use of biomet data (“embedded”) are all pre- defined settings in the SmartFlux. - Page 146 Section 7. EddyPro processing on the SmartFlux System , which activates when the Time lag Optimization Settings... Automatic time option is chosen as a method, only gives lag optimization Time lag compensation option. If you want to use the automatic timelag optim- Time lag file available ization option in the SmartFlux System, you will have to load a previously created timelag optimization file at this time.
- Page 147 Section 7. EddyPro processing on the SmartFlux System However: In the , the method by Fratini et al. (2012) is Correction for low-pass filtering effects deactivated, because this method requires an auxiliary file that is currently not available in the SmartFlux System. If an in situ method is selected (Horst 1997 or Ibrom et al., 2007), only the option Spec- is active, similar to the planar fit and timelag optim-...
-
Page 148: Loading A Smartflux Configuration File
Section 7. EddyPro processing on the SmartFlux System Loading a SmartFlux configuration file Note: EddyPro Express settings are loaded by default. Only load a configuration file to use EddyPro Advanced settings. Create the SmartFlux configuration file created in EddyPro. Click the SmartFlux button. Select the tab, and click the . -
Page 149: Section 8. Troubleshooting
Section 8. Troubleshooting We address potential problems in this section. LI-7200/RS is identified as an LI-7500A/RS in the software interface This is caused by a bad or poorly-connected head thermocouple cable (the one that connects to the accessory connector on the LI-7550 box). Check and tighten the con- nection at the head and the LI-7550 box. -
Page 150: Problems With The Smartflux 2 System
Section 8. Troubleshooting nector is below 11.5 VDC, shorten the length of the power cable if possible, use a larger gauge cable, or boost the power supply voltage. Loose connection? Make sure the power cable connector is tight. Also check the cable for damage and the connections to the power supply. -
Page 151: System Not Connected To The Sonic Anemometer
(on the SmartFlux tab) or the reset button on the SmartFlux System. USB flash drive not working properly We recommend using a USB drive from LI-COR because it has been tested with the SmartFlux System. If you use a different USB drive, it should be industrial grade. If the USB LED blinks slowly (one time per second), this indicates an error. -
Page 152: Results Are Not Identical To Eddypro Desktop Results
We fix bugs as they are identified. Ensure that you are running the most up-to-date version of EddyPro and the SmartFlux System embedded software. Contact LI-COR tech- nical support (envsupport@licor.com) if you are unable to resolve the issue. -
Page 153: Instrument Not Visible In Software
Section 8. Troubleshooting Instrument not visible in software Firewall rules prohibiting the connection? Attempt to connect to the gas ana- lyzer using the RS-232 connection. If you are able to connect as expected, the problem may be related to your computer firewall settings. Create an exception that allows the gas analyzer through the firewall. -
Page 154: Parse Error
Section 8. Troubleshooting “Parse Error” Incompatible PC and instrument software? Update the PC application and embedded firmware on the instrument. Baud rate and update rate incompatible? In the window, the Baud Rate Connect menu is used to set the baud rate at which to communicate with the instrument. The rate of data transfer is also dependent upon the maximum rate available with your computer's serial port, and the update frequency to be used while the program communicates with the instrument. -
Page 155: Issues With Gas Analyzer Measurements
Section 8. Troubleshooting Issues with gas analyzer measurements Bad temperature readings Bad thermocouple? If the reading is -65 (or so), check the Diagnostics > General tab to see if both thermocouples (Inlet T and Outlet T) are working normally. Replace any bad thermocouples. Temperature source set incorrectly? You can select the source of temperature measurements, as described in Inputs on page 10-21. -
Page 156: Absorptances Make Sense, Densities Don't
LI-7200/RS > match the calibration sheet for the head. You can get Calibration > Coefficients your calibration information from the LI-COR web site. The Band Broadening coefficient should be 1.15. Absorptances make sense, densities don't If the absorptance value seems correct (rough rule of thumb: absorptance = 0 when density = 0, CO absorptance is about 0.1 with a mole fraction of about 400 ppm,... - Page 157 Section 8. Troubleshooting page 9-9, and the tubing between the gas analyzer and flow module. Examine the Tygon tubing for collapsed sections or kinks. If you are using a filter between the analyzer and the flow module, clean or replace the filter. Figure 8-2.
- Page 158 Section 8. Troubleshooting Figure 8-3. Power used (Watts) vs. blower drive (%) at numerous voltage inputs. During normal operation (15 SLPM), the flow module operates at about 25% blower drive. As the air filter gets clogged or if the air tubing is kinked, for example, the blower drive percentage rises, requiring more power.
-
Page 159: Gas Analyzer Diagnostics
Section 8. Troubleshooting Gas analyzer diagnostics Diagnostic information can help identify performance issues with the gas analyzer. Diagnostic value in data files The cell diagnostic value is a 2 byte unsigned integer (value between 0 and 8191) with the following bit map. See Gas analyzer diagnostics in EddyPro on page 8-16 to learn how these are treated in data processing. - Page 160 Section 8. Troubleshooting signal strength The raw reference signals A and A (for CO and H O, respectively) can be used for diagnostic purposes. A and A are insensitive to CO and H O concentrations, so if they are reduced, for example, it could be due to obstructions (dirt, pre- cipitation, etc.) in the optical path.
-
Page 161: Co2 Signal Strength
Section 8. Troubleshooting Average values of b and c are both 0.05 for the LI-7200RS, but the values for a par- ticular unit are found on its calibration sheet. Figure 8-4 below illustrates this func- tion by showing the range of responses for a large population of LI-7200RS instruments. -
Page 162: Delta Signal Strength
Section 8. Troubleshooting Two signal strength-based values are available from the LI-7200RS when using the Windows interface program. The instrument’s grammar also makes the individual values (S and S ) available for output. Delta signal strength Why Delta Signal Strength? The concern when checking a source strength diagnostic is “Is the optical cell clean?”... -
Page 163: Transfer Functions And Signal Processing
Section 8. Troubleshooting These assume contamination with a linear spectral response. As a practical matter, you should experiment at your installation to see if there is a consistent relation between Delta Signal Strength and calibration shift. Transfer functions and signal processing The LI-7550 Analyzer Interface Unit used with the LI-7200RS has a Digital Signal Processing (DSP) bandwidth that is selectable in the window. -
Page 164: Diagnostics In Eddypro On The Smartflux System
Section 8. Troubleshooting Diagnostics in EddyPro on the SmartFlux System Diagnostic information for the gas analyzer and sonic anemometer may be encoded in the data file. This information is then used by EddyPro to determine whether to use or discard the value. Details on EddyPro processing are provided in the EddyPro documentation. -
Page 165: Sonic Anemometer Diagnostics
Section 8. Troubleshooting Sonic anemometer diagnostics Diagnostics from sonic anemometers are encoded as described by the manufacturer, except for the CSAT3B. All anemometer diagnostics are summarized below. WindMaster/Pro The Gill WindMaster/Pro diagnostic tatus codes are logged in the dataset. EddyPro on the SmartFlux System either uses or excludes the data based on the status codes. - Page 166 Section 8. Troubleshooting Table 8-3. HS-50 diagnostics information Status Code Bit Value Description EddyPro Action No error Keep Transducer Pair 1 failed Discard Transducer Pair 2 failed Discard Transducer Pair 3 failed Discard Reserved Memory error Discard PRT failed Discard CSAT3 The Campbell Scientific, Inc.
- Page 167 Section 8. Troubleshooting Table 8-4. CSAT3 diagnostics information. EddyPro Value Description Action OK: When the diagnostics value is zero, data are OK. Keep 4096 Sonic signal amplitude is too low: There may be an Discard obstruction in the anemometer path or on the transducer face.
- Page 168 Section 8. Troubleshooting Table 8-5. CSAT3B diagnostics information. (...continued) EddyPro Value Description Action Internal humidity warning: The relative humidity inside Discard the CSAT3B block is greater than 80% Memory error: There is a signature mismatch from the Discard calibration file or another section of memory. METEK Diagnostic information from the METEK Class and Cage ultrasonic anemometers is encoded in the data file.
-
Page 169: Section 9. Maintenance
Section 9. Maintenance The section describes maintenance procedures for the gas analyzer and components. Cleaning the gas analyzer optical path Important: Power off the gas analyzer (disable the power supply or disconnect the power cable) before conducting any maintenance that involves disassembly or disconnecting cables. - Page 170 Section 9. Maintenance Important: The LI-7200RS detector is not affected by UV radiation when the optical path is open. The original LI-7200 detector, however, is affected by UV radiation. Exposure to direct sunlight temporarily reduces the sensitivity of the detector across all wavelengths, but it will not affect readings from the analyzer in most cases.
-
Page 171: Replacing Smartflux 2 System Fuses
Section 9. Maintenance Reassemble the sensor head and perform a zero and span calibration as described in User calibration on page 9-17. Replacing SmartFlux 2 System fuses Power for the SmartFlux System and the pass-through power supply are protected by fuses. This section describes how to replace a blown fuse. flows Pass-through power through the SmartFlux System to pins on ports 1, 2 and 3 to power a connected... - Page 172 Section 9. Maintenance 3.0 Amp fuse for pass-through power The SmartFlux System uses two 3.0 A fuses between the Power IN connector and the serial ports (see Figure 9-2 on the previous page). One of these fuses is for the power wire to the anemometer or other connected device.
-
Page 173: Replacing The Li-7550 Fuses
Replace the lid and six screws on the SmartFlux case. Important: A blown 1.0 A fuse may indicate a problem with the SmartFlux 2 or 3 System. If the spare 1.0 A fuse also fails when installed, contact LI-COR support. Replacing the LI-7550 fuses... -
Page 174: Accessory Fuse
They bottles should be recharged with fresh chemicals annually (or every 6 months in hot, humid climates). Replacement "charged" bottles are available from LI-COR in sets of three under part number 7200-950. If you want to recharge the bottles yourself, see Suppliers on page D-1, for a list of suppliers of Ascarite II and magnesium perchlorate. - Page 175 Section 9. Maintenance Figure 9-4. Remove the thumbscrew, thread it into the bottle covers, and then pull straight out to access the scrubbing bottles. Fill the bottles half full with Ascarite II first, followed by the mag- nesium perchlorate. Place the Teflon membrane in the lid to keep the chemicals from spilling into the detector housing.
-
Page 176: Cleaning The Intake Cap And Screen
Section 9. Maintenance Figure 9-6. Remove the upper sensor head housing bottle cover and replace the chemical bottle. Insert the bottle cap first. Replace the cover retention screw and reattach the mounting bracket. After installing, allow at least 24 hours (with the instrument powered on) to scrub the housing;... -
Page 177: Cleaning The 2-Micron Intake Filter
Section 9. Maintenance Carefully pull the screen out of the cap. Assembly is the reverse of removal. Be sure the screen is seated fully in the cap. Cleaning the 2-micron intake filter How do you know when to clean the filter? Dust will accumulate in the filter over time. -
Page 178: Replacing The Thermocouples
Section 9. Maintenance Replacing the thermocouples Important: Power off the gas analyzer (disable the power supply or disconnect the power cable) before conducting any maintenance that involves disassembly or disconnecting cables. Disassembling the instrument or detaching or attaching head cables while the instrument is powered on may damage the instrument or result in a loss of data. -
Page 179: Leak Test
Section 9. Maintenance the end of the board to remove the thermocouple assembly and discard (Figure 9-7 below). Make sure the two O-rings are present on the new board (one is tacked onto the thermocouple board; the other sits between the board and the opening), and insert the new assembly, making sure the two pins are inserted into the connector. -
Page 180: Flow Module Maintenance
The fuse in the flow module case can blow if power is applied with reverse polarity. Open the instrument case and unscrew the fuse cover to replace the fuse. The replacement fuse is a 5 A fast-blow, 125 V, 5x20 mm type, available from LI-COR under part number 439-04214. -
Page 181: Software Updates
Section 9. Maintenance Software updates Go to licor.com/7200rs-software for the latest versions. Update the all components in the system before deploying it. We recommend running the most current software at all times, including both the embedded and interface software for the LI-7500A/RS or LI-7200/RS, EddyPro, and embedded software on the SmartFlux System. -
Page 182: Embedded Instrument Software
Section 9. Maintenance Embedded instrument software To update the embedded instrument software: Make sure your gas analyzer sensor head is connected to the LI-7550 Analyzer Interface Unit. Power up the gas analyzer. Connect your computer to the system Ethernet switch (as shown) or to an open Ethernet port inside the LI-7550 using an Ethernet cable with standard RJ45 connectors. - Page 183 Section 9. Maintenance Select the gas analyzer from the list and click Update Software The update will take about 5 minutes. Important: Do not close the software, let your PC go to sleep, or power off the instrument during the update process. The software will notify you when the update is complete. If the update fails for any reason, repeat steps 2 and 3.
-
Page 184: Windows Interface Software Update
Section 9. Maintenance Windows interface software update To update the Windows interface software for gas analyzers: The Windows interface software is an executable file named something similar to LI-7x00_win- . Double click to launch the installer. Follow the Windows Installation wizard to install the application. SmartFlux 2 System software update To update the software: Save the SmartFlux software update package to your computer. -
Page 185: User Calibration
Section 9. Maintenance You may need to allow the updater to pass through your computer firewall. Your computer firewall may prompt you if required. All SmartFlux 2 and 3 Systems con- nected to your network will be visible in the window. After selecting system or entering the IP address, click Update Firmware The updater will load the new system files. -
Page 186: How Stable Are Zero And Span
Section 9. Maintenance How stable are zero and span? The analyzer's zero is primarily affected by temperature, and the state of the internal chemicals. The internal chemicals should be changed annually (see Replacing the internal chemicals on page 9-6). The zero's response to temperature is relatively small (typically 0.1 or 0.2 ppm per °C for CO , or 0.01 mmol/mol/°C for H O). -
Page 187: Checking The Span
Section 9. Maintenance desiccant is Drierite®, allow time for the CO to "wash out" of it). Use a small pump to push the air through the gas analyzer. Scrubber O Scrubber Particulate Filter To Air In When using a cylinder, make sure that the air in the cylinder really is CO -free since a typical cylinder of standard grade nitrogen might have as much as 20 ppm of CO in it. -
Page 188: Step-By-Step Calibration Instructions
Section 9. Maintenance Rotameter × 100 cc/min To Air In Regulator Span Gas For the water vapor span, a convenient standard to use is a dew point generator such as the LI-610. To avoid condensation problems choose a dew point temperature that is about 3 to 5 °C below the ambient temperature. - Page 189 Section 9. Maintenance Figure 9-9. Flow calibration gas into the Air IN port. Be very careful to not damage the inlet thermocouple when connecting the tubing. Attach 15 cm (6 in.) of tube to the outlet to prevent diffusion of ambient air into the analyzer. Clean the optical cell and reassemble it (see Cleaning the gas analyzer optical path on page 9-1).
- Page 190 Section 9. Maintenance After a brief delay, the displayed CO value should be fluctuating around zero. Check the value of Z shown on the tab. It should be near 1 (typically Manual between 0.85 and 1.1). This value will steadily increase over time (2-3 months) as the internal chemicals lose effectiveness.
-
Page 191: Considerations For Setting The Secondary Span
Section 9. Maintenance Span H To set the H O span, flow air of known dew point at about 0.5 to 1.0 LPM. To prevent condensation, use a dew point temperature several degrees below the ambient temperature. Click the tab, and note the present value of the H O Span value S Manual Go back to the... - Page 192 Section 9. Maintenance Secondary CO span Zero the CO reading (see Zero CO2 on page 9-21). Span the CO reading at a concentration below your normal operating range (some- thing in the 200-300 ppm range, see Span CO2 on page 9-22). Flow a CO concentration that is at or above your upper operating range (above 800 ppm, for example).
-
Page 193: What Actually Happens
Section 9. Maintenance What actually happens In the LI-7200RS, the zero and span parameters can be set in software. What actually happens when the zero is set is that the value of Z (or Z for water) is determ- ined. For example, when CO -free air is in the optical path of the analyzer, αc should be 0. - Page 194 Section 9. Maintenance Similarly, for a known H O mole fraction W’ and resulting measured absorptance, ɑ' Whenever the CO span is set, the instrument saves two values that are used if and when a secondary CO span is performed. These values are When a secondary span for CO is performed at a mole fraction C’...
-
Page 195: Section 10. Software Reference
Section 10. Software reference This section describes the connection options for configuring the instrument, fol- lowed by a description of the software features. The LI-7200RS can be configured from a computer that is running Windows 7 or newer. Connection options Launch the software to open the window, where you set the parameters for Connect... - Page 196 Section 10. Software reference Figure 10-2. Option 2: Connect to the Ethernet port on the exterior of the LI-7550 enclos- ure. Plug the other end (RJ45 connector) directly into a computer or computer network. If the instrument is powered on and connected to an Ethernet port on the same sub- net as your computer, its name will be displayed in the software.
- Page 197 Section 10. Software reference Note: We recommend that you always use the most up-to-date software and that your PC software and the instrument embedded firmware are compatible. Go to www.licor.com/env/support to get the latest instrument software. is the communication frequency between the instrument and the Update Rate computer.
-
Page 198: Connect Over Rs-232 Serial
Section 10. Software reference Connect over RS-232 serial The LI-7550 RS-232 port is configured as Data Terminal Equipment (DTE) with no hardware handshaking. It is bi-directional, meaning information can be transferred both into and out of the instrument. Note: You may need a USB to RS-232 adapter to use the serial connection. LI- COR part 6400-27 is a suitable adapter. - Page 199 Section 10. Software reference Select the communication baud rate for the serial port. The maximum update rate is dependent upon the rate available with your computer's serial port and the Update used while the program communicates with the instrument. Select from 9600, Rate 19200, 38400, 57600, or 115200.
-
Page 200: Run Disconnected
Section 10. Software reference Run disconnected The PC software can be used independently of an instrument by clicking on the tab and selecting the instrument. This can be useful for training pur- Disconnected poses, or for creating a configuration file that can then be saved and transferred to instruments in the field. -
Page 201: Instrument Information And Data Logging Status
Section 10. Software reference Instrument information and data logging status Information about the CO O gas analyzer is presented in this pane. Indicates the network name of the gas analyzer. Connected to: Serial number of the CO O analyzer sensor head. Head serial number: Indicates the model of the CO O analyzer. - Page 202 Section 10. Software reference ® Last half-hour flux processing run by Eddypro inside the SmartFlux Last Run: System. Gives the most recent date and time when data collection began. button: Starts a logging session. Start button: Stops a logging session. Stop button: Stops activity so the USB drive inside the LI-7550 can be safely Eject...
-
Page 203: Instrument Performance And Connection Status
Section 10. Software reference Instrument performance and connection status Instrument status information is presented in the status pane Note: The warning symbol ( ) indicates that the component is in need of atten- tion or that it is not communicating properly. Indicates the status of the CO O gas analyzer. -
Page 204: Graphs
Section 10. Software reference Graphs Click on one of the three tabs on the left side of the graphing pane. The Real Time tab provides real-time graphing of measured variables. The tab displays eddy Results covariance flux results from the SmartFlux System. The tab displays a graph of Wind wind speeds by direction. -
Page 205: Data Display
Section 10. Software reference Presents mean wind speed by direction. sets how many Wind speed: Duration days of data are displayed. Data display Measured variables are displayed on the right of the dashboard. To change a variable displayed click directly on a data value and select a new item from the Data Items menu. -
Page 206: Other Software Settings
Section 10. Software reference The variables available for display are given in on page 10-6. Other software settings This section describes features that have not been described elsewhere. Flow module options Under the flow module options, you can set the flow rate to the recommended 15 LPM and review other parameters. - Page 207 Section 10. Software reference Standard liters per minute. Measured flow (SLPM): Liters per minute; volumetric flow corrected for tem- Measured flow (LPM): perature and pressure). An indicator of blower pressure. Values can range from 0 to Pressure drop (kPa): 4.5, with 1.0 being typical. The value reflects resistance to flow, which can be caused by filters, collapsed tubing, or other obstructions.
-
Page 208: Flow Module Interior Control Panel
Section 10. Software reference Flow module interior control panel The flow module has a control panel and LED indicators. We recommend con- trolling the flow module using the software interface, but the hardware controls are available never-the-less. The current flow rate in mass flow units of Standard Measured Flow (SLPM): Liters Per Minute. -
Page 209: Settings
Section 10. Software reference Indicates whether the blower motor is on or off. Flow ON: Turns the blower motor on or off. Flow ON/OFF button: Press once to change the displayed parameter. The displayed para- Menu button: meter is indicated by the illuminated LED. Settings Under , you can set the instrument time, network configuration, send com-... - Page 210 Section 10. Software reference The software implementation of PTP provides accuracy in the 10 microsecond range. When used with the SmartFlux System, the GPS clocks will become the mas- ter clock for the system. About time keeping The LI-7500A/RS/DS and LI-7200/RS are network-based instruments and it is pos- sible for multiple users to log data from a single instrument over multiple TCP/IP connections.
- Page 211 Section 10. Software reference The gas analyzer searches the network and syncs to the most accurate Automatic: clock using the Best Master Clock algorithm (could be the gas analyzer). This set- ting should be used in most circumstances. The gas analyzer always syncs to another clock. It will search the net- Slave Only: work and synchronize to the best clock.
- Page 212 Section 10. Software reference Manual addressing You can connect to an instrument by manually enter the IPv4 Address or Hostname of the instrument. The IP address can be set automatically by a network or assigned manually in . If IPv6 (Internet Settings >...
- Page 213 A command line field is present that allows you to send a command to the instru- ment. This can be useful for diagnosing problems, as a LI-COR technician can gauge the instrument’s response to given commands, and determine if the instrument is functioning properly.
- Page 214 Section 10. Software reference Do not set the chopper housing temperature to 5 °C when ambient temperatures are above 5 °C, however, as the instrument will not function properly. Important: When changing between winter and summer settings, you will need to perform a zero and dual span calibration.
-
Page 215: Menu Overview
Section 10. Software reference Example: Start integrating CO (µmol/mol) after it reaches a value of 500 µmol mol , and continue integrating for 5 minutes. Choose from the Integration Channel list. CO2 (µmol/m Click button and enter 500 in the text entry field. Start when channel reaches Click the button and enter 300 (seconds) in the text entry field. - Page 216 Section 10. Software reference Temperature and pressure values are required to convert CO and H O density (mmol/m ) to mole fraction (µmol/mol or mmol/mol). In addition, the analyzer requires a pressure value to compute CO or H O mole density, and a temperature value to perform the band broadening correction for H O on CO In eddy covariance applications we recommend that you use temperature and pres-...
- Page 217 Section 10. Software reference where y is the sensor output, x is the voltage output of the sensor, b is the Y-axis intercept (offset), and m is the calibration multiplier, which is the slope of the line representing the sensor’s response. Outputs Five options are available under the outputs tab: Setup, RS-232, Ethernet, DACs, and SDM..
- Page 218 Section 10. Software reference Output bandwidth Bandwidth (5, 10 or 20 Hz) determines the signal averaging done by the digital fil- ter. To avoid aliasing (only a concern for co-spectra, not for fluxes), one should sample the gas analyzer at a frequency greater than or equal to 2 times the bandwidth.
- Page 219 Section 10. Software reference the instrument's ability to measure the full oscillation amplitude diminishes as the oscillation frequency increases. Note: The bandwidth selection has no impact on the system delay. The filters were designed so they have exactly the same delay whether a 5, 10, or 20 Hz signal bandwidth is selected.
- Page 220 Section 10. Software reference Note on Data Output Rates When sending data via a serial connection (e.g., RS-232), note that the baud rate selected may limit the number of samples that can be output. A single line of data (all log values selected) consists of approximately 350 bytes (2800 bits), so the max- imum output rate at the available baud rates becomes: Baud Rate Maximum Output Rate (Samples per Second)
- Page 221 Section 10. Software reference Use the menu to select from 0.1, 0.2, 0.5, 0, 1, 2, 5, 10, or 20 Hz. Update Rate Under , you can choose whether or not to output labels with each data Options record, whether to output diagnostic text records, and whether to use verbose mode. An example of a data record sent with and without labels is shown below.
- Page 222 Section 10. Software reference For example, to configure DAC #1 to output a voltage signal proportional to CO mmol/m , 20 mmol/m full scale, select CO mmol/m under DAC1 'Source', and set 0V = 0, and 5V = 20. 0V → 0(X , zero volts corresponds to 0 mmol/m 5V →...
- Page 223 Section 10. Software reference Below is a programming example of the LI7200 instruction used to collect data from an LI-7200RS at SDM address 0: LI7200 (LI-7200(),1,0,6) Table 10-1. Parameter 4 value definitions. Mode Items Sent dry (µmol/mol) O dry (mmol/mol) (mmol/m O (mmol/m (kPa)
- Page 224 Section 10. Software reference Table 10-1. Parameter 4 value definitions. (...continued) Mode Items Sent (mmol/m O (mmol/m absorptance O absorptance Signal Strength (average) (kPa) total (°C) (°C) Block Temperature (°C) Diagnostic value (see below) Aux channel #1 (user units) dry (µmol/mol) O dry (mmol/mol) Signal Strength (average) Cell Temperature (°C)
-
Page 225: Calibration Window
Section 10. Software reference increased in increments of 1/150 seconds (6.667 ms), to minimize offsets between the gas analyzer and other sensors. For example, suppose you are sampling (via SDM output) the LI-7500A/RS or LI- 7200/RS with a Campbell Scientific CR5000 datalogger at 10 Hz (0.1 s). Setting the delay count of the gas analyzer to 25 yields a total delay of 0.297 seconds, which means the data will have a delay of 3 execution intervals (0.297 s/0.1 s), which the logger can allow for when synchronizing the data to the sonic anemometer or other... - Page 226 Section 10. Software reference A green flag indicates that it is OK to perform the calibration A red ‘X’ indicates that it is not OK to perform the calibration; wait until the red ‘X’ changes to a green flag before performing the calibration. Zero, Span, and Span 2 tabs Step-by-step instructions for calibrating the gas analyzer can be found in User cal- ibration on page 9-17.
- Page 227 Section 10. Software reference See CO2 signal strength on page 8-12 for more information. Coefficients tab tab displays factory-determined calibration coefficients, a factor for Coefficients correcting CO measurements for band broadening due to the presence of water vapor (A), and a zero drift correction factor (Z). The coefficient shown as XS (cross sensitivity) compensates for slight cross sensitivity between CO and H O signals...
- Page 228 Section 10. Software reference Note: The easiest way to get the calibration coefficients, zero, and span updated for a sensor head is to save the configuration (it is a *.7x file) and then upload the file to a different LI-7550 using Open Configuration Manual tab tab displays current values for CO...
- Page 229 Section 10. Software reference History tab displays a list of previous calibration backup files generated during a History zero and/or span calibration of the instrument (when used with the same computer used to connect to the instrument). You can click on any previous calibration in the list to view the details;...
-
Page 230: Pc Logging
Section 10. Software reference PC logging The PC Logging window is used to configure the data out- put parameters used while the LI-7500A/RS/DS or LI- 7200/RS Windows software is active. Data are logged to a file on your computer. You can specify the destination file, update rate, file duration, comments, and values to be logged. -
Page 231: Diagnostics
Section 10. Software reference Note on data output rates When sending data via a serial connection (e.g. RS-232), note that the baud rate selected will limit the number of samples that can be output. A single line of data (all Log Values selected) consists of approximately 350 bytes (2800 bits), so the max- imum output rate at the available baud rates becomes: Baud Rate Maximum Output Rate (Samples per Second) - Page 232 Section 10. Software reference Status tab Diagnostic indicators for the Sync Flag, PLL, Detector Temperature, and Chopper Temperature will read either Service Reports the Embedded version, DSP version, and FPGA ver- Instrument Software: sion. For diagnostic purposes. : Displays the model of the sensor head currently connected to the LI-7550 Ana- Head lyzer Interface Unit.
- Page 233 Test Points points. Though primarily for LI-COR technician reference, values outside of the nor- mal range may give you an indication of where problems may be originating. Diagnostics...
- Page 234 Section 10. Software reference Test Point Description Normal range IR A/D (V) Voltage from IRGA being sent to 0.2 – 4.8 V A/D converter Detector Temp (V) Detector temperature voltage 2.9 V. Readings near +5 V or 0 V are normal for a few seconds after power Aux Ref + 16-bit conversion of positive...
- Page 235 Waveform Though primarily for LI-COR technician reference, if problems are encountered, it may be useful to log the waveform data for troubleshooting purposes. Waveform data can only be logged when the window is open.
- Page 236 Section 10. Software reference SmartFlux SmartFlux System diagnostics are supported by the combined release of win-GHG interface software v8.8.36 and SmartFlux 2/3 System embedded firmware v2.2.50. This feature serves to summarize the system performance by providing status indic- ators for components and configurations, allowing you to evaluate the system at a glance.
- Page 237 Advanced tab provides several maintenance and recovery Diagnostics > Advanced options. These options should be used only after consultation with LI-COR technical support or careful consideration, as all of theses actions except for Reboot SmartFlux will permanently remove data from the device. Once data are removed from the USB device, they cannot be recovered.
-
Page 238: Charting
Section 10. Software reference this when the SmartFlux internal database is too large or the internal memory has filled up. will clear data from the USB drive in the Format SmartFlux USB Drive SmartFlux System. Use this when having problems with USB data logging or if manually deleting old files is taking too long. - Page 239 Section 10. Software reference time on the X-Axis. Time on the X-Axis can be displayed over user-defined values of seconds or minutes; the X-Axis Max value defines the unit of time displayed in the window before the window starts scrolling the time value off the right edge. Choose the value for the Y-Axis Left and/or Y-Axis Right in the menu(s), and enter values for the Y-Axis maximum and minimum;...
-
Page 240: Configuration Files
Section 10. Software reference Configuration files The instrument uses a configuration file to store parameters of the configuration, including the setup information, instrument settings, calibration coefficients, and zero and span values, and logging configuration. Unique configuration files can be set up, saved, and then re-opened to easily change your setup information. When the software program is started for the first time, a default set of parameters is loaded, which can be modified and saved as a new configuration file with a different name. -
Page 241: Section 11. Theory Of Operation
Section 11. Theory of operation Relating absorption to concentration The scaling law of Jaimeson et. al., (1963) shows the effect of pressure on infrared absorption. If the amount of absorber of some gas u (mol m ) and absorption in a band are related by some function h (), then 11-1... - Page 242 Section 11. Theory of operation “known densities”, the ρ values are computed from known concentrations m (moles of gas per mole of air) using the ideal gas law 11-4 Measuring absorptance Given a source with radiant power Φ , and a detector some distance away, in the absence of reflection, absorptance by gas i can be determined from 11-5 where...
- Page 243 Section 11. Theory of operation Cross sensitivity Because the instrument uses one detector for measuring A , and A , (the absorbed and non-absorbed power for CO and H O, respectively), there is a slight cross-sensitivity between gases due to imperfections in the detector's frequency (time) response.
- Page 244 H O. Since the concentration of H O is most variable, it must be accounted for in the equivalent pressure of P . A method of doing this (LI-COR Application Note #116) is 11-16 P is pressure, α is the band broadening coefficient, and m is the mole fraction of water vapor.
- Page 245 Section 11. Theory of operation where b , and b are constants ( , and on the calibration sheet) O SD1 and V is cooler voltage. Uncorrected absorptance, α* , is given by 11-18 where A and A are raw signals from the CO absorption and reference bands, X is the cross sensitivity coefficient for water on CO on the calibration...
- Page 246 Section 11. Theory of operation Table 11-1. Fundamental equations used in the LI-7200RS calculations. (...continued) Label Description Equation O mmol/mol O mole fraction 11-22 O dry O dry mole 11-23 mmol/mol fraction Dew Point (°C) Dew point 11-24 temperature 11-25 mmol/m number density 11-26...
- Page 247 Section 11. Theory of operation at a flow rate of 12-17 lpm. In the event that one of the thermocouples (T or T should fail, the instrument will automatically ignore output from the broken ther- mocouple and use only the functioning thermocouple to compute T cell Pressure is measured by sampling an absolute pressure sensor in the LI-7550 (Box Pressure, kPa) and a fast differential pressure sensor in the sensor head (Head Pres-...
- Page 248 Section 11. Theory of operation 11-8 LI-7200RS Enclosed CO₂/H₂O Analyzer...
-
Page 249: Appendix A. Sonic Anemometer Connection Options
Appendix A. Sonic anemometer connection options This section describes how to connect with some anemometers using the optional USB cable. It also describes additional wiring options for anemometers. USB connections for configuration You can connect a sonic anemometer to a computer to view the firmware version, settings, and troubleshooting. - Page 250 Appendix A. Sonic anemometer connection options Table A-1. Data wire leads to connect together when connecting the USB adapter (part number 392-16348) to the WindMaster/Pro cable. USB Cable connects to Anemometer Cable White (RX-) connects to White/Green (TX-) Yellow (RX+) connects to Green (TX+) Red (TX-)
- Page 251 Appendix A. Sonic anemometer connection options CSAT3B and CSAT3 Important: Do not leave the USB cable connected to the anemometer during nor- mal use. Failure to disconnect the cable may result in communication problems and data loss. Use the from Campbell Scientific to configure the Device Configuration Utility CSAT3 and CSAT3B.
- Page 252 Appendix A. Sonic anemometer connection options Power to the anemometer can be provide through the SmartFlux System. The black lead from the USB cable must be connected to ground, such as terminal 2 on the SmartFlux System. LI-7200RS Enclosed CO₂/H₂O Analyzer...
- Page 253 Appendix A. Sonic anemometer connection options HS-50 or HS-100 Important: Do not leave the USB cable connected to the anemometer during nor- mal use. Failure to disconnect the cable may result in communication problems and data loss. Use the suitable version of software from Gill or a terminal program such as Wind .
- Page 254 Appendix A. Sonic anemometer connection options Table A-5. Power to the anemometer is provide through the SmartFlux System power terminals. The black lead from the USB cable must be connected to ground, such as terminal 2 on the SmartFlux System. USB Cable Anemometer Cable connects to...
- Page 255 Appendix A. Sonic anemometer connection options RM Young You can connect the anemometer to a computer to view the firmware version and settings for troubleshooting. Important: Do not leave the USB cable connected to the anemometer during nor- mal use. Failure to disconnect the cable may result in communication problems and data loss.
- Page 256 Appendix A. Sonic anemometer connection options Table A-7. Power to the anemometer can be provide through the SmartFlux System. The black lead from the USB cable must be connected to ground, such as terminal 2 on the SmartFlux System. USB Cable Anemometer Cable connects to SmartFlux...
-
Page 257: Additional Digital Data Cable Options
The SmartFlux 2 and 3 System features two 9-pin and one 11-pin UART (Universal Asynchronous Receiver/Transmitter) serial ports. The green terminal strips are made by Phoenix Contact. Serial Port Terminal Strips LI-COR Part # Phoenix Part # Port 1 11-pin 3.5 mm pitch 331-15378... - Page 258 CSAT3 The CSAT3 can be connected to a SmartFlux 2 or 3 System with a LI-COR RS-232 cable and a CSAT3 Power cable. Option 1 The 7900-454 cable will allow RS-232 signaling to function properly at 50 meters as long as the voltage drop in the power return wire is less than about 1 volt.
- Page 259 Appendix A. Sonic anemometer connection options Table A-8. Pin assignments for a CSAT3 sonic anemometer using a CSAT3CBL3-L power cable and LI-COR RS-232 cable. LI-COR 7900- CSAT3 10-Pin CSAT3 6-Pin SmartFlux 2 CSAT3CBL3-L 454 RS-232 RS-232 Power Port 1 power cable...
- Page 260 CSAT3BCBL2 will work best as it has heavier conductors and no unused wires. The RS-485 cable is CSAT3BCBL3. These are Campbell cable part numbers. These cables can be ordered in custom lengths from Campbell. These cables can also be supplied by LI-COR. A-12 LI-7200RS Enclosed CO₂/H₂O Analyzer...
- Page 261 Appendix A. Sonic anemometer connection options Table A-10. Pin assignments for a CSAT3B sonic anemometer, using Campbell RS- 485 cables. CSAT3BCL3, CPI/RS- CSAT3BCL3, CSAT3BCBL1, SmartFLux 7900-464, Power/SDM 7900-464, CSAT3BCBL2, 2 Port 1, 2, CPI/RS-485 Connector Connector CPI/RS-485 7900-462 or 3 Signal Pin Number cable...
- Page 262 Appendix A. Sonic anemometer connection options if the PCI is not needed. Creating an adapter allows the use of an existing 1086-M- 043 Anemometer Cable without modifying the cable. See the Gill HS-50 Horizontally Symmetrical Ultrasonic Research Anemometer User Manual (page 47, Section 13.2, Connector Pin Assignments). An adapter can be made using a DB-15 cable or plug with pins for short distances (about 5 m).
- Page 263 DB-15 connector can be ordered from Gill (part num- ber 1086-10-118). The Gill 1086-10-118 cable can be ordered from LI-COR. Strip the insulation back from the conductors of the cable end about 5 mm to connect straight into the SmartFlux 2 or 3 connector.
- Page 264 Note: In this cable, Gill uses the standard convention of Tx+, Tx-, Rx+, and Rx-. The Tx and Rx labels are crossed in the cable diagram. Table A-13. Pin assignments for a Gill HS-50 sonic anemometer (option 3) using a modified Gill 1086-M-043, unmodified 1086-10-118 (LI-COR 7900-445). HS-50 Hirose 20-Position SmartFlux 2 HS-50 DB-15;...
- Page 265 Appendix A. Sonic anemometer connection options Table A-14. Pin assignments for a Gill HS-50 sonic anemometer (option 4) using a dongle to a Gill 1086-M-043 anemometer cable. Quabbin HS-50 Db- HS-50 DB- HS-50 Hirose 20- SmartFlux 2 DataMax 15 Pin 15;...
- Page 266 Appendix A. Sonic anemometer connection options A-18 LI-7200RS Enclosed CO₂/H₂O Analyzer...
- Page 267 Appendix B. 7550-101 Auxiliary Sensor Interface The optional Auxiliary Sensor Interface (ASI) is an O-ring sealed, weatherproof junc- tion box that can be used to connect analog inputs and/or outputs. It has con- nections for up to six analog outputs, four general purpose analog inputs, and a constant 5 VDC source (5 mA maximum).
- Page 268 Appendix B. 7550-101 Auxiliary Sensor Interface do not want to use the mounting plate, remove the two screws that hold the mount- ing bracket and secure it however you want. Figure B-2. Orient the gland plugs toward the ground to prevent water ingress. Terminal connections Terminal positions for are:...
- Page 269 Appendix B. 7550-101 Auxiliary Sensor Interface Terminal Analog Inputs Description AUX1+ Auxiliary Input 1 positive AUX1- Auxiliary Input 1 negative Ground AUX2+ Auxiliary Input 2 positive AUX2- Auxiliary Input 2 negative Ground AUX3+ Auxiliary Input 3 positive AUX3- Auxiliary Input 3 negative AUX4+ Auxiliary Input 4 positive Ground...
- Page 270 Appendix B. 7550-101 Auxiliary Sensor Interface Electrical connections All analog devices connected to the ASI must be referenced to the ground (GND) connection; some examples are shown below. All auxiliary analog input ground connections are internally connected together. All auxiliary analog output ground connections are internally connected together.
-
Page 271: Appendix B. 7550-101 Auxiliary Sensor Interface
Appendix B. 7550-101 Auxiliary Sensor Interface Remove the Philips screws from the corners of the ASI and remove the top cover. Remove the cap from a gland plug. Pass the wires through the cap and then through the gland plug. Insert the wire leads into the appropriate terminals. - Page 272 Appendix B. 7550-101 Auxiliary Sensor Interface LI-7200RS Enclosed CO₂/H₂O Analyzer...
-
Page 273: Appendix C. Pin Assignments
Appendix C. Pin assignments The LI-7550 pin assignments are given on the case interior label. The label also gives LED blink patterns for the LI-7550 USB port. LI-7200RS Enclosed CO₂/H₂O Analyzer... - Page 274 Appendix C. Pin assignments DB-9 connector on RS-232 serial cable The serial cable (part number 392-10268) has a round connector that attaches to the LI-7550 and a female DB-9 connector that attaches to a computer. Note that not all pins are used for communication between the LI-7550 and a computer. LI-7200RS Enclosed CO₂/H₂O Analyzer...
-
Page 275: Appendix D. Suppliers
The company names, addresses, and phone numbers are the most current we have at the time of this printing. In some cases the information may change without notice. Chemical sources Material LI-COR Part Number Ascarite II, 500 g 9970-022 Magnesium Perchlorate, 2 kg... - Page 276 OCP Group Inc 7130 Engineer Rd San Diego, CA 92111 Phone: 858-279-7400 www.ocp.com LI-COR Part Cable Cable Connector OCP Part Number Number 392-13984 19-pin head 19-pin male to Specify LI-COR 392-13984 cable female and the length you prefer LI-7200RS Enclosed CO₂/H₂O Analyzer...
- Page 277 16 GB industrial grade drives are available directly from LI-COR. Contact us for more information. LI-COR Part Number: 616-10723. NOTE: The USB flash drive listed below has been tested by LI-COR; if you want to use other drives in the LI-7550, please contact LI-COR for more information.
- Page 278 Appendix D. Suppliers LI-7200RS Enclosed CO₂/H₂O Analyzer...
-
Page 279: Appendix E. Configuration Grammar
Appendix E. Configuration grammar Note: This grammar supports the core features of the instrument, but some func- tions are not fully described. Contact us if you have questions. This section describes the protocol used by the instrument to communicate via RS- 232 and Ethernet, for both configuration and data output purposes. - Page 280 Appendix E. Configuration grammar (Outputs(RS232(Freq 10)(Pres TRUE))(BW 5)) In this case, we are setting the RS-232 output frequency to 10Hz, requesting that Pressure be included in the output records, and that the bandwidth be 5 Hz. Notice the 2 parentheses at the end of .
- Page 281 Appendix E. Configuration grammar record acknowledges a configuration change. It is also used to pass back the new zero or span setting after a command. (Calibrate..) Command summary In the following sections, some abbreviations are used: {int} means an integer value, such as 0, 10, 452, etc. {float} means any integer or floating point value, such as 0, 3.14159, 1E-7, -3.47e-09, etc.
- Page 282 Appendix E. Configuration grammar Command Subcommands Remarks (Outputs (RS232 (Baud {9600 | 19200 | 38400}) Baud rate for RS-232 (Freq {float}) Output frequency of (Data..) records in Hz. Usable values: 0.0 thru 20.0 (Labels {bool}) (DiagRec {bool}) (EOL {"hex code(s)"}) User defined termination character (s) for data record in...
- Page 283 Appendix E. Configuration grammar Command Subcommands (Metadata (Log {bool}) (Site (site_name {string}) (altitude {float}) (gpsformat {DDD MM SS.SSS | DDD MM.MMM | Decimal Degrees}) (latitude {+|- xxxd xx' xx.xxx"} | {+|- xxxd xx.xxx'} | {+|- xxx.xxxx} (longitude {+|- xxxd xx' xx.xxx"} | {+|- xxxd xx.xxx'} | {+|- xxx.xxxx} (canopy_height {float})
- Page 284 Appendix E. Configuration grammar (EOL "{hex code(s)"}) End of Line character. Enter hex value in double quotes. Example: (Outputs(RS232(EOL "0D0A”)))lf would terminate data strings with a carriage return and a line feed. (Ndx {bool}) Determines whether an index value is transmitted or not. Example: (Outputs(RS232(Ndx TRUE)))lf would cause the data stream to contain an index value.
- Page 285 Appendix E. Configuration grammar Example: Transmitted: (Outputs(RS232(DiagVal TRUE)))lf Received: (Data... (Diag 249...)) NOTE: The (DiagRec and the (DiagVal are two separate outputs and are inde- pendent of one another. (Labels {bool}) This command controls whether or not data labels are transmitted with the data stream.
- Page 286 Appendix E. Configuration grammar EXAMPLE (Labels FALSE) Data format Notice how this format is much cleaner and reduces the overhead of redundant label transmissions. The data selected for output data record is accomplished with the (Outputs(RS232(CO2Raw TRUE)...)) command. Transmitted to the instrument (Outputs(RS232(Freq 1)(EOL "0D0A")(Ndx TRUE)(DiagRec FALSE)(DiagVal TRUE)(Labels FALSE)))lf Received from the instrument...
- Page 287 Appendix E. Configuration grammar determine the termination characters and whether or not labels {boolean}) (Data are output. Table E-2. Data and Diagnostic Records Record Subcommands Remarks (Data (Ndx {int}) Index value. Increments by 150 The values included are every second. set by (Outputs(...)).
- Page 288 Appendix E. Configuration grammar Table E-2. Data and Diagnostic Records (...continued) Record Subcommands Remarks (Data (CO2AW {float}) Source The values included are set by (Outputs(...)). How (CO2AWO {float}) Reference often this is output is (CO2Raw {float}) absorptance determined by (Outputs (CO2D {float}) density (mmol m (Freq...)).
- Page 289 Appendix E. Configuration grammar Record Subcommands Remarks (Diagnostics (Path {float}) Average Signal Strength (0-100) Diagnostics are always output at 1 Hz (Synch Synch (always true) {bool}) (PLL {bool}) Phase lock loop status (DetOK Detector temperature control {bool}) (Chopper Chopper temperature control {bool}) (PDif {bool}) Differential pressure...
- Page 290 Appendix E. Configuration grammar Examples: A typical (Data..) output record, with all items present, is shown below: (Data (Ndx 215713)(CO2Raw 1.2831902e-1)(CO2D 2.2083146e1)(H2ORaw 5.5372476e-2)(H2OD 3.5485935e2)(Temp 2.5886261e1)(Pres 9.8157062e1) (Aux 0)(Cooler 1.0537354)) A typical (Diagnostics..) record is shown below: (Diagnostics (Sync TRUE)(PLL TRUE)(DetOK TRUE)(Chopper TRUE)(Path 63)) Data polling (software and hardware) A software command using the ENQ character (0x05) is available to query the instru- ment for a data record over RS-232.
- Page 291 Data are updated to RS-232 at 20 Hz. If the CTS line is toggled, record will be out- put the next time one is ready. The CTS line is pin 7 on the LI-COR RS-232 Cable, part number 392-10268. The RS-232 serial pin-out from a DB9 connector on an AT...
- Page 292 Appendix E. Configuration grammar Note about embedded software RS-232 communication priorities The RS-232 hardware and software trigger does not tap directly into the same data stream that is output to the DAC's and the SDM. The trigger actually sends a request to the instrument to output a single data record over the RS-232 port.
- Page 293 Appendix E. Configuration grammar (Inputs(Pressure(Source UserEntered)(Val 92))) To measure temperature from a linearized thermistor connected to the Auxiliary input, where 0 volts is 0 °C, and 5 volts is 50 °C, send this: (Inputs(Aux(A 10)(B 0))(Temperature(Source Aux))) To measure pressure and temperature normally, using the built-in sensors, send this: (Inputs(Pressure(Source Measured))(Temperature(Source Measured))) The (Calibrate...) and (Coeffs...) commands commands control zeroing, spanning, and...
- Page 294 Appendix E. Configuration grammar Table E-4. Calibration Commands. Command Subcommands Remark (Calibrate (ZeroH2O (Val {float}) For setting the zero directly. If not (ZeroCO2 present will trigger a calibration. (Date The date field triggers the {quoted instrument to do a zero string}) immediately.
- Page 295 Appendix E. Configuration grammar Command Subcommands Remark (Coeffs (Current (SerialNo {quoted string}) The 72H-xxxx head number. (Band (A {float})) The band broadening coefficient (1.15). (CO2 (A {float}) These values are found on the (B {float}) calibration sheet. (C {float}) SD1, SD2, and SD3 (D {float}) are b1, b2, and b3 (E {float})
- Page 296 Appendix E. Configuration grammar If the temperature is 23°C, and the pressure 98kPa, then the mode density is 15.92 mmol CO . Then send the following: (Calibrate(SpanCO2(Target 400)(Tdensity 15.92)(Date "14 Sept 2015"))) The Program Reset command is the equivalent of pressing the reset button on the main (Program(Reset TRUE)) board.
- Page 297 Appendix E. Configuration grammar The Flow Module command Table E-7. Flow Module Commands Record Subcommands Remarks (FlowBox (BusAddress {int}) Communication address of Flow Module (32 to 255) (State {0|1} 0: Flow On, 1: Flow Off (SetFlowRate {float}) Set flow module output, SLPM (MeasFlowRate {float}) Read Only –...
- Page 298 Appendix E. Configuration grammar whereas the query (Calibrate ?)lf causes a Calibrate record to be put in the output queue. Example Response: (Calibrate (ZeroCO2 (Val 0.8945)(Date 26 08 2009 10:37))(SpanCO2 (Val 1.0068)(Target 597.2)(Tdensity 23.154)(Date 26 08 2009 11:00)) (Span2CO2 (Val 0.0)(Target )(Tdensity )(ic 0.106207)(act 0.105489) (Date 4Cal))(ZeroH2O (Val 0.791075)(Date 26 08 2009 11:20))(SpanH2O (Val 1.00585)(Target 12.00)(Tdensity 447.421)(Date 26 08 2009 11:37))(Span2H2O (Val 0.0)(Target )(Tdensity )(iw 0.059434)(awt...
- Page 299 Appendix E. Configuration grammar Example Response: (Coef (Current (SerialNo 75H-Beta6)(Band (A 1.15))(CO2 (A 1.56704E+2) (B 2.15457E+4)(C 4.33894E+7)(D -1.24699E+10)(E 1.75102E+12)(XS 0.0023)(Z 0.0002))(H2O (A 5.24232E+3)(B 3.91896E+6)(C -2.33026E+8) (XS -0.0009)(Z 0.0185))(Pressure (A0 56.129)(A1 15.250))(DPressure (A0 1.0)(A1 0.0)))) (Outputs ?)lf causes a Outputs record to be put in the output queue. Example Response: (Outputs (BW 10)(Delay 0)(SDM (Address 7))(Dac1 (Source NONE)(Zero - 5e-2)(Full 4e-1))(Dac2 (Source PRESSURE)(Zero -1e-1)(Full 4e-1))
- Page 300 Appendix E. Configuration grammar Example Response: (Data (Ndx 2471)(DiagVal 250)(CO2Raw 1.6319131e-1)(CO2D 3.5119712e1) (H2ORaw 3.1672954e-2)(H2OD 1.7067077e2)(Temp 2.3874512e1)(Pres 9.8735609e1)(Aux 0)(Cooler 1.5630015)) (Diagnostics ?)lf causes a Diagnostics record to be put in the output queue. Example Response: (Diagnostics (SYNC TRUE)(PLL TRUE)(DetOK TRUE)(Chopper TRUE)(Path 65)) (EmbeddedSW ?)lf causes an EmbeddedSW record to be put in the output queue.
- Page 301 Appendix E. Configuration grammar The MeteoSensors command (biomet sensors) Command Subcommands Remarks (MeteoSensors(Sensor (Name {string}) ) Name of sensor, Defined in Coms Tag (Type {int}) Type of sensor (Units {int}) Units The connection protocol The purpose of this section is to describe the protocol used to establish com- munications with the instrument when it is operating in an “unknown”...
- Page 302 Appendix E. Configuration grammar E-24 LI-7200RS Enclosed CO₂/H₂O Analyzer...
-
Page 303: Appendix F. Specifications
Appendix F. Specifications Measurements Calibration Range: 0 to 3000 µmol mol Accuracy: Within 1% of reading Zero Drift (per °C): ±0.1 ppm typical; ±0.3 ppm maximum RMS Noise (typical @ 370 ppm CO @5 Hz: 0.08 ppm @10 Hz: 0.11 ppm @20 Hz: 0.16 ppm Gain Drift (% of reading per °C @ 370 ppm): ±0.02% typical;... - Page 304 Appendix F. Specifications General Fundamental Gas Sampling Rate: 150 Hz Bandwidth: 5, 10, or 20 Hz; software selectable Type: Absolute, non-dispersive infrared gas analyzer Detector: Thermoelectrically cooled lead selenide Path Length: 12.5 cm (4.72") Optical Cell Volume: 16 cm Optical Cell Thermocouples (Input and Output): Max.
- Page 305 Appendix F. Specifications Weight: Head: 1.8 kg (3.95 lb.) LI-7550 and Cables: 4.4 kg (10 lb.) Dimensions: Head: Diameter 7.5 cm, Length 31 cm LI-7550 Analyzer Interface Unit: 35 cm × 30 cm × 15 cm Head Cable: 5 meters. Can be extended to 10 meters Other Cables: 5 meters Appendix F.
- Page 306 Appendix F. Specifications Gas analyzer head dimensions LI-7550 and Flow Module dimensions The LI-7550 and 7200-101 flow module have the same dimensions. The flow module requires additional clearence to allow the tube fittings. LI-7200RS Enclosed CO₂/H₂O Analyzer...
- Page 307 Appendix F. Specifications Appendix F. Specifications...
- Page 308 Appendix F. Specifications Flow Module (7200-101 and 7200-102) Flow Rate Settings: 10-18 SLPM (standard liters per minute) setpoint mode or con- stant blower drive mode. Blower Pressure: 3.5 kPa minimum at 100% blower drive at 101.3 kPa and 27 °C ambient.
- Page 309 Appendix F. Specifications Heated Intake Tube Input Voltage: 10.5 - 30 V Total Output Wattage: 0.1 W to 6 W (Heat density ratio: 2:1 short tube to long tube) Operating Temperature Range: -40 °C to 50 °C Data Communication Protocol: RS-485 Intake Tube Inside Diameter: 5.33 mm (0.21”) Intake Tube Outside Diameter: 6.35 mm (0.25”) Intake Tube Length: 71.1 cm (28”)
- Page 310 Appendix F. Specifications Relative Humidity Range: 0 to 95% (non-condensing) Input Voltage: 10 to 30 VDC Power Consumption: 1.5 watts typical (3.5 watts maximum; excluding pass- through power) Max Current Passed Through to the Anemometer: 2 A Dimensions with DIN Clip: 149 x 100 x 37 mm (L×W×H) Weight with GPS Antenna: 1.32 lb.
- Page 311 Appendix F. Specifications Appendix F. Specifications...
- Page 312 Appendix F. Specifications F-10 LI-7200RS Enclosed CO₂/H₂O Analyzer...
- Page 313 No-charge repair parts may be sent at LI-COR, Inc.'s sole discretion to the purchaser for install- ation by purchaser. LI-COR, Inc.'s liability is limited to repair or replace any part of the instrument without charge if LI- COR, Inc.'s examination disclosed that part to have been defective in material or workmanship.
- Page 314 The foregoing constitutes LI-COR, Inc.'s sole obligation and liability with respect to damages resulting from the use or performance of the instrument and in no event shall LI-COR, Inc. or its representatives be liable for damages beyond the price paid for the instrument, or for direct, incidental or con- sequential damages.
- Page 315 Appendix H. Index cables 7900-050, 2-10, 2-10 connection panel, 1-6 7900-126, 2-10 custom lengths, D-1 7900-235, 2-10 calculations, 11-3 calibration, 9-20, 10-31 coefficients, 10-33 history, 10-35 advanced mode, 7-2 restore, 10-35 air filter, 2-1, 8-8 calibration certificate, 1-4 ascarite II, 9-6 Campbell Scientific auxiliary inputs CSAT3B, 2-29...
- Page 316 Appendix H. Index to FluxSuite, 3-10 express processing, 7-2 cross-sensitivity correction, 11-3 CSAT3B, 2-29 file compression, 5-1, 5-1 file viewer, 6-10 FluxSuite, 3-10 data formulas, 11-5 automatic download, 6-9 fuse, 9-12 inputs, 10-21 replacing, 9-5 logging, 5-1, 5-1 fuses on FluxSuite, 6-6 SmartFlux System, 9-3 outputs, 10-23 polling, E-12...
- Page 317 Appendix H. Index pin assignments, C-2 LED indicators, 1-10 LI-7550 about, 1-5 modes, 10-28 LI-8100A, 3-13 secondary span, 9-23 logging data, 5-12 CO2, 9-24 to a personal computer, 10-36 H2O, 9-24 sensor separation, 5-9, 5-11 serial connection, 10-4 maintenance signal processing, 8-15 intake, 9-8 signal strength, 8-12, 10-32 delta, 8-14...
- Page 318 Appendix H. Index terminal strips, 1-11 thermocouples replacing, 9-10 time, 10-15 about, 10-16 transfer function, 8-15 transmit data, E-8 troubleshooting, 8-1, 8-7 tubing, 2-1 vertical separation, 5-9, 5-11 viewing logged data, 6-10 text, 6-12 viewing processed data EddyPro output, 6-13 Tovi Software, 6-14 Windows Software, 10-1 winter setting, 10-19...
- Page 320 Regional Offices LI-COR Biosciences GmbH Siemensstraße 25A 61352 Bad Homburg Germany Phone: +49 (0) 6172 17 17 771 envsales-gmbh@licor.com LI-COR Biosciences UK Ltd. St. John’s Innovation Centre Cowley Road Cambridge CB4 0WS United Kingdom Phone: +44 (0) 1223 422102 envsales-UK@licor.com LI-COR Distributor Network: www.licor.com/envdistributors...
Need help?
Do you have a question about the LI-7200 RS and is the answer not in the manual?
Questions and answers