Table of Contents
Advertisement
Quick Links
Advertisement
Table of Contents
Troubleshooting

Subscribe to Our Youtube Channel
Related Manuals for Ceyear 87234 Series


Summary of Contents for Ceyear 87234 Series
- Page 1 87234 Series USB Peak/Avg Power Meter User's Manual Ceyear Technologies Co., Ltd.
- Page 2 87234E USB Peak/Avg Power Meter 87234F USB Peak/Avg Power Meter 87234L USB Peak/Avg Power Meter Version: C.2 July 2022, Ceyear Technologies Co., Ltd. Service Consultation: 0532--86889847 400--1684191 Technical support: 0532--86880796 Quality Supervision: 0532--86886614 Fax: 0532--86889056 Website: www.ceyear.com Email: techbb@ceyear.com...
- Page 3 Warning modification or alteration can ! made manual Thank you for choosing and contents by any unit or person using 87234 series Peak/Avg symbol "Warning" without approval Power Meter developed and indicates a hazard. It reminds Institute, and no reproduction...
-
Page 4: Table Of Contents
87234 Series USB Peak/Avg Power Meter Contents Contents 1. Manual navigation ....................1 1.1. About the Manual ........................1 1.2 Related Documents ........................2 2 Overview ........................5 2.1 Product Overview ........................5 2.2 Safe Operation Guide ........................ 6 3 Quick Start ......................11 3.1 Get Prepared .......................... - Page 5 5.3 Basic VISA interface programming ..................56 5.4 I/O library ........................... 59 6 Troubleshooting and after-sales services ............63 6.1 Working Principles ........................63 6.2 Troubleshooting and debugging ..................64 6.3 Error Messages ......................... 65 6.4 Method to Obtain After-sales Services ................65 7 Technical indicators and testing methods ............
-
Page 6: Manual Navigation
This part mainly includes two parts: basic operation guide and advanced operation guide. For users who are not familiar with 87234 series Peak/Avg Power Meter, the basic operation guide introduces and enumerates each function systematically and in detail so that users can understand and master some basic usage of the signal generators, such as setting trigger, time base, and frequency, etc. -
Page 7: Related Documents
This part introduces the product features, main technical indicators and recommended testing methods of 87234 series USB Peak/Avg Power Meter. 1.2 Related Documents The product documentation for the 87234 series USB Peak/Avg Power Meter includes Quick Start Guide Online Help ... - Page 8 1. Manual navigation 1.2 Related Documents users to quickly and comprehensively master the program control commands and methods of the instrument. Main chapters include the following: Remote Control Program Control Commands Programming Examples Error Description Appendixes ...
-
Page 9: Overview
The 87234 series has a video bandwidth of up to 30MHz and a rise/fall time of less than or equal to 13ns, allowing signals with a 50ns pulse width to be measured. -
Page 10: Safe Operation Guide
2 Overview 2.2 Safe Operation Guide 2.2 Safe Operation Guide Please read carefully and strictly observe the following precautions! We will spare no effort to ensure that all production processes meet the latest safety standards and provide users with the highest safety guarantee. The design and testing of our products and the auxiliary equipment used meet relevant safety standards, and a quality assurance system has been established to monitor the product quality and ensure the products to always comply with such standards. - Page 11 Tips on information about the instrument and its operation. 2.2.2 Operation Status and Locations Please note before operating the instrument: 1) Unless otherwise stated, the 87234 series USB Peak/Avg Power Meter have a non-operating temperature: -40°C ~+70°C; and operating temperature: 0°C to 50°C.
- Page 12 2 Overview 2.2 Safe Operation Guide 2) Do not place the instrument on surfaces with water, vehicles, cabinets, tables and other objects that are not fixed. Please place the instrument securely and fix it on the surface of a solid object (e.g., an ESD workbench).
- Page 13 2 Overview 2.2 Safe Operation Guide The repair, replacement and maintenance of the instrument should be performed by dedicated electronic engineers of the manufacturer, and the parts subject to replacement and maintenance should receive safety tests to ensure safe use of the product in the future. 2.2.6 Transportation 1) If the instrument is heavy, please handle it with care.
-
Page 14: Quick Start
3 Quick Start This chapter introduces the pre-operation precautions and the common basic configuration methods of the 87234 series USB Peak/Avg Power Meter. so that users can have a preliminary understanding of the instrument itself and its configuration processes. Get Prepared………………………………………………………………………………………………11 ... - Page 15 Please refer to the EMC level labels in the Data Page. 3.1.1 Environmental Requirements The operation sites of 87234 series USB Peak/Avg Power Meter should meet the following environmental requirements: 1) Operating environment The operating environment should meet the following requirements: Table 3.1 Environmental requirements of 87234...
- Page 16 3 Quick Start 3.1 Get Prepared Notice The above environmental requirements are only applicable to the operating environment factors of the instrument, and are not with the scope of technical indicators. 2) Electrostatic protection Static electricity is extremely destructive to electronic components and equipment. Usually we take two anti-static measures: conductive table mat and wrist strap;...
- Page 17 3 Quick Start 3.1 Get Prepared Caution Check the connector to prevent damaging ports of the instrument Any damaged connector may damage the good connector connected to it even when measuring the connection for the first time. In order to protect each interface of the signal generator itself, the connector must be checked before connector operation.
- Page 18 3 Quick Start 3.1 Get Prepared 3) Disconnection method Step 1. Support the connectors to prevent any connector from being twisted, shaken or bent; Step 2. An open-ended wrench can be used to prevent the connector body from rotating; Step 3. Loosen the screw sleeve of the connector with another wrench; Step 4.
- Page 19 Step 3. Do not use chemical cleaners, such as alcohol, acetone or dilutable cleaners. 2) Test Port Maintenance Damage to the connector of 87234 series USB Peak/Avg Power Meter or the presence of dust inside the connector will affect the test results. Please maintain such kind of connectors as follows:...
-
Page 20: User Check
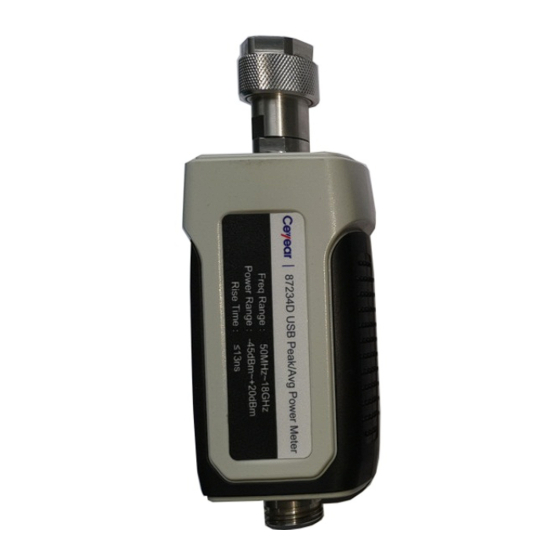
3.2.2 Power-on test 1) Turning on/off the power The 87234 series USB Peak/Avg Power Meter are powered by the USB2.0 interface of the host computer, with a supply voltage of +5V and a supply current of 500mA. Connect the USB Peak/Avg power meter to the USB port of the host computer via the USB cable when in use;... - Page 21 3.2.3 Appearance Description This section describes the external components of the 87234 series USB Peak/Avg Power Meter and their functions. The appearance diagram is as follows (Figure 3.6), and the detailed description is shown in Table 3.4.
-
Page 22: Configuration Methods
3 Quick Start 3.3 Configuration Methods 3.3 Configuration Methods This section describes the hardware requirements and configuration methods for the 87234 series USB Peak/Avg Power Meter. 3.3.1 Hardware Requirements Table 3.5 Basic configuration requirements of host computer Host computer Operating system... - Page 23 3 Quick Start 3.3 Configuration Methods Figure 3.10 Hardware driver installation (ii) Prompt the user to install the instrument driver After inserting the USB Peak/Avg power meter, the system prompts to install the driver. as follows: Step 1: After connecting the USB Peak/Avg power meter to the host computer properly, the hardware update wizard will pop up automatically Figure 3.11 Hardware driver installations...
- Page 24 3 Quick Start 3.3 Configuration Methods Step 2: Select Install from list or specified location and click Next. Figure 3.12 Hardware driver installations Step 3: Select "Do not search, I will choose the driver to install", and click Next. Figure 3.13 Hardware driver installations Step 4: Select "USB Test and Measurement Device"...
- Page 25 3 Quick Start 3.3 Configuration Methods Figure 3.14 Hardware driver installations Step 5: Click Finish and restart the computer if necessary. (iii) The system automatically identifies it as another device and installs the default driver Due to the different software configurations installed on the original system, the system may automatically identify the USB Peak/Avg power meter as another device, which is usually located in the "Universal Serial Bus Manager”...
- Page 26 3 Quick Start 3.3 Configuration Methods Repeatedly plug and unplug the USB Peak/Avg power meter to check the added or reduced devices in Device Manager, and right-click Properties to check whether the "Hardware ID" in the "Details" is "USB\VID_3399&PID_3800". If the device is identified as such, right-click and select "Update Driver...". The specific steps are as follows: Step 1: Select "Browse Computer for Driver Software".
- Page 27 3 Quick Start 3.3 Configuration Methods Figure 3.20 Main interface of soft panel...
-
Page 28: Operation Guide
4.1 Test Panel Introduction This section introduces the main features and basic measurement and setting methods for the user interface of the 87234 series USB Peak/Avg Power Meter, which will be used in different subsequent measurement tasks. 4.1.1 Main interface The 87234 series USB Peak/Avg Power Meter feature a new intuitive graphical user interface that clearly displays signal power values and pulse modulation envelope waveforms. - Page 29 4 Operation Guide 4.1 Test Panel Introduction Menu Tool bar Function Statistical display area Trace display area Power display area Parameter display area Device isplay area Figure 4.1 Operation main interface...
- Page 30 4 Operation Guide 4.1 Test Panel Introduction 4.1.2 Toolbar Table 4.2 Toolbar Icon Function Icon Function Connect the device Disconnect the device Open file Save file Start collecting measurement Stop collecting measurement results results Create trace display view Create CCDF display view Create power value display view Delete current display view Delete all display views...
- Page 31 4 Operation Guide 4.1 Test Panel Introduction Figure 4.2 Channel setting Table 4.3 Channel setting menu Channel setting Device selection When multiple devices are connected, select the current setup device. Mode Set the channel measurement mode to Normal or Average Only. Frequency Set measurement frequency.
- Page 32 4 Operation Guide 4.1 Test Panel Introduction Figure 4.3 Trace setting Table 4.5 Trace setting menu Trace Settings Trace unit Set the trace units to logarithmic and linear, respectively. Horizontal start Set the start time on the leftmost part of the trace window. Horizontal scale Set the time represented by each division in the horizontal direction of the trace window.
- Page 33 4 Operation Guide 4.1 Test Panel Introduction Figure 4.4 Gate setting Table 4.6 Gate setting menu Gate setting Gate setting Select the current gate and set the start time and length of the current gate. Auto gate setting Open or close the automatic gate and set the left and right reference of the automatic gate.
- Page 34 4 Operation Guide 4.1 Test Panel Introduction 2) Trigger setting menu Figure 4.6 Trigger setting Table 4.8 Trigger menu Trigger setting Trigger mode Set free-run, continuous trigger or single trigger mode. Trigger source Set internal trigger or external trigger. Trigger mode Set to Auto Level, Normal or Auto.
- Page 35 4 Operation Guide 4.1 Test Panel Introduction Figure 4.7 Measurement setting Figure 4.9 Measurement setting menu Measurement setting Measurement Select the current measurement, 4 in total. selection Units Set to logarithmic or linear measurement units. measurement Resolution Set the measurement result display resolution. Relative Enable relative mode, click relative power to set the reference value, and calculate the relative measurement result of the current measurement value and...
- Page 36 4 Operation Guide 4.1 Test Panel Introduction Table 4.10 Calculation setting menu Measurement setting Operation Set Input 1 and Input 2 to perform difference or ratio calculations, or disable all operations. Input Set the channel, gate, and measurement type for Input 1 and Input 2. 4) Extended setting menu Figure 4.9 CCDF setting Table 4.11 CCDF setting menu...
-
Page 37: Test Panel Operation
4 Operation Guide 4.2 Test Panel Operation Figure 4.11 Reference line setting Table 4.13 Reference line setting menu Reference line setting Reference line Set the vertical position and reference difference of reference line 1 and reference line 2. Figure 4.12 Pulse definition setting Table 4.14 Pulse definition setting menu Pulse definition Pulse definition... - Page 38 4 Operation Guide 4.2 Test Panel Operation Figure 4.13 Device connection window Step 2: Open the average power value display window in the test panel by default. The default measurement mode is set to Average Only, and the trigger mode is set to Free Run, as shown in the figure below;...
- Page 39 4 Operation Guide 4.2 Test Panel Operation Figure 4.15 Track display window Step 4: Click the toolbar to open the CCDF statistics display window in the test panel, and set the trigger mode to Free Run. The test panel displays the statistical trace, as shown in the figure below.
-
Page 40: Average Power Measurement
4.3 Average power measurement 4.3 Average power measurement The 87234 series USB Peak/Avg Power Meter enable average power measurements. The operation process is as follows: Step 1: Set the signal generator amplitude to 0dBm, frequency to 1GHz and modulation mode to OFF;... -
Page 41: Pulse Power Measurement
Avg] to "Manual", with an average of more than 100 times. 4.4 Pulse power measurement The 87234 series USB Peak/Avg Power Meter enable pulse power measurements. The operation process is as follows: Step 1: Set the signal generator amplitude to 10dBm, frequency to 1GHz, turn on pulse modulation mode,and set the pulse period to 100us, and pulse width to 50us;... - Page 42 4 Operation Guide 4.4 Pulse power measurement Step 6: Set the starting position and length of Gate 1. The average power, peak power and peak to average ratio in the gate can be observed and measured in the parameter display area, and the automatic gate can also be used to measure the gate parameters;...
-
Page 43: Remote Control
This chapter introduces the remote control basics, remote control interface and configuration methods of 87234 series USB Peak/Avg Power Meter, and briefly introduces the concept and classification of I/O instrument driver library. The purpose is to facilitate users to start to achieve remote control. - Page 44 5. Remote control 5.1 Remote Control Basics Note 1: VISA, that is, Virtual Instrumentation Software Architecture, is a set of standard software interface function library. Users can use this function library to control instruments via GPIB, RS232, LAN, USB and other interfaces. Users should first install the VISA library on the control computer and use the VISA library to achieve remote instrument control.
- Page 45 5. Remote control 5.1 Remote Control Basics Tips Method of recognizing multiple instruments in the program control system If multiple instruments are connected in the network, the individual IP address and related resource string are used to distinguish. The host computer applies its own VISA resource string for instrument identification.
- Page 46 5. Remote control 5.1 Remote Control Basics instrument to establish a USB connection without the need to enter the instrument address string or install a separate driver. USB Address: Addressing string format: USB::<vendor ID>::<product ID>::<serial number>[::INSTR] Where: <vendor ID> represents the manufacturer code; ...
- Page 47 Use with ANSI/IEEE Std488.1-1987. New York, NY, 1998. Standard Commands for Programmable Instruments(SCPI) VERSION 1999.0. For program control command set, classification and description of 87234 series USB Peak/Avg Power Meter, please refer to: 1) Program Control Manual Appendix A SCPI Command Quick Reference Table.
- Page 48 5. Remote control 5.1 Remote Control Basics minicomputer, or a plug-in card on a cage. Some AI devices can also be used as controllers. b) Device A device is any device that supports SCPI. Most of the devices are electronic measurement or excitation devices that use GPIB interfaces for communication.
- Page 49 5. Remote control 5.1 Remote Control Basics 3) Instrument Command Syntax Table 5.2 Special characters in command syntax Symbol Meaning Example The vertical bar between the keyword and the [:SENSe]:BANDwidth|BWIDth parameter represents multiple options. HIGH|LOWer BANDwidth BWIDth optional, HIGH and LOWer are optional. A square bracket indicates that the contained [:SENSe]:BANDwidth? keyword or parameter is optional...
- Page 50 5. Remote control 5.1 Remote Control Basics The semicolon is used to separate 2 adjacent commands, :FREQ 2.5GHZ; :POW 10DBM without affecting current command path. Blank characters, such as <space> or <tab>, are usually :FREQ uency or :POWer :LEVel6.2 is not allowed.
- Page 51 5. Remote control 5.1 Remote Control Basics SCPI define different data formats in the use of program and response messages to comply with the flexible listening precise speaking principles of " " and " ". For more information, please refer to Flexible listening IEEE488.2.
- Page 52 5. Remote control 5.1 Remote Control Basics -100mV -100 millivolts 10DEG 10 degrees MAXimum Maximum effective setting MINimum Minimum effective setting UP Increase by a step DOWN Reduce by a step c) Discrete parameters When the number of parameter values to be set are finite, they are identified by discrete parameters. Discrete parameters use mnemonics to represent each valid setting.
- Page 53 5. Remote control 5.1 Remote Control Basics 0.5E+0 0.23 -100.0 +100.0 g) Integer response data An integer response data is a decimal expression of an integer value containing signed bit. When querying the status register, most of the response data returned are of integer type. Examples of integer response data: Sign bit optional +100 Positive lookahead allowed...
- Page 54 5. Remote control 5.1 Remote Control Basics #Q indicates that the number is an octal number. The following are various representations of the decimal number 45 in SCPI: #B101101 #H2D #Q55 The following example sets the RF output power to 10 dBm (or a value of the equivalent value of the currently selected unit, such as DBUV or DBUVEMF) with a hexadecimal value of 000A.
- Page 55 5. Remote control 5.1 Remote Control Basics unpredictable. A fixed value is returned for the following command: :FREQ:STAR 1GHZ;SPAN 100;:FREQ:STAR? Returned value: 1000000000 (1GHz) The following commands return variable values: :FREQ:STAR 1GHz;STAR?;SPAN 1000000 The returned result can be current initial frequency value of the instrument before such command is sent, since the host program will not execute the commands one by one until all command messages are received.
- Page 56 5. Remote control 5.1 Remote Control Basics 5.1.5 Status Reporting System The status report system stores all operation status information and error information of current instrument. They are stored in status registers and error queues respectively, and can be queried through a remote control interface.
- Page 57 5. Remote control 5.1 Remote Control Basics SCPI status register includes: STATus:OPERation and STATus:QUEStionable registers (SCPI definition), which contain the specific operation information of the instrument. All SCPI status registers have the same internal structure (For details, see 2.1.5.2 “SCPI status register structure”, please refer to Section 2.1.5.2 "Structure of SCPI Status Register"...
-
Page 58: Instrument Program Port And Configuration
5.2 Instrument Program Port and Configuration The USB program control system controls the instrument based on the USBTMC protocol. 5.2.1 Connection Establishment Use the USB cable to connect the 87234 series USB Peak/Avg power meter to an external controller (computer). 5.2.2 Interface Configuration The VID and PID of this instrument are 0x04B4 and 0x1010 respectively, and the serial number is marked on the instrument. - Page 59 5. Remote control 5.3 Basic VISA interface programming the variable is const char rgcDevRsc[MAX_RSC_LEN] = "GPIB0::20::INSTR"; If the instrument is controlled via a LAN socket interface with IP address 192.168.1.1 and port number 5025, then the value of the variable is const char rgcDevRsc[MAX_RSC_LEN] = "TCPIP0::192.168.1.1::5025::SOCKET";...
- Page 60 5. Remote control 5.3 Basic VISA interface programming The following example shows how to set the frequency of the 87234 series USB Peak/Avg Power Meter. /*************************************************************************/ void SimpleSettings() ViStatus iStatus; ViUInt32 uiRetCnt; //Set the frequency to 128MHz iStatus = viWrite(iDevHandle, "FREQ 1.2e8\n", strlen("FREQ 1.2e8\n"), &uiRetCnt);...
-
Page 61: I/O Library
5. Remote control 5.4 I/O library ViStatus iStatus; //Status ViUInt32 uiRetCnt; //read the returned bytes ViEventType eType; //Event Type ViEvent eEvent; //Event int iStat; //Status word char rgcOpcOk[256]; //OPC string char* pcCmd = NULL; //Command pointer /*********************************************************************/ /* The command INITiate[:IMMediate] is used to start single sweep (when continuous sweep is OFF, INIT:CONT OFF)*/ /* Only at the end of single sweep can the next command in the command buffer be executed... - Page 62 5. Remote control 5.4 I/O library Application Interactive developer Program developer interface interface Instrument drive program (functional body) Subprogram interface I/O interface (VISA) Figure 5.2 Structure model of instrument driver Functionally, a universal instrument driver generally consists of five parts: functor, interactive developer interface, programmer interface, subprogram interface and I/O interface, as shown in Fig.5.2.
- Page 63 5. Remote control 5.4 I/O library There are two types of IVI driver: IVI-C and IVI-COM, where the latter adopts the form of COM API based on the component object model (COM) of Microsoft, and the former adopts the form of C API based on ANSI C.
-
Page 64: Troubleshooting And After-Sales Services
This chapter will show you how to find problems and accept after-sales service, and explain error message of the instrument. If you encounter any problem when operating the 87234 series USB Peak/Avg Power Meter or want to buy relevant components or accessories, we can provide you with complete after-sales services. -
Page 65: Troubleshooting And Debugging
Tips Troubleshooting and instructions This section introduces the way on how to judge and handle failures (if any) of the 87234 series USB Peak/Avg Power Meter, and feed them back to the manufacturer as accurately as possible if necessary for quick solution. -
Page 66: Error Messages
6.4.2 Package and mailing In case of any failure to the 87234 series USB Peak/Avg Power Meter that is difficult to be eliminated, contact us by phone or fax. If it is confirmed that the USB Peak/Avg power meter has to be returned... - Page 67 6 Troubleshooting and after-sales services 6.4 Method to Obtain After-sales Services outer packing carton. 4) Seal the opening of the packing carton with adhesive tape and reinforce the packing carton with nylon tape. 5) Specify text like “Fragile”! Do not touch! Handel with care!” and so on. 6) Please consign it as precision instruments.
-
Page 68: Technical Indicators And Testing Methods
7 Technical indicators and testing methods 7.1 Statement 7 Technical indicators and testing methods The section introduces the technical indicators and testing methods of the 87234 series USB Peak/Avg Power Meter. Statement…………………………………………………………………………………………………67 Product Features…………………………………………………………………………………………67 Technical Indicators………………………………………………………………………………………68 Option Information………………………………………………………………………………………70 ... -
Page 69: Technical Indicators
7 Technical indicators and testing methods 7.3 Technical Indicators When temperature range is 10℃-30℃, the relative humidity is (5-95)%; When temperature range is 30℃- 40℃, the relative humidity is (5-75)%; When the temperature is above 40 ℃, the relative humidity is (5-45)%;... - Page 70 7 Technical indicators and testing methods 7.3 Technical Indicators Average power 87234D ±0.20dB (±4.5%) measurement 87234E ±0.25dB (±6.0%) accuracy 87234F ±0.30dB (±6.7%) 87234L ±0.33dB (±7.9%) Maximum capture 1s (down frequency) length 1.2ms (maximum sampling rate) Maximum pulse 10MHz repetition frequency Max Voltage Standing 87234D 1.20 (50MHz-2GHz)
-
Page 71: Option Information
7 Technical indicators and testing methods 7.4 Option Information 87234E 3.5mm(m) 87234F 2.4mm(m) 87234L 1.85mm(m) NOTE: 1. It is recommended to conduct zeroing after startup, significant temperature change or a long time since the last zeroing. In the Average Mode, external zeroing should be performed and it should be ensured that the power meter and RF source are isolated. -
Page 72: Additional Information
7 Technical indicators and testing methods 7.5 Additional information 7.5 Additional information 7.5.1 Time base/trigger Table 7.4 Time base/trigger Time base/trigger Time base 2ns/div-100ms/div Internal trigger (typical) -20dBm ~+20dBm External TTL trigger >2.4V (high level) input <0.7V (low level) 50Ω (Impedance) External TTL trigger >2.4V (high level) output... -
Page 73: Performance Characteristics Test
7 Technical indicators and testing methods 7.6 Performance characteristics test 7.5.3 Host computer Table 7.6 Host computer Host computer Operating system Windows 10 32-bit and 64-bit Windows 7 32-bit and 64-bit Windows XP Linux Hardware Processor: 1GHz or more (2GHz or more recommended) Memory: 2GB or more (4GB or more recommended) Hard disk space: 1.0GB or more Display: 1280 x 1024 or better... - Page 74 7 Technical indicators and testing methods 7.6 Performance characteristics test Test procedure: 1) The USB Peak/Avg power meter under test is connected to the computer via USB cable, and the standard power meter is mated to a power probe covering the frequency band, warmed up for at least 30 minutes and then zeroed, and connected in accordance with Figure 7.1;...
- Page 75 7 Technical indicators and testing methods 7.6 Performance characteristics test ±1.65 ±2.47 87234F ±0.30 ±0.30 ±0.30 ±1.65 ±2.47 87234L ±0.33 ±0.33 ±0.33 ±1.65 ±2.47 Table 7.8 Test average setting Power dynamic range Resolution 20dBm ~ 0dBm 0dBm ~-10dBm -10dBm ~-20dBm -20dBm ~-30dBm -30dBm ~-45dBm Note: 1.
- Page 76 7 Technical indicators and testing methods 7.6 Performance characteristics test Test procedure: 1) The USB Peak/Avg power meter under test is connected to the computer via USB cable, warmed up for at least 30 minutes and then zeroed, and connected in accordance with Figure 7.2; 2) Set the signal generator to Pulse Modulation mode, with pulse period of 10us, and pulse width of 5us, set the frequency to 1GHz, and set the output power according to the requirements in Table 7.9 Rise/Fall Time Test Form;...
- Page 77 7 Technical indicators and testing methods 7.6 Performance characteristics test 3) Open the trace display window of USB Peak/Avg power meter under test, set the frequency to 1 GHz, enable the auto level mode, and set the averaging times in accordance with Table 7.8; 4) After the measurement is stable, read the pulse width measured by the USB Peak/Avg power meter under test.
- Page 78 7 Technical indicators and testing methods 7.6 Performance characteristics test 7.6.1.6 Maximum pulse repetition rate This test verifies whether the repetition rate index of the pulse envelope signal measured by the USB Peak/Avg power meter under test meets the requirements. Test block diagram: Test block diagram as shown in Figure 7.2.
- Page 79 7 Technical indicators and testing methods 7.6 Performance characteristics test 7.6.1.8 Calibration Uncertainty Description: This test uses the test method of comparing with standard power meter to verify whether the index meets the requirements. Test block diagram: Test block diagram as shown in Figure 7.1. Test procedure: 1) The USB Peak/Avg power meter under test is connected to the computer via USB cable, and the standard power meter is connected to the power probe of the corresponding frequency band,...
- Page 80 7 Technical indicators and testing methods 7.6 Performance characteristics test 20GHz ±0.23 26.5GHz ±0.23 87234F 50MHz ±0.18 1GHz ±0.18 10GHz ±0.20 18GHz ±0.20 26.5GHz ±0.23 30GHz ±0.25 40GHz ±0.25 87234L 500MHz ±0.20 1GHz ±0.20 10GHz ±0.20 18GHz ±0.23 26.5GHz ±0.23 30GHz ±0.25 40GHz...
- Page 81 7 Technical indicators and testing methods 7.6 Performance characteristics test 7.6.2 Record chart of performance characteristics test Table 7.12 87234D USB Peak/Avg power meter test records Test site: Test environment: Test time: Equipment number under test: Test Personnel: Test Item Unit Standard Requirement Test...
- Page 82 7 Technical indicators and testing methods 7.6 Performance characteristics test Min. pulse width Average power ±0.20 measurement accuracy Maximum pulse repetition frequency Max Voltage Standing 1.20 50MHz~2GHz Wave Ratio 1.26 2GHz~18GHz Calibration 4.0% (0.17dB) 50MHz~10GHz uncertainty 4.5% (0.20dB) 10GHz~18GHz Color Black and white...
- Page 83 7 Technical indicators and testing methods 7.6 Performance characteristics test Table 7.13 87234E USB Peak/Avg power meter test records Test site: Test environment: Test time: Equipment number under test: Test Personnel: Test Item Unit Standard Requirement Test Conclusions results Interface 3.5mm(m) Appearance The surface shall be smooth and...
- Page 84 7 Technical indicators and testing methods 7.6 Performance characteristics test Average power ±0.25 measurement accuracy Maximum pulse repetition frequency Max Voltage Standing 1.20 50MHz~2GHz Wave Ratio 1.26 2GHz~18GHz 1.35 18GHz~26.5GHz Calibration uncertainty 4.2% (0.18dB) 50MHz~1GHz 4.5% (0.20dB) 1GHz~18GHz 5.3% (0.23dB) 18GHz~26.5GHz Color Black and white...
- Page 85 7 Technical indicators and testing methods 7.6 Performance characteristics test Table 7.14 87234F USB Peak/Avg power meter test records Test site: Test environment: Test time: Equipment number under test: Test Personnel: Test Item Unit Standard Requirement Test Conclusion results Interface 2.4mm(m) Appearance The surface shall be smooth and...
- Page 86 7 Technical indicators and testing methods 7.6 Performance characteristics test Average power ±0.30 measurement accuracy Maximum pulse repetition frequency Max Voltage Standing 1.20 50MHz~2GHz Wave Ratio 1.26 2GHz~18GHz 1.35 18GHz~26.5GHz 1.50 26.5GHz~40GHz Calibration uncertainty 4.2% (0.18dB) 50MHz~1GHz 4.5% (0.20dB) 1GHz~18GHz 5.3% (0.23dB) 18GHz~26.5GHz 5.8% (0.25dB)
- Page 87 7 Technical indicators and testing methods 7.6 Performance characteristics test Table 7.15 87234L USB Peak/Avg power meter test records Test site: Test environment: Test time: Equipment number under test: Test Personnel: Test Item Unit Standard Requirement Test Conclusion Results Interface 1.85mm(m) Appearance The surface shall be smooth and...
- Page 88 7 Technical indicators and testing methods 7.6 Performance characteristics test Average power ±0.33 measurement accuracy Maximum pulse repetition frequency Max Voltage Standing 1.20 50MHz~2GHz Wave Ratio 1.26 2GHz~18GHz 1.35 18GHz~26.5GHz 1.50 26.5GHz~40GHz 1.70 40GHz~67GHz Calibration 4.5% (0.20dB) 50MHz~18GHz uncertainty 5.3% (0.23dB) 18GHz~26.5GHz 5.8% (0.25dB) 26.5GHz~40GHz...
- Page 89 7 Technical indicators and testing methods 7.6 Performance characteristics test 7.6.3 Recommended instrument for performance characteristics test Table 7.16 Recommended instrument for performance characteristics test Instrument Main technical indicators Recommended model Signal Frequency range: 250kHz-67GHz E8257D Generator Power range: -110dBm ~+20dBm 1465 Series Power meter Frequency range: 10MHz~67GHz...
Need help?
Do you have a question about the 87234 Series and is the answer not in the manual?
Questions and answers