Table of Contents
Advertisement
Quick Links
Advertisement
Table of Contents

Related Manuals for Ceyear 4024 Series


Summary of Contents for Ceyear 4024 Series
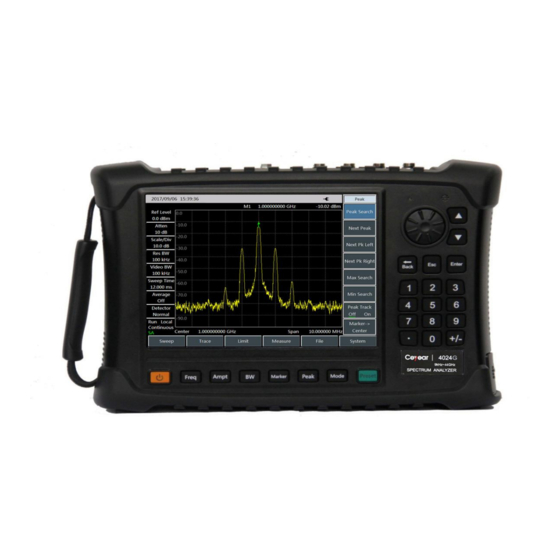
- Page 1 4024 Series Spectrum Analyzer User Manual...
- Page 3 4024 Series Spectrum Analyzer User Manual AV2.731.1075SSCN...
- Page 7 Environment and Safety Instructions Environment and Safety Instructions I. Safety Protection 1. Safety precautions for the instrument 1) Adopt designated packing container during handling, prevent instrument from falling down or fierce collision which may result in damage; 2) Please do use the AC-DC adapter provided accompanying the instrument for power supply, or improper power adapter will cause damage to the instrument.
- Page 8 Environment and Safety Instructions 6) Prohibit using the instrument if the power line is found damaged. The power line should be checked on a regular basis. Take safety precautions appropriately and place power line properly to ensure the power line will not be damaged and personnel will not stumble over the power line or be shocked by electricity.
- Page 9 This manual introduces the purpose, operation method, operation precautions, performance characteristics, basic operation principle and fault query of the 4024 series spectrum analyzer developed and produced by China Electronics Technology Instruments Co., so as to help you to get familiar with and master the operation method and key operation points as soon as possible.
- Page 10 error. We are sorry for the flaws which may cause your inconvenience. Editor Sep. 2018...
-
Page 11: Table Of Contents
Contents Chapter I Overview ............................... 1 Section 1 Product Overview ..........................2 1.1.1 Brief Introduction ........................... 2 1.1.2 Product features ............................. 2 1.1.3 Functions ..............................3 1.1.4 Typical application..........................3 Section 2 Main Technical Specifications ......................5 Article I Instructions ............................. 8 Chapter II Operation Guide .......................... - Page 12 Section 1 Introduction to Typical Measurements ..................25 4.1.1 Channel power measurement ....................... 26 4.1.2 Occupied bandwidth measurement ....................... 28 4.1.3 Adjacent channel power ratio measurement ..................30 4.1.4 Third-order IM distortion measurement ....................32 4.1.5 Drift signal measurement ........................36 4.1.6 Noise signal measurement ........................
- Page 13 Chapter VI Power Meter Mode (optional) ......................97 Section 1 Introduction to Typical Measurements ..................97 Section 2 Structure of Power Meter Menu ....................99 Section 3 Description of Power Meter Menu ....................100 6.3.1 Frequency menu ..........................100 6.3.2 Amplitude menu ..........................100 6.3.3 Bandwidth menu ..........................
- Page 14 Section 2 Structure of Field Strength Menu ....................126 Section 3 Description of Field Strength Menu .................... 128 9.3.1 Frequency menu ([PScan] mode) ....................... 128 9.3.2 Frequency menu ([FScan] mode) ....................... 128 9.3.3 Amplitude menu ..........................129 9.3.4 Bandwidth menu ..........................130 9.3.5 Marker menu ............................
-
Page 17: Chapter I Overview
Chapter I Overview Chapter I Overview The following safety notes are used throughout this manual. Familiarize yourself with each of the notes and its meaning before operating this instrument. “Warning” indicates danger. It reminds the user to pay attention to a certain operation process, operation method or similar situations. -
Page 18: Section 1 Product Overview
Section 1 Product Overview 1.1.1 Brief Introduction 4024 series spectrum analyzer has the advantages of broad operating band, high performance specifications, high sweeping speed, multiple test functions, easy operation, etc. From the perspective of performance specifications, this instrument has low average noise level, low phase noise and high scanning speed. From... -
Page 19: Functions
1.1.4 Typical application ■ On-site comprehensive performance evaluation of electronic weapon equipment 4024 series spectrum analyzer has the advantages of broad operating band, high performance specifications, high sweeping speed, multiple test functions, easy operation, etc. In addition, this handheld instrument is small and light and can be powered up with the battery. - Page 20 Chapter I Overview 4024 series spectrum analyzer has various measurement modes such as the spectrum analysis, interference analysis, analog demodulation, power measurement, channel scanning and field strength measurement, and various intelligent measurement functions such as the channel power, occupied bandwidth, adjacent channel power, C/N, field strength and emission mask.
-
Page 21: Section 2 Main Technical Specifications
Chapter I Overview Section 2 Main Technical Specifications Technical specifications of 4024 series instruments have been strictly tested before delivery. The user may test and verify such instruments according to the technical specifications in this manual. Refer to Table 1-1 for main technical specifications of 4024 series. - Page 22 Chapter I Overview Total level uncertainty (frequency range ±1.80dB(10MHz~13GHz) 10MHz~40GHz, input signal 0 ±2.30dB(13GHz~40GHz) dBm~-50dBm, all settings are auto couple, 20°C ~30°C) Second harmonic distortion 4024A/B/C: 4024D/E/F/G: (attenuation: 0dB; input signal: <-65dBc <-60dBc -30dBm) 3-order intermodulation 4024D/E/F/G: distortion ≥+7dBm 50MHz~4GHz 4024A/B/C:...
- Page 23 Chapter I Overview 0dBm~-40dBm ,20℃~30℃) 1GHz frequency point,0dBm output: ≤-90dBc/Hz@10kHz frequency offset Sideband Noise ≤-95dBc/Hz@100kHz frequency offset ≤-110dBc/Hz@1MHz frequency offset...
-
Page 24: Article I Instructions
Article I Instructions... -
Page 26: Chapter Ii Operation Guide
2.2.1 Environmental requirements In order to guarantee the service life and measurement validity and accuracy, 4024 series should be tested under the following environmental conditions. Temperature range:... -
Page 27: Selection Of Power Line
Low air pressure (altitude): 0-4600m 2.2.2 Selection of power line 4024 series spectrum analyzer is equipped with the three-core power line conforming to international safety standards. The power line should be inserted into the appropriate power socket with the protective ground wire so as to make the instrument shell grounded during operation. -
Page 28: Electrostatic Protection (Esd)
Power supply with built-in battery 4024 series instruments can be powered up with the rechargeable lithium ion battery. The battery will discharge if it is not used for a long time. Therefore, the battery must be recharged before use. Refer to Section 3 for battery operation details. -
Page 29: Input/Output Port Protection
2.2.5 Input/output port protection The standard impedance of the RF port of 4024 series spectrum analyzer is 50Ω. Therefore, the appropriate load impedance for the test signal or port should be applied in strict accordance with the port requirements during operation, so as to prevent subsequent circuits from damage. -
Page 30: Section 3 Battery Installation And Replacement
5%,otherwise the battery may not be able to charge. 2.3.2 Battery installation and replacement The battery of 4024 series spectrum analyzer can be installed or replaced easily. The user may install or replace it according to the requirements in Fig. 2-1. Remove the battery... -
Page 31: Battery Charging
The power indicator is located in the yellow power ON key. Caution The battery can be charged when 4024 series spectrum analyzer is OFF or operating. Charging steps: a) Install the battery to be charged into the machine. b) Connect the external power supply with the accompanying AC-DC adapter. -
Page 32: Chapter Iii Basic Operation
[XXX] form, where XXX is the menu name. 3.1.1 Display zone 4024 series spectrum analyzer is equipped with one 8.4-inch colorful touch screen. Parameter setting and information display can be performed by means of touch, thus eliminating the troublesome soft and hard key menu setting steps and greatly simplifying user operations. - Page 33 Fig. 3-2 Display Zone The information display zone in the screen display zone of 4024 series spectrum analyzer shows various settings and instrument statuses of the current measurement. Based on the information location on the screen, the information display zone is divided into the top information display zone, marker, signal standard and title display zone, left information display zone, measurement data display zone, soft key menu display zone, bottom information display zone and bottom function buttons, 7 in total.
- Page 34 Table 3-1 Functions of Left Display Zone in Spectrum Analysis Mode of 4024 Series Label Description...
-
Page 35: Number Input Zone
In order to improve the operation flexibility of 4024 series spectrum analyzer and fully utilize the excellent performance of the touch screen, the host software of 4024 series includes 8 gray touch keys on the right side, of which the corresponding functions are directly displayed in the corresponding key zones. -
Page 36: Reset Button
Chapter III Basic Operation 【Peak】: Obtain the peak parameter. 【Mode】: Set the measurement mode, including spectrum analysis, interference analysis, analog demodulation, power measurement, channel scanning and field strength measurement. 3.1.4 Reset button Press 【Preset】 to shut down the instrument and power up it again. 3.1.5 Power switch Turn on /turn off the spectrum analyzer. -
Page 37: Section 2 Interface Description
RF input port: It is used for inputting the signal to be tested. The indicator of the test signal input port of 4024 series is 50Ω. The N-type female port is applied for 4024D/E and 2.4mm male port for 4024F/G. -
Page 38: Digital Interface
USB power detector. 3) LAN (network) interface: This 10/100Mbps network interface can be connected by the network cable to the computer (PC), which is used for program control or data transmission of 4024 series through the program control commands or function library. - Page 39 Chapter III Basic Operation...
-
Page 40: Chapter Iv Spectrum Analysis Mode
Caution separately described below. Due to rich measurement functions, the spectrum analysis mode of 4024 series includes a number of complex parameters. In addition to basic functional parameters such as the frequency, amplitude, bandwidth average, trace, sweeping and marker parameters, it also includes characteristic functional... -
Page 41: Section 1 Introduction To Typical Measurements
In the demodulation mode, the resolution bandwidth should be preferably set as 300kHz-30kHz. Section 1 Introduction to Typical Measurements The spectrum analysis mode of 4024 series is a basic operating mode. The Quick Operation Guide of 4024 Series Spectrum Analyzer has introduces some typical measurement of this mode, including some basic measurement methods such as basic signal measurement, improvement of frequency measurement accuracy, measurement of small signals and distinguishing of signals of approximate frequencies. -
Page 42: Channel Power Measurement
RF transmission by comparison with the specific communication protocol. 4024 series spectrum analyzer can be used for measuring the channel power of the FM signal. As the FM signal is different from the CW signal in several aspects, it can be made more accurate by means of accurate setting. - Page 43 Chapter IV Spectrum Analyzer Mode Adapter 2.4mm cable Synthesized signal generator Spectrum analyzer Adapter Fig. 4-1 Schematic Diagram of Connection of Signal Generator and Spectrum Analyzer b) Reset the spectrum analyzer into the default state: Press 【Preset】. c) Enable the channel power measurement function: Press 【Measure】, [Channel Power] and [Channel Power Off On].
-
Page 44: Occupied Bandwidth Measurement
4.1.2 Occupied bandwidth measurement Taking the measurement of the occupied bandwidth of the FM signal for example, this section describes how to use the occupied bandwidth measurement function of 4024 series spectrum analyzer to measure the occupied bandwidth of the signal. - Page 45 The signal power drop dBc can be set by the user. 2) Measurement procedures The occupied bandwidth can be measured with 4024 series spectrum analyzer according to the following procedures: a) Set the signal generator to output the FM signal: Use the signal generator to generate one FM signal.
-
Page 46: Adjacent Channel Power Ratio Measurement
4.1.3 Adjacent channel power ratio measurement Taking the measurement of the adjacent channel power ratio of the FM signal for example, this section describes how to use 4024 series spectrum analyzer to measure the adjacent channel power ratio. 1) Definition of adjacent channel power ratio The adjacent channel power ratio (ACPR), also known as the adjacent channel leakage power ratio (ACLR) refers to the ratio of the transmitted power of one channel to the radiation power of the adjacent channel. - Page 47 Chapter IV Spectrum Analyzer Mode is generally expressed as the ratio of the power within the specified bandwidth under various offsets of the adjacent channel to the total power of the channel. The adjacent channel power mainly depends on the extension of the modulated sideband and noise of the transmitter.
-
Page 48: Third-Order Im Distortion Measurement
Chapter IV Spectrum Analyzer Mode h) Set the adjacent channel bandwidth: Press [Adj Ch BW] and set the adjacent channel bandwidth with number keys, i.e. 2MHz. i) Set the channel spacing: Press [Ch Spacing] and set the channel spacing as 1MHz with number keys. j) Enable the ACPR test: Press [ACPR Off On]. - Page 49 Chapter IV Spectrum Analyzer Mode distortion signals generated by them (2F and 2F ) mix and become third-order IM products 2F very close to original signals, thus resulting in high-order IM distortion. Such distortion products are mostly generated by devices such as amplifiers and mixers in the system. The measurement of third-order IM distortion is described below.
- Page 50 Chapter IV Spectrum Analyzer Mode bandwidth. Fig. 4-6 Signals at Center of Display of Spectrum Analyzer e) Set the reference level and make the signal peak at the reference level: Press 【Peak】 and [Peak Search], and read the peak power. Press 【Ampt】, [Reference Level].
- Page 51 Chapter IV Spectrum Analyzer Mode the difference between both markers will be displayed. In this case, relative measurement can be performed easily. Press 【Peak】 to activate one marker. Press [Maker] and [Delta] to activate the second marker. Press 【Peak】 and [Next Pk Left] or [Next Pk Right] to set the second marker at the peak point of the distortion product beside the signal generated by the signal generator.
-
Page 52: Drift Signal Measurement
Chapter IV Spectrum Analyzer Mode 4.1.5 Drift signal measurement 1) Definition of drift signal If the drift signal is measured with the spectrum analyzer, the center frequency should be changed in different period so as to facilitate observation. If the signal tracking function of the spectrum analyzer is enabled, the marker peak will always be displayed at the center frequency of the spectrum analyzer, thus facilitating measurement. -
Page 53: Noise Signal Measurement
SNR measurement is also used to indicate measurement of ratio of carrier against noise in communications systems. Measurement of the S/N and noise by the marker function of 4024 series spectrum analyzer is described below. In the example, SNR is measured with the signal (carrier) having only single frequency point. If the modulation signal is tested, this test process should be modified to correct the level of the modulation signal. - Page 54 Chapter IV Spectrum Analyzer Mode Press 【Preset】. Press 【Freq】, [Center Frequency], 1[GHz]. Press 【Freq】, [Span] and 5[MHz]. Press 【Ampt】, [Ref Level] and -10[dBm]. Press 【Ampt】, [Atten Auto Man] and 40[dB]. c) Set the marker at the signal peak and the differential marker at the noise location with the offset of 200kHz.
- Page 55 Chapter IV Spectrum Analyzer Mode a) Set the output signal of the signal generator: Set the frequency of the signal generator as 1GHz and power as -10dBm. Connect the output of the signal generator to the input port of the spectrum analyzer, and enable the ON state of the radio frequency. b) Set the center frequency, span, reference level and attenuator.
-
Page 56: Distortion Measurement
Chapter IV Spectrum Analyzer Mode In this case, the amplitude reading of the noise marker is correct, as the averages of all points are at the same frequency, which is not affected by the shape of the resolution bandwidth filter. The noise marker is calculated based on the average of the interested frequency points. - Page 57 Chapter IV Spectrum Analyzer Mode Press , [Atten Auto Man] and 10[dB]. Press 【Peak】 and [Peak Track Off On]. Press [Maker] and [Delta]. Fig. 4-12 Observation of Harmonic Distortion f) Increase the attenuator setting to 10dB: Press [Atten Auto Man] and 10[dB]. Observe the differential marker reading, as shown in Fig.
- Page 58 Chapter IV Spectrum Analyzer Mode The amplitude reading of the differential marker is provided by two sources: 1. If the RF attenuation is increase, S/N will decrease, and this reading will be positive. 2. If the harmonic distortion of the spectrum analyzer decreases, this reading will be negative.
- Page 59 Chapter IV Spectrum Analyzer Mode Press 【Peak】 and [Peak Search], and read the peak power. Press 【Ampt】 and [Ref Level], and set it as the peak power. Results are shown in Fig. 4-15. Fig. 4-15 Setting of Signal Peak as Reference Level for Maximum Accuracy e) Activate the second marker.
- Page 60 Chapter IV Spectrum Analyzer Mode about -60 dB, or a harmonic distortion of 0.1% (see Fig. 4-17). -60 -50 -40 -30 -20 -10 Harmonic distortion 10.0 percentage (%) Fig. 4-17 Conversion of Percentage of Harmonic Distortion Amplitude To measure the third harmonic, press [Next Pk Right] and read the amplitude ratio of other harmonics to the fundamental wave.
- Page 61 Chapter IV Spectrum Analyzer Mode Press 【Freq】 and [Signal Track Off On]. Press 【Freq】, [Span] and 100[kHz]. e) Disable signal tracking. Press 【Freq】 and [Signal Track Off On]. f) Move the signal peak to the top division to obtain the highest amplitude measurement accuracy. Press 【Peak】...
- Page 62 Chapter IV Spectrum Analyzer Mode Fig. 4-19 Second Harmonic Amplitude i) Calculate the harmonic distortion. Change the distortion percentage of the second harmonic to fundamental wave as shown in Fig. 4-17. The unit can be changed again to volt in order to read the voltage ratio of two signals. j) Measure other harmonics.
-
Page 63: Pulse Rf Signal Measurement
Chapter IV Spectrum Analyzer Mode 4.1.8 Pulse RF signal measurement 1) Definition of pulse RF signal The pulse RF signal refers to a RF pulse string of the same repetition frequency and constant pulse width, shape and amplitude. This section introduces several methods of measuring pulse RF signal parameters, including how to measure the center frequency, pulse width and pulse repetition frequency. - Page 64 Chapter IV Spectrum Analyzer Mode Fig. 4-20 Main Lobe and Side Lobe Increase the sweep time (decrease the sweeping speed) until the graph is filled into a solid line, as shown in Fig. 4-21. If the spectrum line cannot be filled, it indicates that the instrument is not in the broad band mode. In this case, the following steps of measurement of the sidelobe ratio, pulse width and peak pulse power will not apply.
- Page 65 Chapter IV Spectrum Analyzer Mode Press 【Peak】, [Maker], [Delta], 【Peak】 and [Next Peak]. The amplitude difference between the main lobe and side lobe is the side lobe ratio, as shown in Fig. 4-22. Fig. 4-22 Side Lobe Ratio Shown by the Marker e) Measure the pulse width, which is equal to the reciprocal of the frequency difference between the peaks of two side lobe envelopes.
- Page 66 Chapter IV Spectrum Analyzer Mode Fig. 4-23 Pulse Width Shown by the Marker 3) Pulse repetition frequency (PRF) measurement The pulse repetition interval (PRI) refers to the time interval between any two adjacent pulse responses. a) Set the output signal of the signal generator: Set the frequency of the signal generator as 1GHz and power as -20dBm.
- Page 67 Chapter IV Spectrum Analyzer Mode Fig. 4-24 Measurement of Pulse Repetition Frequency 4) Peak pulse power measurement Now we have obtained the main lobe amplitude and pulse width. In addition, we can easily obtain the resolution bandwidth of the spectrum analyzer. Therefore, the peak pulse power can be obtained based on such parameters.
-
Page 68: Signal Source Measurement (Option)
Chapter IV Spectrum Analyzer Mode In measurement of the main lobe amplitude, you should change the attenuator of the spectrum analyzer and verify that the main lobe amplitude will Caution not change accordingly. If the change exceeds 1dB, it indicates that the spectrum analyzer is in the gain compression state. - Page 69 Chapter IV Spectrum Analyzer Mode 2) Generator measurement Under the tracking mode, it is allowed to measure the magnitude-frequency characteristics of measured piece by using the synchronous frequency scan of signal source and spectral analysis. For details, please refer to the following setting procedures: Press【Freq】→[Start Freq], to set the start frequency as 100MHz;...
- Page 70 Chapter IV Spectrum Analyzer Mode Press 【Measure】→[Generator]→[Mode CW Track], to change the signal source mode to tracking mode; Connect the cable to signal source RF output end and frequency spectrum input end, and press 【Measure】→[Generator]→[Trans Meas]→[Normalize Off On], to start the normalization switch; After the scanning is completed, it is allowed to add the filter of measured piece and directly observe the magnitude-frequency characteristics of measured piece.
-
Page 71: Section 2 Structure Of Spectrum Analysis Menu
Chapter IV Spectrum Analyzer Mode Section 2 Structure of Spectrum Analysis Menu 频率 Frequency Span Units Signal standard Amplitude Frequency 中心频率 Ref Level Center Freq Span Header 0.0dBm Signal Track 扫宽 Span > > Full span Footer Ref Position dBmV Signal Search 起始频率... - Page 72 Chapter IV Spectrum Analyzer Mode Triggering 频率 Mode Points Sweep Edit list Sweep Sweep Time Free Run Sweeping Mode 中心频率 Spectrum Analysis Add Seg Auto Man Lin List Interference Sweep Video 扫宽 > Delete Seg Edit list > Analyzer Cont Single External(TTL) AM/FM/PM 起始频率...
- Page 73 Chapter IV Spectrum Analyzer Mode Measure Field Strength Channel Pwr Field Strength Field Strength > Edit Antenna Channel Pwr Channel Power > Recall Antenna > Add Point Center Freq Method > Edit Antenna > Delete Point Channel BW ACPR > Save Antenna Delete Point 99.00%...
- Page 74 Chapter IV Spectrum Analyzer Mode Generator Trans Meas Measurement Generator Normalize RSSI Setup ACPR Excellent:≥ RSSI > Main Ch BW 0.0dBm Mode 3.000MHz Track Very good:≥ ACPR > Adj Ch BW -20.0dBm Power Ref Level 3.000MHz 0.0dBm 0.0dB Good:≥ Center Freq Ch Spacing -40.0dBm CW Freq...
- Page 75 Chapter IV Spectrum Analyzer Mode Date File File Manager Location Year Save State Src File Internal Month Recall state > Dst File Save Data Copy Hour Recall Data > Delete Src File Minute > Save Pic 信号跟踪 > Default State <...
- Page 76 Chapter IV Spectrum Analyzer Mode Error Log System Language Header Language > 简体中文 Power Saver Sleep Tail Power Saver > English Date Format System Sleep Page up > information 5 Min Y/M/D 信号跟踪 Shut Down Error Log > Page down <...
-
Page 77: Section 3 Description Of "Spectrum Analysis" Menu
Chapter IV Spectrum Analyzer Mode Section 3 Description of “Spectrum Analysis” Menu 4.3.1 Frequency menu · [Center frequency]: Press →[Center Freq] and set it with the number keys on the front panel. Then select [GHz], [MHz], [kHz] or [Hz] in the frequency unit menu, or set the center frequency with the 【↑】... -
Page 78: Span Menu
Chapter IV Spectrum Analyzer Mode · [Signal Track Off On]: Click this menu to enable or disable signal tracking. Frequency After each sweeping, the active marker will be set at the peak point of the signal by the signal tracking function. The peak frequency will be set as the Signal Track center frequency. -
Page 79: If Output Menu
Chapter IV Spectrum Analyzer Mode 4.3.3 IF output menu The zero-span IF output function is optional. The IF signal output can be achieved through the IF output interface under the zero span to meet the user’s measurement requirements. [Special note]: The IF output menu, as a functional option, can only be applied in the zero span mode. -
Page 80: Amplitude Menu
Chapter IV Spectrum Analyzer Mode 4.3.4 Amplitude menu · [Ref Level]: Press 【Ampt】→ [Ref Level] and set it with number keys on the front panel. Select [dBm], [-dBm], [mV] or [μ V] in the frequency unit menu, or set the reference level with the 【↑】 or 【↓】 key or knob. ·... -
Page 81: Bandwidth Menu
Chapter IV Spectrum Analyzer Mode 4.3.5 Bandwidth menu · [Res BW Auto Man]: Press 【BW】→[Res BW Auto Man] and adjust the resolution bandwidth within the range of 1Hz-10MHz. The resolution bandwidth can be changed with the number keys, step keys or knob in the manual mode, by the step of 1, 3 or 10. -
Page 82: Detector Menu
Chapter IV Spectrum Analyzer Mode 4.3.6 Detector menu · [Auto]: The default setting of the detector menu is the normal mode. · [Normal]: If noise is detected in this mode, the positive and negative peak measurement results will be displayed at the same time, so as to achieve the Detector display effects similar to those of the analog instrument. -
Page 83: Marker Menu
Chapter IV Spectrum Analyzer Mode 4.3.7 Marker menu · [Marker 1 2 3 4 5 6]: Press 【Marker】→[Marker 1 2 3 4 5 6] to select various markers. Activate one marker and set it at the trace center. The values will be displayed in the marker display zone in the right upper corner of the screen. -
Page 84: Peak Menu
Chapter IV Spectrum Analyzer Mode · [Marker→Center]: Press 【Marker】→ [Marker→]→ [Marker→Center]. Marker-> The marker will move to the center frequency, and the center frequency will Marker-> be displayed on the screen. Center Freq · [Marker→CF Step]: Press 【Marker】 → [Marker→]→ [Marker→CF Step] Marker->... -
Page 85: Mode Menu
Chapter IV Spectrum Analyzer Mode 4.3.9 Mode menu The default functional mode under the mode menu is the spectrum analyzer mode. You can add the following functional options according to the needs: interference analyzer, AM-FM-PM analyzer, power meter, channel scanner and field strength. ·... -
Page 86: Sweep Menu
Chapter IV Spectrum Analyzer Mode 4.3.10 Sweep menu The sweep time refers to the time required for the LO tuning of the spectrum analyzer within the selected frequency interval, and directly affects the time of one test. It generally changes with the span, resolution bandwidth and video bandwidth. -
Page 87: Triggering Menu
Chapter IV Spectrum Analyzer Mode 4.3.11 Triggering menu It is applied to select the triggering mode under “Sweep” or “Measure”, including [Free Run], [Video], [External], [Slope] and [Delay]. The user can select the corresponding triggering mode based on the needs. ·... -
Page 88: Trace Menu
Chapter IV Spectrum Analyzer Mode 4.3.12 Trace menu This is applied to display the trace. You can enable [clear], [max], [min], etc. based on various test needs. For example, if the maximum holding function of the trace is enabled in drift signal measurement, the maximum peak amplitude and frequency drift of the input signal will be display. -
Page 89: Limit Menu
Chapter IV Spectrum Analyzer Mode 4.3.13 Limit menu · [Limit Upper Lower]: Press 【Limit】→[Limit Upper Lower] to set the Limit current limit as the upper or lower limit. Limit · [Display Off On]: Press 【Limit】→ [Display Off On] to enable or disable Upper Lower the limit function. -
Page 90: Measurement Menu
Chapter IV Spectrum Analyzer Mode 4.3.14 Measurement menu · [Field Strength]: Press 【Measure】→[Field Strength] to enable the field Measure strength measurement function and recall the related functional menu. Refer to the [Field Strength] menu description for details. Field Strength > ·... - Page 91 Chapter IV Spectrum Analyzer Mode The spectrum analyzer has the function of field strength measurement, including soft menus such as [Field Strength Off On], [Recall Antenna], [Edit Antenna] and [Save Antenna]. The field strength can be rapidly tested with such menus and corresponding test antennas. ·...
- Page 92 Chapter IV Spectrum Analyzer Mode Results can be rapidly, clearly and accurately in occupied bandwidth measurement of the spectrum analyzer. Depending on the modulation mode, two methods can be applied to calculate the occupied bandwidth: power percentage and power drop dBc. The user can select the appropriate occupied bandwidth measurement method according to the needs.
- Page 93 Chapter IV Spectrum Analyzer Mode The spectrum analyzer has the function of adjacent channel power ratio measurement. The user can obtain measurement results by setting relevant parameters of the channel. By using the limit test function, the user can define the adjacent channel limits so as to easily observe whether the adjacent channel power exceeds the set range.
- Page 94 Chapter IV Spectrum Analyzer Mode The spectrum analyzer has the C/N measurement function, which is applied to measure the ratio of the carrier power to noise power. · [C/N Off On]: Press 【Measure】→ [C/N]→ [C/N Off On] to enable or disable the C/N function.
- Page 95 Chapter IV Spectrum Analyzer Mode The emission mask function is applied to measure whether the signal power exceeds the mask limits, where the limits are recalled as the masks. The mask can be moved right and left or up and down according to the center frequency and reference power.
- Page 96 Chapter IV Spectrum Analyzer Mode By using the IQ capture function, the original IQ data can be captured according to the capture time, sample rate and capture mode set by the user, and data files can be saved for data analysis. ·...
-
Page 97: Signal Source Menu (Option)
Chapter IV Spectrum Analyzer Mode 4.3.15. Signal source menu (option) 【 Measure 】 → [More · [Signal Source On]: press 2]→ [Generator]→ [Generator Off On], to activate or deactivate the signal source. · [Tracking Mode Off On]: press 【Measure】 →[More 1 of 2] →[Signal Source] →[Mode CW Track], to activate or deactivate the signal source tracking mode. - Page 98 Chapter IV Spectrum Analyzer Mode · [Normalize Off On]: press 【 Measure】 →[More 1 of 2] →[Generator] →[Trans Trans Meas Meas] → [Normalize Off On], to activate or deactivate the normalized Normalize measurement. · [Ref Level 0.0dB]: press【Measure】→[More 1 of 2] →[Generator] →[Trans Meas] →[Ref Level 0.0dB], to activate the normalized and adjust the ref level so as to adjust the vertical position of trace on screen.
-
Page 99: File Menu
LO nulling alignment, GPS positioning (optional) and power saver are available. 4024 series spectrum analyzer has the function of LO nulling alignment, which is conducive for LO null calibration when required. To accurately measure the amplitude of the signal with the frequency below 5MHz, attention should be paid to the zero-frequency signal. - Page 100 Chapter IV Spectrum Analyzer Mode · [AliLO Nulling]: Press [System]→[AliLO Nulling] to enable the LO nulling alignment function. The user can easily apply this function when required. Alignment results will be saved in the internal memory of the System instrument. ·...
-
Page 101: Chapter V Interference Analyzer Measurement Mode (Optional)
Chapter V Interference Analyzer Measurement Mode (optional) Section 1 Introduction to Typical Measurements The interference analyzer mode is an extension of the spectrum analyzer mode. In 4024 series spectrum analyzer, the interference analyzer mode is divided into the following three modes: Spectrum measurement (refer to the relevant chapter of spectrum analysis requirements for specific operations, not repeated here);... -
Page 102: Rssi Measurement
Chapter V Interference Analyzer Mode (optional) which are used for reading the amplitude and frequency corresponding of the marker. Specific operations are as follows: [Maker]→[Marker 1 2 3 4 5 6]. Press [File]→[Save Pic] to save the current spectrogram information in the picture form. The spectrogram test structure is in Fig. - Page 103 Chapter V Interference Analyzer Mode (optional) Fig. 5-2 RSSI Test Diagram of Interference Analyzer...
-
Page 104: Section 2 Structure Of Interference Analyzer Menu
Chapter V Interference Analyzer Mode (optional) Section 2 Structure of Interference Analyzer Menu Frequency Span Amplitude Detector Level Res BW Center Freq Full span Auto 0.0dBm Auto Manual Video BW Span > Zero Span Ref Position Normal Auto Manual Atten Average Start Freq Last span... - Page 105 Chapter V Interference Analyzer Mode (optional) Measure Record File File Manager Sweep Interval Spectrum Header Save State Src File Auto Sweep Span Spectrogram Footer Recall state > Dst File Auto Record RSSI Page up Save Data Copy Time Cursor Page down Recall Data >...
-
Page 106: Section 3 Description Of Interference Analyzer Menu
Chapter V Interference Analyzer Mode (optional) Section 3 Description of Interference Analyzer Menu 5.3.1 Frequency menu · [Center Freq]: Press 【Freq】→[Center Freq], and set it with number keys on the front panel. Select [GHz], [MHz], [kHz] or [Hz] in the frequency unit menu or set the center frequency with the 【↑】or 【↓】key or knob. -
Page 107: Span Menu
Chapter V Interference Analyzer Mode (optional) 5.3.2 Span menu · [Span]: Press 【Freq】→[Span] to activate the span menu. Set the span with the number keys, and select the frequency unit, or set the span with the 【↑】 or 【↓】 key or knob. Refer to [Span] menu description for details. Span [Special note]: When the span is changed with the 【↑】... -
Page 108: Bandwidth Menu
Chapter V Interference Analyzer Mode (optional) 5.3.4 Bandwidth menu · [Res BW Auto Man]: Press 【BW】→ [Res BW Auto Man], and set it with the number keys on the front panel or the 【↑】 or 【↓】 key or knob. [Special note]: The resolution bandwidth depends on the bandwidth of the IF filter, while the trace shape depends on the filter of IF bandwidth. -
Page 109: Marker Menu
Chapter V Interference Analyzer Mode (optional) · [Auto]: Press 【BW】→ [Detector] → [Auto] to enable the spectrum Detector analyzer mode of the detector. · [Normal]: Press 【BW】→ [Detector] → [Normal] to enable the most Auto commonly used detector mode. You can see the signal and noise floor at the same time, with no signal loss. -
Page 110: Peak Menu
Chapter V Interference Analyzer Mode (optional) [Special note]: Marker functions are not available in the RSSI mode. · [Marker→Center]: Press 【Marker】→ [Marker→]→ [Marker→Center]. Marker-> The marker will move to the center frequency, and the center frequency will be displayed on the screen. Marker->... -
Page 111: Sweep Menu
Auto higher the sweeping speed is; and vice versa. Based on the compliance with Sweep minimum sweep time constraints, the maximum sweep time of 4024 series Cont Single spectrum analyzer can be set as max. 800s under the non-zero span and max. -
Page 112: Measurement Menu
Chapter V Interference Analyzer Mode (optional) 5.3.9 Measurement menu · [Spectrum]: Press 【Measure】→ [Spectrum] to enable the spectrum Measure measurement mode. Spectrum · [Spectrogram]: Press 【Measure】→ [Spectrogram] to enable the spectrogram measurement mode. · [RSSI]: Press 【Measure】 → [RSSI] to enable the RSSI measurement mode. Spectrogram RSSI 5.3.10 File menu... -
Page 113: Chapter Vi Power Meter Mode (Optional)
Section 1 Introduction to Typical Measurements In the power meter mode of 4024 series spectrum analyzer, the USB interface is connected with an external USB power probe through the USB cable to test the power. Using 8723X USB power probe provided by China Electronics Technology Instruments Co., Ltd., RF/microwave signals up to 40GHz can be tested, and... - Page 114 Chapter VI Power Meter Mode (optional) It is recommended to purchase the USB-based high-performance microwave power probe, which is developed by China Electronics Technology Instruments Co., Ltd. The following models are mainly available, and you can purchase the power probe according to test needs. At first, observe the maximum input power range identified on the USB power Caution probe, and ensure that the input is within the specified range, so as to prevent...
-
Page 115: Section 2 Structure Of Power Meter Menu
Chapter VI Power Meter Mode (optional) Section 2 Structure of Power Meter Menu Frequency Amplitude Average Calibrate Limit Average Limit Frequency Auto Scale Zero Resolution Max Value Upper Limit 0 1 2 3 Min Value Lower Limit Relative Alarm Offset Max Hold File File Manager... -
Page 116: Section 3 Description Of Power Meter Menu
Chapter VI Power Meter Mode (optional) Section 3 Description of Power Meter Menu 6.3.1 Frequency menu · [Freq]: Press 【Freq】→[Frequency] and set the frequency with the number keys. Then select the corresponding frequency menu, or change the Frequency frequency with the 【↑】 or 【↓】 key or knob, with the step of 10MHz. Frequency [Special note]: The frequency setting range is related to the selected USB power probe. -
Page 117: Bandwidth Menu
Chapter VI Power Meter Mode (optional) 6.3.3 Bandwidth menu · [Average Off On]: Press 【BW】→[Average Off On]. Change the average with the number keys or 【↑】 or 【↓】 key or knob, with the step of 1. [Special note]: The averaging function is generally applied to smooth the Average trace in measurement of the low-power signal or signal close to the noise Average... -
Page 118: File Menu
Chapter VI Power Meter Mode (optional) 6.3.6 File menu Refer to the file menu description in the spectrum analyzer mode. The functions of saving and recalling the data file are not available in the Caution power meter mode! -
Page 119: Chapter Vii Am-Fm-Pm Analyzer Mode (Optional)
Chapter VII AM-FM-PM Analyzer Mode (optional) Chapter VII AM-FM-PM Analyzer Mode (optional) Section 1 Introduction to Typical Measurements The AM-FM-PM analyzer mode is used for displaying the spectrum of AM, FM and PM signals and analyzing relevant parameters. The main spectrum and relevant parameters are shown below: RF spectrum: Similar to the spectrum analyzer mode, the frequency spectrum of the modulation signal will be displayed, and the occupied bandwidth can be measured. - Page 120 Chapter VII AM-FM-PM Analyzer Mode (optional) Taking the FM signal measurement for example, the AM-FM-PM analyzer mode is introduced as follows. At first, input the FM signal generated by one signal source to the RF input end of the instrument. Set the signal frequency as 6GHz, amplitude as -10dBm, modulation rate as 3kHz and modulation offset as 30kHz.
-
Page 121: Section 2 Structure Of Am-Fm-Pm Analyzer Menu
Chapter VII AM-FM-PM Analyzer Mode (optional) Section 2 Structure of AM-FM-PM analyzer Menu Amplitude Signal Std Freq Span Ref level IFBW Head Center Freq Span 0.0dBm Average Ref Position Tail Span > Last span Atten Page Up Start Freq > Auto Scale/Div Page Down... - Page 122 Chapter VII AM-FM-PM Analyzer Mode (optional) Audio Waveform Measurement File File Management Demod type Sweep Time Head Save State Src File AM FM PM Scale/Div Recall RF Spectrum Tail Dst File > 20.0% State Audio Page Up Save Data Copy Spectrum Audio Recall...
-
Page 123: Section 3 Description Of Am-Fm-Pm Analyzer Menu
Chapter VII AM-FM-PM Analyzer Mode (optional) Section 3 Description of AM-FM-PM Analyzer Menu 7.3.1 Frequency menu · [Center Freq]: Press 【Freq】→[Center Freq] and set it with the number keys on the front panel. Then select [GHz], [MHz], [kHz] or [Hz] in the frequency unit menu, or set the center frequency with the 【↑】... -
Page 124: Span Menu
Chapter VII AM-FM-PM Analyzer Mode (optional) 7.3.2 Span menu · [Span]: Press 【Freq】→[Span] to activate the span menu. Set the span with Span the number keys, or change the span by selecting the frequency unit or with the 【↑】 or 【↓】 key or knob. Span [Special note]: When the span is changed with the 【↑】... -
Page 125: Bandwidth Menu
Chapter VII AM-FM-PM Analyzer Mode (optional) 7.3.4 Bandwidth menu · [IF bandwidth] Press 【BW】→ [IFBW] and set the IFBW with the number keys on the front panel. Select the corresponding frequency unit, i.e. [GHz], [MHz], [kHz] or [Hz], or set the IFBW with the 【↑】 or 【↓】... -
Page 126: Marker Menu
Chapter VII AM-FM-PM Analyzer Mode (optional) 7.3.5 Marker menu · [Marker 1 2 3 4 5 6]: Press 【Marker】→ [Marker 1 2 3 4 5 6] to change Marker various markers. The selected marker will be underlined. Marker · [Normal mode]: Press 【Marker】 →[Normal] to enable the normal mode of 1 2 3 4 5 6 the current marker. -
Page 127: Peak Menu
Chapter VII AM-FM-PM Analyzer Mode (optional) 7.3.6 Peak menu · [Maximum Peak]: Press 【Peak】→[Max Peak] to set the current active marker at the maximum peak of the measured trace. The frequency and amplitude of the marker will be displayed in the middle upper part of the screen. -
Page 128: Rf Spectrum Menu
Chapter VII AM-FM-PM Analyzer Mode (optional) 7.3.7 RF spectrum menu [Special note]: The occupied bandwidth measurement in the RF spectrum is similar to that in the spectrum analyzer mode. The RF spectrum is only applied in the AM-FM-PM analyzer mode. RF Spectrum ·... -
Page 129: Audio Waveform Menu
Chapter VII AM-FM-PM Analyzer Mode (optional) 7.3.9 Audio waveform menu · [Sweep time]: Press [Audio Waveform]→ [Sweep Time] and set the audio waveform sweeping time. The longer the sweep time is and the more points are sampled, the stabler the measurement results will be. Audio Waveform ·... - Page 130 Chapter VII AM-FM-PM Analyzer Mode (optional)
-
Page 131: Chapter Viii Channel Scanner Mode (Optional)
Chapter VIII Channel Scanner Mode (optional) Chapter VIII Channel Scanner Mode (optional) Section 1 Introduction to Typical Measurements The channel scanner mode can be applied to measure the signal power of multiple channels. The signal power is displayed in the bar graph or list form. At most, the signal power of 20 channels can be displayed. This can be divided into three modes according to the channel setting: channel scanner, frequency scanner and list scanner. -
Page 132: Frequency Scanner
Chapter VIII Channel Scanner Mode (optional) Fig. 8-1 Schematic Diagram of Channel Scanner 8.1.2 Frequency Scanner Below is an example of the Frequency Scanner mode, mainly involving the following procedures. 1) Press 【Sweep】→ [FScan] → [Start Freq], and set the center frequency of the starting channel. 2) Press 【Sweep】→... -
Page 133: List Scanner
Chapter VIII Channel Scanner Mode (optional) Fig. 8-2 Schematic Diagram of Frequency Scanner 8.1.3 List scanner Below is an example of the Frequency Scanner mode, mainly involving the following procedures. 1) Press 【Sweep】 → [MScan] → [Edit List] and edit the channel list to be swept. The information of each channel can be set by setting the signal standard and channel number or setting the frequency and bandwidth in the list. -
Page 134: Section 2 Structure Of Channel Scanner Menu
Chapter VIII Channel Scanner Mode (optional) Section 2 Structure of Channel Scanner Menu Amplitude Ch Scanner Signal Std Scanner Freq Scanner Signal Std Refer level Channel > 0.0dBm Scanner > Start Freq Scale/Div Start Channel Freq 890.000MHz 10.0dB Scanner > Step Freq Number of 200.000kHz... -
Page 135: Section 3 Description Of Channel Scanner Menu
Chapter VIII Channel Scanner Mode (optional) Section 3 Description of Channel Scanner Menu 8.3.1 Scanner menu · [Channel Scanner]: Press 【Sweep】→ [Channel Scanner], set the channel Scanner scanner mode and activate [Channel Scanner] menu. You can the channel parameters in [Channel Scanner] menu. Refer to [Channel Scanner] menu. Channel Scanner >... -
Page 136: Frequency Scanner Menu
Chapter VIII Channel Scanner Mode (optional) 8.3.3 Frequency Scanner menu · [Start frequency]: Press 【Sweep】 → [Freq Scanner]→ [Start Freq], and set Freq Scanner the center frequency of the starting channel. Start Freq · [Step Freq]: Press 【Sweep】→ [Freq Scanner]→ [Step Freq], and set the 890.000MHz frequency step between channels. -
Page 137: Measurement Menu
Chapter VIII Channel Scanner Mode (optional) · [Signal Std]: Press [Edit List] → [Signal Std] and the signal standard list Edit list will pop up, including [Head], [Tail], [Page Up] and [Page Down]. Select the required signal standard and click [Done]. Signal ·... - Page 138 Chapter VIII Channel Scanner Mode (optional)
-
Page 139: Chapter Ix Field Strength Measurement Mode (Optional)
Chapter X Location analyzer mode (Option) Chapter IX Field Strength Measurement Mode (optional) Section 1 Introduction to Typical Measurements The field strength measurement is indispensable in radiation strength measurement of the tested equipment and can be divided into three modes: PScan, FScan and MScan. PScan: Observe the offset, amplitude and field strength of the current point by setting the point frequency. -
Page 140: Fscan
Chapter X Location analyzer mode (Option) 9.1.2 FScan Main operation steps of FScan: 1) Press 【Measure】→ [FScan] to enable the frequency sweeping mode. 2) Press 【Freq】→ [Stt Freq] and set the starting frequency of sweeping. 3) Press 【Freq】→ [Step Freq] and set the step frequency of sweeping. 4) Press 【Freq】→... - Page 141 Chapter X Location analyzer mode (Option) 2) Press 【Measure】→[MScan] to enable the MScan mode. 3) Press 【List Edit】→ [Edit List]→ [Freq] and set the step frequency of sweeping. 4) Press 【List Edit】→ [Edit List]→ [BandWidth] and set the bandwidth as 150Hz, 300Hz, 600Hz, 1.5kHz, 2.4kHz, 6kHz, 9kHz, 15kHz, 30kHz, 50kHz, 120kHz or 150kHz.
-
Page 142: Section 2 Structure Of Field Strength Menu
Chapter X Location analyzer mode (Option) Section 2 Structure of Field Strength Menu Demod Frequency Frequency Amplitude Unit Pot Freq Stt Freq Ref Level 500MHz 500MHz 107dBuV Freq Step Step Freq Atten dBmV Auto 10MHz Auto Freq Track point Scale/Div dBuV 20.0dB Limit... - Page 143 Chapter X Location analyzer mode (Option) File File Manager Header Save State Src File Tail Recall state Dst File > Page up Save Data Copy Page down Recall Data > Delete Src File Done Save Pic < Back Delete Default State Location File Delete All...
-
Page 144: Section 3 Description Of Field Strength Menu
Chapter X Location analyzer mode (Option) Section 3 Description of Field Strength Menu 9.3.1 Frequency menu ([PScan] mode) · [Pot Freq]: Press 【Freq】→ [Freq] and set the frequency with the number keys on the front panel. Select [GHz], [MHz], [kHz] or [Hz] in the frequency unit menu, or change the point frequency with the 【↑】... -
Page 145: Amplitude Menu
Chapter X Location analyzer mode (Option) 9.3.3 Amplitude menu · [Ref Level 107dBuV] : Press 【Ampt】→ [Ref Level 107dBuV] and set the reference value with the number keys on the front panel. Select [dBuV], [-dBuV], [mV] or [uV] in the frequency unit menu, or set the reference value with the 【↑】... -
Page 146: Bandwidth Menu
Chapter X Location analyzer mode (Option) 9.3.4 Bandwidth menu · [BW 30kHz]: Press 【BW】→ [BW 30kHz] and set the bandwidth with the number keys on the front panel. Select [GHz], [MHz], [kHz] or [Hz] in the frequency unit menu, or set the reference value with the 【↑】 or 【↓】 key or knob. -
Page 147: Sweep/Antenna Menu
Chapter X Location analyzer mode (Option) 9.3.7 Sweep/Antenna menu · [Sweep Cont Single]: Press 【Swp/Ant】→[Sweep Cont Single] to enable the continuous or single sweeping mode. · [Sweep Once]: Press 【Swp/Ant】→ [Sweep Once] to sweep once again. · [Dwell Time +∞ Man]: Press 【Swp/Ant】→[Dwell Time +∞ Man] to set Swp/Ant the dwell time. -
Page 148: Demodulation Menu
Chapter X Location analyzer mode (Option) 9.3.9 Demodulation menu · [CW]: Press [Demod]→ [CW] to disable the demodulation mode. Demod · [FM]: Press [Demod]→ [FM] to enable the FM mode. · [AM]: Press [Demod]→ [AM] to enable the AM mode. ·... -
Page 149: Chapter X Signal Analyzer Mode (Option)
Chapter XI Signal analyzer mode(Option) Chapter X Signal analyzer mode (option) Section 1 Introduction to typical measurement The signal analysis measurement mode is to provide the rapid analysis of interference signal, realize the display and playback of historical data by waterfall chart, quickly realize the modification of center frequency and span parameters by shortcut menu and quickly realize the audio output and IQ Capture function. - Page 150 Chapter XI Signal analyzer mode(Option) Fig. 10-2 Interface of signal list IQ Capture function can directly save IQ data of interference signal and its interface is as shown in Fig. 10-3: Fig. 10-3 Schematic diagram of IQ Capture function Under the signal analysis mode, the current test task can be saved quickly as an automatically generated file as per current intermediate frequency and test time.
- Page 151 Chapter XI Signal analyzer mode(Option) Fig. 10-4 Schematic diagram of signal analysis storage task...
-
Page 152: Structure Of Signal Analysis Menu
Chapter XI Signal analyzer mode(Option) Section 2 Structure of signal analysis menu Freq Amplitude Span Detector Ref Level Res BW Center Freq Span Auto 0.0 dBm Auto Video BW Span > Ref Position Full Span Normal Auto Atten Video Type Start Freq Zero Span Peak... - Page 153 Chapter XI Signal analyzer mode(Option) Config Tune & Listen IQ Capture Trigger Tune & Listen Tune&Listen > IQ Capture Free Run Demod type IQ Capture > > EXternal(TTL) Start Capture 1.50V ThresHold Listen Time 15.0 Capture time Slope 100.00ms 1.000ms Rising Falling List...
-
Page 154: Description Of Signal Analysis Menu
Chapter XI Signal analyzer mode(Option) Section 3 Description of signal analysis menu 10.3.1 Frequency menu · [Center Freq]: press 【Freq】→[Center Freq], to select [GHz], [MHz], [kHz] or Freq [Hz] by number key on front panel or 【↑】 or 【↓】 key and spinning wheel in frequency menu. -
Page 155: Span Menu
Chapter XI Signal analyzer mode(Option) 10.3.2 Span menu · [Span]: press 【Freq】→[Span], to activate the span sub-menu by using number Span key, frequency unit or 【↑】 or 【↓】 key and spinning wheel. For details, please refer to the description of [Span]. Span ·... -
Page 156: Bandwidth Menu
Chapter XI Signal analyzer mode(Option) 10.3.4 Bandwidth menu · [Res BW Auto Man]: press 【BW】→[Res BW Auto Man], to set the RBW by using the number key on front panel or 【↑】 or 【↓】 key and spinning wheel. · [Special Notice]: the RBW depends on the bandwidth of intermediate Res BW Auto frequency filter while the shape of trace depends on the intermediate... -
Page 157: Marker Menu
Chapter XI Signal analyzer mode(Option) · [Auto]: press 【BW】 →[Detector] →[Auto]. The detection is same with spectral Detector analysis mode. · [Normal]: press 【BW】→[Detector] →[Normal]. This is a most common Auto detection mode, through which the signal and noise floor can be displayed without signal loss. -
Page 158: Peak Menu
Chapter XI Signal analyzer mode(Option) · [Marker->Center Freq]: press 【 Marker】 → [Marker->] → [Marker->Center Marker-> Freq], to move the marker to the center frequency place and display the reading of center frequency on screen. Marker-> Center Freq · [Marker->Step Freq]: press 【Marker】→[Marker->]→[Marker->Step Freq], to set the step size of center frequency, namely, the frequency step is equal to marker Marker->... -
Page 159: Sweep Menu
Chapter XI Signal analyzer mode(Option) 10.3.7 Sweep menu · [Sweep Time Auto Man]: press 【Sweep】→ [Sweep Time Auto Man], to switch Sweep the sweep time between automatic and manual modes. The current state will be underlined. When the sweep time is automatic, the integrated tester will Sweep Time automatically set the fastest sweep time as per the current apparatus state and the Auto Man... -
Page 160: Configuration Menu
Chapter XI Signal analyzer mode(Option) 10.3.9 Configuration menu · [Tune&Listen]: press 【Config】→[Tune&Listen], to activate the Tune Listen Config function. For details, please refer to the description of [Tune Listen] menu. · [IQ Capture]: press 【Config】→ [IQ Capture], to activate IQ Capture function. Tune&Listen >... -
Page 161: Iq Capture Menu
Chapter XI Signal analyzer mode(Option) 10.3.11 IQ Capture menu · [IQ Capture Off On]: press 【Config】 →[IQ Capture]→[IQ Capture Off On], to IQ Capture activate or deactivate IQ Capture function. · [Start Capture]: press 【Config】→[IQ Capture]→[Start Capture], to start IQ IQ Capture data capture and record function. -
Page 162: Shortcut Menu
Chapter XI Signal analyzer mode(Option) 10.3.12 ShortCut menu · [Center Freq]: press 【ShortCut】→[Center Freq], press 【Freq】→[Center ShortCut Freq], to set the center frequency by using the number key on front panel, [GHz], [MHz], [kHz] or [Hz] or 【↑】 or 【↓】 key and spinning wheel in frequency unit Center Freq menu. -
Page 163: Article Ii Technical Instructions
Article II Technical Instructions... -
Page 165: Chapter Xi Operating Principle
IQ capture. With options for interference analysis, AM-FM-PM signal demodulation analysis and USB power measurement, the RF signal parameters such as the frequency and amplitude can be measured. The functional block diagram of 4024 series spectrum analyzer is shown in Fig. 11-1. - Page 166 Chapter XII Operating Principle down-conversion, IF filtering, video filtering, etc. The CPU board includes the power conversion and management circuit, interface and display circuit, FPGA/CPLD control and digital signal processing circuit and ARM core module, and is used for DC/DC conversion and operation management of the power supply of the whole instrument, digital signal processing, logic circuit control, etc.
-
Page 167: Chapter Xii Performance Characteristic Test
GB/T 6592-1996, and be calibrated by the measurement department and within the validity of measurement. You may also use other instruments meeting the test requirements of this standard. Refer to the table below for test instruments. Table 12-1 Recommended Instruments for 4024 Series Spectrum Analyzer Recommended Instrument name... - Page 168 Chapter XIII Performance Characteristic Test Table 12-2(continued) Recommended Instruments for 4024 Series Spectrum Analyzer Recommended Instrument name Main technical indexes cable Adapter 2.4mm(f)-2.4mm(f) 711120 Adapter 3.5mm(m)-3.5mm(m) 71119 Adapter 2.4mm(f)-3.5mm(f) 71125 Adapter 2.4mm(m)-3.5mm(m) 71122 Adapter 3.5mm(f)-3.5mm(f) Adapter BNC(f)-SMA(m) BNC/SMA-JK Adapter BNC(m)-BNC(f)-BNC(m)
- Page 169 Test steps BNC cable 10MHz IN 10MHz output Adapter Adapter Adapter Synthesized signal generator Adapter 2.4mm cable Spectrum analyzer Fig. 12-1Frequency Range Test 1) Connect the test equipment as shown by dotted lines in Fig. 12-1. Use 4024 series spectrum analyzer...
- Page 170 Performance Test Schedule of Records of 4024 Series Spectrum Analyzer (hereinafter referred to as the Schedule of Records of 4024 Series Spectrum Analyzer). Mark “√” if the comparison result complies with requirements of the records; otherwise, mark “×”.
- Page 171 5) Calculate the frequency readout error Δf by Formula (1): Δf=f 6) Record Δf as the test result into the corresponding test item of the Schedule of Records of 4024 Series Spectrum Analyzer. 7) Repeat Step 2 to 6 to all frequency and span combinations under the corresponding test items of the Schedule of Records of 4024 Series Spectrum Analyzer.
- Page 172 7) Record the frequency difference Δf, and calculate the span accuracy by the following formula: Span accuracy=100×[Δf-(0.8× span) ]/(0.8× span)% Record the results corresponding to the test items in the Schedule of Records of 4024 Series Spectrum Analyzer. 8) Disable all markers. Respectively set the span of the spectrum analyzer and frequency of the signal generator according to the span of the spectrum analyzer in the table of records, and repeat Step 3-8 until all spans are tested.
- Page 173 “Sweep Time Range (zero span)” in the Schedule of Records of 4024 Series Spectrum Analyzer; otherwise, mark “×”. ” 3) Reset 1464C instrument, and finish the following settings: 4GHz frequency, -5dBm power, [Modulation] [AM] [Amplitude Input], [External], [Back], [AM On Off].
- Page 174 The marker difference is the measured value corresponding to 3dB bandwidth. The reading of the 3dB bandwidth test function of 4024 series can be used as the test value. The span error of 4024 series may result in some errors of the resolution bandwidth accuracy. Compared with the resolution bandwidth error, the span error can be ignored.
- Page 175 6) Make 4024 series instrument search the peak. Record the marker difference Δf-3dB corresponding to 3dB bandwidth. Calculate the resolution bandwidth accuracy δ by the following formula, and record the calculation result under the corresponding test item in the Schedule of Records of 4024 Series Spectrum Analyzer.
- Page 176 4) Set the span of the spectrum analyzer according to the resolution of the corresponding test item in the Schedule of Records of 4024 Series Spectrum Analyzer. Then set the ratio of the span to resolution bandwidth as 100.
- Page 177 ±100kHz, ±1MHz and ±10MHz offset. Record the amplitudes of the differential marker under the related test item in the Schedule of Records of 4024 Series Spectrum Analyzer. Any spurious response at the frequency offset should be avoided during marker reading in the test.
- Page 178 5) Read the marker peak, and record it as the display average noise level within 2MHz-10MHz (with the pre-amplifier ON) under the corresponding test item in the Schedule of Records of 4024 Series Spectrum Analyzer. Disable the noise marker and averaging function.
- Page 179 Chapter XIII Performance Characteristic Test Display average noise, pre-amplifier ON (10MHz-4GHz) 6) Set the starting frequency of 4024 series spectrum analyzer as 10MHz and stop frequency as 4GHz, and keep other items unchanged. 7) Repeat Step 3 and 4. 8) Read the marker peak, and record it as the display average noise level within 10MHz-4GHz (with the pre-amplifier ON) under the corresponding test item in the Schedule of Records of 4024 Series Spectrum Analyzer.
- Page 180 Analyzer. Disable the noise marker and averaging function. Display average noise, pre-amplifier OFF (2MHz-10MHz) 24) Set the starting frequency of 4024 series spectrum analyzer as 2MHz, stop frequency as 10MHz and reference level as -20dBm, enable the OFF state of the pre-amplifier, and keep other items unchanged.
- Page 181 Analyzer. Disable the noise marker and averaging function. Display average noise, pre-amplifier OFF (40GHz-44GHz) 42) Set the starting frequency of 4024 series spectrum analyzer as 40GHz, stop frequency as 44GHz and reference level as -20dBm, enable the OFF state of the pre-amplifier, and keep other items unchanged.
- Page 182 6) Finish one new sweeping on the spectrum analyzer and press 【Peak】. Record the differential marker reading as the second harmonic distortion value (4GHz) under the corresponding test item in the Schedule of Records of 4024 Series Spectrum Analyzer. Second harmonic distortion (4GHz-10GHz) 7) Connect the test instruments as shown in Fig.
- Page 183 Chapter XIII Performance Characteristic Test Series Spectrum Analyzer. Second harmonic distortion (10GHz-22GHz) 13) Connect the test instruments as shown in Fig. 12-9. Use the 18GHz low-pass filter. 14) Set the frequency of 1464C instrument as 18GHz and amplitude as -30dBm. 15) Finish spectrum analyzer settings as follows: Center frequency ........................
- Page 184 Chapter XIII Performance Characteristic Test Two 2.4mm(f)-3.5mm(f) adapter One 2.4mm(f)-3.5mm(m) adapter One BNC(T) type(m)(f)(f) c) Cables Two BNC(m-m) cable Two 3.5mm(m-m) cable Two 2.4mm(m-m) cable d) Test steps cable BNC T Adapter BNC cable synthesized signal generator synthesized signal generator 10MHz IN 10MHz Out Adapter...
- Page 185 3-order intercept point by formula (6), compare the high 3-order intercept point and low 3-order intercept point. Record the lower 3-order intercept point under the corresponding test item in the Schedule of Records of 4024 Series Spectrum Analyzer cable...
- Page 186 Chapter XIII Performance Characteristic Test 20) Set the frequency of ML2437A as 6GHz. 21) Press 【Marker】[Normal], set center frequency to 6GHz. 22) Repeat Step 6~16. Third-order Intermodulation Distortion (13GHz~44GHz) 23) Connect the test instrument as shown in Fig. 12-11. Using Directional Coupler, do not connect the directional coupler to the spectrum analyzer.
- Page 187 RF directional coupler to the power probe. Set frequency of the power meter as 2GHz, Read the power meter dispaly, and record it as the 1dB Gain Compression within 50MHz-4GHz under the corresponding test item in the Schedule of Records of 4024 Series Spectrum Analyzer. Disable the noise marker and averaging function. 1dB Gain Compression(4GHz~13GHz) 10) Connect the test instrument as shown in Fig.
- Page 188 RF directional coupler to the power probe. Read the power meter dispaly, and record it as the 1dB Gain Compression within 4GHz-13GHz under the corresponding test item in the Schedule of Records of 4024 Series Spectrum Analyzer. Disable the noise marker and averaging function. 1dB Gain Compression(13GHz~44GHz) 16) Connect the test instrument as shown in Fig.
- Page 189 6) Set 1464C instrument at each frequency point where the image, multiple and out-of-band response may occur corresponding to 2GHz under the related test item in the Schedule of Records of 4024 Series Spectrum Analyzer. Set the reference level of the spectrum analyzer as -40dBm and resolution bandwidth as 10Hz.
- Page 190 4) Press 【Freq】 [Center Freq] 【↑】 to change the center frequency. Repeat Step 3 to check the residual response under the frequency 20GHz. Record the measured maximum response into the measurement result column of the corresponding test item in the Schedule of Records of 4024 Series Spectrum Analyzer. Residual response, 20GHz-44GHz (with the pre-amplifier ON) 5) Finish spectrum analyzer settings as follows: Center frequency .........................
- Page 191 8) Press 【Freq】 [Center Freq] 【↑】 to change the center frequency. Repeat Step 7 to check the residual response under the frequency 44GHz. Record the measured maximum response into the measurement result column of the corresponding test item in the Schedule of Records of 4024 Series Spectrum Analyzer.
- Page 192 20GHz (with the pre-amplifier OFF). Record the measured maximum response into the measurement result column of the corresponding test item in the Schedule of Records of 4024 Series Spectrum Analyzer. Residual response, 20GHz-44GHz (with the pre-amplifier OFF) 17) Finish spectrum analyzer settings as follows: Center frequency .......................
- Page 193 3) Set 【Ampt】 [Ref Level] with the knob or step keys 【↑】 and 【↓】 on 4024 series. The reference level can be set as max. +30dBm and min. -120dBm according to the requirements. Mark “√” in the corresponding result column in the Schedule of Records of 4024 Series Handheld Spectrum Analyzer if the reference level complies with the requirements;...
- Page 194 Record the calculated value as the uncertainty of the current reference level under the corresponding test item in the Schedule of Records of 4024 Series Spectrum Analyzer. 11) Repeat the steps 7-9 to the other reference levels of the spectrum analyzer in the Schedule of Records of 4024 Series Spectrum Analyzer.
- Page 195 9) Perform the following calculation: (amplitude of the differential marker of the spectrum analyzer - power change of the signal source), and record the calculated value under the corresponding test item in the Schedule of Records of 4024 Series Spectrum Analyzer. Repeat Step 8 and 9. 16. Total level uncertainty...
- Page 196 -5dBm. 9) Repeat the steps 6, change the attentor value of the spectrum analyzer to 30dB, 40dB, 50dB, and Record the calculated △L. 10) Set frequency in the Schedule of Records of 4024 Series Spectrum Analyzer, and repeat step 5~9.
- Page 197 13) Set the frequency of the spectrum analyzer as 500MHz, the ref level as -10dBm, attentor as 0dB, repeat stet 6. 14) Set frequency in the Schedule of Records of 4024 Series Spectrum Analyzer, and repeat step 5~9. 17. Input attenuator Description: The attenuation switching uncertainty is measured within the range (50dB) of the input attenuator under the whole band in the test.
- Page 198 4) Press [Rest] on the spectrum analyzer. Wait for restart to enter the spectrum analyzer interface. 5) Read the maximum VSWR by the marker function of the vector network analyzer. 6) Record test results under the corresponding test item in the Schedule of Records of 4024 Series Spectrum Analyzer.
- Page 199 20. Display scale Connect 4024 series spectrum analyzer with the power supply. After normal start-up, manually set the scale as 0.1-10dB per divisions, with the step of 0.1dB (10-division). The display range of [Scale Type Log Lin] is 10 divisions.
-
Page 200: Article Iii Maintenance Instructions
Article III Maintenance Instructions... -
Page 202: Chapter Xiii Troubleshooting And Repair
You can check 4024 series instrument according to the following prompts in the case of any fault: Please contact us if the failure cannot be removed. -
Page 203: Section 2 Repair Method
Chapter XI Failure Information Description and Repair Method Section 2 Repair Method If you cannot solve the problem of 4024 series, contact us by telephone or fax. If it is confirmed that repair is required, please pack the instrument by the following steps: 1) Prepare one copy of paper file describing the instrument failure, and place it into the packing box together with the tester. -
Page 204: Appendix A Performance Characteristic Test Results
Appendix A Performance Characteristic Test Results Appendix A Performance Characteristic Test Results Schedule Performance Characteristic Test Results of 4024 Series Spectrum Analyzer Instrument No.: Tester: Test conditions: Testing date: MM/DD/YY Table A.1 Schedule of Records of 4024 D/E/F/G Spectrum Analyzer... - Page 205 Appendix A Performance Characteristic Test Results Table A.1 (continued 1) Schedule of Records of 4024D/E/F/G Spectrum Analyzer Inspection item Unit Standards Inspection result 10.0GHz (frequency span 50MHz): ±1.03 10.0GHz (frequency span 500MHz): ±10.30 12.0GHz (frequency span 500kHz): ±19.90 12.0GHz (frequency span 50MHz): ±1.03 12.0GHz(frequency span 500MHz) : ±10.30...
- Page 206 Appendix A Performance Characteristic Test Results Table A.1 (continued 2) Schedule of Records of 4024D/E/F/G Spectrum Analyzer Inspection item Unit Standards Inspection result 100kHz ±10.0% 30kHz ±10.0% Resolution bandwidth 10kHz ±10.0% accuracy 3kHz ±10.0% 1kHz ±10.0% 10MHz ±1.20 3MHz ±1.20 1MHz ±1.20 300kHz...
- Page 207 Appendix A Performance Characteristic Test Results Table A.1 (continued 3) Schedule of Records of 4024D/E/F/G Spectrum Analyzer Inspection item Unit Standards Inspection ≥+7 50MHz~4GHz 3-order ≥+6 4GHz~13GHz intermodulation ≥+6 13GHz~44GHz ≥-2 50MHz~4GHz 1dB gain ≥-3 4GHz~13GHz compression ≥-3 13GHz~44GHz Image frequency 15080.5MHz <-65 2GHz Image frequency 2280.5MHz...
- Page 208 Appendix A Performance Characteristic Test Results Table A.1 (continued 4) Schedule of Records of 4024D/E/F/G Spectrum Analyzer Inspection item Unit Standards Inspection result ±1.00 -30dBm ±1.00 -40dBm Scale fidelity ±1.00 -50dBm ±1.00 -60dBm 50MHz(Atten 0dB,Input power -25dBm): ±1.80 50MHz(Atten 10dB,Input power -25dBm): ±1.80 50MHz (Atten 20dB,...
- Page 209 Appendix A Performance Characteristic Test Results Table A.1 (continued 5) Schedule of Records of 4024D/E/F/G Spectrum Analyzer Inspection item Unit Standards Inspection result 32GHz(Atten 0dB,Input power -25dBm): ±2.30 32GHz (Atten 10dB, Input power -25dBm) : ±2.30 32GHz (Atten 20dB, Input power -25dBm) : ±2.30 32GHz(Atten 30dB,Input power -5dBm): ±2.30...
- Page 210 Appendix A Performance Characteristic Test Results Table A.1 (continued 6) Schedule of Records of 4024D/E/F/G Spectrum Analyzer Inspection item Unit Standards Inspection result ±2.30 29.5GHz(Atten 0dB,Input power -25dBm): ±2.30 30.5GHz)(Atten 0dB,Input power -25dBm): ±2.30 31.5GHz(Atten 0dB,Input power -25dBm): ±2.30 32.5GHz(Atten 0dB,Input power -25dBm): ±2.30 33.5GHz(Atten 0dB,Input power -25dBm): Total level...
- Page 211 Appendix A Performance Characteristic Test Results Table A.2 Schedule of Records of 4024A/B/C Spectrum Analyzer Inspection item Unit Standards Test result Structure type: Handheld Appearance color: black Design and The instrument surface should be smooth with no burr, obvious structure mechanical damage or coating damage.
- Page 212 Appendix A Performance Characteristic Test Results Table A.2 (continued 1) Schedule of Records of 4024A/B/C Spectrum Analyzer Inspection item Unit Standards Test result 7.0GHz (frequency span 500kHz) : ±15.90 7.0GHz (frequency span 50MHz) : ±1.03 7.0GHz (frequency span 500MHz): ±10.30 Frequency reading accuracy 8.0GHz (frequency span 500kHz) :...
- Page 213 Appendix A Performance Characteristic Test Results Table A.2 (continued 2) Schedule of Records of 4024A/B/C Spectrum Analyzer Inspection item Unit Standards Inspection 100Hz ±1.20 30Hz ±1.20 Resolution BandwidthConversion 10Hz ±1.20 uncertainty ±1.20 ±1.20 ≤-108 dBc/Hz +10kHz ≤-108 dBc/Hz -10kHz ≤-112 dBc/Hz +100kHz ≤-112...
- Page 214 Appendix A Performance Characteristic Test Results Table A.2 (continued 3) Schedule of Records of 4024A/B/C Spectrum Analyzer Inspection item Unit Standards Inspection result ≤-95 10MHz~9GHz(Pre-amplifier On) Residual response ≤-82 10MHz~9GHz(Pre-amplifier Off) Log type:-120dBm~+30dBm,1dB step Range Linear scale: 22.36uV~7.07V,0.1% step 0dBm Reference -10dBm ±1.20...
- Page 215 Appendix A Performance Characteristic Test Results Table A.2 (continued 4) Schedule of Records of 4024A/B/C Spectrum Analyzer Inspection item Unit Standards Inspection result 6000MHz(Atten 10dB,Input power -25dBm): ±1.80 6000MHz(Atten 20dB,Input power -25dBm): ±1.80 6000MHz(Atten 30dB,Input power -5dBm): ±1.80 7000MHz(Atten 0dB,Input power -25dBm): ±1.80 7000MHz(Atten 10dB,Input power -25dBm): ±1.80...
- Page 216 Appendix A Performance Characteristic Test Results Table A.2 (continued 5) Schedule of Records of 4024A/B/C Spectrum Analyzer Inspection item Unit Standards Inspection result 0~30dB,5dB Step Range 0dB Attenuation Reference 5dB Attenuation ±1.20 10dB Attenuation ±1.20 Switching uncertainty 15dB Attenuation ±1.20 (50MHz)...
- Page 217 Appendix A Performance Characteristic Test Results Table A.3 Schedule of Records of 4024 Spectrum Analyzer (tracking Generator option) Inspection item Unit Standards Inspection result Lower limit 100kHz frequency Range Upper limit Upper limit of frequency 100MHz ±80.00 1000MHz ±0.80 2000MHz ±1.60 frequency accuracy 4000MHz...
- Page 218 Appendix A Performance Characteristic Test Results Table A.3 (continued 1) Schedule of Records of 4024 Spectrum Analyzer (tracking Generator option) Inspection item Unit Standards Inspection result 4000MHz,-20dBm out ±2.50 4000MHz,-30dBm out ±2.50 4000MHz,-40dBm out ±2.50 6000MHz,0dBm out ±2.50 6000MHz,-5dBm out ±2.50 6000MHz,-10dBm out ±2.50...
Need help?
Do you have a question about the 4024 Series and is the answer not in the manual?
Questions and answers