Table of Contents
Advertisement
Quick Links
User Guide
Remote Spectrum Monitor™
MS27201A
High-Performance RF Spectrum Monitor
MS27201A-0709 9 kHz to 9 GHz (Option 709)
MS27201A-0720 9 kHz to 20 GHz (Option 720)
MS27201A-0743 9 kHz to 43.5 GHz (Option 743)
Anritsu Company
Part Number: 10580-00480
490 Jarvis Drive
Revision: A
Morgan Hill, CA 95037-2809
Published: January 2022
USA
Copyright 2022 Anritsu Company
Advertisement
Table of Contents

Related Manuals for Anritsu MS2720 A Series


Summary of Contents for Anritsu MS2720 A Series
- Page 1 MS27201A-0709 9 kHz to 9 GHz (Option 709) MS27201A-0720 9 kHz to 20 GHz (Option 720) MS27201A-0743 9 kHz to 43.5 GHz (Option 743) Anritsu Company Part Number: 10580-00480 490 Jarvis Drive Revision: A Morgan Hill, CA 95037-2809 Published: January 2022 Copyright 2022 Anritsu Company...
- Page 2 Anritsu Company. Export Management The Anritsu products identified herein and their respective manuals may require an Export License or approval by the government of the product country of origin for re-export from your country. Before you export these products or any of their manuals, please contact Anritsu Company to confirm whether or not these items are export-controlled.
-
Page 3: Table Of Contents
Contacting Anritsu for Sales and Service ........ - Page 4 Table of Contents (Continued) 2-12 Settings Menu ............. 2-18 Display Settings .
- Page 5 Table of Contents (Continued) Setting Amplitude Parameters ..........3-15 Setting Amplitude Units .
- Page 6 Table of Contents (Continued) 3-13 Setting Up Limit Lines ............3-44 Simple Limit Line .
- Page 7 Table of Contents (Continued) Setting Frequency and Bandwidth Parameters ........4-4 Configuring the Band.
- Page 8 Table of Contents (Continued) 4-13 LTE Channel Spectrum............4-33 SETUP Menu (LTE Channel Spectrum) .
- Page 9 Table of Contents (Continued) Setting Sweep Parameters ........... 5-13 SWEEP Menu –...
- Page 10 Table of Contents (Continued) 5-18 Saving and Recalling Measurements ......... . . 5-50 Saving a Measurement .
-
Page 11: Chapter 1-General Information
For additional information and literature covering your product, visit the product page of your instrument and select the Library tab: https://www.anritsu.com/en-US/test-measurement/products/ms2720xa For more information and literature on Vision Spectrum Monitoring Application Software visit the product page and select the Library tab: https://www.anritsu.com/en-us/test-measurement/products/mx280001a... -
Page 12: Document Conventions
1-2 Instrument Description General Information Document Conventions The following conventions are used throughout the MS27201A documentation set. Instrument Identification When identifying a frequency option for the MS27201A, that option number is appended after the model number; example: MS27201A-0709. User Interface The MS27201A user interface consists of menus, buttons, toolbars, and dialog boxes. -
Page 13: Available Options
General Information 1-2 Instrument Description Available Options Available options for the Remote Spectrum Monitor are listed in Table 1-3. Table 1-3. Available Options Option Description MS27201A-0031 GPS Receiver (requires external GPS antenna) MS27201A-0104 110 MHz Analysis Bandwidth MS27201A-0089 Zero Span IF Output MS27201A-0090 Gated Sweep MS27201A-0124... -
Page 14: Instrument Care And Preventive Maintenance
1-3 Instrument Care and Preventive Maintenance General Information Instrument Care and Preventive Maintenance Instrument care and preventive maintenance consist of proper operation in a suitable environment, occasional cleaning of the instrument, and inspecting and cleaning the RF connectors and all accessories before use. Clean the instrument with a soft, lint-free cloth dampened with water or water and a mild cleaning solution. -
Page 15: Esd Caution
Anritsu recommends annual calibration and performance verification by local Anritsu service centers. Contacting Anritsu for Sales and Service To contact Anritsu, visit the following URL and select the services in your region: http://www.anritsu.com/contact-us MS27201A UG PN: 10580-00480 Rev. A... - Page 16 1-5 Contacting Anritsu for Sales and Service General Information PN: 10580-00480 Rev. A MS27201A UG...
-
Page 17: Chapter 2-Instrument Overview
Chapter 2 — Instrument Overview Introduction This chapter provides an overview of the Anritsu MS27201A RSM. It describes the instrument hardware features, general system settings and instrument configurations, and the connector panels. The Remote Spectrum Monitor uses a remote PC for the user interface. The interface menus can vary depending on the current measurement configuration, installed options, and selected instrument function. -
Page 18: Front Panel
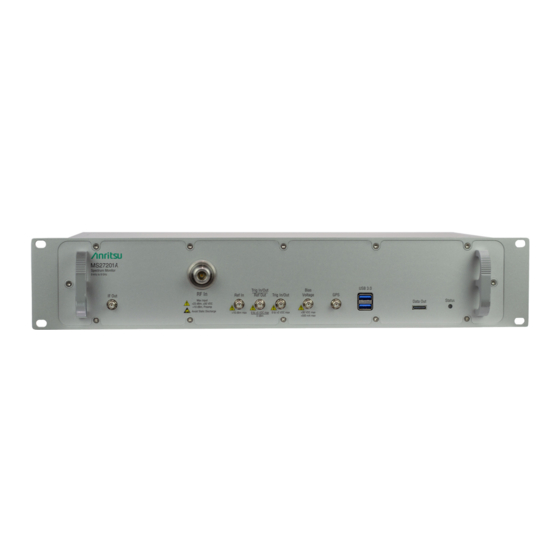
2-2 Front and Rear Panels Instrument Overview Front Panel Figure 2-1 shows the front connector panel on the MS27201A. Figure 2-1. Front Panel Connectors 1. RF In Port This is a 50 ruggedized connector of the following: • Type N female with options 709 and 720 •... -
Page 19: Rear Panel
Instrument Overview 2-2 Front and Rear Panels 7. Trigger In/Out A TTL signal that is applied to the external trigger 50 SMA connector causes a single sweep to occur. In spectrum analysis, triggering is generally used in zero span, and triggering occurs on the rising edge of the signal. -
Page 20: Turning On The Ms27201A Rsm
Turning On the MS27201A RSM The Anritsu MS27201A RSM is operated from a 15 VDC source connected to the rear panel. This can be achieved with either the Anritsu AC-DC adapter or the automotive power adapter, which can be purchased as an optional accessory. -
Page 21: Vision Monitor
• Signal ID for Broadcasters For more information and literature on Vision Spectrum Monitoring Application Software visit the product page and select the Library tab: https://www.anritsu.com/en-us/test-measurement/products/mx280001a PC Requirements for MS27201A Minimum computer requirements are listed below: • Intel Core i5 or higher processor •... -
Page 22: Installation
2-6 Installation Instrument Overview Installation Download the MS27201A software from the product page: http://www.anritsu.com/en-US/test-measurement/products/ms2720xa Launch the MS27201A executable file and follow the on-screen instructions after selecting YES on the User Account Control dialog box. Figure 2-3. MS27201A Installation PN: 10580-00480 Rev. A... -
Page 23: Connecting To The Ms27201A Or Localhost
Instrument Overview 2-7 Connecting to the MS27201A or Localhost Connecting to the MS27201A or Localhost Connecting to a networked instrument or to the localhost is established via the System menu. Insert the USB memory device into the instrument and wait for about 10 seconds. Insert the USB memory device onto a PC, then open the ip.txt file and copy the IP address in the HOSTNAME/IP ADDRESS field on the MS27201A software. -
Page 24: Gui Overview
2-8 GUI Overview Instrument Overview GUI Overview The MS27201A Remote Spectrum Monitor software controls all instrument functions. The software runs on a user-supplied PC. The figure below identifies the main display areas, which are each described in more detail later in this chapter. 1. -
Page 25: Common Gui Controls
Instrument Overview 2-8 GUI Overview Common GUI Controls The following lists common controls that you will encounter when working with the Remote Spectrum Monitor. The 3-line icon provides quick access to system information, settings, file management, and built-in diagnostic tools. Refer to Section 2-11 “System Menu”... -
Page 26: Data Entry
2-8 GUI Overview Instrument Overview Data Entry User input can be in the form of numeric values for instrument or measurement settings, selected values from a preset list, or alphanumeric text when entering file names, for example. To view or change a parameter value, access the appropriate menu or control, then enter data using menus. - Page 27 Instrument Overview 2-8 GUI Overview Selection Lists Some parameters and instrument functions are selectable from a list. These list boxes display the available selections and value limits as applicable. Scroll through the list and select the desired entry. Figure 2-7. Menu Selection Lists To cancel the selection, click somewhere else on the display or close the menu (X).
-
Page 28: Scroll Indication
2-8 GUI Overview Instrument Overview Scroll Indication In some cases, menus, status panels, or other lists contain more information than can be displayed in the available area. In these cases, the top or bottom of the panel will have a fade-to-white appearance as shown below. - Page 29 Instrument Overview 2-8 GUI Overview Text Entry and EZ Keyboard When an instrument function requires you to enter text, such as entering an Ethernet hostname, a virtual alphabetic keyboard is displayed. See Figure 2-9. Click the “?123” key to switch to the digits and symbols keyboard.
- Page 30 2-8 GUI Overview Instrument Overview To change a key’s value: Click the pencil (edit) key. The EZ keys will become highlighted. Figure 2-11. On-Screen EZ Keyboard Click the key to be edited. This will display the standard keyboard for entering a new EZ key value. Figure 2-12.
-
Page 31: Title Bar
Instrument Overview 2-9 Title Bar Title Bar The title bar is located at the top of the interface screen. It displays icons that provide access to information and user actions as described below. All of the icons are active and will open the appropriate menu or item when clicked. -
Page 32: Selecting The Analyzer
2-10 Selecting the Analyzer Instrument Overview 2-10 Selecting the Analyzer The instrument analyzers are selected from the 9-dot icon or the current measurement icon. To select an analyzer, press the 9-dot icon in the title bar or the current measurement icon to display the available analyzers, as illustrated in Figure 2-14. -
Page 33: System Menu
Instrument Overview 2-11 System Menu 2-11 System Menu The System menu identifies the instrument model and serial number. HOSTNAME/IP ADDRESS: Displayed only on the MS27201A PC application. This field is used to specify the IP address or hostname of an instrument that is connected to the network. -
Page 34: Notifications
2-12 Settings Menu Instrument Overview Notifications The notification area is where all dynamic notifications are presented. These notifications are generally information messages to the user and not hardware failure messages. Refer to “Self Test” on page 2-32 Appendix A, “Instrument Messages and Troubleshooting” for more diagnostic information. -
Page 35: Display Settings
Instrument Overview 2-12 Settings Menu Display Settings The DISPLAY settings allow you to set the display to a Default or Light color scheme, the latter of which may be more suitable for viewing in bright ambient conditions. Figure 2-19. Display Settings Network Settings The MS27201A uses Ethernet to communicate remotely with a controller. - Page 36 2-12 Settings Menu Instrument Overview The MS27201A can be configured for Dynamic Host Configuration Protocol (DHCP), an Internet protocol that automates the process of setting IP addresses for devices that use TCP/IP, and is the most common method of configuring a device for network use. To determine if a network is set up for DHCP, connect the instrument to the network and select DHCP protocol.
-
Page 37: Ethernet Settings
Instrument Overview 2-12 Settings Menu TCP/IP connectivity requires setting up the parameters described at the beginning of this section. The following is a brief overview of how to set up a general LAN connection on the MS27201A. You may need to consult your network documentation or network administrator for assistance in Note configuring your network setup. -
Page 38: Gps/Gnss Settings (Option 31)
2-12 Settings Menu Instrument Overview GPS/GNSS Settings (Option 31) The MS27201A RSM is available with a built-in global positioning receiver feature (Option 31) that can provide latitude, longitude, altitude, and UTC timing information. This option also enhances frequency reference oscillator accuracy. When the global positioning receiver is actively locked to satellites, this information is saved with all saved measurements. - Page 39 Instrument Overview 2-12 Settings Menu After GPS location fix is attained, the internal reference oscillator begins to correct its frequency to match the GPS standard. After the internal frequency is adjusted to match the GPS standard, the status is indicated by “GPS High Accuracy”...
-
Page 40: Screenshot Setup
2-12 Settings Menu Instrument Overview Screenshot Setup Access the System menu (3-line icon in the upper left corner). Click SETTINGS to access the instrument settings menu, then select SCREENSHOT to open the screenshot setup menu. Figure 2-22. Screenshot Setup Screenshot setup lets you configure the following: •... -
Page 41: Date Time Settings
Instrument Overview 2-12 Settings Menu Date Time Settings Access the System menu (3-line icon in the upper left corner). Click SETTINGS to access the instrument settings menu, then select DATE TIME to display the current date and time settings. Figure 2-23. Date Time Settings The Date Time setup lets you set the current date and time and the time zone. -
Page 42: Port Setup
2-12 Settings Menu Instrument Overview Port Setup The Port Setup menu allows you to configure the external ports. Bias Voltage Bias Voltage setup provides controls to set the voltage level and to monitor the precise voltage and current, and trip state. Access the System menu (3-line icon in the upper left corner). - Page 43 Instrument Overview 2-12 Settings Menu Reference and Trigger The reference and trigger setup provides controls to set the functionality of the configurable top panel reference and trigger ports. Access the System menu (3-line icon in the upper left corner). Click SETTINGS to access the instrument settings menu, then select PORT SETUP > REF / TRIG to display the top panel reference and trigger port settings.
-
Page 44: Options Settings
2-12 Settings Menu Instrument Overview Options Settings Access the System menu (3-line icon in the upper left corner). Click SETTINGS to access the instrument settings menu. Select OPTIONS to display the lists of currently installed software options on the left pane and those that are available for installation on the right pane. -
Page 45: Reset Settings
Instrument Overview 2-12 Settings Menu Reset Settings Access the System menu (3-line icon in the upper left corner). Click SETTINGS to access the instrument settings menu. Select RESET to open the Reset menu. Figure 2-28. Reset Settings The following reset options are available: SETTINGS RESET •... -
Page 46: Files
2-13 Files Instrument Overview 2-13 Files Access the System menu (3-line icon in the upper left corner). Click FILES to access the local PC file system by opening the windows file explorer. Figure 2-29. Files Menu Note To access the target file system, the user requires the use of the SCPI commands or an FTP client. FTP Access An FTP server has been included in the instrument to allow direct access to files stored on the instrument (or on a USB drive connected to the instrument) from a remote computer. -
Page 47: Diagnostics
Instrument Overview 2-14 Diagnostics 2-14 Diagnostics Click the System menu (3-line icon in the upper left corner). Click DIAGNOSTICS to access the instrument diagnostics menu, then select the diagnostic menu that you wish to open. Event Log: Opens the Event Log. -
Page 48: Self Test
The self test results can be saved to a file for future reference. Refer to Appendix A, “Instrument Messages and Troubleshooting” for more information. Figure 2-32. Self Test Service Mode The service mode is for Anritsu customer service use only. Figure 2-33. Service Mode 2-32 PN: 10580-00480 Rev. A MS27201A UG... -
Page 49: Tools Menu
Instrument Overview 2-15 Tools Menu 2-15 Tools Menu Access the System menu (3-line icon in the upper left corner). Select TOOLS to access the instrument tools menu, then select the tool menu that you wish to open. IQ STREAMING: Opens Streaming. -
Page 50: Map Tool
2-15 Tools Menu Instrument Overview Map Tool The MS27201A coverage mapping option includes an embedded, low detail world base map. The MAP TOOL provides access to downloadable, high detail map tiles for offline use during signal mapping. The map tiles that you download have the same detail that is accessible through an active Internet connection. - Page 51 Instrument Overview 2-15 Tools Menu 1. The map zoom tool is used to increase (+) or decrease (-) zoom level. You can also drag the zoom level indicator up or down, or you can pinch to change zoom level. 2. Indicates the number of tiles that can be downloaded, corresponding to the selected area. 3.
-
Page 52: Discovery Tool
2-15 Tools Menu Instrument Overview Discovery Tool The DISCOVERY TOOL menu displays all the compatible units on the local network and allows to connect with any one of the instruments. Click on the desired model and click CONNECT to connect with that instrument. Figure 2-38. -
Page 53: Software Update
FAT32 file system format, and follow the instructions below: Insert the USB memory device into your PC or laptop. From a browser, go to the following Anritsu products page: http://www.anritsu.com/en-US/test-measurement/products/ms2720xa On the product page, click Downloads and select Drivers/Firmware/Software. - Page 54 2-16 Software Update Instrument Overview Verify the Software Update Once the software update is complete, power off the MS27201A. Power on the MS27201A. Click the System menu icon (3-line icon) from the MS27201A to display the System Menu. Select the System Information menu (see Figure...
-
Page 55: Chapter 3-Spectrum Monitor Measurements
Introduction This chapter gives a brief overview of the Anritsu Remote Spectrum Monitor and is intended to assist you in your first use of the instrument. The purpose of this chapter is to provide a starting point for making basic measurement setups. -
Page 56: Spectrum Monitor Gui Overview
3-3 Spectrum Monitor GUI Overview Spectrum Monitor Measurements Spectrum Monitor GUI Overview This section illustrates the main graphical displays and menus presented for the spectrum monitor. Normal Spectrum View Normal Spectrum view is the default view and is suitable for viewing signals in the frequency domain where signal amplitude, bandwidth, and harmonic qualities can be studied. - Page 57 Spectrum Monitor Measurements 3-3 Spectrum Monitor GUI Overview 1. Status Panel: Each measurement features a unique status panel that displays settings and information relevant to the current measurement and view settings. 2. Markers: Markers are displayed as green diamonds on the trace to which they are assigned. The active marker is shown as a solid green diamond with a dashed vertical line.
-
Page 58: Spectrogram View
3-3 Spectrum Monitor GUI Overview Spectrum Monitor Measurements Spectrogram View Spectrogram view is useful for identifying intermittent signals and for providing historical signal data in a comprehensive view. It provides a multi-dimensional “waterfall” display representing frequency, time, and amplitude. Frequency and time are shown on a typical two-dimensional scale while amplitude is displayed in the color dimension. -
Page 59: Main Menu
Spectrum Monitor Measurements 3-4 Main Menu Main Menu The main menu is the primary access point for all instrument controls and measurement selections. The main function for each main menu button is described below. FREQ SPAN: Contains all frequency control settings such as center frequency, start and stop frequency, span, frequency offset, and frequency step. -
Page 60: Status Panel
3-5 Status Panel Spectrum Monitor Measurements Status Panel The status panel and features illustrated in this section are unique to the spectrum monitor and to the particular measurement and view that is selected. Below is the spectrum monitor status panel that covers basic spectrum, spectrogram, channel power, occupied bandwidth, adjacent channel power, and spectral emissions mask measurements (selected via MEASURE >... -
Page 61: Making Spectrum Monitor Measurements
Spectrum Monitor Measurements 3-6 Making Spectrum Monitor Measurements Making Spectrum Monitor Measurements Initial Setup • Connect a signal source to the RF In port of the instrument. For over-the-air measurements, connect an antenna that is appropriate for the frequency range to be measured. For connector descriptions, refer to “Front and Rear Panels”... -
Page 62: Setting Frequency Parameters
3-7 Setting Frequency Parameters Spectrum Monitor Measurements Setting Frequency Parameters Frequency-related parameters are set using the “FREQ / SPAN Menu” on page 3-11. The tuning frequency range can be entered in several different ways depending upon what makes the most sense, either for the user or for the measurement. -
Page 63: Using Offset Frequency
Spectrum Monitor Measurements 3-7 Setting Frequency Parameters Using Offset Frequency A user-defined frequency offset can be entered to adjust the frequency that is displayed on the instrument from the actual swept frequency. For example, if the DUT is an antenna system receiving signals in the 10 GHz range and offsetting the signals to the 1 GHz range, you can set a frequency offset in the spectrum monitor in order to display the actual received antenna frequency in the sweep window. - Page 64 3-7 Setting Frequency Parameters Spectrum Monitor Measurements The normal IF BW uses analog bandpass filters in the normal RBW chain. By changing the RBW, different filter bandwidths are selected. While the IF bandwidth is influenced by the selection of RBW filters, the digital RBW filters themselves are not employed.
-
Page 65: Freq / Span Menu
Spectrum Monitor Measurements 3-7 Setting Frequency Parameters FREQ / SPAN Menu CENTER FREQUENCY: Sets the center frequency of the sweep range. The current span setting will remain constant or will be adjusted to accommodate the start and stop frequency range of the instrument. The center frequency can also be dragged on the display when gestures are not toggled off. -
Page 66: Freq / Span Menu (Zero Span)
3-7 Setting Frequency Parameters Spectrum Monitor Measurements FREQ / SPAN Menu (Zero Span) CENTER FREQUENCY: Sets the center frequency of the sweep range. The current span setting will remain constant or will be adjusted to accommodate the start and stop frequency range of the instrument. -
Page 67: Gestures Menu
Spectrum Monitor Measurements 3-7 Setting Frequency Parameters GESTURES Menu DRAG: Toggles the drag feature on or off. When toggled off, the center frequency will not change when dragging the spectrum display. This can be useful when dragging markers. PINCH: Toggles the touchscreen pinch feature on or off. When toggled off, the span frequency will not change when pinching the spectrum display. -
Page 68: Operating The Touch Screen
3-7 Setting Frequency Parameters Spectrum Monitor Measurements Operating the Touch Screen Remote Spectrum Monitor uses common touch gestures to achieve a variety of operations. These include interactions on hot areas by pressing, double pressing (or tapping), dragging, and pinching. Single Press: Most controls require a single press or tap. -
Page 69: Setting Amplitude Parameters
Spectrum Monitor Measurements 3-8 Setting Amplitude Parameters Setting Amplitude Parameters The amplitude scale corresponds to the y-axis display. The MS2720xA supports both log units (such as dBm and dBV) and linear units of scale (such as volts or watts). Amplitude-related parameters are set using the “AMPLITUDE Menu”... -
Page 70: Setting Amplitude Range And Scale
3-8 Setting Amplitude Parameters Spectrum Monitor Measurements Setting Amplitude Range and Scale This setting applies to most monitor modes of operation and allows you to set the y-axis graticule scale for log-based units only. Click AMPLITUDE > SCALE/DIV. Enter the desired number of units per division. Reference Level Offset for External Loss or External Gain To obtain accurate measurements, you can compensate for any external attenuation or gain by using a reference level offset. -
Page 71: Preamplifier
Spectrum Monitor Measurements 3-8 Setting Amplitude Parameters Preamplifier The preamplifier can be turned on and off by toggling PRE AMP via the status panel or the AMPLITUDE menu. Figure 3-12 shows the noise floor with the preamplifier off (1) and on (2). Note that when the preamplifier is turned on, the noise floor drops significantly and a low-level signal is exposed. -
Page 72: Amplitude Menu
3-8 Setting Amplitude Parameters Spectrum Monitor Measurements AMPLITUDE Menu REF LEVEL: The reference level is the top graticule line on the measurement display. If the reference level offset is not zero, the offset reference level is displayed at this location. Clicking the plus (+) or minus (–) control increments the value by 10. The plus/minus (+/-) button on the keypad toggles between positive and negative values. -
Page 73: Setting Bandwidth Parameters
Spectrum Monitor Measurements 3-9 Setting Bandwidth Parameters Setting Bandwidth Parameters Bandwidth parameters are set using the “BANDWIDTH Menu” on page 3-21. Resolution Bandwidth Resolution Bandwidth (RBW) determines frequency selectivity. The spectrum monitor traces the shape of the RBW filter as it tunes past a signal. The choice of resolution bandwidth depends on several factors. Filters take time to settle. -
Page 74: Setting Frequency Bandwidth
3-9 Setting Bandwidth Parameters Spectrum Monitor Measurements Setting Frequency Bandwidth Click BANDWIDTH on the main menu. Toggle AUTO RBW or AUTO VBW (or both) off to manually change values. If using Auto, refer to the following sections. Set the RBW and VBW to achieve the desired resolution and sweep characteristics. Lower values increase resolution and reduce noise, but at the expense of measurement (sweep) speed. -
Page 75: Bandwidth Menu
Spectrum Monitor Measurements 3-9 Setting Bandwidth Parameters BANDWIDTH Menu AUTO RBW: When toggled on, the instrument selects the resolution bandwidth based on the current span width. The ratio of span width to RBW can be specified using the SPAN:RBW button. When toggled off (manual), the RBW label at the left edge of the x-axis will be preceded by the “#”... -
Page 76: Setting Trace Parameters
3-10 Setting Trace Parameters Spectrum Monitor Measurements 3-10 Setting Trace Parameters Remote Spectrum Monitor can display up to 6 traces simultaneously. Traces can be enabled from the TRACE menu by selecting the trace from the available selections, or you can select a trace in the Status panel to make it active. -
Page 77: Trace Menu (Spectrum View)
Spectrum Monitor Measurements 3-10 Setting Trace Parameters TRACE Menu (Spectrum View) SELECT: Selects traces 1 through 6. Selecting a trace that is off turns the trace on. The trace type will be Clear/Write, the trace mode will be Active, and the detector type will be Peak. - Page 78 3-10 Setting Trace Parameters Spectrum Monitor Measurements DETECTOR TYPE: Selects one of the available detector types. Several detection methods tailor the function of the instrument to meet specific measurement requirements. There are often more measurement points across the screen than display points. The various detection methods are different ways of showing each display point (see “Trace Detector Types”...
-
Page 79: Trace Detector Types
Spectrum Monitor Measurements 3-10 Setting Trace Parameters Trace Detector Types The figure below illustrates how the available detector types determine a trace data point from the sampled data. Peak Detection RMS/Ave Detection Sampled Frequency Point Data Sampled Frequency Point Data Time Time Negative Detection... -
Page 80: Cursors In Spectrogram View
3-10 Setting Trace Parameters Spectrum Monitor Measurements Cursors in Spectrogram View The screenshot below shows the MS2720xA with all six cursors enabled on a signal. Cursors are shown on the spectrogram as white lines. The active cursor is a solid white line and other cursors show as dashed white lines. -
Page 81: Trace Menu (Spectrogram View)
Spectrum Monitor Measurements 3-10 Setting Trace Parameters TRACE Menu (Spectrogram View) When the combined Spectrogram view is selected (MEASURE > VIEW > Combined), the TRACE and SETUP menus are updated with spectrogram and cursor setup controls. TYPE: Selects one of the following types of traces: •... -
Page 82: Trace Cursor Menu
3-10 Setting Trace Parameters Spectrum Monitor Measurements TRACE CURSOR Menu MODE: Every trace captured in the spectrogram has a time and a position index. Set the location of the spectrogram cursor based on either the time index or the position index. When position is selected, you can change the position index of the cursor from the POSITION button. -
Page 83: Trace Recording, Playback, And Csv Logging
Spectrum Monitor Measurements 3-10 Setting Trace Parameters Trace Recording, Playback, and CSV Logging The MS2720xA supports recording and playing back of trace data. Recordings are actually made on sample data (not just trace points) so during playback, users can set different trace types or detectors for deeper analysis of the data. - Page 84 3-10 Setting Trace Parameters Spectrum Monitor Measurements 1. Recorded trace and spectrum waterfall. 8. Starts playback of the selected trace recording. During playback, the button changes to the PAUSE 2. Shows either the Recording or Playback indicator. button, allowing pausing of the playback. 3.
- Page 85 Spectrum Monitor Measurements 3-10 Setting Trace Parameters CSV Logging CSV logging provides much of the same functionality as trace recording described above, but a CSV log cannot be replayed. CSV logging allows continuous recording of either live trace data or playback trace data to a CSV file with frequency and amplitude information for all traces captured during the logging period.
-
Page 86: Trace Record Menu
3-10 Setting Trace Parameters Spectrum Monitor Measurements TRACE RECORD Menu The trace recording feature is accessed via the TRACE > RECORD menus. This feature allows you to record a trace for future playback on the instrument or PC application. RECORD: Starts a trace recording session and saves traces and setup data to a record file (.fmrec). -
Page 87: Trace Playback Menu
Spectrum Monitor Measurements 3-10 Setting Trace Parameters TRACE PLAYBACK Menu The trace playback feature is accessed via the TRACE > PLAYBACK menus. This feature allows you to play back a recorded trace (.fmrec) file on the instrument or PC application. A playback session must be started by first recalling a previously recorded session. -
Page 88: Trace Csv Logging Menu
3-10 Setting Trace Parameters Spectrum Monitor Measurements TRACE CSV LOGGING Menu The trace CSV capture feature is accessed via the TRACE > CSV CAPTURE menus. This feature allows you to capture trace data in comma separated value (.csv) format. RECORD: Starts a recording session and saves trace and setup data to a CSV file (.csv). -
Page 89: Setting Sweep Parameters
“smeared” look to it, with the spectral lines being wider than normal and shifted to the right and at a lower amplitude than is correct. Anritsu Remote Spectrum Monitor is designed to relieve the user from having to calculate the sweep speed or experiment to discover a sweep speed that yields accurate results. When changing the RBW and VBW, the sweep speed automatically changes to the fastest sweep speed that will yield accurate results. -
Page 90: Sweep Menu
3-11 Setting Sweep Parameters Spectrum Monitor Measurements SWEEP Menu CONTINUOUS: Toggles between continuous sweep and single sweep. When the toggle is off, the instrument is in single sweep. In single sweep, the results of a sweep are displayed on the screen while the instrument awaits a trigger event to start a new sweep. The current state of the instrument is displayed in the status panel. -
Page 91: Setting Up Markers
Spectrum Monitor Measurements 3-12 Setting Up Markers 3-12 Setting Up Markers Marker parameters are set using the “MARKER Menu” on page 3-39. Refer to the figure below when working with this section. 1. Normal spectrum view marker information display. 2. Marker located on trace. The active marker is indicated with solid green fill, other markers will show with a hollow fill, fixed markers show as a green X. -
Page 92: Placing A Normal Marker
3-12 Setting Up Markers Spectrum Monitor Measurements Placing a Normal Marker Click MARKER to display markers. If markers were off, Marker 1 will automatically be made active at the current center frequency. Select another marker using MARKER > SELECT, then select one of 12 available markers. If the marker was off, the marker will be made active and placed at the center frequency. -
Page 93: Marker Menu
Spectrum Monitor Measurements 3-12 Setting Up Markers MARKER Menu PEAK SEARCH: Opens the “MARKER PEAK SEARCH Menu” on page 3-40. SELECT: Turns on the selected marker if it is off or makes it the active marker if it is already turned on. Clicking the MARKER menu button for the first time will turn on Marker 1 as a normal marker at the center frequency, and open the MARKER menu. -
Page 94: Marker Peak Search Menu
3-12 Setting Up Markers Spectrum Monitor Measurements DELTA REFERENCE: Selects the Reference marker for a Delta marker. A Delta marker cannot be its own reference. Only Fixed and Normal markers may be used as a reference for Delta markers. TRACE: Selects the trace number to which the marker is currently attached. MARKER TABLE: Toggle on or off the marker table displayed below the screen. -
Page 95: Marker Functions
Spectrum Monitor Measurements 3-12 Setting Up Markers Marker Functions Noise Markers Noise Markers use an averaging routine applied to multiple data-point groups to calculate the readout, which is typically comparable to using 1 Hz bandwidth filtering. Because the noise marker routine uses groups of data points for the calculation, the noise marker should not be placed in close proximity to measurable signals. -
Page 96: Spectrogram With Cursors And Markers
3-12 Setting Up Markers Spectrum Monitor Measurements Spectrogram with Cursors and Markers In the spectrum window, markers are shown as hollow green diamonds on the trace to which they are assigned. Active markers have a solid fill with a vertical dashed line that can be used to drag the marker position. -
Page 97: Marker Table
Spectrum Monitor Measurements 3-12 Setting Up Markers Marker Table The marker table display is useful for displaying many marker parameters at once. The examples shown are for the regular Spectrum view (1) and for Spectrogram view (2). Both marker tables show the marker mode and corresponding X and Y values. -
Page 98: Setting Up Limit Lines
3-13 Setting Up Limit Lines Spectrum Monitor Measurements 3-13 Setting Up Limit Lines Limit lines allow you to monitor when trace data crosses a defined line. Two types of limit lines can be specified: lower limit lines and upper limit lines. Limit lines can be used for visual reference, pass/fail criteria, and to trigger a save on event. -
Page 99: Limit Line Envelope
Spectrum Monitor Measurements 3-13 Setting Up Limit Lines Limit Line Envelope Limit line envelope parameters are set using the “LIMIT ENVELOPE Menu” on page 3-49. The limit line envelope feature is a quick way to generate an envelope using the existing trace as a reference. You can set the envelope to square or slope and you can set the limit line offset from the trace when creating the envelope. -
Page 100: Limit Menu
3-13 Setting Up Limit Lines Spectrum Monitor Measurements LIMIT Menu SELECT: Selects UPPER or LOWER limit line for editing. ENABLED: Displays the selected limit when toggled on. ALARM: This setting is for toggling the alarm function on or off for the currently active limit line. -
Page 101: Limit Edit Menu
Spectrum Monitor Measurements 3-13 Setting Up Limit Lines LIMIT EDIT Menu SELECTED POINT: Displays the limit line point number. Click to select a different point from the displayed list. FREQUENCY: Sets the frequency of a limit line inflection point. The frequency of each point in a limit line can be individually set. -
Page 102: Limit Move Menu
3-13 Setting Up Limit Lines Spectrum Monitor Measurements LIMIT MOVE Menu CENTER: Clicking this button moves the center of the existing limit line to the center frequency of the measurement. The span of the existing limit line is not changed. Use this button as an easy way to move an existing limit line to the center of the sweep. -
Page 103: Limit Envelope Menu
Spectrum Monitor Measurements 3-13 Setting Up Limit Lines LIMIT ENVELOPE Menu SELECT: Click this button to select UPPER or LOWER for envelope design. ENVELOPE POINTS: This sets the desired number of envelope points. AMPLITUDE OFFSET: Use to define how far away from the trace to place the upper or lower envelope. -
Page 104: Setting Up Triggering
3-14 Setting Up Triggering Spectrum Monitor Measurements 3-14 Setting Up Triggering The TRIGGER menu is not available in regular swept frequency spectrum measurements. Trigger parameters for zero span are set using the “TRIGGER Menu in Zero Span” on page 3-50. IQ trigger (Option 124) is set using the “IQ TRIGGER Menu”... - Page 105 Spectrum Monitor Measurements 3-14 Setting Up Triggering Positive Edge Trigger High Threshold Hysteresis Level Not Triggered Low Threshold Negative Edge Trigger Figure 3-40. Trigger Levels and Hysteresis MS2720xA UG PN: 10580-00480 Rev. A 3-51...
-
Page 106: Setting Up Advanced Measurements
3-15 Setting Up Advanced Measurements Spectrum Monitor Measurements 3-15 Setting Up Advanced Measurements Refer to “Making Spectrum Monitor Measurements” on page 3-7 for basic information on setting up a spectrum measurement. This section provides setup information for making swept spectrum measurements. The Remote Spectrum Monitor features smart measurements that make setup easy. -
Page 107: Setup Menu (Spectrogram View)
Spectrum Monitor Measurements 3-15 Setting Up Advanced Measurements SETUP Menu (Spectrogram View) COLOR SCALE TOP: Defines the amplitudes where the top color on the color setup bar are applied. Any measurement above this amplitude will appear black on the spectrogram window. -
Page 108: Channel Power
3-16 Channel Power Spectrum Monitor Measurements 3-16 Channel Power Channel power measurements are set up using the “SETUP Menu (Channel Power)” on page 3-55. Channel power measurement is one of most common measurements for a radio transmitter. This test measures the output power, or channel power, of a transmitter over the frequency range. -
Page 109: Setup Menu (Channel Power)
Spectrum Monitor Measurements 3-16 Channel Power SETUP Menu (Channel Power) The channel power SETUP menu is available in MEASURE > MEASUREMENT > Channel Power > SETUP. Once the channel power measurement is selected, the SETUP menu can be quickly accessed by tapping on the summary display area below the spectrum window. -
Page 110: Occupied Bandwidth
3-17 Occupied Bandwidth Spectrum Monitor Measurements 3-17 Occupied Bandwidth Occupied bandwidth (OBW) measurements are set up using the “SETUP Menu (Occupied BW)” on page 3-57. Occupied Bandwidth is a common measurement performed on radio transmitters. This measurement calculates the bandwidth containing the total integrated power occupied in a given signal bandwidth. There are two different methods of calculation depending on the technique used to modulate the carrier. -
Page 111: Setup Menu (Occupied Bw)
Spectrum Monitor Measurements 3-17 Occupied Bandwidth SETUP Menu (Occupied BW) The occupied bandwidth SETUP menu is available in MEASURE > MEASUREMENT > OBW > SETUP. Once the OBW measurement is selected, the SETUP menu can be quickly accessed by tapping on the summary display area below the spectrum display. -
Page 112: Adjacent Channel Power
3-18 Adjacent Channel Power Spectrum Monitor Measurements 3-18 Adjacent Channel Power Adjacent Channel Power (ACP) measurements are set up using the “SETUP Menu (ACP)” on page 3-59. Adjacent channel power is a measure of the power that leaks into adjacent transmit channels. The ACP measurement measures the power present in the transmit channel (refer to “Channel Power”... -
Page 113: Setup Menu (Acp)
Spectrum Monitor Measurements 3-18 Adjacent Channel Power SETUP Menu (ACP) The Adjacent Channel Power SETUP menu is available in MEASURE > MEASUREMENT > ACP > SETUP. Once the ACP measurement is selected, the SETUP menu can be quickly accessed by tapping on the summary display area below the spectrum window. -
Page 114: Spectrum Emission Mask
3-19 Spectrum Emission Mask Spectrum Monitor Measurements 3-19 Spectrum Emission Mask The spectrum emission mask (SEM) measurement is a relative measurement method to identify the power level of out-of-band spurious emissions outside of the in-channel bandwidth signal. The SEM measures the power ratio between in-band and adjacent channels. -
Page 115: Spectrum Emission Mask Measurement Basic Setup
Spectrum Monitor Measurements 3-19 Spectrum Emission Mask Spectrum Emission Mask Measurement Basic Setup Select MEASURE > MEASUREMENT > SEM from the right side menu. Select SETUP and select upper or lower mask (5GNR P>38 dBm or 5GNR P<38 dBm). Enter the reference channel bandwidth. Toggle AUTO MAX PWR or set MANUAL MAX POWER. - Page 116 3-19 Spectrum Emission Mask Spectrum Monitor Measurements Save the file to a USB device and insert it into the MS2720xA. Click the IMPORT MASK button in the SEM SETUP menu and select the new file from the USB drive. The file name of the imported mask file will be displayed on the EXPORT MASK button. Click the SELECT MASK button and select Custom.
-
Page 117: Field Strength
“AMPLITUDE FIELD STRENGTH Menu” on page 3-64. The field strength measurement is used in conjunction with an Anritsu antenna that has known antenna factors. Users can also import custom antenna factors for antennas not listed on the standard antenna selection list. When the field strength measurement is enabled, an additional plot is shown at the bottom of the display, indicating the selected antenna factor over the currently set frequency span. -
Page 118: Amplitude Field Strength Menu
3-20 Field Strength Spectrum Monitor Measurements Frequency and level settings for many interfering signals can be set as follows: Set up the measurement frequency and bandwidth. Click the AMPLITIDE and set up the amplitude parameters. Click the FIELD STRENGTH button and enable FIELD STR. Click the ANTENNA button and select the antenna being used for the measurement. - Page 119 Spectrum Monitor Measurements 3-20 Field Strength If this is the first time exporting the file, read the instructions at the top of the file, then delete those rows: This is an EXAMPLE. Make sure to REPLACE and DELETE all existing content in this file, including these instructions.
-
Page 120: Antenna Calculations
3-20 Field Strength Spectrum Monitor Measurements Antenna Calculations This section provides a list of various antenna calculations to convert from one unit of measure to another. Definitions P = power in watts V = voltage level in volts R = resistance in ohms –3 –6 Note that 1 mW = 10... -
Page 121: Presetting The Monitor
Spectrum Monitor Measurements 3-21 Presetting the Monitor 3-21 Presetting the Monitor The PRESET menu sets certain settings to the default state. Preset only affects the current monitor configuration settings. Preset does not affect user files or system settings such as networking settings. For other reset options, such as a complete factory reset of the instrument, refer to Chapter “Reset Settings”... -
Page 122: Saving And Recalling Measurements
3-22 Saving and Recalling Measurements Spectrum Monitor Measurements 3-22 Saving and Recalling Measurements The Remote Spectrum Monitor can save measurement setups, native trace and CSV trace data, limit line setups, and screenshots. You can recall setup, native trace, and limit line files. For other file operations such as copy, move, and directory management, refer to Section 2-13 “Files”... -
Page 123: Recalling A Measurement
Spectrum Monitor Measurements 3-22 Saving and Recalling Measurements Recalling a Measurement You can recall a saved setup, native trace measurement, and a limit line. When recalling a setup, the instrument setup and operating state will be restored as it was when the setup was saved. When recalling a trace measurement, the instrument setup and on-screen measurement data will be restored as it was when the trace data was saved. -
Page 124: File Menu
3-22 Saving and Recalling Measurements Spectrum Monitor Measurements FILE Menu QUICK SAVE: saves a setup file immediately with the name shown in the button. The number in the name is incremented automatically so that the new name is ready for the next setup file to be saved. -
Page 125: Chapter 4-Lte Measurements
Chapter 4 — LTE Measurements Introduction This chapter gives a brief overview of the Anritsu Remote Spectrum Monitor Long Term Evolution (LTE) analyzer and its measurement capabilities. Th e purpose of this chapter is to provide a starting point for making LTE measurements. -
Page 126: Selecting The Analyzer
4-2 Selecting the Analyzer LTE Measurements Selecting the Analyzer The instrument analyzers are selected from the 9-dot icon or the current measurement icon. To select an analyzer, click the current measurement icon to display the available analyzers, illustrated in Figure 4-1. -
Page 127: Main Menu
LTE Measurements 4-3 Main Menu Main Menu The main menu is the primary access point for all instrument controls and measurement selections. The main function for each main menu button is described below. FREQ SPAN: Contains all frequency control settings such as center frequency, start and stop frequency, span, frequency offset, and frequency step. -
Page 128: Setting Frequency And Bandwidth Parameters
4-4 Setting Frequency and Bandwidth Parameters LTE Measurements Setting Frequency and Bandwidth Parameters Frequency and channel bandwidth parameters are set using the “FREQUENCY Menu” on page 4-4. The channel center frequency and bandwidth can be set manually. When set to manual band, the EARFCN is unassigned. -
Page 129: Signal Standards Dialog
LTE Measurements 4-4 Setting Frequency and Bandwidth Parameters SIGNAL STANDARDS Dialog The SIGNAL STADARDS dialog is available in all LTE measurements. Figure 4-4. SIGNAL STANDARDS Dialog (LTE Measurements) GESTURES Menu The GESTURES menu is only available in RF measurements (trace displays). DRAG: Toggles the drag feature on or off. -
Page 130: Setting Amplitude
4-5 Setting Amplitude LTE Measurements Setting Amplitude Amplitude-related parameters are set using the “AMPLITUDE Menu” on page 4-7. Setting Amplitude Parameters The MS2720xA LTE measurement has two different types of amplitude settings, one for the data capture used to decode the signal internally, and one for the display. The amplitude range refers to the amplitude level used to capture the data. -
Page 131: Indications Of Excessive Signal Level
LTE Measurements 4-5 Setting Amplitude Indications of Excessive Signal Level The Remote Spectrum Monitor has built-in features to help prevent input overload. These include auto attenuation and reference level. The instrument will also indicate when a received signal is too high for the current setup by displaying an “ADC Overrange”... -
Page 132: Setting Bandwidth Parameters
4-6 Setting Bandwidth Parameters LTE Measurements Setting Bandwidth Parameters BANDWIDTH Menu The BANDWIDTH menu is only available for RF measurements (trace display). See the “LTE Measurement Setup” on page 4-20. AUTO RBW: When toggle on, the instrument selects the resolution bandwidth based on the current span width. -
Page 133: Setting Trace Parameters
LTE Measurements 4-7 Setting Trace Parameters Setting Trace Parameters Just as in the spectrum analyzer, Remote Spectrum Monitor can display up to 6 traces simultaneously in LTE RF-based measurements ( Traces can be enabled from the refer to Section 4‐10 “LTE Measurement Setup”). TRACE menu by selecting the trace from the available selections, or you can select a trace in the left side status panel to make it active. - Page 134 4-7 Setting Trace Parameters LTE Measurements DETECTOR TYPE: Selects one of three detector types. Several detection methods tailor the function of the instrument to meet specific measurement requirements. There are often more measurement points across the screen than display points. The various detection methods are different ways of dealing with how measurement points will be shown at each display point (see “Trace Detector Types”...
-
Page 135: Setting Sweep Parameters
LTE Measurements 4-8 Setting Sweep Parameters Setting Sweep Parameters When setting up an LTE Demod Summary measurement, sweep parameters are set using the “SWEEP Menu – LTE Demod Summary Measurements” on page 4-11. When setting up an LTE RF measurement, sweep parameters are set using the “SWEEP Menu –... -
Page 136: Gated Sweep (Option 90)
4-8 Setting Sweep Parameters LTE Measurements Gated Sweep (Option 90) Gated sweep is only available on instruments with Option 90 installed and only when an RF-based measurement is selected (Channel Power or Channel Spectrum). Gated sweep allows you to synchronize your sweep with an event so that the analyzer collects data at the appropriate time. -
Page 137: Gated Sweep Menu
LTE Measurements 4-8 Setting Sweep Parameters GATED SWEEP Menu GATED SWEEP: Toggles gated sweep on or off. GATED SOURCE: Selects the trigger source for the gated sweep. • GPS: This setting synchronizes the trigger source to the GPS PPS. • External 1 or 2: Sets the gate reference based on input from the External 1 or External 2 port. -
Page 138: Power Vs. Time Display
4-8 Setting Sweep Parameters LTE Measurements POWER VS. TIME Display When power vs time is enabled, a time-domain graph is presented. This graph is a useful visual aid when setting up the GATE DELAY (1) and GATE LENGTH (2) times as you can simultaneously view the signal level within the set frame and relative to your gate delay and length. -
Page 139: Setting Up Markers
LTE Measurements 4-9 Setting Up Markers Setting Up Markers Marker parameters are set using the “MARKER Menu” on page 4-17. Markers are only available in LTE spectrum-based measurements. For example, non-spectrum-based measurements such as Demod Summary, Carrier Aggregation, Multi PCI, Note Control Channel, Constellation, and Frame Power measurements suppress the Marker menu completely. -
Page 140: Placing A Fixed Marker
4-9 Setting Up Markers LTE Measurements Enter a new FREQUENCY value. Drag the marker on the trace (note that anywhere on the vertical dashed blue line can be touched to drag a marker’s position. Use the PEAK SEARCH menu and the desired peak search function to automatically find signal peaks (refer to “MARKER PEAK SEARCH Menu”... -
Page 141: Marker Menu
LTE Measurements 4-9 Setting Up Markers MARKER Menu PEAK SEARCH: Opens the “MARKER PEAK SEARCH Menu” on page 4-18. SELECT: Turns on the selected marker if it is off or makes it the active marker if it is already turned on. Clicking the MARKER menu button for the first time will turn on Marker 1 as a normal marker at the center frequency, and open the MARKER menu. -
Page 142: Marker Peak Search Menu
4-9 Setting Up Markers LTE Measurements MARKER PEAK SEARCH Menu SELECT: If the selected marker is off it will be turned on and the selected marker positioned at the peak of Trace 1. If the selected marker is on, then it will become the active marker and any subsequent actions in the PEAK SEARCH menu will apply to the selected marker. -
Page 143: Marker Functions
LTE Measurements 4-9 Setting Up Markers Marker Functions Noise Markers Noise Markers use an averaging routine applied to multiple data-point groups to calculate the readout, which is typically comparable to using 1 Hz bandwidth filtering. Because the noise marker routine uses groups of data points for the calculation, the noise marker should not be placed in close proximity to measurable signals. -
Page 144: Lte Measurement Setup
4-10 LTE Measurement Setup LTE Measurements 4-10 LTE Measurement Setup LTE base station validation qualifies the performance of both FDD and TDD gNB base stations with essential measurements that are in full compliance with 3GPP. The LTE analyzer features smart measurements that make configuring these measurements and views for LTE compliance testing easy: •... -
Page 145: Measure Menu (Lte)
LTE Measurements 4-10 LTE Measurement Setup MEASURE Menu (LTE) MEASUREMENT: Selects the desired measurement type from the following list: • LTE Demod Summary: Displays the current beam measurement status in a quick-view summary that includes the PCI and received power measurement summaries. -
Page 146: Lte Demod Summary And Multi Pci
4-11 LTE Demod Summary and Multi PCI LTE Measurements 4-11 LTE Demod Summary and Multi PCI LTE demod summary measurements are used for compliance testing of 3GPP LTE networks and can evaluate active antenna systems for dynamic physical layer attributes and received power levels of the transmitted signal. - Page 147 LTE Measurements 4-11 LTE Demod Summary and Multi PCI 1. LTE Analyzer Status Panel: Each measurement features a unique status panel that displays settings and information relevant to the current measurement and view settings. This panel provides quick access to the MIMO antenna selection and status, sweep setting, and frequency and bandwidth configuration.
-
Page 148: Lte Time Alignment Error (Tae) View
4-11 LTE Demod Summary and Multi PCI LTE Measurements LTE Time Alignment Error (TAE) View An example LTE time alignment error measurement is shown in Figure 4-21. 1. LTE Analyzer Status Panel: Each measurement features a unique status panel that displays settings and information relevant to the current measurement and view settings. -
Page 149: Lte Resource Block View
LTE Measurements 4-11 LTE Demod Summary and Multi PCI LTE Resource Block View An example LTE resource block measurement is shown in Figure 4-22. 1. LTE Analyzer Status Panel: Each measurement features a unique status panel that displays settings and information relevant to the current measurement and view settings. -
Page 150: Setup Menu (Lte Demod Summary)
4-11 LTE Demod Summary and Multi PCI LTE Measurements SETUP Menu (LTE Demod Summary) The SETUP menu is available in MEASURE > MEASUREMENT > Demod Summary > SETUP. ANTENNA: Sets the MIMO antenna number (0 to 3, or AUTO) to use during a measurement. -
Page 151: Lte Multi Pci
LTE Measurements 4-11 LTE Demod Summary and Multi PCI LTE Multi PCI The following measurement is set up to display LTE Multi PCI data. The multi PCI displays the measurement results of every detected beam in a single, sortable table with a bar graph of the selected measurement. Figure 4-25. - Page 152 4-11 LTE Demod Summary and Multi PCI LTE Measurements 1. LTE Analyzer Status Panel: Each measurement features a unique status panel that displays settings and information relevant to the current measurement and view settings. This panel provides quick access to the measurement frequency and band configuration.
-
Page 153: Setup Menu (Lte Multi Pci)
LTE Measurements 4-11 LTE Demod Summary and Multi PCI SETUP Menu (LTE Multi PCI) The SETUP menu is available in MEASURE > MEASUREMENT > Multi PCI > SETUP. CYCLIC PREFIX: Sets the cyclic prefix (or guard time interval) to Normal, Extended, or Auto. -
Page 154: Lte Channel Power
4-12 LTE Channel Power LTE Measurements 4-12 LTE Channel Power Channel power measurements are one of most common measurements for a radio transmitter. This test measures the output power of a transmitter within the specified channel bandwidth. Out-of-specification power measurements indicate system faults, which can be in the power amplifiers or in filter circuits. Channel power measurements can be used to validate transmitter performance, comply with government regulations, or to keep overall system interference at a minimum. -
Page 155: Setup Menu (Lte Channel Power)
LTE Measurements 4-12 LTE Channel Power SETUP Menu (LTE Channel Power) The channel power SETUP menu is available in MEASURE > MEASUREMENT > Channel Power > SETUP. Once the channel power measurement is selected, the SETUP menu can be quickly accessed by tapping on the summary display area below the spectrum display. -
Page 156: Status Panel (Lte Channel Power)
4-12 LTE Channel Power LTE Measurements Status Panel (LTE Channel Power) The status panels illustrated in this section are unique to the current analyzer and to the particular measurement and view that is selected. Figure 4-30 shows the LTE status panel that covers the LTE channel power measurements. MIMO ANTENNAS: Toggles the current MIMO antenna setting between AUTO or to select one of the available antennas. -
Page 157: Lte Channel Spectrum
LTE Measurements 4-13 LTE Channel Spectrum 4-13 LTE Channel Spectrum Channel spectrum (occupied bandwidth) is a common measurement performed on radio transmitters. This measurement calculates the bandwidth containing the total integrated power occupied in a given signal bandwidth. There are two different methods of calculation depending upon the technique used to modulate the carrier. -
Page 158: Setup Menu (Lte Channel Spectrum)
4-13 LTE Channel Spectrum LTE Measurements 1. LTE Channel Spectrum Analyzer Status Panel: Each measurement features a unique status panel that displays settings and information relevant to the current measurement and view settings. This panel provides quick access to the measurement frequency and band configuration. See “Status Panel (LTE Channel Spectrum)”... -
Page 159: Status Panel (Lte Channel Spectrum)
LTE Measurements 4-13 LTE Channel Spectrum Status Panel (LTE Channel Spectrum) The status panels illustrated in this section are unique to the current analyzer and to the particular measurement and view that is selected. Figure 4-33 shows the LTE status panel that covers the LTE Channel Spectrum measurements. MIMO ANTENNAS: Toggles the current MIMO antenna setting between AUTO or to select one of the available antennas. -
Page 160: Lte Carrier Aggregation
4-14 LTE Carrier Aggregation LTE Measurements 4-14 LTE Carrier Aggregation LTE carrier aggregation measurements are used for compliance testing of 3GPP LTE networks and can evaluate active antenna systems for dynamic physical layer attributes and received power levels of the transmitted signal. -
Page 161: Setup Menu (Lte Carrier Aggregation)
LTE Measurements 4-14 LTE Carrier Aggregation SETUP Menu (LTE Carrier Aggregation) The carrier aggregation SETUP menu is available in MEASURE > MEASUREMENT > Carrier Aggregation > SETUP. CARRIER: Selects the component carrier to make active. The active carrier is highlighted in the summary display area and any setting changes will apply to the active carrier. -
Page 162: Status Panel (Lte Carrier Aggregation)
4-14 LTE Carrier Aggregation LTE Measurements Status Panel (LTE Carrier Aggregation) The status panels illustrated in this section are unique to the current analyzer and to the particular measurement and view that is selected. Figure 4-36 shows the LTE status panel that covers the LTE carrier aggregation measurement. CARRIER: Selects the component carrier to make active. -
Page 163: Lte Control Channel
LTE Measurements 4-15 LTE Control Channel 4-15 LTE Control Channel LTE control channel measurement shows the power levels of key physical layer control channels and can evaluate active antenna systems for dynamic physical layer attributes and received power levels. An example LTE control channel measurement is shown in Figure 4-37. -
Page 164: Setup Menu (Lte Control Channel)
4-15 LTE Control Channel LTE Measurements 1. LTE Analyzer Status Panel: Each measurement features a unique status panel that displays settings and information relevant to the current measurement and view settings. This panel provides quick access to the MIMO antenna selection and status, NG parameter, sweep setting, and channel bandwidth configuration. See “Status Panel (LTE Control Channel)”... -
Page 165: Status Panel (Lte Control Channel)
LTE Measurements 4-15 LTE Control Channel Status Panel (LTE Control Channel) The status panels illustrated in this section are unique to the current analyzer and to the particular measurement and view that is selected. Figure 4-39 shows the LTE status panel that covers the LTE control channel measurement. MIMO ANTENNAS: Toggles the current MIMO antenna setting between AUTO or to select one of the available antennas. -
Page 166: Lte Constellation
4-16 LTE Constellation LTE Measurements 4-16 LTE Constellation The LTE constellation measurement displays the demodulated symbol point location on an IQ coordinate plot, which illustrates the constellation of a particular modulation format. Remote Spectrum Monitor displays QPSK, 16-QAM, 64-QAM, and 256-QAM constellations with power and EVM tabular data. An example LTE constellation display and measurement is shown in Figure 4-40. - Page 167 LTE Measurements 4-16 LTE Constellation 1. LTE Analyzer Status Panel: Each measurement features a unique status panel that displays settings and information relevant to the current measurement and view settings. This panel provides quick access to the MIMO antenna selection and status, sweep setting, and channel bandwidth and frequency configuration. See “Status Panel (LTE Constellation)”...
- Page 168 4-16 LTE Constellation LTE Measurements Figure 4-41, “LTE Constellation Measurement Examples” illustrates example LTE constellation diagrams. The examples are presented with the reference point overlay enabled for the specific modulation type. A tighter grouping of points generally means a better quality signal with fewer symbol errors. Also, the point color indicates the relative symbol density at that location.
-
Page 169: Setup Menu (Lte Constellation)
LTE Measurements 4-16 LTE Constellation SETUP Menu (LTE Constellation) The constellation SETUP menu is available in MEASURE > MEASUREMENT > Constellation > SETUP. ANTENNA: Sets the MIMO antenna number (0 to 3, or AUTO) to use during a measurement. AUTO will use the antenna with the highest received signal power. CYCLIC PREFIX: Sets the cyclic prefix (or guard time interval) to Normal, Extended, or Auto. -
Page 170: Status Panel (Lte Constellation)
4-16 LTE Constellation LTE Measurements Status Panel (LTE Constellation) The status panels illustrated in this section are unique to the current analyzer and to the particular measurement and view that is selected. Figure 4-43 shows the LTE status panel that covers the LTE constellation measurement. MIMO ANTENNAS: Toggles the current MIMO antenna setting between AUTO or to select one of the available antennas. -
Page 171: Lte Frame Power
LTE Measurements 4-17 LTE Frame Power 4-17 LTE Frame Power LTE communication systems carry data in frames and sub-frames. The LTE frame power measurement provides a power vs. time view of the frame, sub-frames, and slots in an LTE signal. Two types of LTE frame structures are used: •... - Page 172 4-17 LTE Frame Power LTE Measurements 1. LTE Frame Power Status Panel: Each measurement features a unique status panel that displays settings and information relevant to the current measurement and view settings. This panel provides quick access to the measurement frequency and band configuration. See “Status Panel (LTE Frame Power)”...
-
Page 173: Setup Menu (Lte Frame Power)
LTE Measurements 4-17 LTE Frame Power SETUP Menu (LTE Frame Power) The Frame Power SETUP menu is available in MEASURE > MEASUREMENT > Frame Power > SETUP. Once the frame power measurement is selected, the SETUP menu can be quickly accessed by tapping on the summary display area below the trace display. -
Page 174: Status Panel (Lte Frame Power)
4-17 LTE Frame Power LTE Measurements Status Panel (LTE Frame Power) The status panels illustrated in this section are unique to the current analyzer and to the particular measurement and view that is selected. Figure 4-33 shows the LTE status panel that covers the LTE Frame Power measurement. MIMO ANTENNAS: Toggles the current MIMO antenna setting between AUTO or to select one of the available antennas. -
Page 175: Presetting The Analyzer
LTE Measurements 4-18 Presetting the Analyzer 4-18 Presetting the Analyzer The PRESET menu sets certain settings to the default state. Preset only affects the current analyzer settings, such as those for the spectrum analyzer or for the LTE analyzer. Preset does not affect user files or system settings such as networking settings. -
Page 176: Saving And Recalling Measurements
4-19 Saving and Recalling Measurements LTE Measurements 4-19 Saving and Recalling Measurements The Remote Spectrum Monitor can save measurement setups, native trace and CSV trace data, limit line setups, and screenshots. You can recall setup, native trace, and limit line files. For other file operations such as copy, move, and directory management, refer to Section 2-13 “Files”... -
Page 177: Recalling A Measurement
LTE Measurements 4-19 Saving and Recalling Measurements Recalling a Measurement You can recall a saved setup, native trace measurement, and a limit line. When recalling a setup, the instrument setup and operating state will be restored as it was when the setup was saved. When recalling a trace measurement, the instrument setup and on-screen measurement data will be restored as it was when the trace data was saved. -
Page 178: File Menu
4-19 Saving and Recalling Measurements LTE Measurements FILE Menu QUICK SAVE: saves a setup file immediately with the name shown in the button. The number in the name is incremented automatically so that the new name is ready for the next setup file to be saved. -
Page 179: Chapter 5-5Gnr Measurements
Chapter 5 — 5GNR Measurements Introduction This chapter gives a brief overview of the Anritsu Remote Spectrum Monitor 5GNR analyzer and its measurement capabilities. The purpose of this chapter is to provide a starting point for making 5GNR measurements. This chapter describes measurement setup, including selecting the analyzer and setting up frequency, bandwidth, amplitude, span, and markers. -
Page 180: Selecting The Analyzer
5-2 Selecting the Analyzer 5GNR Measurements Selecting the Analyzer The instrument analyzers are selected from the 9-dot icon or the current measurement icon. To select an analyzer, click the current measurement icon to display the available analyzers, illustrated in Figure 5-1. -
Page 181: Main Menu
5GNR Measurements 5-3 Main Menu Main Menu The main menu is the primary access point for all instrument controls and measurement selections. The main function for each main menu button is described below. FREQ SPAN: Contains all frequency control settings such as center frequency, start and stop frequency, span, frequency offset, and frequency step. -
Page 182: Setting Frequency And Band Parameters
5-4 Setting Frequency and Band Parameters 5GNR Measurements Setting Frequency and Band Parameters Frequency and band parameters are set using the “FREQUENCY Menu” on page 5-5. The channel center frequency can be set manually. When set to manual band, the ARFCN and GSCN are unassigned. When a predefined band is selected, the center frequency and SSB offset must be set by the ARFCN and GSCN, respectively. -
Page 183: Frequency Menu
5GNR Measurements 5-4 Setting Frequency and Band Parameters FREQUENCY Menu The FREQUENCY menu is available in all 5GNR measurements. BAND CONFIG: Opens the “BAND CONFIG Menu” below. CENTER FREQUENCY: Sets the center frequency of the measurement channel. Changing the center frequency sets the band to MANUAL. CHANNEL BW: Sets the measurement channel bandwidth. -
Page 184: Band Config Menu
5-4 Setting Frequency and Band Parameters 5GNR Measurements BAND CONFIG Menu The BAND CONFIG menu is available in all 5GNR measurements. BAND: Select MANUAL, Global All or one of the predefined bands. Selecting MANUAL disables ARFCN and GSCN settings. ARFCN: ARFCN is the absolute radio frequency channel number. The ARFCN is a unique identification number assigned to each radio channel within a communications spectrum. -
Page 185: Setting Amplitude
5GNR Measurements 5-5 Setting Amplitude Setting Amplitude Amplitude-related parameters are set using the “AMPLITUDE Menu” on page 5-9. Setting Amplitude Parameters The MS2720xA 5GNR measurement has two different types of amplitude settings, for the IQ capture used to decode the signal, and one for the display. The amplitude range refers to the amplitude level used to capture the data. -
Page 186: Indications Of Excessive Signal Level
5-5 Setting Amplitude 5GNR Measurements Indications of Excessive Signal Level The Remote Spectrum Monitor has built-in features to help prevent input overload. These include auto attenuation and reference level. The instrument will also indicate when a received signal is too high for the current setup by displaying an “ADC Overrange”... -
Page 187: Amplitude Menu
5GNR Measurements 5-5 Setting Amplitude AMPLITUDE Menu The AMPLITUDE menu is available in all 5GNR measurements. AUTO RANGE: The instrument will dynamically update the attenuation and preamp settings for the measurement. Auto range helps ensure that harmonics and spurs are not introduced into the measurements. -
Page 188: Setting Bandwidth Parameters
5-6 Setting Bandwidth Parameters 5GNR Measurements Setting Bandwidth Parameters BANDWIDTH Menu The BANDWIDTH menu is only available for RF-based measurements. See the “5GNR Measurement Setup” on page 5-22. AUTO RBW: When toggle on, the instrument selects the resolution bandwidth based on the current span width. -
Page 189: Setting Trace Parameters
5GNR Measurements 5-7 Setting Trace Parameters Setting Trace Parameters Traces are not used in 5GNR Summary measurements. Just as in the spectrum analyzer, Remote Spectrum Monitor can display up to 6 traces simultaneously in 5GNR RF-based measurements (refer to Section 5-10 “5GNR Measurement Setup”). - Page 190 5-7 Setting Trace Parameters 5GNR Measurements DETECTOR TYPE: Selects one of three detector types. Several detection methods tailor the function of the instrument to meet specific measurement requirements. There are often more measurement points across the screen than display points. The various detection methods are different ways of dealing with how measurement points will be shown at each display point (see “Trace Detector Types”...
-
Page 191: Sweep Menu - Summary Measurements
5GNR Measurements 5-8 Setting Sweep Parameters Setting Sweep Parameters When setting up a 5GNR Summary measurement, sweep parameters are set using the “SWEEP Menu – Summary Measurements” on page 5-13. When setting up a 5GNR RF measurement, sweep parameters are set using the “SWEEP Menu –... -
Page 192: Gated Sweep (Option 90)
5-8 Setting Sweep Parameters 5GNR Measurements Gated Sweep (Option 90) Gated sweep is only available on instruments with Option 90 installed and only when an RF-based measurement is selected (Channel Power, OBW, EIRP, etc.). Gated sweep allows you to synchronize your sweep with an event so that the analyzer collects data at the appropriate time. -
Page 193: Gated Sweep Menu
5GNR Measurements 5-8 Setting Sweep Parameters GATED SWEEP Menu GATED SWEEP: Toggles gated sweep on or off. GATED SOURCE: Selects the trigger source for the gated sweep. • GPS: This setting synchronizes the trigger source to the GPS PPS. • External 1 or 2: Sets the gate reference based on input from the External 1 or External 2 port. -
Page 194: Power Vs. Time Display
5-8 Setting Sweep Parameters 5GNR Measurements POWER VS. TIME Display When power vs time is enabled, a time-domain graph is presented. This graph is a useful visual aid when setting up the GATE DELAY (1) and GATE LENGTH (2) times as you can simultaneously view the signal level within the set frame and relative to your gate delay and length. -
Page 195: Setting Up Markers
5GNR Measurements 5-9 Setting Up Markers Setting Up Markers Markers are not used in 5GNR Summary measurements. Marker parameters are set using the “MARKER Menu” on page 5-19. Refer to the figure below when working with this section. 1. Normal spectrum view marker information display. 2. -
Page 196: Placing A Fixed Marker
5-9 Setting Up Markers 5GNR Measurements Placing a Fixed Marker Fixed markers are set up the same as normal markers above, but are set to Fixed using the MODE button. In addition to setting a fixed frequency, you can set a fixed amplitude. Fixed markers are typically used as a reference marker when measuring amplitude differences relative to an absolute value. -
Page 197: Marker Peak Search Menu
5GNR Measurements 5-9 Setting Up Markers MARKER Menu PEAK SEARCH: Opens the “MARKER PEAK SEARCH Menu” on page 5-20. SELECT: Turns on the selected marker if it is off or makes it the active marker if it is already turned on. Clicking the MARKER menu button for the first time will turn on Marker 1 as a normal marker at the center frequency, and open the MARKER menu. - Page 198 5-9 Setting Up Markers 5GNR Measurements MARKER PEAK SEARCH Menu SELECT: If the selected marker is off it will be turned on and the selected marker positioned at the peak of Trace 1. If the selected marker is on, then it will become the active marker and any subsequent actions in the PEAK SEARCH menu will apply to the selected marker.
- Page 199 5GNR Measurements 5-9 Setting Up Markers Marker Functions Noise Markers Noise Markers use an averaging routine applied to multiple data-point groups to calculate the readout, which is typically comparable to using 1 Hz bandwidth filtering. Because the noise marker routine uses groups of data points for the calculation, the noise marker should not be placed in close proximity to measurable signals.
-
Page 200: 5Gnr Measurement Setup
5-10 5GNR Measurement Setup 5GNR Measurements 5-10 5GNR Measurement Setup 5GNR base station validation qualifies the performance of gNB base stations with essential measurements that are in full compliance with 3GPP TS 38.104 V15. The 5GNR analyzer features smart measurements that make configuring these measurements and views for 5GNR compliance testing easy: •... -
Page 201: Measure Menu (5Gnr)
5GNR Measurements 5-10 5GNR Measurement Setup MEASURE Menu (5GNR) MEASUREMENT: Selects the desired measurement type from the following list: • 5GNR Summary: Displays the current beam measurement status in a quick-view summary that includes the PCI summary, sync signal (SS), and channel summary. “5GNR Summary and Multi PCI”... -
Page 202: 5Gnr Summary And Multi Pci
5-11 5GNR Summary and Multi PCI 5GNR Measurements 5-11 5GNR Summary and Multi PCI 5GNR summary measurements are used for compliance testing of 5GNR networks and can evaluate active antenna systems for beamforming profiles and dynamic physical layer attributes of the transmitted signal. Remote Spectrum Monitor can analyze a single physical-layer cell or multiple physical-layer cells at one time. - Page 203 5GNR Measurements 5-11 5GNR Summary and Multi PCI 1. 5GNR Analyzer Status Panel: Each measurement features a unique status panel that displays settings and information relevant to the current measurement and view settings. This panel provides quick access to the measurement frequency, subcarrier spacing, channel bandwidth, and band configuration.
-
Page 204: 5Gnr Summary Single Beam View
5-11 5GNR Summary and Multi PCI 5GNR Measurements 5GNR Summary Single Beam View 5GNR summary measurements in single beam view provide the same information as the multi beam view with added measurements as described in Figure 5-22. Figure 5-22. 5GNR Summary – Single Beam View (1 of 2) 5-26 PN: 10580-00480 Rev. - Page 205 5GNR Measurements 5-11 5GNR Summary and Multi PCI 1. 5GNR Analyzer Status Panel: Each measurement features a unique status panel that displays settings and information relevant to the current measurement and view settings. This panel provides quick access to the measurement frequency, subcarrier spacing, channel bandwidth, and band configuration.
-
Page 206: 5Gnr Multi Pci Scanner View
5-11 5GNR Summary and Multi PCI 5GNR Measurements 5GNR Multi PCI Scanner View The following measurement is set up to display 5GNR summary data of multiple cells in a multiple beam scanner view. In scanner view, a maximum of eight beams can be displayed at once on a single page. Remote Spectrum Monitor can capture data for as many as 64 beams in a total of eight pages. -
Page 207: 5Gnr Multi Pci Table View
5GNR Measurements 5-11 5GNR Summary and Multi PCI 5GNR Multi PCI Table View The following measurement is set up to display 5GNR Multi PCI data in a table view. The multi PCI table view displays the measurement results of every detected beam in a single, sortable table. 1. -
Page 208: Setup Menu (5Gnr Summary/Multi Pci)
5-11 5GNR Summary and Multi PCI 5GNR Measurements SETUP Menu (5GNR Summary/Multi PCI) The 5GNR Summary and Multi PCI SETUP menu is available in MEASURE > MEASUREMENT > 5GNR Summary or Multi PCI > SETUP. SINR THRESHOLD: Sets the threshold level that the secondary synchronization signal-to-noise and interference ratio that a beam must overcome to be analyzed. -
Page 209: Status Panel (5Gnr Summary/Multi Pci)
5GNR Measurements 5-11 5GNR Summary and Multi PCI Status Panel (5GNR Summary/Multi PCI) The status panels illustrated in this section are unique to the current analyzer and to the particular measurement and view that is selected. Figure 5-26 shows the 5GNR status panel that covers the 5GNR summary and Multi PCI measurements. SWEEP: Toggles the current sweep setting between continuously or sweep once. -
Page 210: 5Gnr Channel Power
5-12 5GNR Channel Power 5GNR Measurements 5-12 5GNR Channel Power Channel power measurements are one of most common measurements for a radio transmitter. This test measures the output power of a transmitter within the specified channel bandwidth. Out-of-specification power measurements indicate system faults, which can be in the power amplifiers or in filter circuits. Channel power measurements can be used to validate transmitter performance, comply with government regulations, or to keep overall system interference at a minimum. -
Page 211: Setup Menu (5Gnr Channel Power)
5GNR Measurements 5-12 5GNR Channel Power SETUP Menu (5GNR Channel Power) The Channel Power SETUP menu is available in MEASURE > MEASUREMENT > Channel Power > SETUP. Once the channel power measurement is selected, the SETUP menu can be quickly accessed by tapping on the summary display area below the spectrum display. -
Page 212: Status Panel (5Gnr Channel Power)
5-12 5GNR Channel Power 5GNR Measurements Status Panel (5GNR Channel Power) The status panels illustrated in this section are unique to the current analyzer and to the particular measurement and view that is selected. Figure 5-29 shows the 5GNR status panel that covers the 5GNR channel power measurements. SWEEP: Toggles the current sweep setting between continuously or sweep once. -
Page 213: 5Gnr Occupied Bandwidth
5GNR Measurements 5-13 5GNR Occupied Bandwidth 5-13 5GNR Occupied Bandwidth Occupied Bandwidth (OBW) is a common measurement performed on radio transmitters. This measurement calculates the bandwidth containing the total integrated power occupied in a given signal bandwidth. There are two different methods of calculation depending upon the technique used to modulate the carrier. •... -
Page 214: Setup Menu (5Gnr Obw)
5-13 5GNR Occupied Bandwidth 5GNR Measurements 1. 5GNR Analyzer Status Panel: Each measurement features a unique status panel that displays settings and information relevant to the current measurement and view settings. This panel provides quick access to the measurement frequency, subcarrier spacing, channel bandwidth, and band configuration. See “Status Panel (5GNR OBW)”... -
Page 215: Status Panel (5Gnr Obw)
5GNR Measurements 5-13 5GNR Occupied Bandwidth Status Panel (5GNR OBW) The status panels illustrated in this section are unique to the current analyzer and to the particular measurement and view that is selected. Figure 5-32 shows the 5GNR status panel that covers the 5GNR OBW measurements. SWEEP: Toggles the current sweep setting between continuously or sweep once. -
Page 216: 5Gnr Eirp
5-14 5GNR EIRP 5GNR Measurements 5-14 5GNR EIRP In antenna measurements, EIRP is equivalent isotropic radiated power. The measured radiated power in a single direction is known as the EIRP. EIRP is especially valuable for over-the-air power measurements of 5GNR signals, which utilize beamforming for signal transmission, unlike older wireless technologies, which are typically radiated omnidirectionally. - Page 217 5GNR Measurements 5-14 5GNR EIRP 1. 5GNR Analyzer Status Panel: Each measurement features a unique status panel that displays settings and information relevant to the current measurement and view settings. This panel provides quick access to the measurement frequency, subcarrier spacing, channel bandwidth, and band configuration. See “Status Panel (5GNR EIRP)”...
- Page 218 5-14 5GNR EIRP 5GNR Measurements EIRP Normal View An EIRP measurement with the quick view is shown in Figure 5-34. This simplified view provides a conceptional visual of the EIRP measurement and displays the summary measurement data and input parameters. The adjustable parameters can be touched directly to change their value. Set up the measurement parameters using the “BAND CONFIG Menu”...
-
Page 219: Setup Menu (5Gnr Eirp)
5GNR Measurements 5-14 5GNR EIRP SETUP Menu (5GNR EIRP) The EIRP SETUP menu is available in MEASURE > MEASUREMENT > EIRP > SETUP. Once the EIRP measurement is selected in the normal view, the SETUP menu can be quickly accessed by tapping on the summary display area below the spectrum display. -
Page 220: Status Panel (5Gnr Eirp)
5-14 5GNR EIRP 5GNR Measurements Status Panel (5GNR EIRP) The status panels illustrated in this section are unique to the current analyzer and to the particular measurement and view that is selected. Figure 5-36 shows the 5GNR status panel that covers the 5GNR EIRP measurements. -
Page 221: 5Gnr Carrier Aggregation
5GNR Measurements 5-15 5GNR Carrier Aggregation 5-15 5GNR Carrier Aggregation 5GNR carrier aggregation measurements are used for compliance testing of 5GNR networks and can evaluate active antenna systems for dynamic physical layer attributes and received power levels of the transmitted signal. -
Page 222: Setup Menu (5Gnr Carrier Aggregation)
5-15 5GNR Carrier Aggregation 5GNR Measurements 1. 5GNR Analyzer Status Panel: Each measurement features a unique status panel that displays settings and information relevant to the current measurement and view settings. This panel provides quick access to the measurement frequency, subcarrier spacing, channel bandwidth, and band configuration. See “Status Panel (5GNR Carrier Aggregation)”... -
Page 223: Status Panel (5Gnr Carrier Aggregation)
5GNR Measurements 5-15 5GNR Carrier Aggregation Status Panel (5GNR Carrier Aggregation) The status panels illustrated in this section are unique to the current analyzer and to the particular measurement and view that is selected. Figure 5-39 shows the 5GNR status panel that covers the 5GNR carrier aggregation measurement. CARRIER: Selects the component carrier to make active. -
Page 224: 5Gnr Constellation
5-16 5GNR Constellation 5GNR Measurements 5-16 5GNR Constellation 5GNR constellation measurement displays the demodulated symbol point location of a selected SSB beam on an IQ coordinate plot, which illustrates the constellation of a particular modulation format. Remote Spectrum Monitor displays QPSK constellation with a PCI summary and power tabular data. An example 5GNR constellation display and measurement is shown in Figure 5-40. -
Page 225: Setup Menu (5Gnr Constellation)
5GNR Measurements 5-16 5GNR Constellation 1. 5GNR Analyzer Status Panel: Each measurement features a unique status panel that displays settings and information relevant to the current measurement and view settings. This panel provides quick access to the measurement frequency, subcarrier spacing, channel bandwidth, and band configuration. See “Status Panel (5GNR Constellation)”... -
Page 226: Status Panel (5Gnr Constellation)
5-16 5GNR Constellation 5GNR Measurements Status Panel (5GNR Constellation) The status panels illustrated in this section are unique to the current analyzer and to the particular measurement and view that is selected. Figure 5-42 shows the 5GNR status panel that covers the 5GNR constellation measurement. SWEEP: Toggles the current sweep setting between continuously or sweep once. -
Page 227: Presetting The Analyzer
5GNR Measurements 5-17 Presetting the Analyzer 5-17 Presetting the Analyzer The PRESET menu sets certain settings to the default state. Preset only affects the current analyzer settings, such as those for the spectrum analyzer or for the 5GNR analyzer. Preset does not affect user files or system settings such as networking settings. -
Page 228: Saving And Recalling Measurements
5-18 Saving and Recalling Measurements 5GNR Measurements 5-18 Saving and Recalling Measurements The Remote Spectrum Monitor can save measurement setups, native trace and CSV trace data, limit line setups, and screenshots. You can recall setup, native trace, and limit line files. For other file operations such as copy, move, and directory management, refer to Section 2-13 “Files”... -
Page 229: Recalling A Measurement
5GNR Measurements 5-18 Saving and Recalling Measurements Recalling a Measurement You can recall a saved setup, native trace measurement, and a limit line. When recalling a setup, the instrument setup and operating state will be restored as it was when the setup was saved. When recalling a trace measurement, the instrument setup and on-screen measurement data will be restored as it was when the trace data was saved. -
Page 230: File Menu
5-18 Saving and Recalling Measurements 5GNR Measurements FILE Menu QUICK SAVE: Saves a setup file immediately with the name shown in the button. The number in the name is incremented automatically so that the new name is ready for the next setup file to be saved. -
Page 231: Chapter 6-Iq Capture/Streaming (Option 124/125 And 126/127)
Chapter 6 — IQ Capture/Streaming (Option 124/125 and 126/127) Introduction IQ capture and streaming is available in the spectrum monitor mode. The feature attains the magnitude/phase or real/imaginary raw data components of a waveform and either saves the data to a file on internal or external USB storage media, or streams the data out of the Data, USB, or Ethernet ports. -
Page 232: Iq Frame Structure
6-3 IQ Data Format IQ Capture/Streaming (Option 124/125 and 126/127) IQ Frame Structure IQ data is organized into two levels: frame and extended frame. The lowest level is a 64 bit frame. which may contain one to four IQ sample pairs depending on the selected IQ bit resolution. The second level is an extended frame which can be used for the stamp information. -
Page 233: Iq Timestamps
IQ Capture/Streaming (Option 124/125 and 126/127) 6-3 IQ Data Format IQ Timestamps IQ timestamps are available for IQ capture. This section describes how the time stamp is embedded into the IQ data. Within each 64-bit frame, only the first four extended frames contain time stamp information (see the 64-bit time stamp frame diagram below). - Page 234 6-3 IQ Data Format IQ Capture/Streaming (Option 124/125 and 126/127) Embedding the time stamp requires using two bits from each frame, which requires modifying the IQ frame structure as shown below: Table 6-2. IQ Frame Structure with Time Stamps IQ Bit Resolution IQ Frame Structure 32 bit I...
- Page 235 IQ Capture/Streaming (Option 124/125 and 126/127) 6-3 IQ Data Format Sometimes, the first mark bit does not always begin at the start of the IQ capture. There could be a number of IQ samples recorded before the first time the mark bit is set to one. In the example below, there are five frames before the first timestamp, which doesn't start until the sixth frame.
-
Page 236: Iq Streaming
6-4 IQ Streaming IQ Capture/Streaming (Option 124/125 and 126/127) IQ Streaming In streaming, the IQ data uses the same frame and extended frame structure as in block mode. IQ data is captured to high speed DDR4 SDRAM memory, configured as a ring buffer. The buffer memory is 2 GB. -
Page 237: Iq Capture/Streaming Measurement
IQ Capture/Streaming (Option 124/125 and 126/127) 6-5 IQ Capture/Streaming Measurement To read the IQ data, use the TRAC:IQ:DATA? SCPI command. This returns the partition with the most recently captured IQ data. During streaming, the client has to continuously send TRAC:IQ:DATA? SCPI command to another partition’s IQ data. -
Page 238: Iq Capture Menu
6-5 IQ Capture/Streaming Measurement IQ Capture/Streaming (Option 124/125 and 126/127) IQ CAPTURE Menu START/STOP CAPTURE: Click this button to execute an IQ capture. When a capture is initiated, this button changes to STOP CAPTURE and can be clicked to stop the continuous captures. -
Page 239: Iq Streaming Menu
IQ Capture/Streaming (Option 124/125 and 126/127) 6-5 IQ Capture/Streaming Measurement IQ STREAMING Menu START STREAM: Click this button to start IQ data streaming from the selected output port. When streaming is initiated, this button changes to STOP STREAM and can be clicked to stop the stream. - Page 240 6-5 IQ Capture/Streaming Measurement IQ Capture/Streaming (Option 124/125 and 126/127) Once the IQ Capture menu is accessed, the IQ CAPTURE table is displayed at the bottom of the screen. Figure 6-3. IQ CAPTURE Table The IQ CAPTURE table provides the following: •...
-
Page 241: Iq Trigger Menu
IQ Capture/Streaming (Option 124/125 and 126/127) 6-5 IQ Capture/Streaming Measurement IQ TRIGGER Menu Trigger commands are shared between IQ capture and zero span, so these two functions are Note mutually exclusive. TIMESTAMPS: toggles data collection timestamps on or off (see “IQ Timestamps”... -
Page 242: Iq Streaming Tools
6-5 IQ Capture/Streaming Measurement IQ Capture/Streaming (Option 124/125 and 126/127) IQ Streaming Tools The IQ STREAMING menu allows you to concatenate an existing IQ metadata file (.dgzm) with a session of IQ data files (.dgz) that were streamed to a USB device after the stream operation is complete. The data files must all come from the same stream session. -
Page 243: Setting Up The Data Out Port And Ma25424A
IQ Capture/Streaming (Option 124/125 and 126/127) 6-6 Setting Up the Data Out Port and MA25424A Setting Up the Data Out Port and MA25424A Set up the MS2720xA and MA25424A for IQ streaming to IQC5000B as shown below: USB 3.0 (power) Data Out Ethernet Figure 6-7. - Page 244 6-6 Setting Up the Data Out Port and MA25424A IQ Capture/Streaming (Option 124/125 and 126/127) 6-14 PN: 10580-00480 Rev. A MS2720xA UG...
-
Page 245: Appendix A-Instrument Messages And Troubleshooting
Appendix A — Instrument Messages and Troubleshooting Introduction This appendix provides a list of instrument messages and their meaning. If any error condition persists, contact your local Anritsu Service Center (http://www.anritsu.com/contact-us). Remote Spectrum Monitor displays the following message types: • Self-Test Messages, indicating self-test pass or fail conditions. -
Page 246: Self-Test Messages
A-2 Self-Test Messages Instrument Messages and Troubleshooting Self-Test Messages Remote Spectrum Monitor has built-in diagnostics that allow you to run a built-in self test. The test results can be viewed on the screen and saved to a log file. To run self test, use the 3-line menu to access DIAGNOSTICS, then select SELF TEST and RUN SELF TEST. - Page 247 Instrument Messages and Troubleshooting A-2 Self-Test Messages Fan speed, percent of full speed : 7 % Fan speed : 2638 RPM Temperature at Reference : 45.3 C SPA : OVERALL STATUS : PASS +12VG : 12.00 V, 1.20 V ,11.90 V (PASS) +5V_PREAMP : 5.00 V, 0.50 V ,4.99 V (PASS)
- Page 248 (PASS) If any self test fails, try resetting the instrument with Reset All button found in Settings menu, and run the test again. If the condition persists, contact your local Anritsu Service Center (http://www.anritsu.com/contact-us). PN: 10580-00480 Rev. A MS2720xA UG...
-
Page 249: Informational Messages
Instrument Messages and Troubleshooting A-3 Informational Messages Informational Messages Cannot start measurement without a connected Antenna In Toolbar, Not Logged, Persistent Concatenation has been aborted When user aborts concatenation of streaming metadata files External reference detected - switching reference source to external In Toolbar, Logged, Transient External reference disconnected –... - Page 250 A-3 Informational Messages Instrument Messages and Troubleshooting GPS reference no longer available – switching reference source to Internal High In Toolbar, Logged, Transient Internal High reference no longer valid – switching frequency reference source to Internal In Toolbar, Logged, Transient Internal High reference no longer valid –...
- Page 251 Instrument Messages and Troubleshooting A-3 Informational Messages Software update files found on USB In Toolbar, Not Logged, Transient Stopped saving sweeps after sweep complete. When the save on event triggers are disabled after end-of-sweep. Stopped saving sweeps after limit crossing. When the save on event triggers are disabled after a limit fails.
-
Page 252: Warning Messages
A-4 Warning Messages Instrument Messages and Troubleshooting Warning Messages ADC Overrange In Toolbar, Logged, Persistent Booted from backup SW slot. Reinstall SW to clear this message. Popup, Logged, Persistent Could not read from input file. Please verify that the storage device is still accessible and try again Could not create output file. -
Page 253: Error Messages
Instrument Messages and Troubleshooting A-5 Error Messages Shutdown Temperature Reached Popup, Logged, Persistent Simulated Test Signal data being displayed In Toolbar, Logged, Persistent Temperature High Warning In Toolbar, Logged, Persistent The selected mode is not yet available. When an unavailable mode is selected. Error Messages Command Error In Toolbar, Logged, Persistent... - Page 254 A-5 Error Messages Instrument Messages and Troubleshooting Query Error In Toolbar, Not Logged, Transient Recall file does not exist When the file selected for recall could not be accessed. SPA FPGA Programming Error In Toolbar, Logged, Persistent Unexpected software exception. Reboot required. When the instrument software requires a reboot due to unknown error, Persistent Options #### are not valid.
-
Page 255: Udp Discovery Tool Firewall Settings
Instrument Messages and Troubleshooting A-6 UDP Discovery Tool Firewall Settings UDP Discovery Tool Firewall Settings Follow the instructions below if the Discovery tool is not responding: Go to Control Panel and open Windows Defender Firewall settings. Click Allow an app or feature through Windows Defender Firewall. Figure A-1. - Page 256 A-6 UDP Discovery Tool Firewall Settings Instrument Messages and Troubleshooting Find fieldmaster_base in the list of apps, and make sure that the fieldmaster_base box and Domain box are checked. Private and Public boxes may also need to be checked depending on where the instruments are on the network.
-
Page 257: System Override
Instrument Messages and Troubleshooting A-7 System Override System Override In the event that the instrument does not respond to SCPI commands (due to circumstances like a long sweep used in conjunction with *OPC?) and needs to be reset remotely, the system override feature can be used. System override can be accessed through TCP port 8001 of the instrument. - Page 258 A-7 System Override Instrument Messages and Troubleshooting A-14 PN: 10580-00480 Rev. A MS2720xA UG...
-
Page 259: Appendix B-Software Option Upgrades
Importing Software License Importing a new license file: After receiving a new license file from Anritsu, place the file on the USB memory device in the top (root) level, not in any directory. Open the System menu from the upper left 3-line icon. - Page 260 B-3 Importing Software License Software Option Upgrades PN: 10580-00480 Rev. A MS27201A UG...
- Page 262 Anritsu Company 490 Jarvis Drive Anritsu utilizes recycled paper and environmentally conscious inks and toner. Morgan Hill, CA 95037-2809 http://www.anritsu.com...
Need help?
Do you have a question about the MS2720 A Series and is the answer not in the manual?
Questions and answers