LMI Technologies Gocator 2100 Series User Manual
Profile sensors
Hide thumbs
Also See for Gocator 2100 Series:
- User manual (800 pages) ,
- User manual (533 pages) ,
- Quick start manual (2 pages)

Related Manuals for LMI Technologies Gocator 2100 Series


Summary of Contents for LMI Technologies Gocator 2100 Series
- Page 1 Gocator Line Profile Sensors USER MANUAL 2100, 2300, 2400 & 2880 Series Firmware version: 4.5.x.xx Document revision: A...
-
Page 2: Copyright
LMI Technologies, Inc. Trademarks and Restrictions Gocator™ is a registered trademark of LMI Technologies, Inc. Any other company or product names mentioned herein may be trademarks of their respective owners. Information contained within this manual is subject to change. -
Page 3: Table Of Contents
Table of Contents Running a Dual-Sensor System Next Steps How Gocator Works Copyright 3D Acquisition Table of Contents Clearance Distance, Field of View and Measurement Range Introduction Safety and Maintenance Resolution and Accuracy Laser Safety X Resolution Laser Classes Z Resolution Precautions and Responsibilities Z Linearity Class 3B Responsibilities... - Page 4 System Layout Aligning Sensors Buddy Assignment Clearing Alignment Exposure Multiplexing Filters Over Temperature Protection Gap Filling Networking Median Motion and Alignment Smoothing Alignment Reference Decimation Encoder Resolution Surface Generation Encoder Value and Frequency Part Detection Travel Speed Edge Filtering Jobs Data Viewer Security Data Viewer Controls...
- Page 5 Data Viewer Position Tools Panel Stud Adding and Configuring a Tool Measurement Region Source Volume Streams (Sections) Script Regions Script Measurement Decisions Built-in Functions Filters Output Measurement Anchoring Output Page Overview Enabling and Disabling Measurements Ethernet Output Editing a Tool or Measurement Name Digital Output Changing a Measurement ID Analog Output...
- Page 6 Limitations BoundingBox Ellipse Gocator Device Files Live Files Replay Log File RecordingFiltering Job Files Conditions/AnyMeasurement Job File Components Conditions/AnyData Accessing Files and Components Conditions/Measurement Configuration Streams/Stream (Read-only) Setup ToolOptions Filters MeasurementOptions XSmoothing StreamOption YSmoothing Tools XGapFilling Profile Types YGapFilling ProfileFeature XMedian ProfileLine YMedian...
- Page 7 SurfaceVolume Get Loaded Job Output Get Alignment Reference Ethernet Set Alignment Reference Ascii Clear Alignment Get Timestamp Modbus Get Encoder Digital0 and Digital1 Reset Encoder Analog Start Serial Scheduled Start Selcom Stop Ascii Get Auto Start Enabled Transform Set Auto Start Enabled Device Start Alignment Part Models...
- Page 8 Export CSV (Progressive) Ethernet Link Object (Class 0xF6) Export Bitmap (Progressive) Assembly Object (Class 0x04) Get Runtime Variable Count Command Assembly Set Runtime Variables Runtime Variable Configuration Assembly 404 Get Runtime Variables Sensor State Assembly Upgrade Commands Sample State Assembly Start Upgrade Implicit Messaging Command Assembly Start Upgrade Extended Implicit Messaging Output Assembly...
- Page 9 Header Files Gocator 2320 Class Hierarchy Gocator 2130 and 2330 GoSystem Gocator 2140 and 2340 GoSensor Gocator 2342 GoSetup Gocator 2150 and 2350 GoLayout Gocator 2170 and 2370 GoTools Gocator 2375 GoTransform Gocator 2180 and 2380 GoOutput Gocator 2400 Series Data Types Gocator 2410 Value Types...
- Page 10 Return Policy Software Licenses Support Contact Gocator Line Profile Sensors - User Manual...
-
Page 11: Introduction
This documentation describes how to connect, configure, and use a Gocator. It also contains reference information on the device's protocols and job files. The documentation applies to the following sensors: Gocator 2100 series Gocator 2300 series Gocator 2400 series Gocator 2880 B revision Gocator sensors are only supported by firmware version 4.3 or later. -
Page 12: Safety And Maintenance
Safety and Maintenance The following sections describe the safe use and maintenance of Gocator sensors. Laser Safety Gocator sensors contain semiconductor lasers that emit visible or invisible light and are designated as Class 2M, Class 3R, or Class 3B, depending on the chosen laser option. See Laser Classes on the next page for more information on the laser classes used in Gocator sensors. -
Page 13: Laser Classes
Laser Classes Class 2M laser components Class 2M laser components should not cause permanent damage to the eye under reasonably foreseeable conditions of operation, provided that: No optical aids are used (these could focus the beam). The user’s blink reflex can terminate exposure (in under 0.25 seconds). -
Page 14: Precautions And Responsibilities
For more information, see Class 3B Responsibilities below. Class 3B Responsibilities LMI Technologies has filed reports with the FDA to assist customers in achieving certification of laser products. These reports can be referenced by an accession number, provided upon request. Detailed descriptions of the safety items that must be added to the system design are listed below. -
Page 15: Nominal Ocular Hazard Distance (Nohd)
Power-On Delays A delay circuit is required that illuminates warning indicators for a short period of time before supplying power to the lasers. Beam Attenuators A permanently attached method of preventing human access to laser radiation other than switches, power connectors or key control must be employed. Emission Indicator It is required that the controls that operate the sensors incorporate a visible or audible indicator when power is applied and the lasers are operating. -
Page 16: Systems Sold Or Used In The Usa
Model Constant includes a consideration of the fan angle for the individual models. Systems Sold or Used in the USA Systems that incorporate laser components or laser products manufactured by LMI Technologies require certification by the FDA. Customers are responsible for achieving and maintaining this certification. -
Page 17: Handling, Cleaning, And Maintenance
Turn off lasers when not in use LMI Technologies uses semiconductor lasers in Gocator sensors. To maximize the lifespan of the sensor, turn off the laser when not in use. Avoid excessive modifications to files stored on the sensor Settings for Gocator sensors are stored in flash memory inside the sensor. - Page 18 Avoid installing sensors in hazardous environments To ensure reliable operation and to prevent damage to Gocator sensors, avoid installing the sensor in locations that are humid, dusty, or poorly ventilated; with a high temperature, such as places exposed to direct sunlight; where there are flammable or corrosive gases;...
-
Page 19: Getting Started
Getting Started The following sections provide system and hardware overviews, in addition to installation and setup procedures. System Overview Gocator sensors can be installed and used in a variety of scenarios. Sensors can be connected as standalone devices, dual-sensor systems, or multi-sensor systems. Standalone System Standalone systems are typically used when only a single Gocator sensor is required. -
Page 20: Dual-Sensor System
Dual-Sensor System In a dual-sensor system, two Gocator sensors work together to perform profiling and output the combined results. The controlling sensor is referred to as the Main sensor, and the other sensor is referred to as the Buddy sensor. Gocator's software recognizes three installation orientations: Opposite, Wide, and Reverse. -
Page 21: Multi-Sensor System
Multi-Sensor System Master 400/800/1200/2400 networking hardware can be used to connect two or more sensors into a multi-sensor system. Gocator Master cordsets are used to connect the sensors to a Master. The Master provides a single point of connection for power, safety, encoder, and digital inputs. A Master 400/800/1200/2400 can be used to ensure that the scan timing is precisely synchronized across sensors. -
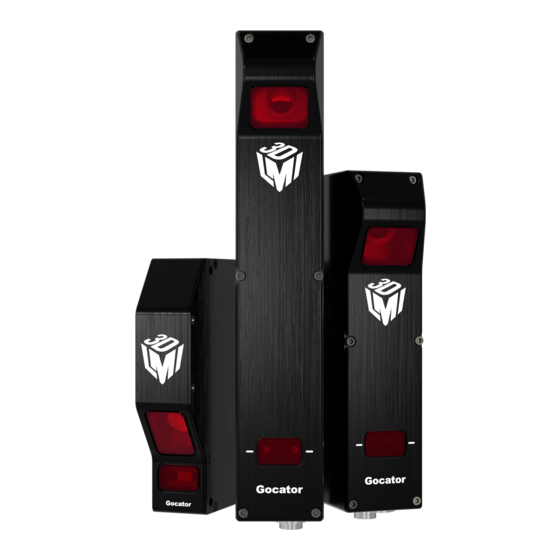
Page 22: Hardware Overview
Hardware Overview The following sections describe Gocator and its associated hardware. Gocator Sensor Gocator 2140 / 2340 Item Description Camera Observes laser light reflected from target surfaces. Laser Emitter Emits structured light for laser profiling. I/O Connector Accepts input and output signals. Power / LAN Connector Accepts power and laser safety signals and connects to 1000 Mbit/s Ethernet network. - Page 23 The Gocator I/O cordset provides digital I/O connections, an encoder interface, RS-485 serial connection, and an analog output. The maximum cordset length is 60 m. See Gocator I/O Connector on page 495 and Gocator Power/LAN Connector on page 493Gocator I/O Connector on page 495 for pinout details.
-
Page 24: Master 1200/2400
Item Description Laser Safety Switch Toggles laser safety signal provided to the sensors [O= laser off, I= laser on]. Trigger Signals a digital input trigger to the Gocator. Encoder Accepts encoder A, B and Z signals. Digital Output Provides digital output. See Master 100 on page 499 for pinout details. -
Page 25: Calibration Targets
See Accessories on page 513 for disk part numbers. For wide, multi-sensor systems, bars are required to match the length of the system by following the guidelines illustrated below. (LMI Technologies does not manufacture or sell bars.) Getting Started • Hardware Overview • 25... - Page 26 See Aligning Sensors on page 102 for more information on alignment. Getting Started • Hardware Overview • 26 Gocator Line Profile Sensors - User Manual...
-
Page 27: Installation
Installation The following sections provide grounding, mounting, and orientation information. Grounding - Gocator Gocators should be grounded to the earth/chassis through their housings and through the grounding shield of the Power I/O cordset. Gocator sensors have been designed to provide adequate grounding through the use of M5 x 0.8 pitch mounting screws. -
Page 28: Grounding - Master
Install a 360-degree ground clamp. Grounding - Master 400/800/1200/2400 The mounting brackets of all Masters have been designed to provide adequate grounding through the use of star washers. Always check grounding with a multi-meter by ensuring electrical continuity between the mounting frame and RJ45 connectors on the front. The frame or electrical cabinet that the Master is mounted to must be connected to earth ground. -
Page 29: Orientations
The sensor must be heat sunk through the frame it is mounted to. When a sensor is properly heat sunk, the difference between ambient temperature and the temperature reported in the sensor's health channel is less than 15° C. Gocator sensors are high-accuracy devices. The temperature of all of its components must be in equilibrium. - Page 30 Single sensor on robot arm Dual-Sensor System Orientations: Side-by-side for wide-area measurement (Wide) Main must be on the left side (when looking into the connector) of the Buddy (Wide) Getting Started • Installation • 30 Gocator Line Profile Sensors - User Manual...
-
Page 31: Rut-Scanning System Setup
Above/below for two-sided measurement (Opposite) Main must be on the top with Buddy on the bottom (Opposite) For more information on setting up a dual-sensor system, see http://lmi3d.com/sites/default/files/APPNOTE_Gocator_2300_Gocator_4.x_Dual_Sensor_Setup_ Guide.pdf. Rut-Scanning System Setup The following sections describe how to set up a Gocator 2375 rut-scanning system. Layout The Gocator 2375 sensor is designed to cover a scan width of up to 4.2 m by using 8 sensors mounted in parallel. -
Page 32: System Setup
The diagram above shows the clearance distance and measurement range required in a typical setup. Use the specification estimator (Gocator-2375_Specification_Estimator.xlsx) to calculate the X and Z resolution of the sensors with different combinations of clearance distance and measurement range. System Setup A typical Gocator 2375 system is set up as a multi-sensor system. ... -
Page 33: System Operation
Upgrade the firmware. a. Follow the steps in Firmware Upgrade on page 79. Set up profiling parameters. a. Follow the steps in Scan Setup and Alignment on page 82 to set up profiling parameters. Typically, trigger, active area, and exposure will need to be adjusted. System Operation An isolated layout should be used. -
Page 34: Network Setup
Network Setup The following sections provide procedures for client PC and Gocator network setup. DHCP is not recommended for Gocator sensors. If you choose to use DHCP, the DHCP server should try to preserve IP addresses. Ideally, you should use static IP address assignment (by MAC address) to do this. - Page 35 Change the client PC's network settings. Windows 7 a. Open the Control Panel, select Network and Sharing Center, and then click Change Adapter Settings. b. Right-click the network connection you want to modify, and then click Properties. c. On the Networking tab, click Internet Protocol Version 4 (TCP/IPv4), and then click Properties.
-
Page 36: Gocator Setup
Gocator Setup The Gocator is shipped with a default configuration that will produce laser profiles for most targets. The following sections describe how to set up a standalone sensor system and a dual-sensor system for operations. After you have completed the setup, you can perform laser profiling to verify basic sensor operation. -
Page 37: Running A Dual-Sensor System
Move a target into the laser plane. If a target object is within the sensor's measurement range, the data viewer will display the shape of the target, and the sensor's range indicator will illuminate. If you cannot see the laser, or if a profile is not displayed in the Data Viewer, see Troubleshooting on page 456. - Page 38 Modify the IP address to 192.168.1.11 in the Networking category and click the Save button. When you click the Save button, you will be prompted to confirm your selection. Turn off the sensors, re-connect the Main sensor's Ethernet connection and power-cycle the sensors. After changing network configuration, the sensors must be reset or power-cycled before the change will take effect.
-
Page 39: Next Steps
sensor one at a time and follow the steps in Firmware Upgrade on page 79 to upgrade the sensors. 11. Ensure that the Laser Safety Switch is enabled or the Laser Safety input is high. Master 400/800/1200/2400 12. Ensure that Replay mode is off (the slider is set to the left). - Page 40 Contains built-in measurement tools and their settings. Output (page 235) Contains settings for configuring output protocols used to communicate measurements to external devices. Dashboard (page 247) Provides monitoring of measurement statistics and sensor health. Toolbar (page 56) Controls sensor operation, manages jobs, and replays recorded measurement data. Getting Started •...
-
Page 41: How Gocator Works
How Gocator Works The following sections provide an overview of how Gocator acquires and produces data, detects and measures parts, and controls devices such as PLCs. Some of these concepts are important for understanding how you should mount sensors and configure settings such as active area. You can use the Gocator Accelerator to speed up processing of data. -
Page 42: Clearance Distance, Field Of View And Measurement Range
Target objects are typically moved under the sensor on a transportation mechanism, such as a conveyor belt. Sensors can also be mounted on robot arms and moved over the target. In both cases, the sensor captures a series of 3D profiles, building up a full scan of the object. Sensor speed and required exposure time to measure the target are typically critical factors in applications with line profiler sensors. -
Page 43: Resolution And Accuracy
Resolution and Accuracy The following sections describe X Resolution, Z Resolution, and Z Linearity. These terms are used in the Gocator datasheets to describe the measurement capabilities of the sensors. X Resolution X resolution is the horizontal distance between each measurement point along the laser line. This specification is based on the number of camera columns used to cover the field of view (FOV) at a particular measurement range. -
Page 44: Z Resolution
Z Resolution Z Resolution gives an indication of the smallest detectable height difference at each point, or how accurately height on a target can be measured. Variability of height measurements at any given moment, in each individual 3D point, with the target at a fixed position, limits Z resolution. This variability is caused by camera and sensor electronics. - Page 45 Z linearity is expressed in the Gocator data sheet as a percentage of the total measurement range. How Gocator Works • 3D Acquisition • 45 Gocator Line Profile Sensors - User Manual...
-
Page 46: Profile Output
Profile Output Gocator represents a profile as a series of ranges, with each range representing the distance from the origin. Each range contains a height (on the Z axis) and a position (on the X axis) in the sensor's field of view. -
Page 47: System Coordinates
The mounting direction, relative to the direction of travel, can be set in Gocator using either the Normal or Reverse layout. For more information, see System Layout on page 68. System Coordinates Aligning sensors adjusts the coordinate system in relation to sensor coordinates. Alignment is used with a single sensor to compensate for mounting misalignment and to set a zero reference, such as a conveyor belt surface. - Page 48 Alignment is also used to set a common coordinate system for dual-sensor systems. That is, profiles and measurements from the sensors are expressed in a unified coordinate system. How Gocator Works • Profile Output • 48 Gocator Line Profile Sensors - User Manual...
-
Page 49: Part And Section Coordinates
In both cases, alignment determines the offsets in X and Z. Alignment also determines the tilt (angle on the X–Z plane, around the Y axis) needed to align sensor data. The adjustments resulting from alignment are called transformations and are displayed in Sensor panel on the Scan page. -
Page 50: Switching Between Coordinate Systems
data and measurement results are in a coordinate system that places the X and Y origins at the center of the part. The Z origin is at the bottom of the alignment target (or in the center of the measurement range if the sensor is unaligned). The Frame of Reference setting, in the Part Detection panel on the Scan page, controls whether part data is recorded using sensor/system coordinates or part coordinates. -
Page 51: Data Generation And Processing
Resampling to uniform spacing reduces the complexity for downstream algorithms to process the profile data from the Gocator, but places a higher processing load on the sensor's CPU. When uniform spacing is not enabled, no processing is required on the sensor. This frees up processing resources in the Gocator, but usually requires more complicated processing on the client side. -
Page 52: Part Detection
For more information, see Surface Generation on page 108. Part Detection After Gocator has generated a surface by combining single exposures into larger pieces of data, the firmware can isolate discrete parts on a generated surface into separate scans representing parts. Gocator can then perform measurements on these isolated parts. -
Page 53: Part Matching
You can use most of Gocator's profile measurement tools on a section, letting you perform measurements that are not possible with surface measurement tools. For more information on sections, see Sections on page 144. Part Matching Gocator can match scanned parts to the edges of a model based on a previously scanned part (see Using Edge Detection on page 131) or to the dimensions of a fitted bounding box or ellipse that encapsulate the model (see Using Bounding Box and Ellipse on page 140). -
Page 54: Output And Digital Tracking
Gocator provides several measurement tools, each of which provides a set of individual measurements, giving you dozens of measurements ideal for a wide variety of applications to chose from. The configured measurements start returning pass/fail decisions, as well as the actual measured values, which are then sent over the enabled output channels to control devices such as PLCs, which can in turn... -
Page 55: Gocator Web Interface
Gocator Web Interface The following sections describe the Gocator web interface. User Interface Overview Gocator sensors are configured by connecting to a Main sensor with a web browser. The Gocator web interface is illustrated below. Element Description Manage page Contains settings for sensor system layout, network, motion and alignment, handling jobs, and sensor maintenance. -
Page 56: Toolbar
Element Description on page 150. Output page Contains settings for configuring output protocols used to communicate measurements to external devices. See Output on page 235. Dashboard page Provides monitoring of measurement statistics and sensor health. See Dashboard on page 247. CPU Load and Speed Provides important sensor performance metrics. - Page 57 multiple job files. If there is a job file that is designated as the default, it will be loaded automatically when the sensor is reset. When you change sensor settings using the Gocator web interface in the emulator, some changes are saved automatically, while other changes are temporary until you save them manually.
-
Page 58: Recording, Playback, And Measurement Simulation
You can perform other job management tasks—such as downloading job files from a sensor to a computer, uploading job files to a sensor from a computer, and so on—in the Jobs panel in the Manage page. See Jobs on page 74 for more information. Recording, Playback, and Measurement Simulation Gocator sensors can record and replay recorded scan data, and also simulate measurement tools on recorded data. - Page 59 Playback controls when replay is on To replay data: Toggle Replay mode on by setting the slider to the right in the Toolbar. The slider's background turns blue and a Replay Mode Enabled message is displayed. Use the Replay slider or the Step Forward, Step Back, or Play buttons to review data. The Step Forward and Step Back buttons move and the current replay location backward and forward by a single frame, respectively.
-
Page 60: Recording Filtering
Recording Filtering Replay data is often used for troubleshooting. But replay data can contain thousands of frames, which makes finding a specific frame to troubleshoot difficult. Recording filtering lets you choose which frames Gocator records, based on one or more conditions, which makes it easier to find problems. How Gocator treats conditions Setting Description... -
Page 61: Downloading, Uploading, And Exporting Replay Data
Click the Recording Filtering button In the Recording Filtering dialog, choose how Gocator treats conditions: For information on the available setting, see How Gocator treats conditions on the previous page. Configure the conditions that will cause Gocator to record a frame: For information on the available setting, see Conditions on the previous page. - Page 62 In the Upload menu, choose one of the following: Upload: Unloads the current job and creates a new unsaved and untitled job from the content of the replay data file. Upload and merge: Uploads the replay data and merges the data's associated job with the current job.
-
Page 63: Metrics Area
In Profile mode, all data in the record buffer is exported. In Surface mode, only data at the current replay location is exported. Use the playback control buttons to move to a different replay location; for information on playback, see To replay data in Recording, Playback, and Measurement Simulation on page 58. Optionally, convert exported data to another format using the CSV Converter Tool. -
Page 64: Data Viewer
Open the log for details on the warning. For more information on logs, see Log below. When a sensor is accelerated a "rocket" icon appears in the metrics area. Data Viewer The data viewer is displayed in both the Scan and the Measure pages, but displays different information depending on which page is active. -
Page 65: Frame Information
To use the log: Click on the Log open button at the bottom of the web interface. Click on the appropriate tab for the information you need. Frame Information The area to the right of the status bar displays useful frame information, both when the sensor is running and when viewing recorded data. - Page 66 The Gocator interface reloads on the page you were working in, displaying the page using the language you chose. The sensor state is preserved. Gocator Web Interface • User Interface Overview • 66 Gocator Line Profile Sensors - User Manual...
-
Page 67: System Management And Maintenance
System Management and Maintenance The following sections describe how to set up the sensor connections and networking, how to calibrate encoders and choose alignment reference, and how to perform maintenance tasks. Manage Page Overview Gocator's system and maintenance tasks are performed on the Manage page. Element Description Sensor System... -
Page 68: Sensor System
Sensor System The following sections describe the Sensor System category on the Manage page. This category lets you choose the layout for standalone or dual-sensor systems, and provides other system settings. Dual-sensor layouts are only displayed when a Buddy sensor has been assigned. Sensor Autostart With the Autostart setting enabled, laser ranging profiling and measurement functions will begin automatically when the sensor is powered on. - Page 69 Supported Layouts Orientation Example Normal The sensor operates as an isolated device. Reverse The sensor operates as an isolated device, but in a reverse orientation. You can use this layout to change the handedness of the data. Wide Sensors are mounted in Left (Main) and Right (Buddy) positions for a larger combined field of view.
-
Page 70: Buddy Assignment
To specify the layout: Go to the Manage page and click on the Sensor System category. If you are configuring the layout of a dual-sensor system, select an assigned Buddy sensor in the Visible Sensors list. For information on assigning a Buddy sensor, see Buddy Assignment below. Select a layout by clicking one of the layout buttons. -
Page 71: Exposure Multiplexing
Select a sensor in the Visible Sensors list. Click the Assign button. A sensor can only be assigned as a Buddy if its firmware and model number match the firmware and model number of the Main sensor. The Assign button will be greyed out if a sensor cannot be assigned as a Buddy. -
Page 72: Networking
To enable/disable overheat temperature protection: Check/uncheck the Over Temperature Protection option. Save the job file. Networking The Networking category on the Manage page provides network settings. Settings must be configured to match the network to which the Gocator sensors are connected. To configure the network settings: Go to the Manage page. -
Page 73: Alignment Reference
Alignment Reference The Alignment Reference setting can have one of two values: Fixed or Dynamic. Setting Description Fixed A single, global alignment is used for all jobs. This is typically used when the sensor mounting is constant over time and between scans, for example, when the sensor is mounted in a permanent position over a conveyor belt. -
Page 74: Encoder Value And Frequency
Encoder resolution is expressed in millimeters per tick, where one tick corresponds to one of the four encoder quadrature signals (A+ / A- / B+ / B-). Encoders are normally specified in pulses per revolution, where each pulse is made up of the four quadrature signals (A+ / A- / B+ / B-). - Page 75 Element Description Name field Used to provide a job name when saving files. Jobs list Displays the jobs that are currently saved in the sensor's flash storage. Save button Name Saves current settings to the job using the name in the field.
-
Page 76: Security
To save a job: Go to the Manage page and click on the Jobs category. Provide a name in the Name field. To save an existing job under a different name, click on it in the Jobs list and then modify it in the Name field. -
Page 77: Maintenance
The Administrator and Technician accounts can be assigned unique passwords. To set or change the password for the Administrator account: Go to the Manage page and click on the Security category. In the Administrator section, enter the Administrator account password and password confirmation. Click Change Password. -
Page 78: Sensor Backups And Factory Reset
Sensor Backups and Factory Reset You can create sensor backups, restore from a backup, and restore to factory defaults in the Maintenance category. Backup files contain all of the information stored on a sensor, including jobs and alignment. An Administrator should create a backup file in the unlikely event that a sensor fails and a replacement sensor is needed. -
Page 79: Firmware Upgrade
Firmware Upgrade LMI recommends routinely updating firmware to ensure that Gocator sensors always have the latest features and fixes. In order for the Main and Buddy sensors to work together, they must be use the same firmware version. This can be achieved by upgrading through the Main sensor or by upgrading each sensor individually. -
Page 80: Support Files
save a support file; get device information. Support Files You can download a support file from a sensor and save it on your computer. You can then use the support file to create a scenario in the Gocator emulator (for more information on the emulator, see Gocator Emulator on page 250). -
Page 81: Manual Access
Support files end with the .gs extension, but you do not need to type the extension in Filename. (Optional) In Description, type a description of the support file. When you create a scenario from a support file in the emulator, the description is displayed below the emulator's scenario list. -
Page 82: Scan Setup And Alignment
Scan Setup and Alignment The following sections describe the steps to configure Gocator sensors for laser profiling using the Scan page. Setup and alignment should be performed before adding and configuring measurements or outputs. Scan Page Overview The Scan page lets you configure sensors and perform alignment. Element Description Scan Mode panel... -
Page 83: Scan Modes
Element Description Data Viewer Displays sensor data and adjusts regions of interest. Depending on the current operation Data mode, the data viewer can display video images , profile plots, or surface views . See Viewer on page 116. The following table provides quick references for specific goals that you can achieve from the panels in the Scan page. -
Page 84: Triggers
Mode and Option Description Video images are processed internally to produce laser profiles and cross-sectional measurements. Surface Outputs 3D point clouds made up of many laser profiles combined together and performs surface measurements. The sensor uses various methods to generate a surface (see on page 108). - Page 85 Trigger Source Description Ignore Backward A scan is triggered only when the target object moves forward. If the target object moves backward, it must move forward by at least the distance of one encoder spacing to trigger the next scan. Bi-directional A scan is triggered when the target object moves forward or backward.
-
Page 86: Trigger Examples
Trigger Source Description When triggers are received at a frequency higher than the maximum frame rate, some triggers may not be accepted. The Trigger Drops Indicator in the Dashboard can be used to check for this condition. The external input can be used to enable or disable the encoder triggers. See Encoder Input on page 497 for more information on connecting the encoder to Gocator sensors. -
Page 87: Trigger Settings
Example: Time + Conveyor Time triggering can be used instead of encoder triggering to perform profile measurements at a fixed frequency. Measurement spacing will be non-uniform if the speed of the conveyor varies while the object is being measured. It is strongly recommended to use an encoder with transport-based systems due to the difficulty in maintaining constant transport velocity. - Page 88 After specifying a trigger source, the Trigger panel shows the parameters that can be configured. Parameter Trigger Source Description Time Encoder External Input Source Selects the trigger source ( , or Software Frame Rate Time Max Speed Controls the frame rate. Select from the drop- down to lock to the maximum frame rate.
-
Page 89: Sensor
Parameter Trigger Source Description Trigger Delay External Input Controls the amount of time or the distance the sensor waits before producing a frame after the external input is activated. This is used to compensate for the positional difference between the source of the external input trigger (e.g., photocells) and the sensor. -
Page 90: Tracking Window
Tracking Window Gocator 2100 series sensors do not support tracking window. Gocator Web Interface • Scan Setup and Alignment • 90 Gocator Line Profile Sensors - User Manual... - Page 91 The Gocator can track a relatively flat object in real-time to achieve very high scan rates. This feature tracks the object height using a small window that moves dynamically to cover a larger measurement range. You can balance the gain in speed and the tracking ability by configuring the size of the tracking area.
-
Page 92: Transformations
The panel below the checkbox expands and shows the settings for the window used to track the object height. Click the tracking window's Select button. Resize the tracking window shown in the data viewer. Only the height of the window is required. You can move the position of the tracking window to cover a live profile to help adjust the window height. -
Page 93: Exposure
whose decision you need to configure. If one of these modes is not selected, tools will not be available in the Measure panel. Expand the Sensor panel by clicking on the panel header. Click the button corresponding to the sensor you want to configure. The button is labeled Top, Bottom, Top-Left, or Top-Right, depending on the system. -
Page 94: Single Exposure
When the Gocator is in Multiple exposure mode, select which exposure to view using the drop-down box next to "View" in the data viewer. This drop-down is only visible in Video scan mode when the Multiple option is selected in the Exposure section in the Sensor panel. Single Exposure The sensor uses a fixed exposure in every scan. -
Page 95: Dynamic Exposure
You can automatically tune the exposure by pressing the Auto Set button, which causes the sensor to turn on and tune the exposure time. Run the sensor and check that laser profiling is satisfactory. If laser profiling is not satisfactory, adjust the exposure values manually. Switch to Video mode to use video to help tune the exposure;... -
Page 96: Multiple Exposure
If laser profiling is not satisfactory, adjust the exposure values manually. Switch to Video mode to use video to help tune the exposure; see Exposure on page 93 for details. Multiple Exposure The sensor combines data from multiple exposures to create a single laser profile . Multiple exposures can be used to increase the ability to detect light and dark materials that are in the field of view simultaneously. -
Page 97: Spacing
The X setting works by reducing the number of image columns used for laser profiling. The 1/4 sub-sampling setting is not available on Gocator 2100 series sensors. The Z sub-sampling setting is used to decrease the profile's Z resolution to increase speed. The Z setting works by reducing the number of image rows used for laser profiling. -
Page 98: Spacing Interval
Both the X and the Z sub-sampling settings must be decreased to increase speed. To configure X or Z sub-sampling: Go to the Scan page. Expand the Sensor panel by clicking on the panel header or the button. Click the button corresponding to the sensor you want to configure. The button is labeled Top, Bottom, Top-Left, or Top-Right, depending on the system. -
Page 99: Material
Balanced: Uses the X resolution at the middle of the active area as the spacing interval. This setting balances CPU load, data output rate, and X resolution. Resolution: Uses the highest X resolution within the active area as the spacing interval. This setting maximizes resolution but has higher CPU load and has the highest data output rate (i.e., greatest detail). -
Page 100: Master
Setting Description Spot Threshold The minimum increase in intensity level between neighbouring pixels for a pixel to be considered the start of a potential spot. This setting is important for filtering false profile spots generated by sunlight reflection. Spot Width Max The maximum number of pixels a spot is allowed to span. -
Page 101: Alignment
Save the job in the Toolbar by clicking the Save button Check that laser profiling is satisfactory. After adjusting the setting, confirm that laser profiling is satisfactory. Various settings can affect how the Material settings behave. You can use Video mode to examine how the settings interact. -
Page 102: Aligning Sensors
With encoder calibration Without encoder calibration Calibration disk or calibration bar Target Type Flat surface or calibration bar Target/Sensor Motion Linear motion Stationary Calibrates Tilt Calibrates Z axis Offset Calibrates X axis Offset Yes (Calibration bar required) Calibrates Encoder Calibrates Travel Speed See Coordinate Systems on page 46 for definitions of coordinate axes. - Page 103 To perform alignment for stationary targets: In the Alignment panel, select Stationary as the Type. Clear the previous alignment if present. Press the Clear Alignment button to remove an existing alignment.s Select an alignment Target. Select Flat Surface to use the conveyor surface (or other flat surface) as the alignment reference Select Bar to use a custom calibration bar.
- Page 104 In the Alignment panel, select Moving as the Type. Clear the previous alignment if present. Press the Clear Alignment button to remove an existing alignment. Select an alignment Target. Select one of the disk Disk options to use a disk as the alignment reference. Select Bar to use a custom calibration bar.
-
Page 105: Clearing Alignment
Clearing Alignment Alignment can be cleared to revert the sensor to sensor coordinates. To clear alignment: Go to the Scan page. Choose Profile or Surface mode in the Scan Mode panel, depending on the type of measurement whose decision you need to configure. If one of these modes is not selected, tools will not be available in the Measure panel. -
Page 106: Median
axis. X gap filling works by filling in the gaps within the same profile. Y gap filling works by filling in gaps in the direction of travel at each X location. If both X and Y gap filling are enabled, missing data is filled along the X and Y axes at the same time, using the available neighboring data. -
Page 107: Smoothing
To configure X or Y median: Go to the Scan page. Choose Profile or Surface mode in the Scan Mode panel. If one of these modes is not selected, you will not be able to configure the median filter. Expand the Filters panel by clicking on the panel header or the button. -
Page 108: Decimation
Choose Profile or Surface mode in the Scan Mode panel. If one of these modes is not selected, you will not be able to configure smoothing. Expand the Filters panel by clicking on the panel header or the button. Click on the Smoothing tab. Enable the X or Y setting and select the averaging window value. - Page 109 The following types correspond to the Type setting in the panel. When Type is set to Continuous, part detection is automatically enabled. When Type is set to anything else, part detection can be enabled and disabled in the Part Detection panel. See Part Detection on page 112 for descriptions of the settings that control detection logic.
- Page 110 generation of a single surface of fixed length. For more information on connecting external input to a Gocator sensor, see on page 496. You can optionally enable part detection to process the profilesurface after it has been generated, but the generation itself does not depend on the detection logic.
- Page 111 Rotational: The sensor reorders profiles within a surface to be aligned with the encoder’s index pulse. That is, regardless of the radial position the sensor is started at, the generated surface always starts at the position of the index pulse. If the index pulse is not detected and the rotation circumference is met, the surface is dropped and the Encoder Index...
-
Page 112: Part Detection
Expand the Surface Generation panel by clicking on the panel header or the button. Choose an option from the Type drop-down and any additional settings. See the types and their settings described above. Part Detection In Surface mode, the Gocator sensor can analyze the 3D point cloud created from profiles to identify discrete objects. - Page 113 The following settings can be tuned to improve the accuracy and reliability of part detection. Setting Description Height Threshold Determines the profile height threshold for part detection. The setting for Threshold Direction determines if parts should be detected above or below the threshold. Above is typically used to prevent the belt surface from being detected as a part when scanning objects on a conveyor.
- Page 114 Setting Description third-party software such as HexSight, Halcon, etc. Padding Length Determines the amount of extra data on the Y axis from the surface surrounding the detected part that will be included. This is mostly useful when processing part data with third-party software such as HexSight, Halcon, etc.
-
Page 115: Edge Filtering
Expand the Part Detection panel by clicking on the panel header or the button. If necessary, check the Enabled option. When Surface Generation is set to Continuous, part detection is always enabled. Adjust the settings. See the part detection parameters above for more information. Edge Filtering Part scans sometimes contain noise around the edges of the target. -
Page 116: Data Viewer
Edge Filtering enabled, Preserve Interior Feature enabled To configure edge filtering: Go to the Scan page and choose Surface in the Scan Mode panel. If this mode is not selected, you will not be able to configure part detection. Expand the Part Detection panel by clicking on the panel header or the button and enable part detection if necessary. -
Page 117: Data Viewer Controls
Data Viewer Controls The data viewer is controlled by mouse clicks and by the buttons on the display toolbar. The mouse wheel can also be used for zooming in and out. Press 'F' when the cursor is in the data viewer to switch to full screen. Video Mode In Video mode, the data viewer displays a camera image. -
Page 118: Overexposure And Underexposure
To select the exposure view of the display: Go to the Scan page and choose Video mode in the Scan Mode panel. Select the camera view in the data viewer. Use the first drop-down list next to View at the top of the data viewer to select Main or Buddy. Select the exposure. -
Page 119: Spots And Dropouts
The Exposure setting uses the following colors: Blue: Indicates background pixels ignored by the sensor. Red: Indicates saturated pixels. Correct tuning of exposure depends on the reflective properties of the target material and on the requirements of the application. Settings should be carefully evaluated for each application, but often a good starting point is to set the exposure so that there are 2 to 3 red pixels in the center of the laser line. -
Page 120: Profile Mode
To show data dropouts: Go to the Scan page and choose Video mode in the Scan Mode panel. check the Show Dropouts option at the top of the data viewer. For more information on the material settings, see Material on page 99. Profile Mode When the Gocator is in Profile scan mode, the data viewer displays profile plots. - Page 121 In a dual-sensor system, profiles from individual sensors or from a combined view can be displayed. When in the Scan page, selecting a panel (e.g., Sensor or Alignment panel) automatically sets the display to the most appropriate display view. To manually select the display view in the Scan page: Go to the Scan page.
-
Page 122: Section Mode
Left: View from the left sensor in a dual-sensor system. Right: View from the right sensor in a dual-sensor system. Left & Right: Views from both sensors, displayed at the same time in the data viewer, using the coordinate systems of each sensor. In the Measure page, the view of the display is set to the profile source of the selected measurement tool. -
Page 123: Surface Mode
To manually select the display view in the Scan page: Go to the Scan page. Choose Surface mode in the Scan Mode panel. Just above the data viewer, choose Section in the View drop-down. The view from an individual sensor or the combined view of two sensors can be selected from the drop- down list at the top of the data viewer. - Page 124 View Option Description Profile Plots the last collected profile. (Only available in 2D view.) Surface - Heightmap In 2D view, displays the pseudo color height map. In 3D view, overlays the 2D pseudo color height map on the 3D model. Surface - Grayscale In 2D view, displays the grayscale height map.
- Page 125 2D viewer with intensity overlay Choosing the Profile view option will switch the data viewer out of the 3D viewer and display the profile plot. If you have defined any sections, a Sections option will display. Clicking the 3D button toggles between the 2D and 3D viewer. The 3D model is overlaid with the information that corresponds to the selected View option.
-
Page 126: Height Map Color Scale
3D viewer with uniform overlay 3D viewer with uniform overlay In 3D mode, you can choose how the data viewer renders the model: Rendering Mode Description Point Cloud (default) Renders 3D models using point clouds. Useful in scan data that contains noise around edges, and shows hidden structure. -
Page 127: Region Definition
To change the scaling of the height map: Select Heightmap from the drop-down in the data viewer. Click the Scaling button. To automatically set the scale, choose Auto in the Range drop-down. To automatically set the scale based on a user-selected sub-region of the heightmap, choose Auto - Region in the Range drop-down and adjust the yellow region box in the data viewer to the desired location and size. -
Page 128: Intensity Output
To set up a region of interest: Move the mouse cursor to the rectangle. The rectangle is automatically displayed when a setup or measurement requires an area to be specified. Drag the rectangle to move it, and use the handles on the rectangle's border to resize it. Intensity Output Gocator sensors can produce intensity images that measure the amount of light reflected by an object. -
Page 129: Models
Models The following sections describe how to set up part matching using a model, a bounding box, or an ellipse. It also describes how to configure sections. Model Page Overview The Model page lets you set up part matching and sections. Gocator Web Interface •... -
Page 130: Part Matching
Element Description Part Matching Contains settings for configuring models and for part matching. panel Sections panel Contains settings for configuring sections, which let you extract profiles from surfaces. Data Viewer Displays sensor data and lets you add and remove model edge points. Part Matching Gocator can match scanned parts to the edges of a model based on a previously scanned part (see Using Edge Detection on page 131) or to the dimensions of a fitted bounding box or ellipse that encapsulate... -
Page 131: Using Edge Detection
Using Edge Detection When using edge detection for part matching, the Gocator compares a model that you must create from a previous scan to a "target" (one of the parts you want to match to the model). In the data viewer, a model is represented as a yellow outline. The target is represented as a blue outline. If the part match quality above a minimum user-defined level, any measurements configured on the Measure page are applied. - Page 132 1. Scan a reference part (you can also use replay data that you have previously saved). 2. Create a model based on the scan (using either heightmap or intensity data). 3. Adjust the model (edge detection algorithm sensitivity and selective removal of edge points). 4.
- Page 133 Setting Description Determines which algorithm the sensor will use to attempt a match. Set this to Match Algorithm Edge for edge detection. Image Type Determines what kind of data the Gocator will use to detect edges and therefore for part matching. Choose this setting based on the kinds of features that will be used for part matching: Heightmap : Surface elevation information of the scanned part will be used to...
-
Page 134: Creating A Model
page will be applied to parts if a part match is accepted, regardless of the part's orientation (a successfully matched part is rotated to match orientation of the model), returning a value and decision (as long as the part is in range, etc.). If a part match is rejected, measurements will return an Invalid value. - Page 135 Locate some previously recorded replay data and load it. See Recording, Playback, and Measurement Sim- ulation on page 58 and Downloading, Uploading, and Exporting Replay Data on page 61 for more inform- ation on replay data. Go to the Model page. Make sure the Enabled option is checked in the Part Matching panel.
-
Page 136: Modifying A Model's Edge Points
To rename a model: In the Models list, double-click on a model name. Type a new name in the model name field. Press Enter or click outside the model name field. Save the job by clicking the Save button To delete a model, click the button. - Page 137 Edge points along top of model removed. Part is accepted. (Min set to 85%.) Removing edge points does not cause the edge detection algorithm to run again. To change model senstivity: In the Models list, select the model you want to configure by clicking on its selection control. Click the Model Editing tab.
- Page 138 To manually remove model edge points: In the Models list, select the model you want to configure by clicking on its selection control. In the Model Editing tab, click on the Edit button. On the toolbar above the data viewer, make sure the Select tool is active. Click in the data viewer and hold the mouse button while moving the pointer over the edge points you want to remove.
-
Page 139: Adjusting Target Sensitivity
Points within the circular Select tool are removed from the model. Removed edge points turn red in the data viewer. You can zoom in to see individual edge points by using the mouse wheel or by using the Zoom mode ( If you have removed too many edge points, use Ctrl + Click in the data viewer to add the edge points back. -
Page 140: Setting The Match Acceptance Criteria
You can also set the sensitivity value manually in the provided text box. Setting the Match Acceptance Criteria In order for a part to match a model, the match quality must reach the minimum set in the Min field in Acceptance Criteria section of the Part Matching panel. - Page 141 In the data viewer, a bounding box or ellipse is displayed with a blue outline. If a part fits in the bounding box or ellipse, any measurements configured on the Measure page are applied. Blue bounding box around a part. (Yellow lines show currently selected dimension in Part Matching panel.) Typically, setting up a bounding box or an ellipse to perform part matching involves the following steps:...
-
Page 142: Configuring A Bounding Box Or An Ellipse142
Setting Description Bounding Box Ellipse Corrects the orientation of the bounding box or ellipse to accurately match Z Angle typical orientation and simplify measurements. Asymmetry Detection Rotates scans based on the asymmetry of the scanned part. Gocator calculates the number of points on each side of the part's centroid in the bounding box or ellipse. -
Page 143: Running Part Matching
Part matching is only available when Part has been selected. Do one of the following: Scan a reference part. See Scan Setup and Alignment on page 82 for more information on setting up and aligning Gocator. See Running a Standalone Sensor System on page 36 or Running a Dual-Sensor System on page 37 for more information on running a system to scan a part. -
Page 144: Using Part Matching To Accept Or Reject A Part
Using Part Matching to Accept or Reject a Part Part matching results only determine whether a measurement is applied to a part. Whether the measurement returns a pass or fail value—its decision—depends on whether the measurement's value is between the Min and Max values set for the measurement. This decision, in addition to the actual value, can in turn be used to control a PLC for example. - Page 145 Part in data viewer (3D view) Section defined on top of part (2D view) Gocator Web Interface • Models • 145 Gocator Line Profile Sensors - User Manual...
- Page 146 Circle Radius measurement running on profile extracted from surface using defined section You can configure the sampling distance between points along the section. Reducing the sampling distance reduces the resolution of the profile, but increases the sensor’s performance and results in less data being sent over the output.
-
Page 147: Creating A Section
Maximum spacing interval: lowest profile resolution, lower sensor CPU usage and data output Using a higher spacing interval can produce different measurement results compared to using a smaller spacing interval. You should therefore compare results before using sections in production. The sections you add to a surface are directional, and their start and end points are defined using X and Y coordinates. - Page 148 After creating a section, the following settings are available: Setting Description Spacing Interval Determines the space between the points of the extracted profile. Auto - The highest resolution, calculated using the X and Y resolution of the scan. Custom - Lets you set the spacing interval by using a slider or setting the value manually.
-
Page 149: Deleting A Section
After you create a section, Gocator lists the profile measurement tools in the Tools panel on the Measure page. If you have created more than one section, you must select it in the tool. For more information on profile measurement tools, see Profile Measurement on page 161. Gocator also adds a Section option to the View drop-down above the data viewer, which lets you view an extracted profile. -
Page 150: Measurement
Measurement The following sections describe the Gocator's tools and measurements. Measure Page Overview Measurement tools are added and configured using the Measure page. The content of the Tools panel in the Measure page depends on the current scan mode. In Profile mode, the Measure page displays tools for profile measurement.In Surface mode, the Measure page displays tools for surface measurement. -
Page 151: Data Viewer
Element Description See Data Viewer below. Feature Area Configurable region of interest from which feature points are detected. These feature points are used to calculate the measurements. The number of feature areas displayed depends on which measurement tool is currently selected. Data Viewer Regions, such as active area or measurement regions, can be graphically set up using the data viewer. -
Page 152: Source
Choose Profile or Surface mode in the Scan Mode panel. If one of these modes is not selected, tools will not be available in the Measure panel. Go to the Measure page by clicking on the Measure icon. In the Tools panel, select the tool you want to add from the drop-down list of tools. Click on the Add button in the Tools panel. -
Page 153: Streams (Sections)
Setting Description Bottom Refers to a Buddy sensor in a dual-sensor system position in Opposite layout. Top Left Refers to a Main sensor in Wide layout or to a Buddy sensor in Reverse layout in a dual- sensor system position. Top Right Refers to a Buddy sensor in Wide layout or to a Main sensor in Reverse layout in a dual- sensor system position. -
Page 154: Decisions
All tools provide region settings under the Parameters tab. Region settings are often found within expandable feature sections in the tool's panel. The Region settings apply to all of a tool's measurements. See the individual tools for any details on using this parameter with each tool. This parameter is also referred to as a measurement region. - Page 155 Value (14.786) within decision thresholds (Min: 14, Max: 15). Decision: Pass Value (1604.250) outside decision thresholds (Min: 1500, Max: 1600). Decision: Fail Along with measurement values, decisions can be sent to external programs and devices. In particular, decisions are often used with digital outputs to trigger an external event in response to a measurement. See Output on page 235 for more information on transmitting values and decisions.
-
Page 156: Filters
Click on the Output tab. For some measurements, only the Output tab is displayed. Enter values in the Min and Max fields. Filters Filters can be applied to measurement values before they are output from the Gocator sensors. All measurements provide filter settings under the Output tab. Filter Description Scale and Offset... -
Page 157: Measurement Anchoring
Click on the Output tab. For some measurements, only the Output tab is displayed. Expand the Filters panel by clicking on the panel header or the button. Configure the filters. Refer to the table above for a list of the filters. Measurement Anchoring Measurement anchoring is used to track the movement of parts within the field of view of the sensor, compensating for variations in the height and position of parts. -
Page 158: Enabling And Disabling Measurements
a. Use the Start or Snapshot button to view live profile data to help position the target. In Surface mode a. Select a Surface Generation type (see on page 108) and adjust Part Detection settings (see on page 112) if applicable. b. - Page 159 To enable a measurement: Go to the Scan page by clicking on the Scan icon. Choose Profile or Surface mode in the Scan Mode panel. If one of these modes is not selected, tools will not be available in the Measure panel. Go to the Measure page by clicking on the Measure icon.
-
Page 160: Editing A Tool Or Measurement Name
Editing a Tool or Measurement Name You can change the names of tools you add in Gocator. You can also change the names of their measurements. This allows multiple instances of tools and measurements of the same type to be more easily distinguished in the Gocator web interface. -
Page 161: Removing A Tool
Removing a Tool Removing a tool removes all of its associated measurements. To remove a tool: Go to the Scan page by clicking on the Scan icon. Choose Profile or Surface mode in the Scan Mode panel. If is not selected, tools will not be available in the Measure panel. Go to the Measure page by clicking on the Measure icon. - Page 162 Point Type Examples Min Z Finds the point with the minimum Z value in the region of interest. Min X Finds the point with the minimum X value in the region of interest. Max X Finds the point with the maximum X value in the region of interest.
-
Page 163: Fit Lines
Point Type Examples Right Corner Finds the right-most corner in the region of interest, where corner is defined as a change in profile shape. Rising Edge Finds a rising edge in the region of interest. Falling Edge Finds a falling edge in the region of interest. Any Edge Finds a rising or falling edge in the region of interest. -
Page 164: Measurement Tools
Measurement Tools Area The Area tool determines the cross-sectional area within a region. Gocator compares the measurement value with the values in Min and Max to yield a decision. For more information on decisions, see Decisions on page 154. See Adding and Configuring a Tool on page 151 for instructions on how to add measurement tools. Areas are positive in regions where the profile is above the X axis. - Page 165 Measurement Illustration Centroid X Determines the X position of the centroid of the area. Centroid Z Determines the Z position of the centroid of the area. Parameters Parameter Description Type Object area type is for convex shapes above the baseline. Regions below the baseline are ignored.
-
Page 166: Bounding Box
Parameter Description See Fit Lines on page 163 for more information on fit lines. Decision See Decisions on page 154. Region See Regions on page 153. Filters See Filters on page 156. Bounding Box The Bounding Box tool provides measurements related to the smallest box that contains the profile (for example, X position, Z position, width, etc.). - Page 167 Measurements Measurement Illustration Determines the X position of the center of the bounding box that contains the profile. The value returned is relative to the profile. Determines the Z position of the center of the bounding box that contains the profile. The value returned is relative to the profile.
-
Page 168: Bridge Value
Parameters Parameter Description Decision See Decisions on page 154. Region See Regions on page 153. Filters See Filters on page 156. Bridge Value The Bridge Value tool lets you calculate the "bridge value" and angle of a scanned surface. A bridge value is a single, processed range that is basically a filtered average of a laser line profile, representing a "roughness calculation."... - Page 169 See Adding and Configuring a Tool on page 151 for instructions on how to add measurement tools. Measurement Panel Measurements Measurement Illustration Bridge Value Determines the bridge value of the profile. Angle Determines the angle of the line fitted to the profile. When Normalize Tilt is unchecked, the measurement always returns 0.
-
Page 170: Circle
Parameters Parameter Description Window A percentage of the profile point heights in the histogram, starting from the highest point, to include in the average. For example, a setting of 50% would include the highest 50% of the heights. The Skip parameter then determines the actual portion of the profile point heights used to calculate the average. -
Page 171: Dimension
Measurements Measurement Illustration Radius Measures the radius of the circle. Finds the circle center position in the X axis. Finds the circle center position in the Z axis. Parameters Parameter Description Decision See Decisions on page 154. Region See Regions on page 153. Filters See Filters on page 156. - Page 172 The tool's measurements require two feature points. See Feature Points on page 161 for information on point types and how to configure them. Measurements Measurement Illustration Width Determines the difference along the X axis between two feature points. The difference can be calculated as an absolute or signed result.
-
Page 173: Groove
Measurement Illustration Center X Finds the average location of two features and measures the X axis position of the average location Center Z Finds the average location of two features and measures the Z axis position of the average location. Parameters Parameter Description... - Page 174 The Groove tool uses a complex feature-locating algorithm to find a groove and then return measurements. See "Groove Algorithm" in the Gocator Measurement Tool Technical Manual for a detailed explanation of the algorithm. The behavior of the algorithm can be adjusted by changing the parameters in the measurement panel.
- Page 175 Measurement Illustration Depth Measures the depth of a groove as the maximum perpendicular distance from a line connecting the edge points of the groove. Measures the X position of the bottom of a groove. Measures the Z position of the bottom of a groove. Parameters Parameter Description...
- Page 176 Parameter Description Location Specifies the location type to return (Groove X and Groove Bottom - Groove bottom. For a U-shape and open-shape groove, the X position is at the centroid of Z measurements only) the groove. For a V-shape groove, the X position is at the intersection of lines fitted to the left and right sides of the groove.
-
Page 177: Intersect
Parameter Description Filters See Filters on page 156. Intersect The Intersect tool determines intersect points and angles. Gocator compares the measurement value with the values in Min and Max to yield a decision. For more information on decisions, see Decisions on page 154. - Page 178 Measurements Measurement Illustration Finds the intersection between two fitted lines and measures the X axis position of the intersection point. Finds the intersection between two fitted lines and measures the Z axis position of the intersection point. Angle Finds the angle subtended by two fitted lines. Parameters Parameter Description...
-
Page 179: Line
Line The Line tool fits a line to the live profile and measures the deviations from the best-fitted line. Gocator compares the measurement value with the values in Min and Max to yield a decision. For more information on decisions, see Decisions on page 154. See Adding and Configuring a Tool on page 151 for instructions on how to add measurement tools. -
Page 180: Panel
Parameters Parameter Description Percent The specified percentage of points around the best-fitted line. (Percentile measurement only) Decision See Decisions on page 154. Region See Regions on page 153. Filters See Filters on page 156. Panel The Panel tool provides Gap and Flush measurements. Gocator compares the measurement value with the values in Min and Max to yield a decision. - Page 181 Measurements Measurement Illustration Measures the distance between two surfaces. The surface edges can be curved or sharp. Flush Measures the flushness between two surfaces. The surface edges can be curved or sharp. Parameters Parameter Description Max Gap Width The maximum width of the gap. Allows the tool to filter gaps greater than the expected width.
-
Page 182: Position
Left/Right SideParameters Parameter Description Max Void Width The maximum allowed width of missing data caused by occlusion or data dropout. Min Depth Defines the minimum depth before an opening could be considered to have a potential edge. The depth is the perpendicular distance from the fitted surface line. Surface Width The width of the surface area in which laser data is used to form the fitted surface line. -
Page 183: Round Corner
See Adding and Configuring a Tool on page 151 for instructions on how to add measurement tools. Measurements Measurement Illustration Finds the position of a feature on the X axis. Finds the position of a feature on the Z axis. Parameters Parameter Description... - Page 184 Gocator compares the measurement value with the values in Min and Max to yield a decision. For more information on decisions, see Decisions on page 154. See Adding and Configuring a Tool on page 151 for instructions on how to add measurement tools. The Round Corner tool uses a complex feature-locating algorithm to find the edge and return measurements.
- Page 185 Measurement Illustration Measures the Z position of the location where the tangent touches the edge, or intersect of the tangent and the line fitted to the surface used by the measurement (see Reference Side, below). Angle Measures the angle of the line fitted to the surface next to the corner (see Reference Side, below), with respect to the x-axis.
-
Page 186: Strip
Parameter Description Surface Width The width of the surface area in which laser data is used to form the fitted surface line. This value should be as large as the surface allows. Surface Offset The distance between the edge region and the surface region. Setting a small value allows the edge within a tighter region to be detected. - Page 187 The Strip tool uses a complex feature-locating algorithm to find a strip and then return measurements. See "Strip Algorithm" in the Gocator Measurement Tool Technical Manual for a detailed explanation of the algorithm. The behavior of the algorithm can be adjusted by changing the parameters in the measurement panel.
- Page 188 Measurement Illustration Height Measures the height of a strip. Measures the X position of a strip. Measures the Z position of a strip. Parameters Parameter Description Base Type Affects detection of rising and falling edges. When Base Type is set to Flat, both strip (raised area) and base support regions are needed. When set to None, only a point that deviates from a smooth strip support region is needed to find a rising or falling edge.
- Page 189 Parameter Description Location Specifies the strip position from which the measurements are performed. (Strip Height, Strip X, and Left - Left edge of the strip. Strip Z measurements only) Right - Right edge of the strip. Center - Center of the strip. Left Edge Specifies the features that will be considered as the strip's left and right edges.
-
Page 190: Tilt
Parameter Description Min Width Specifies the minimum width for a strip to be considered valid. Tilt Enabled Enables/disables tile correction. Decision See Decisions on page 154. Region The measurement region defines the region in which to search for the strip. If possible, the region should be made large enough to cover the base on the left and right sides of the strip. -
Page 191: Surface Measurement
See Script Measurement on page 230 for more information on the script syntax. To create or edit a Script measurement: Add a new Script tool or select an existing Script measurement. Edit the script code. Add script outputs using the Add button. For each script output that is added, an index will be added to the Output drop-down and a unique ID will be generated. -
Page 192: Measurement Tools
Multiple measurements can be performed on the entire surface or each discrete object, limited only by the available CPU resources. The frame of reference for the coordinate system of the detected object can be set to Sensor or Part in the Part Detection panel (see on page 112). - Page 193 2D View 3D View Measurement Panel Gocator Web Interface • Measurement • 193 Gocator Line Profile Sensors - User Manual...
- Page 194 Measurements Measurement Illustration Determines the X position of the center of the bounding box that contains the part. The value returned is relative to the part. Determines the Y position of the center of the bounding box that contains the part. The value returned is relative to the part.
- Page 195 Measurement Illustration Height Determines the height of the bounding box that contains the part. Z Angle Determines the rotation around the Z axis and the angle of the longer side of the bounding box relative to the X axis. If Rotation is not enabled, the measurement returns 90.000 degrees.
-
Page 196: Countersunk Hole
Parameter Description Check the Rotation setting to select rotated bounding box. Asymmetry Detection Resolves the orientation of an object over 360 degrees. The possible values are: 0 – None 1 – Along Major Axis 2 – Along Minor Axis This setting is only visible if Rotation is checked. Decision See Decisions on page 154. - Page 197 Gocator Web Interface • Measurement • 197 Gocator Line Profile Sensors - User Manual...
- Page 198 Measurement Panel Measurements Measurement Illustration Determines the X position of the center of the countersunk hole. Determines the Y position of the center of the countersunk hole. Determines the Z position of the center of the countersunk hole. Outer Radius Determines the outer radius of the countersunk hole.
- Page 199 Measurement Illustration Depth Determines the depth of the countersunk hole relative to the surface that the countersunk hole is on. Bevel Radius Determines the radius at a user-defined offset (Offset setting) relative to the surface that the countersunk hole is on. To convert the radius to a diameter, set the Scale setting in the Output panel (displayed after expanding the Filters section) to 2.
- Page 200 Measurement Illustration Bevel Angle Determines the angle of the hole's bevel. Cone Counterbore X Angle Determines the angle the hole relative to the X axis. Cone Y Angle Determines the angle of the hole relative to the Y axis. Counterbore Counterbore Depth Determines the depth of a counterbore.
- Page 201 Measurement Illustration Axis Tilt Measures the tilt of the axis of the hole relative to the surface surrounding the hole. This measurement is not supported when Shape is set to Counterbore. Axis Orientation Measures the angle of the axis of the hole around the normal of the surface surrounding the hole, relative to the X axis.
- Page 202 Parameter Description When this option is set to Autoset, the algorithm automatically determines the reference region. When the option is not set to Autoset, the user manually specifies the reference region. The location of the reference region is relative to the detected center of the hole and positioned on the nominal surface plane.
-
Page 203: Dimension
Dimension The Dimension tool returns various dimensional measurements of a part. You must specify two feature types (see below). Gocator compares the measurement value with the values in Min and Max to yield a decision. For more information on decisions, see Decisions on page 154. See Adding and Configuring a Tool on page 151 for instructions on how to add measurement tools. - Page 204 Measurements Measurement Illustration Width Determines the distance between the selected features along the X axis. Length Determines the distance between the selected features along the Y axis. Height Determines the distance between the selected features along the Z axis. Gocator Web Interface • Measurement • 204 Gocator Line Profile Sensors - User Manual...
- Page 205 Measurement Illustration Distance Determines the direct, Euclidean distance between the selected features. Plane Distance Determines the distance between the selected features. The position of the lowest feature point is projected onto the XY plane of the highest feature point. Center X Determines the X position of the center point between the selected features.
-
Page 206: Ellipse
Parameter Description Max Y Min Z Max Z Decision See Decisions on page 154. Region See Regions on page 153. Output See Filters on page 156. Ellipse The Ellipse tool provides measurements for the major and minor axis lengths of an ellipse fitted to the part's shape in the XY plane, and also for the ratio of the major and minor axis lengths and for the orientation angle of the ellipse. - Page 207 Measurement Panel Measurements Measurement Illustration Major Determines the major axis length of an ellipse fitted to the part's area in the XY plane. Minor Determines the minor axis length of an ellipse fitted to the part's area in the XY plane. Ratio Determines the minor/major axis ratio of an ellipse fitted to the part's area in the XY plane.
-
Page 208: Hole
Parameters Parameter Description Asymmetry Detection Resolves the orientation of an object over 360 degrees. The possible values are: 0 – None 1 – Along Major Axis 2 – Along Minor Axis Decision See Decisions on page 154. Region See Regions on page 153. Output See Filters on page 156. - Page 209 3D View 2D View Gocator Web Interface • Measurement • 209 Gocator Line Profile Sensors - User Manual...
- Page 210 Measurement Panel Measurements Measurement Illustration Determines the X position of the hole center. Determines the Y position of the hole center. Determines the Z position of the hole center. Radius Determines the radius of the hole. Parameters Parameter Description Nominal Radius Expected radius of the hole.
- Page 211 Parameter Description Partial Detection Enable if only part of the hole is within the measurement region. If disabled, the hole must be completely in the region of interest for results to be valid. Depth Limit Data below this limit (relative to the surface) is excluded from the hole calculations.
-
Page 212: Measurement Region
Parameter Description for a bounding rectangular region around the hole. Tilt Correction Tilt of the target with respect to the alignment plane. When this option is set to Autoset, the tool automatically detects the tilt. Otherwise, the user must enter the angles manually. Autoset requires the measurement region to cover more areas on the surface plane than other planes. - Page 213 defined parameters is present and that it is on a sufficiently uniform background. See Adding and Configuring a Tool on page 151 for instructions on how to add measurement tools. The tool uses a complex feature-locating algorithm to find a hold and then return measurements.
- Page 214 3D View 2D View Gocator Web Interface • Measurement • 214 Gocator Line Profile Sensors - User Manual...
- Page 215 Gocator Web Interface • Measurement • 215 Gocator Line Profile Sensors - User Manual...
- Page 216 Measurement Panel Measurements Measurement Illustration Determines the X position of the opening's center. Determines the Y position of the opening's center. Determines the Z position of the opening's center. Width Determines the width of the opening. Length Determines the length of the opening. Gocator Web Interface •...
- Page 217 Measurement Illustration Angle Determines the angle (rotation) around the normal of the alignment plane. Parameters Parameter Description Type Rounded Slot, Rectangle. Nominal Width Nominal width of the opening. Nominal length Nominal length of the opening. Nominal Angle Nominal angle of the opening. The default orientation is the length of the opening along the X axis.
- Page 218 Parameter Description Width Tolerance The maximum variation from the nominal width (+/- from the nominal value). Length Tolerance The maximum variation from the nominal length (+/- from the nominal value). Angle Tolerance The maximum variation from the nominal orientation (+/- from the nominal value). Partial Detection Enable if only part of the opening is within the measurement region.
-
Page 219: Measurement Region
Parameter Description With one or more reference region, the algorithm calculates the Z positions as the average values of the data within the regions. When the user places the reference region manually, all of the data is used, whether the data is inside or outside the opening. - Page 220 Max to yield a decision. For more information on decisions, see Decisions on page 154. See Adding and Configuring a Tool on page 151 for instructions on how to add measurement tools. The Z offset reported is the Z position at zero position on the X axis and the Y axis. The results of the Plane Angle X and Plane Angle Y measurements can be used to customize the tilt angle in the Hole, Opening, and Stud tools.
- Page 221 Measurement Panel Measurements Measurement Illustration Angle X Determines the X angle of the surface with respect to the alignment target. Angle Y Determines the Y angle of the surface with respect to the alignment target. Offset Z Determines the Z offset of the surface with respect to the alignment target.
-
Page 222: Position
Measurement Illustration Max Error Measures the maximum error from the detected plane (the maximum distance above the plane). Parameters Parameter Description Decision See Decisions on page 154. Region See Regions on page 153. Output See Filters on page 156. Position The Position tool reports the X, Y, or Z position of a part. - Page 223 Measurement Panel Measurements Measurement Illustration Determines the X position of the selected feature type. Determines the Y position of the selected feature type. Determines the Z position of the selected feature type. Parameters Parameter Description Feature Type One of the following: Average, Centroid, Min X, Max X, Min Y, Max Y, Min Z, Max Z, Median.
-
Page 224: Stud
Stud The Stud tool measures the location and radius of a stud. The Stud tool does not search for or detect a stud. The tool expects that a stud conforming reasonably well to the defined parameters is present and that it is on a sufficiently uniform background. - Page 225 3D View 2D View Gocator Web Interface • Measurement • 225 Gocator Line Profile Sensors - User Manual...
- Page 226 Measurement Panel Measurements Measurement Illustration Tip X Determines the X position of the stud tip. Tip Y Determines the Y position of the stud tip. Tip Z Determines the Z position of the stud tip. Base X Determines the X position of the stud base. Base Y Determines the Y position of the stud base.
-
Page 227: Measurement Region
Parameters Parameter Description Nominal Stud Radius Expected radius of the stud. Nominal Stud Length Expected length of the stud. Base Height The height above the base surface that will be ignored when the (truncated) cone is fit to the stud data. Tip Height The height from the top of the surface that will be ignored when the (truncated) cone is fit to the stud data. - Page 228 Measurement Panel Measurements Measurement Illustration Volume Measures volume in XYZ space. Area Measures area in the XY plane. Thickness Measures thickness (height) of a part. Parameters Parameter Description One of the following: maximum height, minimum Location Gocator Web Interface • Measurement • 228 Gocator Line Profile Sensors - User Manual...
-
Page 229: Script
Parameter Description height, average height, median height, the height at (Thickness measurement only) the 2D centroid in the XY plane, or the height at the 3D centroid in XYZ space. Decision See Decisions on page 154. Region See Regions on page 153. Output See Filters on page 156. -
Page 230: Script Measurement
Click the Save button to save the script code. If there is a mistake in the script syntax, the result will be shown as a "Invalid" with a red border in the data viewer when you run the sensor. Outputs from multiple measurement tools can be used as inputs to the script. A typical script would take results from other measurement tools using the value and decision function, and output the result using the output function. - Page 231 Function Description 1 - Measurement is valid double Measurement_Value (int id) Gets the value of a measurement by its ID. Parameters: id - Measurement ID Returns: Value of the measurement 0 – if measurement does not exist 1 – if measurement exists int Measurement_Decision (int id) Gets the decision of a measurement by its ID.
- Page 232 Function Description decision - decision value output by the script. Can only be 0 or 1 void Output_SetAt(unsigned int index, Sets the output value and decision at the specified output index. To double value, int decision) output an invalid value, the constant INVALID_VALUE can be used (e.g., Output_SetAt(0, INVALID_VALUE, 0)) Parameters: index –...
- Page 233 Function Description double Memory_Get64f (int id) Loads a 64-bit double from persistent memory. All persistent memory values are set to 0 when the sensor starts. Parameters: id - ID of the value Returns: value - Value stored in persistent memory int Memory_Exists (int id) Tests for the existence of a value by ID.
- Page 234 Math Functions Function Description float sqrt(float x) Calculates square root of x float sin(float x) Calculates sin(x) (x in radians) float cos(float x) Calculates cos(x) (x in radians) float tan(float x) Calculates tan(x) (x in radians) float asin(float x) Calculates asin(x) (x in radians) float acos(float x) Calculates acos(x) (x in radians) float atan(float x)
-
Page 235: Output
Output The following sections describe the Output page. Output Page Overview Output configuration tasks are performed using the Output page. Gocator sensors can transmit laser profiles and measurement results to various external devices using several output interface options. Up to two outputs can have scheduling enabled with ASCII as the Serial output protocol. When Selcom is the current Serial output protocol, only one other output can have scheduling enabled. -
Page 236: Ethernet Output
Ethernet Output A sensor uses TCP messages (Gocator protocol) to receive commands from client computers, and to send video, laser profile, intensity, and measurement results to client computers. The sensor can also receive commands from and send measurement results to a PLC using ASCII, Modbus TCP, or EtherNet/IP protocol. - Page 237 To receive commands and send results using Modbus TCP messages: Go to the Output page. Click on Ethernet in the Output panel. Select Modbus as the protocol in the Protocol drop-down. Unlike the Gocator Protocol, you do not select which measurement items to output. The Ethernet panel will list the register addresses that are used for Modbus TCP communication.
- Page 238 To receive commands and send results using EtherNet/IP messages: Go to the Output page. Click on Ethernet in the Output panel. Select EtherNet/IP in the Protocol option. Unlike using the Gocator Protocol, you don't select which measurement items to output. The Ethernet panel will list the register addresses that are used for EtherNet/IP messages communication.
- Page 239 To receive commands and send results using ASCII messages: Go to the Output page. Click on Ethernet in the Output panel. Select ASCII as the protocol in the Protocol drop-down. Set the operation mode in the Operation drop-down. In asynchronous mode, the data results are transmitted when they are available. In polling mode, users send commands on the data channel to request the latest result.
-
Page 240: Digital Output
Digital Output Gocator sensors can convert measurement decisions or software commands to digital output pulses, which can then be used to output to a PLC or to control external devices, such as indicator lights or air ejectors. A digital output can act as a measurement valid signal to allow external devices to synchronize to the timing at which measurement results are output. - Page 241 Set the Signal option. The signal type specifies whether the digital output is a continuous signal or a pulsed signal. If Signal is set to Continuous, the signal state is maintained until the next transition occurs. If Signal is set to is Pulsed, you must specify the pulse width and how it is scheduled.
-
Page 242: Analog Output
Set Trigger Event to Software. Specify a Signal type. The signal type specifies whether the digital output is a continuous signal or a pulsed signal. If the signal is continuous, its state is maintained until the next transition occurs. If the signal is pulsed, user specifies the pulse width and the delay. - Page 243 See Analog Output on page 498 for information on wiring analog output to an external device. To output measurement value or decision: Go to the Output page. Click on Analog in the Output panel. Set Trigger Event to Measurement. Select the measurement that should be used for output. Only one measurement can be used for analog output.
-
Page 244: Serial Output
An Immediate output becomes active as soon as the measurement results are available. The output activates after the Gocator finishes processing the data. As a result, the time between the start of Gocator exposure and output activates depends on the processing latency. The latency is reported in the dashboard and in the health messages. - Page 245 To configure ASCII output: Go to the Output page. Click on Serial in the Output panel. Select ASCII in the Protocol option. Select the Data Format. Select Standard to use the default result format of the ASCII protocol. Select value and decision to send by placing a check in the corresponding check box.
- Page 246 To configure Selcom output: Go to the Output page. Click on Serial in the Output panel. Select Selcom in the Protocol option. Select the measurements to send. To select an item for transmission, place a check in the corresponding check box. Measurements shown here correspond to measurements that have been programmed using the Measurements page.
-
Page 247: Dashboard
Dashboard The following sections describe the Dashboard page. Dashboard Page Overview The Dashboard page summarizes sensor health information, and measurement statistics. Element Description System Displays sensor state and health information. See State and Health Information below. Measurements Displays measurement statistics. See Measurements on page 249. State and Health Information The following state and health information is available in the System panel on the Dashboard page: Dashboard General System Values... - Page 248 Name Description Laser Safety Whether Laser Safety is enabled. Uptime Length of time since the sensor was power-cycled or reset. CPU Usage Sensor CPU utilization (%). Current Speed* Current speed of the sensor. Encoder Value Current encoder value (ticks). Encoder Frequency Current encoder frequency (Hz).
-
Page 249: Measurements
** When the sensor is accelerated, the indicator's value is the sum of the values reported from the sensor and the accelerating PC. Measurements Measurement statistics are displayed for each measurement that has been configured on the Measure page. Use the Reset button to reset the statistics. The following information is available for each measurement: Dashboard Measurement Statistics Name... -
Page 250: Gocator Emulator
Gocator Emulator The Gocator emulator is a stand-alone application that lets you run a "virtual" sensor. In a virtual sensor, you can test jobs, evaluate data, and even learn more about new features, rather than take a physical device off the production line to do this. You can also use a virtual sensor to familiarize yourself with the overall interface if you are new to Gocator. -
Page 251: Downloading A Support File
Jobs list on the Manage page to a client computer. The job file can then be loaded into the emulator at a later time or even onto a physical sensor for final testing. Performing alignment in the emulator has no effect and will never complete. Only one instance can be run at a time. -
Page 252: Running The Emulator
When you create a scenario from a support file in the emulator, the description is displayed below the emulator's scenario list. Click Download, and then when prompted, click Save. Downloading a support file stops the sensor. Running the Emulator The emulator is contained in the Gocator tools package (14405-x.x.x.x_SOFTWARE_GO_Tools.zip). You can download the package by going to http://lmi3d.com/support/downloads/, selecting a product type, and clicking on the Product User Area link. -
Page 253: Adding A Scenario To The Emulator
Selecting the emulator interface language Adding a Scenario to the Emulator To simulate a physical sensor using a support file downloaded from a sensor, you must add it as a scenario in the emulator. You can add support files downloaded from any series of Gocator sensors to the emulator. To add a scenario: Launch the emulator if it isn't running already. -
Page 254: Removing A Scenario From The Emulator
To run a scenario: If you want to filter the scenarios listed in Available Scenarios, do one or both of the following: Choose a model family in the Model drop-down. Choose Standalone or Buddy to limit the scenarios to single-sensor or dual-sensor scenarios, respect- ively. -
Page 255: Using Replay Protection
Click the button next to the scenario you want to remove. The scenario is removed from the emulator. Using Replay Protection Making changes to certain settings on the Scan page causes the emulator to flush replay data. The Replay Protection option protects replay data by preventing changes to settings that affect replay data. -
Page 256: Playback And Measurement Simulation
information on downloading and uploading jobs between the emulator and a computer, see Downloading and Uploading Jobs on page 260. The job drop-down list in the toolbar shows the jobs available in the emulator. The job that is currently active is listed at the top. The job name will be marked with "[unsaved]" to indicate any unsaved changes. To create a job: Choose [New] in the job drop-down list and type a name for the job. - Page 257 Playback controls when replay is on To replay data: Toggle Replay mode on by setting the slider to the right in the Toolbar. The slider's background turns blue. To change the mode, you must uncheck Replay Protection. Use the Replay slider or the Step Forward, Step Back, or Play buttons to review data. The Step Forward and Step Back buttons move and the current replay location backward and forward by a single frame, respectively.
-
Page 258: Downloading, Uploading, And Exporting Replay Data
To clear replay data: Click the Clear Replay Data button Downloading, Uploading, and Exporting Replay Data Replay data (recorded scan data) can be downloaded from the emulator to a client computer, or uploaded from a client computer to the emulator. Data can also be exported from the emulator to a client computer in order to process the data using third-party tools. - Page 259 Do one of the following: Click Discard to discard any unsaved changes. Click Cancel to return to the main window to save your changes. If you clicked Discard, navigate to the replay data to upload from the client computer and click OK. The replay data is loaded, and a new unsaved, untitled job is created.
-
Page 260: Downloading And Uploading Jobs
To export recorded intensity data to the BMP format: Click the Export button and select Intensity data as BMP. Only the intensity data in the current replay location is exported. Use the playback control buttons to move to a different replay location; for information on playback, see To replay data in Playback and Measurement Simulation on page 256. -
Page 261: Scan, Model, And Measurement Settings
Element Description Set as Default Setting a different job as the default is not persistent in the emulator. The job set as default when the button support file (used to create a virtual sensor) was downloaded is used as the default whenever the emulator is started. -
Page 262: Calculating Potential Maximum Frame Rate
For information on creating models and setting up part matching, see Models on page 129. For information on adding and configuring measurement tools, see Measurement on page 150. Calculating Potential Maximum Frame Rate You can use the emulator to calculate the potential maximum frame rate you can achieve with different settings. - Page 263 In the command prompt, type GoEmulator.exe /ip, followed by an IPV4 address. The emulator does not check that the IP address is valid. The emulator launches. Clients can now connect to the IP address you specified in the command prompt. Gocator Emulator • Protocol Output • 263 Gocator Line Profile Sensors - User Manual...
-
Page 264: Gocator Accelerator
Gocator Accelerator The Gocator Accelerator improves a Gocator system's processing capability by transferring the processing to PCs that are in the system. The web interface and the supported output protocols (Gocator, EtherNet/IP, and ASCII protocols over Ethernet) are identical to an unaccelerated sensor. The Gocator Accelerator does not currently support the Modbus protocol. -
Page 265: Benefits
and clicking on the Product User Area link. You can download the GoAccelerator application from the same location. The Gocator Accelerator (either the standalone application or an SDK-created application that accelerates a sensor) cannot run at the same time as the emulator. The accelerator cannot currently accelerate a sensor running firmware containing custom measurement tools created using the GDK. - Page 266 An SDK application can interface to the Accelerator application the same way as a physical sensor. For more information on SDK application integration, see SDK Application Integration on the next page. To accelerate a sensor using the Gocator Accelerator application: Start the sensor you want to accelerate. Launch the Gocator Accelerator application.
-
Page 267: Dashboard
Select the sensor in the Sensors list. Click Stop. To exit the Gocator Accelerator application: Right-click the icon Gocator Accelerator icon ( ) in the notification tray. Clicking the X icon in the application only minimizes the application. Choose Exit. Dashboard After a sensor is accelerated, the values of some of the health indicators come from the accelerating PC, instead of the sensor. -
Page 268: Limitations
printf("Error: GoAccelerator_Attach:%d\n", status); return; // create connection to GoSensor object if ((status = GoSensor_Connect(sensor)) != kOK) printf("Error: GoSensor_Connect:%d\n", status); return; After, the SDK application is the same as controlling and acquiring data from a standalone sensor. Limitations The Gocator Accelerator currently has the following limitations: 1. -
Page 269: Gocator Device Files
Gocator Device Files This section describes the user-accessible device files stored on a Gocator. Live Files Various "live" files stored on a Gocator sensor represent the sensor's active settings and transformations (represented together as "job" files), the active replay data (if any), and the sensor log. By changing the live job file, you can change how the sensor behaves. -
Page 270: Log File
Log File The log file contains log messages generated by the sensor. The root element is Log. To access the log file, use the Read File command, passing "_live.log" to the command. The log file is read- only. Log Child Elements Element Type Description... -
Page 271: Accessing Files And Components
Job File Components Component Path Description Configuration config.xml The job's configurations. This component is always present. Transform transform.xml Alignment Reference Transformation values. Present only if is set to Dynamic. Part model <name>.mdl One or more part model files. Part models are created using models and part matching Elements in the components contain three types of values: settings, constraints, and properties. -
Page 272: Setup
Element Type Description @versionMinor Configuration minor version (5). Setup Section Setup For a description of the Setup elements, see below. Replay Section Contains settings related to recording filtering (see Replay on page 289). Streams Section Streams/Stream Read-only collection of available data streams (see (Read-only) on page 290). -
Page 273: Filters
Element Type Description IntensityEnabled.used Bool Whether or not property is used. IntensityEnabled.value Bool Actual value used if not configurable. ExternalInputZPulseEnabled Bool Enables the External Input based encoder Z Pulse feature. Filters Section Filters below. Trigger Trigger Section on page 276. Layout Layout Section... -
Page 274: Ysmoothing
YSmoothing YSmoothing Child Elements Element Type Description @used Bool Whether or not this field is used Enabled Bool Enables filtering. Window Window size (mm). Window.min Minimum window size (mm). Window.max Maximum window size (mm). XGapFilling XGapFilling Child Elements Element Type Description @used Bool... -
Page 275: Ymedian
YMedian YMedian Child Elements Element Type Description @used Bool Whether or not this field is used Enabled Bool Enables filtering. Window Window size (mm). Window.min Minimum window size (mm). Window.max Maximum window size (mm). XDecimation XDecimation Child Elements Element Type Description @used Bool... -
Page 276: Trigger
YSlope Child Elements Element Type Description @used Bool Whether or not this field is used Enabled Bool Enables filtering. Window Window size (mm). Window.min Minimum window size (mm). Window.max Maximum window size (mm). Trigger The Trigger element contains settings related to trigger source, speed, and encoder resolution. Trigger Child Elements Element Type... -
Page 277: Layout
Element Type Description Delay Trigger delay (µs or mm). Delay.min Minimum trigger delay (µs or mm). Delay.max Maximum trigger delay (µs or mm). GateEnabled Bool Enables digital input gating. GateEnabled.used Bool True if this parameter can be configured. GateEnabled.value Bool Actual value if the parameter cannot be configured. -
Page 278: Alignment
Element Type Description Width X extent (mm). Length Y extent (mm). Height Z extent (mm). Alignment The Alignment element contains settings related to alignment and encoder calibration. Alignment Child Elements Element Type Description @used Bool Whether or not this field is used InputTriggerEnabled Bool Enables digital input-triggered alignment operation. -
Page 279: Disk
Disk Disk Child Elements Element Type Description Diameter Disk diameter (mm). Height Disk height (mm). Bar Child Elements Element Type Description Width Bar width (mm). Height Bar height (mm). HoleCount Number of holes. HoleDistance Distance between holes (mm). HoleDiameter Diameter of holes (mm). Plate Plate Child Elements Element... - Page 280 Element Type Description FrontCamera Window Front camera window (read-only). BackCamera Window Back camera window (read-only). BackCamera.used Bool Whether or not this field is used. PatternSequenceType The projector pattern sequence to display when a projector equipped device is running. The following types are possible: -1 –...
-
Page 281: Tracking
Element Type Description 0 – Maximum resolution 1 – Balanced 2 – Maximum speed 3 – Custom SpacingIntervalType.used Bool Whether or not field is used. Tracking Section Tracking below. Material Section Material on the next page. Custom Custom Used by specialized sensors. Region3D Child Elements Element Type... -
Page 282: Material
Material Material Child Elements Element Type Description Type Type of Material settings to use. 0 – Custom 1 – Diffuse Type.used Bool Determines if the setting’s value is currently used. Type.value Value in use by the sensor, useful for determining value when used is false. -
Page 283: Surfacegeneration
Element Type Description CameraGainDigital.value Value in use by the sensor, useful for determining value when used is false. CameraGainDigital.min Minimum value. CameraGainDigital.max Maximum value. DynamicSensitivity Dynamic exposure control sensitivity factor. This can be used to scale the control setpoint. DynamicSensitivity.used Bool Determines if the setting’s value is currently used. -
Page 284: Fixedlength
FixedLength FixedLength Child Elements Element Type Description StartTrigger Start trigger condition: 0 – Sequential 1 – Digital input Length Surface length (mm). Length.min Minimum surface length (mm). Length.max Maximum surface length (mm). VariableLength VariableLength Child Elements Element Type Description MaxLength Maximum surface length (mm). -
Page 285: Profilegeneration
Element Type Description CustomSpacingIntervalEnabl Bool Indicates whether a user specified custom spacing interval is to be used for the resulting section. SpacingInterval The user specified spacing interval. SpacingInterval.min The spacing interval limit minimum. SpacingInterval.max The spacing interval limit maximum. SpacingInterval.value The current spacing interval used by the system. -
Page 286: Rotational
Rotational Rotational Child Elements Element Type Description Circumference Circumference (mm). Circumference.min Minimum circumference (mm). Circumference.max Maximum circumference (mm). PartDetection PartDetection Child Elements Element Type Description Enabled Bool Enables part detection. Enabled.used Bool Whether or not this field is used. Enabled value Bool Actual value used if not configurable. -
Page 287: Edgefiltering
Element Type Description PaddingLength.used Bool Whether or not this field is used. MinLength Minimum length (mm). MinLength.min Minimum value of minimum length (mm). MinLength.max Maximum value of minimum length (mm). MinLength.used Bool Whether or not this field is used. MaxLength Maximum length (mm). -
Page 288: Edge
Element Type Description 0 – Edge points 1 – Bounding Box 2 – Ellipse Edge Edge Section below. BoundingBox BoundingBox Section below. Ellipse Section Ellipse below. Edge Edge Child Elements Element Type Description ModelName String Name of the part model to use. Does not include the .mdl extension. Acceptance/Quality/Min Minimum quality value for a match. -
Page 289: Replay
Element Type Description Acceptance/Major/Max Maximum major length (mm). Acceptance/Minor/Min Minimum minor length (mm). Acceptance/Minor/Max Maximum minor length (mm). Replay Contains settings related to recording filtering. RecordingFiltering RecordingFiltering Child Elements Element Type Description ConditionCombineType 0 – Any: If any enabled condition is satisfied, the current frame is recorded. -
Page 290: Conditions/Measurement
Conditions/Measurement Conditions/Measurement Elements Element Type Description Enabled Bool Indicates whether the condition is enabled. The ID of the measurement to filter. Result The measurement decision criteria for the selected ID to be included in the filter. Possible values are: 0 – Pass 1 –... -
Page 291: Tooloptions
ToolOptions The ToolOptions element contains a list of available tool types, their measurements, and settings for related information. ToolOptions Child Elements Element Type Description <Tool Names> Collection A collection of tool name elements. An element for each tool type is present. Tool Name Child Elements Element Type... -
Page 292: Tools
Tools The Tools element contains measurement tools. The following sections describe each tool and its available measurements. Tools Child Elements Element Type Description @options String (CSV) A list of the tools available in the currently selected scan mode. <ToolType> Section An element for each added tool. Profile Types The following types are used by various measurement tools. -
Page 293: Profileregion2D
ProfileRegion2d An element of type ProfileRegion2d defines a rectangular area of interest. ProfileRegion2d Child Elements Element Type Description Setting for profile region X position (mm). Setting for profile region Z position (mm). Setting for profile region width (mm). Width Height Setting for profile region height (mm). -
Page 294: Surfaceregion2D
SurfaceRegion2d An element of type SurfaceRegion2d defines a rectangular area of interest on the X-Y plane. SurfaceRegion2d Child Elements Element Type Description Setting for surface region X position (mm). Setting for surface region Y position (mm). Width Setting for region width (mm). Length Setting for region length (mm). -
Page 295: Profileboundingbox
Element Type Description ProfileLine Line Line definition when Baseline is set to Line. Measurements\Area Area tool Area measurement. measurement Measurements\CentroidX Area tool CentroidX measurement. measurement Measurements\CentroidZ Area tool CentroidZ measurement. measurement Area Tool Measurement Element Type Description Measurement ID. Optional (measurement disabled if not set). - Page 296 Element Type Description Anchor\X.options String (CSV) The X measurements (IDs) available for anchoring. Anchor\Z String (CSV) The Z measurements (IDs) used for anchoring. Anchor\Z.options String (CSV) The Z measurements (IDs) available for anchoring. StreamOptions Collection A collection of StreamOption on page 291 elements. Stream\Step The stream source step.
-
Page 297: Profilebridgevalue
Element Type Description SmoothingEnabled Boolean Smoothing enable state: 0 – Disable 1 – Enable SmoothingWindow Smoothing window. Scale Output scaling factor. Offset Output offset factor. DecisionMin Minimum decision threshold. DecisionMax Maximum decision threshold. ProfileBridgeValue A ProfileBridgeValue element defines settings for a profile bridge value tool and one or more of its measurements. -
Page 298: Profilecircle
Element Type Description from lowest to highest in a histogram, starting from the highest points, to exclude from the bridge value calculation. Combines with WindowSize to determine what portion of the profile points are used in the bridge value calculation. MaxInvalid The maximum percentage of invalid points. - Page 299 ProfileCircle Child Elements Element Type Description Name String Tool name. Source Profile source. Anchor\X String (CSV) The X measurements (IDs) used for anchoring. Anchor\X.options String (CSV) The X measurements (IDs) available for anchoring. Anchor\Z String (CSV) The Z measurements (IDs) used for anchoring. Anchor\Z.options String (CSV) The Z measurements (IDs) available for anchoring.
-
Page 300: Profiledimension
Element Type Description SmoothingWindow Smoothing window. Scale Output scaling factor. Offset Output offset factor. DecisionMin Minimum decision threshold. DecisionMax Maximum decision threshold. ProfileDimension A ProfileDimension element defines settings for a profile dimension tool and one or more of its measurements. ProfileDimension Child Elements Element Type... -
Page 301: Profilegroove
Dimension Tool Measurement Element Type Description Measurement ID. Optional (measurement disabled if not set). Name String Measurement name. Enabled Boolean Measurement enable state: 0 – Disable 1 – Enable HoldEnabled Boolean Output hold enable state: 0 – Disable 1 – Enable SmoothingEnabled Boolean Smoothing enable state:... - Page 302 Element Type Description 2 – Range 3 – Surface 4 – Section Stream\Id The stream source ID. Shape Shape: 0 – U-shape 1 – V-shape 2 – Open MinDepth Minimum depth. MinWidth Minimum width. MaxWidth Maximum width. RegionEnabled Bool Whether or not to use the region. If the region is disabled, all available data is used.
-
Page 303: Profileintersect
Element Type Description Scale Output scaling factor. Offset Output offset factor. DecisionMin Minimum decision threshold. DecisionMax Maximum decision threshold. SelectType Method of selecting a groove when multiple grooves are found: 0 – Max depth 1 – Ordinal, from left 2 – Ordinal, from right SelectIndex Index when SelectType is set to 1 or 2. -
Page 304: Profileline
Element Type Description ProfileLine Line Definition of line. Measurements\X Intersect tool X measurement. measurement Measurements\Z Intersect tool Z measurement. measurement Measurements\Angle Intersect tool Angle measurement. measurement Intersect Tool Measurement Element Type Description Measurement ID. Optional (measurement disabled if not set). Name String Measurement name. - Page 305 Element Type Description Anchor\X.options String (CSV) The X measurements (IDs) available for anchoring. Anchor\Z String (CSV) The Z measurements (IDs) used for anchoring. Anchor\Z.options String (CSV) The Z measurements (IDs) available for anchoring. StreamOptions Collection A collection of StreamOption on page 291 elements. Stream\Step The stream source step.
-
Page 306: Profilepanel
Element Type Description Offset Output offset factor. DecisionMin Minimum decision threshold. DecisionMax Maximum decision threshold. Error percentile. Percent (Percentile measurement only) ProfilePanel A ProfilePanel element defines settings for a profile panel tool and one or more of its measurements. ProfilePanel Child Elements Element Type Description... - Page 307 Element Type Description SurfaceWidth Surface width. SurfaceOffset Surface offset. NominalRadius Nominal radius. EdgeAngle Edge angle. RegionEnabled Bool Whether or not to use the region. If the region is disabled, all available data is used. Region ProfileRegion2d Edge region. Gap Measurement Element Type Description...
-
Page 308: Profileposition
Element Type Description 1 – Enable HoldEnabled Boolean Output hold enable state: 0 – Disable 1 – Enable SmoothingEnabled Boolean Smoothing enable state: 0 – Disable 1 – Enable SmoothingWindow Smoothing window. Scale Output scaling factor. Offset Output offset factor. DecisionMin Minimum decision threshold. -
Page 309: Profileroundcorner
Position Tool Measurement Element Type Description id (attribute) Measurement ID. Optional (measurement disabled if not set). Name String Measurement name. Enabled Boolean Measurement enable state: 0 – Disable 1 – Enable HoldEnabled Boolean Output hold enable state: 0 – Disable 1 –... - Page 310 Element Type Description 0 – Left 1 – Right Edge ProfilePanelEdge Element for edge configuration Measurements\X Round Corner tool X measurement. measurement Measurements\Z Round Corner tool Z measurement. measurement Measurements\Angle Round Corner tool Angle measurement. measurement ProfilePanelEdge Element Type Description EdgeType Edge type: 0 –...
-
Page 311: Profilestrip
Element Type Description SmoothingWindow Smoothing window. Scale Output scaling factor. Offset Output offset factor. DecisionMin Minimum decision threshold. DecisionMax Maximum decision threshold. ProfileStrip A ProfileStrip element defines settings for a profile strip tool and one or more of its measurements. The profile strip tool is dynamic, meaning that it can contain multiple measurements of the same type in the Measurements element. - Page 312 Element Type Description 8 – Void TiltEnabled Boolean Setting for tilt compensation: 0 – Disabled 1 – Enabled SupportWidth Support width of edge (mm). TransitionWidth Transition width of edge (mm). MinWidth Minimum strip width (mm). MinHeight Minimum strip height (mm). MaxVoidWidth Void max (mm).
-
Page 313: Script
Element Type Description SelectType Method of selecting a groove when multiple grooves are found: 0 – Best 1 – Ordinal, from left 2 – Ordinal, from right SelectIndex Index when SelectType is set to 1 or 2. Location Setting for groove location to return from: (X, Z, and Height measurements 0 –... - Page 314 Element Type Description StreamOptions Collection StreamOption A collection of on page 291 elements. Stream\Step The stream source step. Possible values are: 1 – Video 2 – Range 3 – Surface 4 – Section Stream\Id The stream source ID. ZRotationEnabled Boolean Setting to enable/disable rotation of bounding box AsymmetryDetectionType Determine whether to use asymmetry detection and if...
-
Page 315: Surfacecshole
Element Type Description set). Name String Measurement name. Enabled Boolean Measurement enable state: 0 – Disable 1 – Enable HoldEnabled Boolean Output hold enable state: 0 – Disable 1 – Enable SmoothingEnabled Boolean Smoothing enable state: 0 – Disable 1 – Enable SmoothingWindow Smoothing window. - Page 316 Element Type Description NominalBevelAngle Nominal bevel angle (mm). NominalOuterRadius Nominal outer radius (mm). NominalInnerRadius Nominal inner radius (mm). BevelRadiusOffset Bevel radus offset (mm). Shape The shape of the countersunk hole: 0 – Cone 1 – Counterbore PartialDetectionEnabled Boolean Setting to enable/disable partial detection: 0 –...
-
Page 317: Surfacedimension
Element Type Description measurement Measurements\Depth Countersunk Hole tool Depth measurement. measurement Measurements\BevelRadius Countersunk Hole tool Bevel Radius measurement. measurement Measurements\BevelAngle Countersunk Hole tool Bevel Angle measurement. measurement Measurements\XAngle Countersunk Hole tool X Angle measurement. measurement Measurements\YAngle Countersunk Hole tool Y Angle measurement. measurement Measurements\CounterboreDe Countersunk Hole tool... - Page 318 SurfaceDimension Child Elements Element Type Description Name String Tool name. Source Surface source. Anchor\X String (CSV) The X measurements (IDs) used for anchoring. Anchor\X.options String (CSV) The X measurements (IDs) available for anchoring. Anchor\Y String (CSV) The Y measurements (IDs) used for anchoring. Anchor\Y.options String (CSV) The Y measurements (IDs) available for anchoring.
-
Page 319: Surfaceellipse
Element Type Description 1 – Enable HoldEnabled Boolean Output hold enable state: 0 – Disable 1 – Enable SmoothingEnabled Boolean Smoothing enable state: 0 – Disable 1 – Enable SmoothingWindow Smoothing window. Scale Output scaling factor. Offset Output offset factor. DecisionMin Minimum decision threshold. - Page 320 Element Type Description Region3D Region Measurement region. AsymmetryDetectionType Determine whether to use asymmetry detection and if enabled, which dimension would be the basis of detection. The possible values are: 0 – None 1 – Major 2 – Minor Measurements\Major Ellipse tool Major measurement.
-
Page 321: Surfacehole
SurfaceHole A SurfaceHole element defines settings for a surface hole tool and one or more of its measurements. SurfaceHole Child Elements Element Type Description Name String Tool name. Source Surface source. Anchor\X String (CSV) The X measurements (IDs) used for anchoring. Anchor\X.options String (CSV) The X measurements (IDs) available for anchoring. -
Page 322: Surfaceopening
Element Type Description RefRegions (Collection) Reference regions. Contains two RefRegion elements of type SurfaceRegion2D AutoTiltEnabled Boolean Setting to enable/disable tilt correction: 0 – Disable 1 – Enable TiltXAngle Setting for manual tilt correction angle X. TiltYAngle Setting for manual tilt correction angle Y. Measurements\X Hole tool X measurement... - Page 323 SurfaceOpening Child Elements Element Type Description Name String Tool name. Source Surface source. Anchor\X String (CSV) The X measurements (IDs) used for anchoring. Anchor\X.options String (CSV) The X measurements (IDs) available for anchoring. Anchor\Y String (CSV) The Y measurements (IDs) used for anchoring. Anchor\Y.options String (CSV) The Y measurements (IDs) available for anchoring.
- Page 324 Element Type Description 1 – Enable Region3D Region Measurement region. RefRegionsEnabled Boolean Setting to enable/disable reference regions: 0 – Disable 1 – Enable RefRegionCount Count of the reference regions that are to be used. RefRegions (Collection) Reference regions. Contains two RefRegion elements of type SurfaceRegion2D AutoTiltEnabled Boolean...
-
Page 325: Surfaceplane
Element Type Description 1 – Enable SmoothingWindow Smoothing window. Scale Output scaling factor. Offset Output offset factor. DecisionMin Minimum decision threshold. DecisionMax Maximum decision threshold. SurfacePlane A SurfacePlane element defines settings for a surface plane tool and one or more of its measurements. SurfacePlane Child Elements Element Type... -
Page 326: Surfaceposition
Element Type Description Measurements\StdDev Plane tool Standard deviation measurement measurement Measurements\MinError Plane tool Minimum error measurement measurement Measurements\MaxError Plane tool Maximum error measurement measurement Plane Tool Measurement Element Type Description id (attribute) Measurement ID. Optional (measurement disabled if not set). Name String Measurement name. -
Page 327: Surfacestud
Element Type Description Anchor\Z String (CSV) The Z measurements (IDs) used for anchoring. Anchor\Z.options String (CSV) The Z measurements (IDs) available for anchoring. StreamOptions Collection StreamOption A collection of on page 291 elements. Stream\Step The stream source step. Possible values are: 1 –... - Page 328 SurfaceStud Child Elements Element Type Description Name String Tool name. Source Surface source. Anchor\X String (CSV) The X measurements (IDs) used for anchoring. Anchor\X.options String (CSV) The X measurements (IDs) available for anchoring. Anchor\Y String (CSV) The Y measurements (IDs) used for anchoring. Anchor\Y.options String (CSV) The Y measurements (IDs) available for anchoring.
-
Page 329: Surfacevolume
Element Type Description Measurements\BaseZ Stud tool BaseZ measurement. measurement Measurements\TipX Stud tool TipX measurement. measurement Measurements\TipY Stud tool TipY measurement. measurement Measurements\TipZ Stud tool TipZ measurement. measurement Measurements\Radius Stud tool Radius measurement. measurement Stud Tool Measurement Element Type Description id (attribute) Measurement ID. - Page 330 Element Type Description Source Surface source. Anchor\X String (CSV) The X measurements (IDs) used for anchoring. Anchor\X.options String (CSV) The X measurements (IDs) available for anchoring. Anchor\Y String (CSV) The Y measurements (IDs) used for anchoring. Anchor\Y.options String (CSV) The Y measurements (IDs) available for anchoring. Anchor\Z String (CSV) The Z measurements (IDs) used for anchoring.
-
Page 331: Output
Element Type Description Scale Output scaling factor. Offset Output offset factor. DecisionMin Minimum decision threshold. DecisionMax Maximum decision threshold. Location Measurement type: (Thickness measurement only) 0 – Maximum 1 – Minimum 2 – 2D Centroid 3 – 3D Centroid 4 – Average 5 –... - Page 332 <Ranges options=""/> <Profiles options="0,1">0</Profiles> <Surfaces options=""/> Ethernet Child Elements Element Type Description Protocol Ethernet protocol: 0 – Gocator 1 – Modbus 2 – EtherNet/IP 3 – ASCII TimeoutEnabled Boolean Enable or disable auto-disconnection timeout. Applies only to the Gocator protocol. Timeout Disconnection timeout (seconds).
-
Page 333: Ascii
Element Type Description 1 – Bottom 2 – Top left 3 – Top right Surfaces.options 32s (CSV) List of available surface sources (see above). RangeIntensities 32s (CSV) Selected range intensity sources. 0 – Top 1 – Bottom 2 – Top left 3 –... -
Page 334: Eip
Element Type Description HealthPort Health service port number. DataPort Data service port number. Delimiter String Field delimiter. Terminator String Line terminator. InvalidValue String String for invalid output. CustomDataFormat String Custom data format. CustomFormatEnabled Bool Enables custom data format. StandardFormatMode The formatting mode used if not a custom format: 0 –... -
Page 335: Analog
Element Type Description 3 – Alignment state 4 – Acquisition start 5 – Acquisition end SignalType Signal type: 0 – Pulse 1 – Continuous ScheduleEnabled Bool Enables scheduling. PulseWidth Pulse width (µs). PulseWidth.min Minimum pulse width (µs). PulseWidth.max Maximum pulse width (µs). PassMode Measurement pass condition: 0 –... -
Page 336: Serial
Element Type Description CurrentMin.max Maximum value of minimum current (mA). CurrentMax Maximum current (mA). CurrentMax.min Minimum value of maximum current (mA). CurrentMax.max Maximum value of maximum current (mA). CurrentInvalidEnabled Bool Enables special current value for invalid measurement value. CurrentInvalid Current value for invalid measurement value (mA). CurrentInvalid.min Minimum value for invalid current (mA). -
Page 337: Ascii
Element Type Description Rate.options 32u (CSV) List of available rates. Format Output format: 0 – 12-bit 1 – 12-bit with search 2 – 14-bit 3 – 14-bit with search Format.options 32s (CSV) List of available formats. DataScaleMin Measurement value corresponding to minimum word value. DataScaleMax Measurement value corresponding to maximum word value. -
Page 338: Device
<?xml version="1.0" encoding="UTF-8"?> <Transform version="100"> <EncoderResolution>1</EncoderResolution> <Speed>100</Speed> <Devices> <Device role="0"> <X>-2.3650924829</X> <Y>0.0</Y> <Z>123.4966803469</Z> <XAngle>5.7478302588</XAngle> <YAngle>3.7078302555</XAngle> <ZAngle>2.7078302556</XAngle> </Device> <Device id="1"> <X>0</X> <Y>0.0</Y> <Z>123.4966803469</Z> <XAngle>5.7478302588</XAngle> <YAngle>3.7078302555</XAngle> <ZAngle>2.7078302556</XAngle> </Device> </Devices> </Transform> The Transform element contains the alignment record for both the Main and the Buddy sensor. Transform Child Elements Element Type... -
Page 339: Part Models
Element Type Description Translation on the X axis (mm). Translation on the Y axis (mm). Translation on the Z axis (mm). XAngle Rotation around the X axis (degrees). YAngle Rotation around the Y axis (degrees). ZAngle Rotation around the Z axis (degrees). The rotation (counter-clockwise in the X-Z plane) is performed before the translation. -
Page 340: Edge Points
Edge Points Edge Points Data Field Type Offset Description Sender ID -1 – Part matching source Source 0 – Model 1 – Target imageType Image type 0 – Height map 1 – Intensity map imageSource Image source 0 – Top 1 –... - Page 341 Element Type Description 1 – Intensity map ImageType.options 32s (CSV) List of available image types. Gocator Device Files • Job Files • 341 Gocator Line Profile Sensors - User Manual...
-
Page 342: Protocols
Protocols Gocator supports protocols for communicating with sensors over Ethernet (TCP/IP) and serial output. For a protocol to output data, it must be enabled and configured in the active job. Protocols Available over Ethernet Gocator Modbus EtherNet/IP ASCII Protocols Available over Serial ASCII Selcom Gocator Protocol... -
Page 343: Data Types
For information on configuring the protocol using the Web interface, see Ethernet Output on page 236. For information on job file structures (for example, if you wish to create job files programmatically), see Job Files on page 270. Data Types The table below defines the data types and associated type identifiers used in this section. -
Page 344: Discovery Commands
Status Codes Label Value Description Command succeeded. Failed Command failed. Invalid State -1000 Command is not valid in the current state. Item Not Found -999 A required item (e.g., file) was not found. Invalid Command -998 Command is not recognized. Invalid Parameter -997 One or more command parameters are incorrect. -
Page 345: Set Address
Field Type Offset Description signature Message signature (0x0000504455494D4C) deviceId Serial number of the device whose address information is queried. 0 selects all devices. Reply Field Type Offset Description length Reply length. type Reply type (0x1001). status Operation status. signature Message signature (0x0000504455494D4C) deviceId Serial number. -
Page 346: Get Info
Field Type Offset Description gateway[4] byte The gateway address in left to right order. reserved[4] byte Reserved. reserved[4] byte Reserved. Reply Field Type Offset Description length Reply length. type Reply type (0x1002). Commands status Operation status. For a list of status codes, see page 343. -
Page 347: Control Commands
Field Type Offset Description addressVersion byte IP address version (always 4). address[4] byte IP address. reserved[12] byte Reserved. prefixLength Subnet prefix length (in number of bits). gatewayVersion byte Gateway address version (always 4). gatewayAddress[4] byte Gateway address. reserved[12] byte Reserved. controlPort Control channel port. -
Page 348: Protocol Version
Progressive Reply Some commands send replies progressively, as multiple messages. This allows the sensor to stream data without buffering it first, and allows the client to obtain progress information on the stream. A progressive reply begins with an initial, standard reply message. If the status field of the reply indicates success, the reply is followed by a series of “continue”... -
Page 349: Set Address
Field Type Offset Description address[4] byte IP address (most significant byte first). subnetMask[4] byte Subnet mask. gateway[4] byte Gateway address. Set Address The Set Address command modifies the network configuration of a Gocator sensor. On receiving the command, the Gocator will perform a reset. You should wait 30 seconds before re-connecting to the Gocator. -
Page 350: Get States
Reply Field Type Offset Description length Reply size including this field, in bytes. Reply identifier (0x4002). status Reply status. For a list of status codes, see Commands on page 343. Sensor localInfo Info for this device. Info remoteCount Number of discovered sensors. remoteInfo Sensor List of info for discovered sensors. -
Page 351: Log In/Out
Field Type Offset Description Reply identifier (0x4525). status Commands Reply status. For a list of status codes, see on page 343. count Number of state variables. sensorState Sensor state -1 – Conflict 0 – Ready 1 – Running For more information on states, see Control Commands on page 347. -
Page 352: Change Password
Command Field Type Offset Description length Command size including this field, in bytes. Command identifier (0x4003). userType Defines the user type 0 – None (log out) 1 – Administrator 2 – Technician Password (required for log-in only). password[64] char Reply Field Type Offset... -
Page 353: List Files
Command Field Type Offset Description length Command size including this field, in bytes. Command identifier (0x4005). buddyId Id of the sensor to acquire as buddy. Set to 0 to remove buddy. Reply Field Type Offset Description length Reply size including this field, in bytes. Reply identifier (0x4005). -
Page 354: Read File
Field Type Offset Description Command identifier (0x101B). source[64] char Source file name. destination[64] char Destination file name. Reply Field Type Offset Description length Reply size including this field, in bytes. Reply identifier (0x101B). Commands status Reply status. For a list of status codes, see on page 343. -
Page 355: Delete File
Command Field Type Offset Description length Command size including this field, in bytes. Command identifier (0x1006). name[64] char Source file name. length File length. data[length] byte File contents. Reply Field Type Offset Description length Reply size including this field, in bytes. Reply identifier (0x1006). -
Page 356: User Storage Free
Reply Field Type Offset Description length Reply size including this field, in bytes. Reply identifier (0x1021). status Reply status. spaceUsed The used storage space in bytes. User Storage Free The User Storage Free command returns the amount of user storage that is free. Command Field Type... -
Page 357: Get Loaded Job
Command Field Type Offset Description length Command size including this field, in bytes. Command identifier (0x4101). fileName[64] char File name (null-terminated) of the job the sensor loads when it powers up. Reply Field Type Offset Description length Reply size including this field, in bytes. Reply identifier (0x4101). -
Page 358: Set Alignment Reference
Reply Field Type Offset Description length Reply size including this field, in bytes. Reply identifier (0x4104). status Reply status. For a list of status codes, see Commands on page 343. reference Alignment reference 0 – Fixed 1 – Dynamic Set Alignment Reference The Set Alignment Reference command is used to set the sensor's alignment reference. -
Page 359: Get Timestamp
Get Timestamp The Get Timestamp command retrieves the sensor's timestamp, in clock ticks. All devices in a system are synchronized with the system clock; this value can be used for diagnostic purposes, or used to synchronize the start time of the system. Command Field Type... -
Page 360: Start
Reply Field Type Offset Description length Reply size including this field, in bytes. Reply identifier (0x101E). status Reply status. For a list of status codes, see Commands on page 343. Start The Start command starts the sensor system (system enters the Running state). For more information on states, see Control Commands on page 347. -
Page 361: Stop
Stop The Stop command stops the sensor system (system enters the Ready state). For more information on states, see Control Commands on page 347. Command Field Type Type Description length Command size including this field, in bytes. Command identifier (0x1001). Reply Field Type... -
Page 362: Start Alignment
Reply Field Type Offset Description length Reply size including this field, in bytes. Reply identifier (0x452B). status Reply status. For a list of status codes, see Commands on page 343. Start Alignment The Start Alignment command is used to start the alignment procedure on a sensor. Command Field Type... -
Page 363: Software Trigger
Field Type Offset Description 343. opId Operation ID. Use this ID to correlate the command/reply on the Exposure Calibration Result Command channel with the correct message on the Data channel. A unique ID is returned each time the client uses this command. Software Trigger The Software Trigger command causes the sensor to take a snapshot while in software mode and in the Running state. -
Page 364: Schedule Analog Output
Reply Field Type Offset Description length Reply size including this field, in bytes. Reply identifier (0x4518). status Reply status. For a list of status codes, see Commands on page 343. Schedule Analog Output The Schedule Analog Output command schedules an analog output event. The analog output must be configured to accept software-scheduled commands and be in the Running state. -
Page 365: Reset
Reply Field Type Offset Description length Reply size including this field, in bytes. Reply identifier (0x100E). status Reply status. For a list of status codes, see Commands on page 343. If a non-zero value is specified for timeout, the client must send another ping command before the timeout elapses;... -
Page 366: Restore
Restore The Restore command uploads a backup file to the connected sensor and then restores all sensor files from the backup. The sensor must be reset or power-cycled before the restore operation can be completed. Command Field Type Offset Description length Command size including this field, in bytes. -
Page 367: Get Recording Enabled
Get Recording Enabled The Get Recording Enabled command retrieves whether recording is enabled. Command Field Type Offset Description length Command size including this field, in bytes. Command identifier (0x4517). Reply Field Type Offset Description length Reply size including this field, in bytes. Reply identifier (0x4517). -
Page 368: Get Playback Source
Reply Field Type Offset Description length Reply size including this field, in bytes. Reply identifier (0x4513). status Reply status. For a list of status codes, see Commands on page 343. Get Playback Source The Get Playback Source command gets the data source for data playback. Command Field Type... -
Page 369: Simulate
Simulate The Simulate command simulates the last frame if playback source is live, or the current frame if playback source is the replay buffer. Command Field Type Offset Description length Command size including this field, in bytes. Command identifier (0x4522). Reply Field Type... -
Page 370: Playback Position
Command Field Type Offset Description length Command size including this field, in bytes. Command identifier (0x4501). direction Define step direction 0 – Forward 1 – Reverse Reply Field Type Offset Description length Reply size including this field, in bytes. Reply identifier (0x4501). status Commands Reply status. -
Page 371: Read Live Log
Reply Field Type Offset Description length Reply size including this field, in bytes. Reply identifier (0x4526). status Reply status. For a list of status codes, see Commands on page 343. Read Live Log The Read Live Log command returns an XML file containing the log messages between the passed start and end indexes. -
Page 372: Acquire
Command Field Type Offset Description length Command size including this field, in bytes. Command identifier (0x452A). Reply Field Type Offset Description length Reply size including this field, in bytes. Reply identifier (0x452A). status Commands Reply status. For a list of status codes, see on page 343. -
Page 373: Create Model
The command returns after the scan has been captured and transmitted. Create Model The Create Model command creates a new part model from the active simulation scan. Command Field Type Offset Description length Command size including this field, in bytes. Command identifier (0x4602). -
Page 374: Add Measurement
Reply Field Type Offset Description length Reply size including this field, in bytes. Reply identifier (0x4530). status Reply status. For a list of status codes, see Commands on page 343. Add Measurement The Add Measurement command adds a measurement to a tool instance. Command Field Type... -
Page 375: Export Csv (Progressive)
Initial Reply Field Type Offset Description length Reply size including this field, in bytes. Reply identifier (0x4529). status Reply status. For a list of status codes, see Commands on page 343. progressTotal Progress indicating completion (100%). progress Current progress. Continue Reply Field Type Offset... -
Page 376: Export Bitmap (Progressive)
Continue Reply Field Type Offset Description length Reply size including this field, in bytes. Reply identifier (0x5000). status Reply status. For a list of status codes, see Commands on page 343. progressTotal Progress indicating completion (100%). progress Current progress. size Size of the chunk in byes. -
Page 377: Get Runtime Variable Count
Field Type Offset Description Reply identifier (0x5000). status Commands Reply status. For a list of status codes, see on page 343. progressTotal Progress indicating completion (100%). progress Current progress. size Size of the chunk in byes. data[size] byte Chunk data. Get Runtime Variable Count The Get Runtime Variable Count command gets the number of runtime variables that can be accessed. -
Page 378: Get Runtime Variables
Get Runtime Variables The Get Runtime Variables command gets the runtime variables for the given index and length. Command Field Type Offset Description length Command size including this field, in bytes. Command identifier (0x4535). index The starting index of the variables to retrieve. length The number of values to retrieve from the starting index. -
Page 379: Start Upgrade Extended
Reply Field Type Offset Description length Reply size including this field, in bytes. Reply identifier (0x0000). status Reply status. For a list of status codes, see Commands on page 343. Start Upgrade Extended The Start Upgrade Extended command begins a firmware upgrade for the sensors in a system. All sensors automatically reset 3 seconds after the upgrade process is complete. -
Page 380: Get Upgrade Log
Field Type Offset Description 0 – Completed 1 – Running 2 – Completed, but should run again Upgrade progress (valid when in the Running state) progress Get Upgrade Log The Get Upgrade Log command can retrieve an upgrade log in the event of upgrade problems. Command Field Type... -
Page 381: Stamp
GDP messages are always sent in groups. The Last Message flag in the control field is used to indicate the final message in a group. If there is only one message per group, this bit will be set in each message. Stamp Field Type... -
Page 382: Profile
Field Type Offset Description width (W) Image width, in pixels. pixelSize Pixel size, in bytes. pixelFormat Pixel format: 1 – 8-bit greyscale 2 – 8-bit color filter 3 – 8-bits-per-channel color (B, G, R, X) colorFilter Color filter array alignment: 0 –... -
Page 383: Resampled Profile
Field Type Offset Description xOffset X offset (µm). zOffset Z offset (µm). source Source 0 – Top 1 – Bottom 2 – Top Left 3 – Top Right exposure Exposure (ns). Camera index. cameraIndex reserved[2] Reserved. ranges[C][W] Point16s Profile ranges. Resampled Profile Field Type... -
Page 384: Profile Intensity
Profile Intensity Field Type Offset Description size Count of bytes in message (including this field). control Bit 15: Last message flag. Bits 0-14: Message type identifier. For this message, set to 7. attributesSize Size of attributes, in bytes (min: 24, current: 24). count (C) Number of profile intensity arrays. -
Page 385: Surface Intensity
Field Type Offset Description 2 – Top Left 3 – Top Right exposure Exposure (ns). rotation Rotation (microdegrees). reserved[3] Reserved. ranges[L][W] Surface ranges. Surface Intensity Field Type Offset Description size Count of bytes in message (including this field). control Bit 15: Last message flag. Bits 0-14: Message type identifier. -
Page 386: Surface Section Intensity
Field Type Offset Description width (W) Number of points per profile array. xScale X scale (nm). zScale Z scale (nm). xOffset X offset (µm). zOffset Z offset (µm). source Source 0 – Top 1 – Bottom 2 – Top Left 3 –... -
Page 387: Measurement
Field Type Offset Description poseAngle Z angle of the pose (microdegrees). poseX X offset of the pose (µm). poseY Y offset of the pose (µm). points[C][W] Intensity arrays. Measurement Field Type Offset Description size Count of bytes in message (including this field). control Bit 15: Last message flag. -
Page 388: Exposure Calibration Result
Field Type Offset Description 0 – General failure -1 – No data in the field of view for stationary alignment -2 – No profiles with sufficient data for line fitting for travel alignment -3 – Invalid target detected. Examples include: - Calibration disk diameter too small. -
Page 389: Bounding Box Match Result
Bounding Box Match Result Field Type Offset Description size Count of bytes in message (including this field). control Bit 15: Last message flag. Bits 0-14: Message type identifier. For this message, set to 17. decision byte Overall match decision. xOffset Target x offset in model space (µm). - Page 390 Gocator Data Protocol Field Type Offset Description size Count of bytes in message (including this field). control Bit 15: Last Message flag Bits 0-14: Message type identifier. (See individual data result sections.) GDP messages are always sent in groups. The Last Message flag in the control field is used to indicate the final message in a group.
- Page 391 Indicator Instance Value Encoder Frequency 1005 Current system encoder frequency (ticks/s). App Version 2000 Firmware application version. Uptime 2017 Time elapsed since node boot-up or reset (seconds). Laser safety status 1010 0 if laser is disabled; 1 if enabled. Internal Temperature 2002 Internal temperature (centidegrees Celsius).
- Page 392 Indicator Instance Value Sensor State* 20000 Gocator sensor state. -1 – Conflict 0 – Ready 1 – Running Current Sensor Speed* 20001 Current sensor speed. (Hz) Maximum Speed* 20002 The sensor’s maximum speed. Spot Count* 20003 Number of found spots in the last profile. Max Spot Count* 20004 Maximum number of spots that can be found.
- Page 393 Indicator Instance Value Ethernet Drops 21005 Number of dropped Ethernet packets. Digital Output Pass 21006 Output Index Number of pass digital output pulse. Digital Output Fail 21007 Output Index Number of fail digital output pulse. Trigger Drops** 21010 Number of dropped triggers. The sum of various triggering-related drop indicators.
- Page 394 ** When the sensor is accelerated, the indicator's value is the sum of the values reported from the sensor and the accelerating PC. Protocols • Gocator Protocol • 394 Gocator Line Profile Sensors - User Manual...
-
Page 395: Modbus Protocol
Modbus Protocol Modbus is designed to allow industrial equipment such as Programmable Logic Controllers (PLCs), sensors, and physical input/output devices to communicate over an Ethernet network. Modbus embeds a Modbus frame into a TCP frame in a simple manner. This is a connection-oriented transaction, and every query expects a response. -
Page 396: Registers
Modbus Application Protocol Header Field Length (Bytes) Description Transaction ID Used for transaction pairing. The Modbus Client sets the value and the Server (Gocator) copies the value into its responses. Protocol ID Always set to 0. Length Byte count of the rest of the message, including the Unit identifier and data fields. -
Page 397: Control Registers
The output registers report the sensor states, stamps, and measurement values and decisions. You can read multiple output registers using a single Read Holding Registers or a single Read Input Registers command. Likewise, you can control the state of the sensor using a single Write Multiple Register command. -
Page 398: Output Registers
Value Name Description until the alignment process is complete. Align (moving target) Start alignment process and also calibrate encoder resolution. State register 301 will be set to 1 (busy) until the motion calibration process is complete. Clear Alignment Clear the alignment. Load Job Activate a job file. -
Page 399: Stamp
Stamp Stamps contain trigger timing information used for synchronizing a PLC's actions. A PLC can also use this information to match up data from multiple Gocator sensors. In Profile mode, the stamps are updated after each profile is processed. In Surface mode, the stamps are updated after each surface has been processed. -
Page 400: Master
Register Name Type Description Address Frame Index Fame Index Low Measurement Registers Measurement results are reported in pairs of values and decisions. Measurement values are 32 bits wide and decisions are 8 bits wide. The measurement ID defines the register address of each pair. The register address of the first word can be calculated as (1000 + 3 * ID). -
Page 401: Ethernet/Ip Protocol
EtherNet/IP Protocol EtherNet/IP is an industrial protocol that allows bidirectional data transfer with PLCs. It encapsulates the object-oriented Common Industrial Protocol (CIP). This section describes the EtherNet/IP messages and data formats. EtherNet/IP communication enables the client to: Switch jobs. Align and run sensors. Receive sensor states, stamps, and measurement results. -
Page 402: Basic Object
Basic Object Identity Object (Class 0x01) Attribute Name Type Value Description Access Vendor ID UINT 1256 ODVA-provided vendor ID Device Type UINT Device type Product Code UINT 2000 Product code Revision USINT Byte 0 - Major revision USINT Byte 1 - Minor revision Serial number UDINT 32-bit value Sensor serial number... -
Page 403: Assembly Object (Class 0X04)
Attribute Name Type Value Description Access Interface UDINT 1000 Ethernet interface data rate (mbps) Speed Interface Flags UDINT See 5.4.3.2.1 of CIP Specification Volume 2: Bit 0: Link Status 0 – Inactive 1 - Active Bit 1: Duplex 0 – Half Duplex 1 –... -
Page 404: Runtime Variable Configuration Assembly
Value Name Description Start Running Start the sensor. No action if the sensor is already started. Stationary Alignment Start the stationary alignment process. Byte 1 of the sensor state assembly will be set to 1 (busy) until the alignment process is complete, then back to zero. -
Page 405: Sensor State Assembly
Sensor State Assembly The sensor state assembly object contains the sensor's states, such as the current sensor temperature, frame count, and encoder values. Sensor State Assembly Information Value Class 0x04 Instance 0x320 Attribute Number Length 100 bytes Supported Service 0x0E (GetAttributeSingle) Attributes 1 and 2 are not implemented, as they are not required for the static assembly object. -
Page 406: Sample State Assembly
Byte Name Type Description Variable 0 … … 96-99 Runtime Runtime variable value at index 3 Variable 3 Sample State Assembly The sample state object contains measurements and their associated stamp information. Sample State Assembly Information Value Class 0x04 Instance 0x321 Attribute Number Length... -
Page 407: Implicit Messaging Command Assembly
Byte Name Type Description Bit 0: 1 - Pass 0 - Fail Bits 1-7: 0 - Measurement value OK 1 - Invalid value 2 - Invalid anchor Measurement value in µm (0x80000000 if 375-378 Measurement 59 invalid). Decision 59 Measurement decision. A bit mask, where: Bit 0: 1 - Pass 0 - Fail... -
Page 408: Implicit Messaging Output Assembly
Implicit Messaging Command Assembly Information Byte Name Type Description Command A bit mask where setting the following bits will only perform the action with highest priority*: 8 – Set Runtime Variables 7 – Stop sensor 6 – Start sensor 5 – Perform Stationary Alignment 4 –... - Page 409 Byte Name Type Description 0 – No state issue 1 – Conflict Alignment and A bit mask where: Command state Bit 0: 1 – Explicit or Implicit Command in progress 0 – No Explicit or Implicit command is in progress Bit 1 1 –...
-
Page 410: Ascii Protocol
Byte Name Type Description 120-123 Measurement 0 Measurement value in µm. (0x80000000 if invalid) … … 372-375 Measurement 63 Measurement value in µm. (0x80000000 if invalid) ASCII Protocol This section describes the ASCII protocol. The ASCII protocol is available over either serial output or Ethernet output. Over serial output, communication is asynchronous (measurement results are automatically sent on the Data channel when the sensor is in the running state and results become available). -
Page 411: Serial Communication
Channels can share the same port or operate on individual ports. The following port numbers are reserved for Gocator internal use: 2016, 2017, 2018, and 2019. Each port can accept multiple connections, up to a total of 16 connections for all ports. Serial Communication Over serial, Gocator ASCII communication uses the following connection settings: Serial Connection Settings for... -
Page 412: Command And Reply Format
Command and Reply Format Commands are sent from the client to the Gocator. Command strings are not case sensitive. The command format is: <COMMAND><DELIMITER><PARAMETER><TERMINATION> If a command has more than one parameter, each parameter is separated by the delimiter. Similarly, the reply has the following format: <STATUS><DELIMITER><OPTIONAL RESULTS><DELIMITER>... -
Page 413: Stop
Formats Message Format Command Start,start target The start target (optional) is the time or encoder position at which the sensor will be started. The time and encoder target value should be set by adding a delay to the time or encoder position returned by the Stamp command. The delay should be set such that it covers the command response time of the Start command. -
Page 414: Loadjob
Examples: Command: Trigger Reply: OK Command: Trigger,1000000 Reply: OK LoadJob The Load Job command switches the active sensor configuration. Formats Message Format Command LoadJob,job file name If the job file name is not specified, the command returns the current job name. An error message is generated if no job is loaded. ".job" is appended if the filename does not have an extension. -
Page 415: Stationary Alignment
Stationary Alignment The Stationary Alignment command performs an alignment based on the settings in the sensor's live job file. A reply to the command is sent when the alignment has completed or failed. The command is timed out if there has been no progress after one minute. Formats Message Format... -
Page 416: Data Commands
Reply: OK Data Commands Optional parameters are shown in italic. The placeholder for data is surrounded by brackets (<>). In the examples, the delimiter is set to ','. Result The Result command retrieves measurement values and decisions. Formats Message Format Command Result,measurement ID,measurement ID... -
Page 417: Decision
Message Format OK, <custom data string> ERROR, <Error Message> If arguments are specified, OK, <data string in standard format, except that the decisions are not sent> ERROR, <Error Message> Examples: Standard data string for measurements ID 0 and 1: Value,0,1 OK,M00,00,V151290,M01,01,V18520 Standard formatted measurement data with a non-existent measurement of ID 2: Value,2... -
Page 418: Health Commands
Decision,2 ERROR,Specified measurement ID not found. Please verify your input Custom formatted data string (%time, %decision[0]): Decision OK,1420266101, 0 Health Commands Optional parameters are shown in italic. The placeholder for data is surrounded by brackets (<>). In the examples, the delimiter is set to ','. Health The Health command retrieves health indicators. -
Page 419: Custom Result Format
Field Shorthand Length Description measurement. The measurement type is the same as defined elsewhere (see on page 380). Decimal value that represents the unique identifier of the measurement. ValueStart Start of measurement value. Value Measurement value, in decimal. The unit of the value is measurement-specific. - Page 420 Format Value Explanation Bits 1-7: 0 – Measurement value OK 1 – Invalid value 2 - Invalid anchor Protocols • ASCII Protocol • 420 Gocator Line Profile Sensors - User Manual...
-
Page 421: Selcom Protocol
Selcom Protocol This section describes the Selcom serial protocol settings and message formats supported by Gocator sensors. To use the Selcom protocol, it must be enabled and configured in the active job. For information on configuring the protocol using the Web interface, see Serial Output on page 244. Units for data scales use the standard units (mm, mm , mm , and degrees). - Page 422 12-bit data format (SLS mode; "SLS" in Gocator web interface) 12-bit data format with Search/Track bit 14-bit data format 14-bit data format with Search/Track bit Protocols • Selcom Protocol • 422 Gocator Line Profile Sensors - User Manual...
-
Page 423: Development Kits
Development Kits Gocator includes two development kits: Software Development Kit (SDK) Gocator Development Kit (GDK) Development Kits • • 423 Gocator Line Profile Sensors - User Manual... -
Page 424: Software Development Kit
Software Development Kit The Gocator Software Development Kit (SDK) includes open-source software libraries and documentation that can be used to programmatically access and control Gocator sensors. The latest version of the SDK can be downloaded by going to http://lmi3d.com/support/downloads/, selecting a Gocator series, and clicking on the Product User Area link. -
Page 425: Sample Project Environment Variable
To run the SDK samples, make sure GoSdk.dll and kApi.dll (or GoSdkd.dll and kApid.dll in debug configuration) are copied to the executable directory. All sample code, including C examples, is now located in the Tools package, which can be downloaded by going to http://lmi3d.com/support/downloads/. -
Page 426: Gosensor
All objects that are explicitly created by the user or passed via callbacks should be destroyed by using the GoDestroy function. GoSensor GoSensor represents a physical sensor. If the physical sensor is the Main sensor in a dual-sensor setup, it can be used to configure settings that are common to both sensors. -
Page 427: Output Types
Type Description k16s 16-bit signed integer k32u 32-bit unsigned integer k32s 32-bit signed integer k64s 64-bit signed integer k64u 64-bit unsigned integer k64f 64-bit floating number kBool Boolean, value can be kTRUE or kFALSE kStatus Status, value can be kOK or kERROR kIpAddress IP address Output Types... -
Page 428: Godataset Type
GoDataSet Type Data are passed to the data handler in a GoDataSet object. The GoDataSet object is a container that can contain any type of data, including scan data (profiles, sections, or surfaces), measurements, and results from various operations. Data inside the GoDataSet object are represented as messages. The following illustrates the content of a GoDataSet object of a profile mode setup with two measurements. -
Page 429: Operation Workflow
Operation Workflow Applications created using the SDK typically use the following programming sequence: See Setup and Locations on page 424 for more information on the code samples referenced below. Sensors must be connected before the system can enable the data channel. All data functions are named Go<Object>_<Function>, for example, GoSensor_Connect. -
Page 430: Discover Sensors
Discover Sensors Sensors are discovered when GoSystem is created, using GoSystem_Construct. You can use GoSystem_ SensorCount and GoSystem_SensorAt to iterate all the sensors that are on the network. GoSystem_SensorCount returns the number of sensors physically in the network. Alternatively, use GoSystem_FindSensorById or GoSystem_FindSensorByIpAddress to get the sensor by ID or by IP address. - Page 431 kIpAddress ipAddress; GoSystem system = kNULL; GoSensor sensor = kNULL; GoSetup setup = kNULL; //Construct the GoSdk library. GoSdk_Construct(&api); //Construct a Gocator system object. GoSystem_Construct(&system, kNULL); //Parse IP address into address data structure kIpAddress_Parse(&ipAddress, SENSOR_IP); //Obtain GoSensor object by sensor IP address GoSystem_FindSensorByIpAddress(system, &ipAddress, &sensor) //Connect sensor object and enable control channel GoSensor_Connect(sensor);...
-
Page 432: Limiting Flash Memory Write Operations
Limiting Flash Memory Write Operations Several operations and Gocator SDK functions write to the Gocator's flash memory. The lifetime of the flash memory is limited by the number of write cycles. Therefore it is important to avoid frequent write operation to the Gocator's flash memory when you design your system with the Gocator SDK. Power loss during flash memory write operation will also cause Gocators to enter rescue mode. -
Page 433: Benefits
Custom tools created with the GDK act much like native Gocator measurement tools, running at native speeds and taking advantage of features such as anchoring. The GDK supports all data types (profile and surface), and tools created with the GDK use the same data visualization as native tools. For the initial release, measurement tools created with the GDK only support Ethernet output. -
Page 434: Typical Workflow
Gocator 3200 Gocator 3500 If you are interested in using the GDK-based measurement tools on older Gocator sensors (with a second-generation controller), please contact LMI. Typical Workflow The following is the typical workflow for creating and deploying custom measurement tools: Develop and build measurement tools using the GDK project files and libraries in Microsoft Visual Stu- dio, targeting Win32. -
Page 435: Tools And Native Drivers
If a sensor's network address or administrator password is forgotten, the sensor can be discovered on the network and/or restored to factory defaults by using a special software tool called the Sensor Discovery tool. This software tool can be obtained from the downloads area of the LMI Technologies website: http://www.lmi3D.com. - Page 436 The Sensor Discovery tool uses UDP broadcast messages to reach sensors on different subnets. This enables the Sensor Discovery tool to locate and re-configure sensors even when the sensor IP address or subnet configuration is unknown. Tools and Native Drivers • Sensor Recovery Tool • 436 Gocator Line Profile Sensors - User Manual...
-
Page 437: Gentl Driver
GenTL driver. For instructions, see To configure system variables to use the driver in Windows 7, below. You can download the toolset package containing the driver from the LMI Technologies website at http://lmi3d.com/support/downloads/. Click the link for your product, click the Product User Area link at the top of the page, and log in. - Page 438 Click Advanced System Settings. In the System Properties dialog, on the Advanced tab, click Environment Variables... Tools and Native Drivers • GenTL Driver • 438 Gocator Line Profile Sensors - User Manual...
- Page 439 In the Environment Variables dialog, under the System variables list, click New. Tools and Native Drivers • GenTL Driver • 439 Gocator Line Profile Sensors - User Manual...
- Page 440 In the New System Variable dialog, enter the following information, depending on your system: Variable name Variable value 32-bit system GENICAM_GENTL32_PATH The full path to the GenTL\x86 folder. 64-bit system GENICAM_GENTL64_PATH The full path to the GenTL\x64 folder. Tools and Native Drivers • GenTL Driver • 440 Gocator Line Profile Sensors - User Manual...
-
Page 441: 16-Bit Rgb Image
Click OK in the dialogs until they are all closed. To work with the Gocator GenTL driver, the Gocator must operate in Surface or Video mode with its the appropriate output enabled in the Ethernet panel in the Output page. Check Acquire Intensity in the Scan Mode panel on the Scan page and enable intensity output in the Ethernet panel if intensity data is required. -
Page 442: 16-Bit Grey Scale Image
Channel Details pixel channel Data Results on page 380 for an explanation of the stamp information. The following table shows how the stamp information is packed into the blue channel. A stamp is a 64- bit value packed into four consecutive 16-bit blue pixels, with the first byte position storing the most significant ... - Page 443 Rows Details Y = Y offset + Py * Y resolution Z = Z offset + Pz * Z resolution Refer to the blue channel on how to retrieve the offset and resolution values. If Pz is 0 if the data is invalid. The Z offset is fixed to -32768 * Z Resolution. Z is zero if Pz is 32768. (max part height) ..
-
Page 444: Registers
Stamp Index Column Position Details 36..39 Y resolution (nm) 40..43 Z offset (nm) 44..47 Z resolution (nm) 48..51 Height map Width (in pixels) 52..55 Height map length (in pixels) 56..59 Specify if intensity is enabled or not Registers GenTL registers are multiples of 32 bits. The registers are used to control the operation of the GenTL driver, send commands to the sensors, or to report the current sensor information. -
Page 445: Xml Settings File
Register Name Read/Write Length (bytes) Description Address Transformatio Return the sensor transformation X offset n X offset Transformatio Return the sensor transformation Z offset n Z offset Transformatio Return the sensor transformation angle n Angle Transformatio Return the sensor transformation orientation n Orientation Clearance Return the sensor clearance distance... -
Page 446: Setting Up Halcon
Requirements Sensor Gocator laser profile sensor Firmware Firmware 4.0.9.136 or later Halcon Version 10.0 or later Setting Up Halcon Before using Halcon with Gocator, you must set up Halcon. To set up Halcon: Connect a Gocator sensor to the PC running Halcon. You will need a Master hub to connect the sensor to the PC. - Page 447 For more information on configuring Ethernet output, see Ethernet Output on page 236. Make sure the Gocator is running. On the PC, launch Halcon. 10. In Halcon, in the Assistants menu, click Open New Image Acquisition. 11. In the dialog that opens, in the Source tab, check the Image Acquisition Interface option and choose GenICamTL in the drop-down.
- Page 448 13. In the Connection tab, set Color Space to RGB and Bit Depth to 16. 14. In the Gocator web interface, click the Snapshot button to trigger the output of a surface. The output displays in the Halcon Graphics Window. Tools and Native Drivers •...
-
Page 449: Halcon Procedures
Halcon is now configured for use with Gocator. Halcon Procedures The Halcon example code contains internal procedures that you can use to decompose the RGB image and to control registers that the GenTL driver opens. You can import the procedures into your own code by selecting File > Insert Program > Insert Procedures and then choosing the example code Continuous_Acq.hdev under the Examples/Halcon directory. - Page 450 Procedures Description Parameters (Output) HeightMap : The height map image. Intensity : The intensity image. FrameCount : The number of frames. Timestamp : The timestamp. Encoder : The encoder position. EncoderIndex : The last index of the encoder. Inputs : The digital input states. xOffset : The X offset in millimeters.
- Page 451 Procedures Description Parameters (Output) ConfigFile : The name of the job file. The file name includes the extension .job. Example Go2GenTL_ConfigFileName (AcqHandle, ConfigFile) Go2GenTL_ Sets the sensor live configuration. SetConfigFileNa Parameters (Input) AcqHandle : Acquisition handle created by open_framegrabber ConfigFile : The name of the job file.
- Page 452 Procedures Description zResolution : The Z resolution in millimeters. Parameters (Output) coordinateXYZ : The real-world coordinates. Go2GenTL_ Returns the current exposure. Exposure Parameters (Input) AcqHandle : Acquisition handle created by open_framegrabber Parameters (Output) Exposure : The current exposure value (in µs). The value is returned as an integer. Decimals are truncated.
-
Page 453: Generating Halcon Acquisition Code
Procedures Description sensor To schedule a to start after a delay (ticks or microseconds), pass GenTL/Sensor the first call to , followed by the remaining calls to the set_framegrabber_param function as described in the previous example: set_framegrabber_param( AcqHandle, ‘XMLSettings’, ‘GenTL/Sensor’) Generating Halcon Acquisition Code Halcon lets you insert acquisition code into your code in the IDE. -
Page 454: Csv Converter Tool
* This example illustrates how to do the following: * 1. Acquire data from the Gocator (16-bit RGB or gray image) * 2. Decompose the returned image into three separate image for height map, intensity and stamps. * 3. Extract some stamp values from the stamp image. * Connect to the Gocator device. - Page 455 You can get the tool package (14405-x.x.x.x_SOFTWARE_GO_Tools.zip) from the LMI Technologies website at http://lmi3d.com/support/downloads/. Click on the link for your sensor, click on Product User Area, and log in. For more information on exporting recorded data, see see Downloading, Uploading, and Exporting Replay Data on page 61.
-
Page 456: Troubleshooting
Troubleshooting Review the guidance in this chapter if you are experiencing difficulty with a Gocator sensor system. If the problem that you are experiencing is not described in this section, see Return Policy on page 515. Mechanical/Environmental The sensor is warm. It is normal for a sensor to be warm when powered on. - Page 457 Verify that the measurement target is within the sensor's field of view and measurement range. See Spe- cifications on page 458 to review the measurement specifications for your sensor model. Check that the exposure time is set to a reasonable level.See Exposure on page 93 for more information on configuring exposure time.
-
Page 458: Specifications
Specifications The following sections describe the specifications of Gocator sensors and connectors, as well as Master hubs. Sensors The following sections provide the specifications of Gocator sensors. Gocator 2100 & 2300 Series The Gocator 2100 and 2300 series consists of the following models: MODEL 2320 2x30... - Page 459 The following diagram illustrates some of the terms used in the table above. Optical models, laser classes, and packages can be customized. Contact LMI for more details. Gocator 2300 series sensors provide 1280 data points per profile. Gocator 2100 series sensors provide 640 data points per profile.
- Page 460 Repeatability Z is measured with a flat target at the middle of the measurement range. It is the 95% confidence variation of the average height over 4096 frames. Height values are averaged over the full FOV. See Resolution and Accuracy on page 43 for more information. ALL 2x00 SERIES MODELS Approx.
-
Page 461: Gocator
Gocator 2320 Field of View / Measurement Range / Coordinate System Orientation Specifications • Sensors • 461 Gocator Line Profile Sensors - User Manual... - Page 462 Dimensions Envelope Specifications • Sensors • 462 Gocator Line Profile Sensors - User Manual...
-
Page 463: Gocator 2130 And
Gocator 2130 and 2330 Field of View / Measurement Range / Coordinate System Orientation Dimensions Specifications • Sensors • 463 Gocator Line Profile Sensors - User Manual... - Page 464 Envelope Specifications • Sensors • 464 Gocator Line Profile Sensors - User Manual...
-
Page 465: Gocator 2140 And
Gocator 2140 and 2340 Field of View / Measurement Range / Coordinate System Orientation Specifications • Sensors • 465 Gocator Line Profile Sensors - User Manual... - Page 466 Dimensions Envelope Specifications • Sensors • 466 Gocator Line Profile Sensors - User Manual...
-
Page 467: Gocator
Gocator 2342 Field of View / Measurement Range / Coordinate System Orientation Specifications • Sensors • 467 Gocator Line Profile Sensors - User Manual... - Page 468 Dimensions Envelope Specifications • Sensors • 468 Gocator Line Profile Sensors - User Manual...
-
Page 469: Gocator 2150 And
Gocator 2150 and 2350 Field of View / Measurement Range / Coordinate System Orientation Specifications • Sensors • 469 Gocator Line Profile Sensors - User Manual... - Page 470 Dimensions Specifications • Sensors • 470 Gocator Line Profile Sensors - User Manual...
- Page 471 Envelope Specifications • Sensors • 471 Gocator Line Profile Sensors - User Manual...
-
Page 472: Gocator 2170 And
Gocator 2170 and 2370 Field of View / Measurement Range / Coordinate System Orientation Specifications • Sensors • 472 Gocator Line Profile Sensors - User Manual... - Page 473 Dimensions Specifications • Sensors • 473 Gocator Line Profile Sensors - User Manual...
- Page 474 Envelope Specifications • Sensors • 474 Gocator Line Profile Sensors - User Manual...
-
Page 475: Gocator
Gocator 2375 Field of View / Measurement Range / Coordinate System Orientation Specifications • Sensors • 475 Gocator Line Profile Sensors - User Manual... - Page 476 Dimensions Specifications • Sensors • 476 Gocator Line Profile Sensors - User Manual...
- Page 477 Envelope Specifications • Sensors • 477 Gocator Line Profile Sensors - User Manual...
-
Page 478: Gocator 2180 And
Gocator 2180 and 2380 Field of View / Measurement Range / Coordinate System Orientation Specifications • Sensors • 478 Gocator Line Profile Sensors - User Manual... - Page 479 Dimensions Specifications • Sensors • 479 Gocator Line Profile Sensors - User Manual...
- Page 480 Envelope Specifications • Sensors • 480 Gocator Line Profile Sensors - User Manual...
-
Page 481: Gocator 2400 Series
Gocator 2400 Series The Gocator 2400 series consists of the following models: MODEL 2410 2420 1710 1940 Data Points / Profile 0.005 0.006 Linearity Z (+/- % of MR) Resolution Z (µm) 1.8 - 3.0 5.8 - 6.2 14.0 - 16.5 Resolution X (µm) (Profile Data Interval) Repeatability Z (µm) - Page 482 All specification measurements are performed on LMI’s standard calibration target (a diffuse, painted white surface). Linearity Z is the worst case difference in average height measured, compared to the actual position over the measurement range. Resolution Z is the maximum variability of height measurements across multiple frames, with 95% confidence.
-
Page 483: Gocator
Gocator 2410 Field of View / Measurement Range / Coordinate System Orientation Specifications • Sensors • 483 Gocator Line Profile Sensors - User Manual... - Page 484 Dimensions Specifications • Sensors • 484 Gocator Line Profile Sensors - User Manual...
- Page 485 Envelope Specifications • Sensors • 485 Gocator Line Profile Sensors - User Manual...
-
Page 486: Gocator
Gocator 2420 Field of View / Measurement Range / Coordinate System Orientation Specifications • Sensors • 486 Gocator Line Profile Sensors - User Manual... - Page 487 Dimensions Specifications • Sensors • 487 Gocator Line Profile Sensors - User Manual...
- Page 488 Envelope Specifications • Sensors • 488 Gocator Line Profile Sensors - User Manual...
-
Page 489: Gocator 2880 Sensor
Gocator 2880 Sensor The Gocator 2880 is defined below. MODEL 2880 Data Points / Profile 1280 0.04 Linearity Z (+/- % of MR) Resolution Z (mm) 0.092 - 0.488 Resolution X (mm) 0.375 - 1.1 Clearance Distance (CD) (mm) Measurement Range (MR) (mm) Field of View (FOV) (mm) 390 - 1260... -
Page 490: Gocator
Gocator 2880 Field of View / Measurement Range / Coordinate System Orientation Specifications • Sensors • 490 Gocator Line Profile Sensors - User Manual... - Page 491 Dimensions Specifications • Sensors • 491 Gocator Line Profile Sensors - User Manual...
- Page 492 Envelope Specifications • Sensors • 492 Gocator Line Profile Sensors - User Manual...
-
Page 493: Sensor Connectors
Sensor Connectors The following sections provide the specifications of the connectors on Gocator sensors. Gocator Power/LAN Connector The Gocator Power/LAN connector is a 14 pin, M16 style connector that provides power input, laser safety input and Ethernet. This connector is rated IP67 only when a cable is connected or when a protective cap is used. This section defines the electrical specifications for Gocator Power/LAN Connector pins, organized by function. -
Page 494: Power
Power Apply positive voltage to DC_24-48V. See Gocator 2100 & 2300 Series on page 458 or Gocator 2400 Series on page 481 Power requirements Function Pins DC_24-48V 24 V 48 V GND_24-48VDC Laser Safety Input The Safety_in+ signal should be connected to a voltage source in the range listed below. The Safety_in- signal should be connected to the ground/common of the source supplying the Safety_in+. -
Page 495: Gocator I/O Connector
Gocator I/O Connector The Gocator I/O connector is a 19 pin, M16 style connector that provides encoder, digital input, digital outputs, serial output, and analog output signals. This connector is rated IP67 only when a cable is connected or when a protective cap is used. This section defines the electrical specifications for Gocator I/O connector pins, organized by function. -
Page 496: Inverting Outputs
Max Collector Max Collector–Emitter Function Pins Min Pulse Width Current Voltage Out_1 N, O 40 mA 70 V 20 µs Out_2 S, T 40 mA 70 V 20 µs The resistors shown above are calculated by R = (V+) / 2.5 mA. The size of the resistors is determined by power = (V+)^2 / R. -
Page 497: Encoder Input
Active Low To assert the signal, the digital input voltage should be set to draw a current of 3 mA to 40 mA from the positive pin. The current that passes through the positive pin is I = (Vin – 1.2 – Vdata) / 680. To reduce noise sensitivity, we recommend leaving a 20% margin for current variation (i.e., uses a digital input voltage that draws 4mA to 25mA). ... -
Page 498: Serial Output
Serial Output Serial RS-485 output is connected to Serial_out as shown below. Function Pins Serial_out B, C Analog Output The Sensor I/O Connector defines one analog output interface: Analog_out. Function Pins Current Range Analog_out P, F 4 – 20 mA Current Mode Voltage Mode To configure for voltage output, connect a 500 Ohm ¼... -
Page 499: Master 100
Master 100 The Master 100 accepts connections for power, safety, and encoder, and provides digital output. *Contact LMI for information regarding this type of power supply. Connect the Master Power port to the Gocator's Power/LAN connector using the Gocator Power/LAN to Master cordset. -
Page 500: Master 100 Dimensions
Encoder/Output Port Pins Function Output_1+ (Digital Output 0) Output_1- (Digital Output 0) Encoder_Z+ Encoder_Z- Encoder_A+ Encoder_A- Encoder_B+ Encoder_B- Encoder_GND Encoder_5V Master 100 Dimensions Specifications • Master Hubs • 500 Gocator Line Profile Sensors - User Manual... -
Page 501: Master 400/800
Master 400/800 Master 400 and 800 hubs provide sensor power and safety interlock, and broadcast system-wide synchronization information (i.e., time, encoder count, encoder index, and digital I/O states) to all devices on a sensor network. Power and Safety (6 pin connector) Function +48VDC +48VDC... -
Page 502: Master 400/800 Electrical Specifications
Function Reserved Reserved Reserved Reserved Reserved Reserved Reserved Reserved Reserved Reserved Reserved The Input connector does not need to be wired up for proper operation. Encoder (8 pin connector) Function Encoder_A+ Encoder_A- Encoder_B+ Encoder_B- Encoder_Z+ Encoder_Z- +5VDC Master 400/800 Electrical Specifications Electrical Specifications Specification Value... -
Page 503: Master 400/800 Dimensions
The +48VDC power supply must be isolated from AC ground. This means that AC ground and DC ground are not connected. The Power Draw specification is based on a Master with no sensors attached. Every sensor has its own power requirements which need to be considered when calculating total system power requirements. -
Page 504: Master 810
Master 810 Master 810 hubs provide sensor power and safety interlock, and broadcast system-wide synchronization information (i.e., time, encoder count, encoder index, and digital I/O states) to all devices on a sensor network. Power and Safety (6 pin connector) Function +24-48VDC +24-48VDC GND(48VDC) -
Page 505: Master 810 Electrical Specifications
The Input connector does not need to be wired up for proper operation. Refer to labeling on the Master hub for Input connection wiring options. Encoder (11 pin connector) Function Encoder_A_Pin_1 Encoder_A_Pin_2 Encoder_A_Pin_3 Encoder_B_Pin_1 Encoder_B_Pin_2 Encoder_B_Pin_3 Encoder_Z_Pin_1 Encoder_Z_Pin_2 Encoder_Z_Pin_3 +5VDC Refer to labeling on the Master hub for Encoder connection wiring options. -
Page 506: Master 810 Dimensions
Master 810 Dimensions Specifications • Master Hubs • 506 Gocator Line Profile Sensors - User Manual... -
Page 507: Master
Master 1200/2400 Master 1200 and 2400 hubs provide sensor power and safety interlock, and broadcast system-wide synchronization information (i.e., time, encoder count, encoder index, and digital I/O states) to all devices on a sensor network. Power and Safety (6 pin connector) Function +48VDC +48VDC... -
Page 508: Master 1200/2400 Electrical Specifications
Function Reserved Reserved Reserved Reserved Reserved Reserved Reserved The Input connector does not need to be wired up for proper operation. Encoder (8 pin connector) Function Encoder_A+ Encoder_A- Encoder_B+ Encoder_B- Encoder_Z+ Encoder_Z- +5VDC Master 1200/2400 Electrical Specifications Electrical Specifications Specification Value Power Supply Voltage +48 VDC... -
Page 509: Master 1200/2400 Dimensions
Master 1200/2400 Dimensions The dimensions of Master 1200 and Master 2400 are the same. Specifications • Master Hubs • 509 Gocator Line Profile Sensors - User Manual... -
Page 510: Master
Master 2410 Master 2410 hubs provide sensor power and safety interlock, and broadcast system-wide synchronization information (i.e., time, encoder count, encoder index, and digital I/O states) to all devices on a sensor network. Power and Safety (6 pin connector) Function +24-48VDC +24-48VDC GND(48VDC) -
Page 511: Master 2410 Electrical Specifications
The Input connector does not need to be wired up for proper operation. Refer to labeling on the Master hub for Input connection wiring options. Encoder (11 pin connector) Function Encoder_A_Pin_1 Encoder_A_Pin_2 Encoder_A_Pin_3 Encoder_B_Pin_1 Encoder_B_Pin_2 Encoder_B_Pin_3 Encoder_Z_Pin_1 Encoder_Z_Pin_2 Encoder_Z_Pin_3 +5VDC Refer to labeling on the Master hub for Encoder connection wiring options. -
Page 512: Master 2410 Dimensions
Master 2410 Dimensions Specifications • Master Hubs • 512 Gocator Line Profile Sensors - User Manual... -
Page 513: Accessories
Accessories Masters Description Part Number Master 100 - for single sensor (development only) 30705 Master 400 - for networking up to 4 sensors 30680 Master 800 - for networking up to 8 sensors 30681 Master 1200 - for networking up to 12 sensors 30649 Master 2400 - for networking up to 24 sensors 30650... - Page 514 Contact LMI for information on creating cordsets with custom length or connector orientation. The maximum cordset length is 60 m. Accessories • 514 Gocator Line Profile Sensors - User Manual...
- Page 515 For non-warranty repairs, a purchase order for the repair charges must accompany the returning sensor. LMI Technologies Inc. is not responsible for damages to a sensor that are the result of improper packaging or damage during transit by the courier.
- Page 516 Software Licenses Pico-C Website: http://code.google.com/p/picoc/ License: picoc is published under the "New BSD License". http://www.opensource.org/licenses/bsd-license.php Copyright (c) 2009-2011, Zik Saleeba All rights reserved. Redistribution and use in source and binary forms, with or without modification, are permitted provided that the following conditions are met: * Redistributions of source code must retain the above copyright notice, this list of conditions and the following disclaimer.
- Page 517 BlowFish Website: http://www.chiark.greenend.org.uk/~sgtatham/putty/licence.html License: PuTTY is copyright 1997-2011 Simon Tatham. Portions copyright Robert de Bath, Joris van Rantwijk, Delian Delchev, Andreas Schultz, Jeroen Massar, Wez Furlong, Nicolas Barry, Justin Bradford, Ben Harris, Malcolm Smith, Ahmad Khalifa, Markus Kuhn, Colin Watson, and CORE SDI S.A. Permission is hereby granted, free of charge, to any person obtaining a copy of this software and associated documentation files (the "Software"), to deal in the Software without restriction, including without limitation the rights to use, copy, modify, merge, publish, distribute, sublicense, and/or sell...
- Page 518 The above copyright notice and this permission notice shall be included in all copies or substantial portions of the Software. THE SOFTWARE IS PROVIDED "AS IS", WITHOUT WARRANTY OF ANY KIND, EXPRESS OR IMPLIED, INCLUDING BUT NOT LIMITED TO THE WARRANTIES OF MERCHANT ABILITY,FITNESS FOR A PARTICULAR PURPOSE AND NONINFRINGEMENT.
- Page 519 Copyright 2006 The Closure Library Authors. All Rights Reserved. Licensed under the Apache License, Version 2.0 (the "License"); you may not use this file except in compliance with the License. You may obtain a copy of the License at http://www.apache.org/licenses/LICENSE-2.0 Unless required by applicable law or agreed to in writing, software distributed under the License is distributed on an "AS-IS"...
- Page 520 Licensed under the MIT License (http://www.opensource.org/licenses/mit-license.php) jQuery.scaling Website: http://eric.garside.name License: Scaling 1.0 - Scale any page element Copyright (c) 2009 Eric Garside Licensed under the MIT License (http://www.opensource.org/licenses/mit-license.php) jQuery.scrollFollow Website: http://kitchen.net-perspective.com/ License: Copyright (c) 2008 Net Perspective Licensed under the MIT License (http://www.opensource.org/licenses/mit-license.php) Flex SDK Website: http://opensource.adobe.com/wiki/display/flexsdk/Flex+SDK...
- Page 521 EtherNet/IP Communication Stack Website: sourceforge.net/projects/opener License: SOFTWARE DISTRIBUTION LICENSE FOR THE ETHERNET/IP(TM) COMMUNICATION STACK (ADAPTED BSD STYLE LICENSE) Copyright (c) 2009, Rockwell Automation, Inc. ALL RIGHTS RESERVED. EtherNet/IP is a trademark of ODVA, Inc. Software Licenses • 521 Gocator Line Profile Sensors - User Manual...
- Page 522 Support For assistance regarding a component or product, please contact LMI Technologies. World Email support@lmi3D.com http://www.lmi3D.com North America Phone +1 604 636 1011 +1 604 516 8368 Europe Phone +31 45 850 7000 +31 45 574 2500 For more information on safety and laser classifications, please contact: U.S.
- Page 523 Vancouver, Canada Berlin, Germany Shanghai, China +1 604 636 1011 +49 (0)3328 9360 0 +86 21 5441 0711 LMI Technologies has sales offices and distributors worldwide. All contact information is listed at lmi3D.com/contact/locations. Gocator Line Profile Sensors - User Manual...
Need help?
Do you have a question about the Gocator 2100 Series and is the answer not in the manual?
Questions and answers