Table of Contents
Advertisement
Quick Links
Solar Simulator
Spectroradiometer
Thank you very much for using EKO products.
Before operating this system, you should first thoroughly read this manual.
Keep this manual on hand to read when necessary.
Instruction Manual
LS-100
1. Safety precautions
2. Contents
3. General description
4. Description of components
5. Notes to Users
6. Software
7. LS100.exe software
8. Maintenance
9. Trouble shooting
10. Specifications
11. After-sales service
1
2
3
5
7
8
12
31
31
32
34
Advertisement
Table of Contents

Related Manuals for EKO LS-100


Summary of Contents for EKO LS-100
- Page 1 7. LS100.exe software 8. Maintenance 9. Trouble shooting 10. Specifications 11. After-sales service Thank you very much for using EKO products. Before operating this system, you should first thoroughly read this manual. Keep this manual on hand to read when necessary.
- Page 2 LS-100 or a PC causes the unexpected accidents. Cautions Power supply Confirm the input voltage of the AC adaptor of LS-100 is matched to the voltage of mains power supply. Turn on the power of LS-100 after confirming the voltage. Instruction Manual This manual contains instructions for the basic and critical operations of the system.
-
Page 3: Table Of Contents
2 2. Contents 1. Safety precautions 2. Contents 3. General description 3- 1. G en e ral d e sc r ip tion 3- 2. Ch a ra ct e ri sti c s 3- 3. Bl oc k di agram 4. -
Page 4: General Description
1. Long Stability The less aging diffuser, grating spectrometer and diode-array are adopted in LS-100. LS-100 is durable because there is no movable part to change the wavelength. This is accomplished by the adoption of photodiode-array. 2. Substantial software functions LS-100 software automatically determines the optimal shutter opening time for the spectral measurement based on the intensity of the light source. -
Page 5: Bl Oc K Di Agram
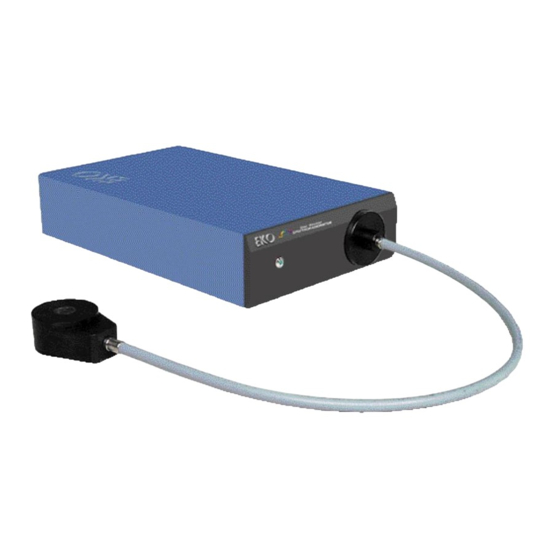
3 -3 . B lo ck d i agra m Block diagram of solar simulator spectroradiometer LS-100 Hardware is shown below. LS-100 Optical LS-100 head body RS-232C cable Optical fiber AC adapter *PC is not included in LS-100. Fig. 3-1. Hardware block diagram The incident radiation goes into the integrated spectrometer through the optical head. -
Page 6: Descriptions Of Components
4 4. Descriptions of components The names and functions of LS-100 components are shown in Fig. 4-1. and Table. 4-1 Body ⚫ Side view a) LED lamp c) Power switch d) RS-232C b) Optical fiber connector receptacle (fixing screw e) Power supply... - Page 7 Power supply Connect the output plug of the attached AC adapter connector (Input:AC100-240V, Output:DC12V, 0.8A) Stand Use when the LS-100 is set vertically. LS-100 can be used horizontally without stand. Table 4-2. Functions (Optical head) Part Description Function Incident window Transfer the incident radiation...
-
Page 8: Notes To Users
5 5. Notes to Users 5 -1 . N ot e s Grating solar simulator spectroradiometer LS-100 perform the spectral measurement of the Remove the block out objects in the range of aperture angle. anufactured light. Keep away from the water and dust, and set on the stable basement. It could be the cause of failure. -
Page 9: Software
6 6. Software 6 -1 . G en era l de s cr i pt i on The software only used for LS-100 Solar Simulator Radiometer performs measurement and analysis. Fig. 6-1 shows the concept of LS-100 Software. LS-100 RS-232C LS100.exe... - Page 10 3. Select “LS-100” in “Selection of a package” window. Fig.6-3 Selection of a package window 4. Select the folder for software installation in “Setup” window. Shortcut to the software can be made on desktop and/or start menu by checking the checkboxes.
- Page 11 5. Confirm the installed program and settings, and click “install”. Fig.6-5 Confirmation window 6. Fig.6-6 is displayed when installation is finished. Click “End” to close the window. Fig.6-6 Install completion window 10 10...
-
Page 12: U N In Stall Ati
2. CSV file (ASCII data) CSV file is composed as ASCII format. The spectral irradiance of wavelength interval, which is according to LS-100 specifications, is saved in CSV file. Furthermore, the spectral irradiance of 1nm or 5nm interval can be saved in CSV file. -
Page 13: Ls100.Exe Software
15 seconds for LS-100 one time measurement. “XENON” or “HALOGEN(Option)” for “Calibration value”. Select PC COM port number, which is selected to LS-100 for “RS232C port”. Select “ON” or “OFF” for “Sound”. When “ON” is selected, the sound at the end of measurement is “ON”. - Page 14 Fig.7-2 LS100.exe setting window In Fig.7-2, the right window is Main dialogue, upper left window is thumbnail window showing measurement data, and lower left window is thumbnail window showing standard data. 13 13...
-
Page 15: M Ea Su R Em En T C On T R Ol W In D
2. Before starting measurement Specify “Saved data folder” before starting measurement. Fig.7-3 “Data folder config” window is shown by clicking “Data folder config” Button at the lower left of main dialogue window of Fig.7-2. Click “Ref.” to specify saved data folder. “Filename ID” is the ID to be input at the top of ESM file name. - Page 16 Fig.7-5 Measuring status window Fig.7-6 Dark measuring status window To start interval measurement, select “Interval measurement” in “Measurement config”, and click “start” button. Then Fig.7-7 window is displayed. Fig.7-7 Interval measurement stand-by window In case calibration value is not specified in “ ”...
-
Page 17: M Ea Su R Em En T D Ispl Ay Win Do
7 -3 . M ea s ur e m en t d i sp lay w i ndo w Data retrieval, graph display, file output etc. can be operated on “Measured data display” window of main dialogue. Addition to that, outline graph is displayed on Data thumbnail window according to the data displayed in Data view list. - Page 18 2. Delete the data To delete the data, specify the data to be deleted, and click “Delete” button. Then, Fig.7-10 “Delete confirmation” window is displayed, and the data are completely deleted by clicking “Yes”. To select consecutive plural data, drag the data with pushing “Shift” key. To select any plural data, specify plural data with pushing “Ctrl”...
- Page 19 Fig.7-11 Spectral coincidence type window Fig.7-12 JIS C8912 Spectral coincidence window 18 18...
- Page 20 Fig.7-13 JIS C8933 Spectral coincidence window Spectral coincidence of each wavelength is calculated according to the following formula. ∫Es(λ)dλ M i = ∫Eo(λ)dλ Mi : Spectral coincidence λ : Wavelength(nm) Eo(λ) : Spectral irradiance of reference solar irradiance at the wavelength λ Es(λ) : Spectral irradiance of solar simulator irradiance at the wavelength λ...
- Page 21 5. Edit the comments To add any comments for measured data, click “Edit comment” button and input the comments in Fig.7-14 “Edit comment” window. Those comments are reflected in Data view list and CSV file. When plural data are selected, comment is reflected in all selected measured data. Fig.7-14 Edit comment window 6.
- Page 22 7. Display the data graph To display data graph window, select the data and click “Measured data” button in “Plot”, or double click the data. Or, double click the measured data at “display Data thumbnail window” next to the main dialogue. (1) When one of measured data is selected, Fig.7-15 is displayed.
- Page 23 - “Shift down Ratio data” - “Plot measured data” - “Plot standard data” - “Plot difference data” - “Plot ratio data” - “Show integration” - “Copy to clipboard” - “Save as bitmap file” and “Print”. For X axis setting, minimum value is 350nm and maximum value is 1100nm. For Y axis setting, make “Auto”...
- Page 24 To display the graph showing the difference and ratio, click “Difference data display” or “Ratio data display” respectively. To display integrated value in the specified wavelength in “Data graph”, click “Interval integration display”. Then, it is displayed at the bottom of the graph. In this time, the ratio between standard data and measured data is also displayed.
- Page 25 Fig.7-19 Graph config window (when plural data are selected) 24 24...
- Page 26 8. Display Calculation data graph To display Fig.7-20 calculation data window, select plural data from Data view list, and click “Calculation data” button. Calculation data graph shows integration value in Y axis, and time in X axis. So, integrated value of measured data is shown in time series. To display the measurement time and integrated value of partial data, drag corresponding data.
- Page 27 9. 3-D Graph display To display 3-D graph, click “3-D” button in Fig.7-2 LS100.exe setting window. In 3-D graph, Y axis is for Spectral Irradiance, X axis for Wavelength, and Z axis for time (see Fig.7-22 and Fig.7-23). Argument Θ shows plane angle of Wavelength (X axis) and Time (Z axis), argument Φ shows plane angle of Time (Z axis) and Irradiance (Y axis).
- Page 28 Argument Θ (0-90°) and Argument Φ (0-90°) can be input by user in “Viewpoint”. The range is from 0 to 90°. Fig.7-24 3-D graph setting window 10. Import “Import” function is used to import RAD file (Binary data) from the old version software LS100.exe.
- Page 29 11. Export “Export” function is used to exchange measured data in CSV file. To display Fig.7-26 Export window, select one or plural data from Data view list, and click “Export” button. For Integration, specify integration range of measured data. Default value is minimum 350 and maximum 1100.
-
Page 30: S Tan D A Rd Dat A Disp Lay 2
7 -4 . S ta nda r d da t a d i s pl ay Standard data view list in Fig.7-27 Standard data display window shows measured data recorded as standard data. Graph display and History function is also available. Graph is displayed on Standard data thumbnail window according to measured data, which is recorded as standard data. -
Page 31: Oth E R S
To check software version, click on the tab on the top of Main dialogue. Fig.7-28 Software version window 2. EKO web site To display EKO home page, click “EKO” logo on the right up at the main dialogue with the PC connected Internet. Fig.7-29 EKO home page... -
Page 32: Maintenance
LS-100 body and the optical head. 2) Check if the power of the PC and the LS-100 body are on. 3)Check if the PC COM port is correctly connected. 4)Reboot the software to make sure the connection between the PC and the LS-100 body, and check if the PC operation works for the LS-100 operation. -
Page 33: Sp E Ci Fi Cati On
(with the attached AC-adapter, AC100-240V, 50/60Hz) Size W50 x D250 x H150 (mm) Weight Approximately 1.8kg Communication RS-232C (between the LS-100 body and the PC) Working conditions Temperature : 0~+40ºC, Humidity : 0~90%RH No condensation Software Program Measurement software : LS100.exe... - Page 34 1 0 -2 . S ta nd ard a cc e s sor i e s Description Q’ty Remarks LS-100 body Optical head Including the optical fiber(700mm) AC adapter AC100-240V, 50/60Hz Stand RS-232C cable 1.5m CD-ROM Instruction Manual and Software (LS100.exe) Q’ty...
-
Page 35: After-Sales Service
After-sales service Please read through “10. Trouble shooting” before contacting us. Con t a ct A dd re s s If you have any questions-feel free to call, fax or e-mail to EKO or your local distributor. EKO INSTRUMENTS CO., LTD. - Page 36 1-21-8 Hatagaya, Shibuya-ku, Tokyo, 151-0072 Japan Tel: +81 (3) 3469-6713 Fax: +81 (3) 3469-6719 e-mail info@eko.co.jp URL www://http.eko.co.jp 35 35...
Need help?
Do you have a question about the LS-100 and is the answer not in the manual?
Questions and answers