Table of Contents
Advertisement
Quick Links
Advertisement
Chapters
Table of Contents
Troubleshooting

Related Manuals for Olympus EPOCH 1000 Series


Summary of Contents for Olympus EPOCH 1000 Series
- Page 1 EPOCH 1000 Series User’s Manual 910-269-EN — Revision B June 2011...
- Page 2 Olympus NDT, 48 Woerd Avenue, Waltham, MA 02453, USA © 2009, 2011 Olympus NDT, Inc. All rights reserved. No part of this publication may be reproduced, translated, or distributed without the express written permission of Olympus NDT, Inc. This document was prepared with particular attention to usage to ensure the accuracy of the information contained therein.
-
Page 3: Table Of Contents
Warranty Information ......................11 Technical Support ........................ 11 Preface ........................ 13 Product Description ......................13 EPOCH 1000 Series Models ....................14 About This Document ......................15 Audience ..........................15 Typographical Conventions ....................16 If You Have Documentation Comments ................16 Revision History ........................ - Page 4 910-269-EN, Rev. B, June 2011 1. EPOCH 1000 Series Hardware Features ..........19 Hardware Overview ....................20 Front Panel User Interface ..................21 1.2.1 General Purpose Keys and Knob ..............22 1.2.2 Function and Parameter Keys ..............23 1.2.3 Parameter Adjustment ................... 23 1.2.4...
- Page 5 910-269-EN, Rev. B, June 2011 3.1.11 About Flags ..................... 59 Menu Contents ......................61 3.2.1 Conventional UT Mode Menus ..............62 3.2.2 Phased Array Mode Menus ................64 About Setup Pages ....................66 3.3.1 Color Setup Page .................... 68 3.3.2 A-Scan Setup Page ..................
- Page 6 Serial Communication (RS-232) ................131 USB Communication ....................131 8.5.1 USB Client ..................... 131 8.5.2 USB Host ......................131 Serial/USB Command Protocol ................132 9. Calibrating the EPOCH 1000 Series (Conventional UT Mode) ............... 133 Getting Started ......................134 vi Table of Contents...
- Page 7 910-269-EN, Rev. B, June 2011 Calibration Modes ....................135 9.2.1 Straight Beam Modes ................... 136 9.2.2 Angle Beam Modes ..................136 Calibrating with a Straight Beam Transducer ............ 137 Calibrating with a Delay Line Transducer ............140 Calibrating with a Dual Element Transducer ............. 145 Calibrating in Echo-to-Echo Mode ...............
- Page 8 910-269-EN, Rev. B, June 2011 11.2.4.1 Scanning Gain ..................206 11.2.4.2 Curve Adjustment Gain (DAC Gain or TVG Gain) ..... 208 11.2.4.3 Transfer Correction ................209 11.2.5 JIS DAC ......................210 11.2.6 Custom DAC Curves ................... 210 11.2.7 20 % - 80 % DAC ................... 212 11.2.8 TVG Table ......................
- Page 9 16.1 Cursors X and Y ...................... 271 16.2 Cursors Status ......................271 16.3 Cursor Positioning ....................272 16.4 Cursor Measurements .................... 273 17. Calibrating the EPOCH 1000 Series (Phased Array Mode) ................275 17.1 Getting Started ......................275 17.2 Calibration Types ....................276 17.2.1...
- Page 10 910-269-EN, Rev. B, June 2011 17.2.3 Sensitivity (Gain) ..................277 17.2.3.1 Single Sensitivity (Gain) Calibration ..........278 17.2.3.2 Multi-Point Sensitivity (Gain) Calibration ........278 17.3 Calibrating with a Zero Degree Transducer ............278 17.3.1 Calibrating the Velocity With a Zero Degree Transducer ...... 279 17.3.2 Calibrating the Wedge Delay With a Zero Degree Transducer .....
-
Page 11: List Of Abbreviations
910-269-EN, Rev. B, June 2011 List of Abbreviations alternating current memory average voltage gain non-destructive testing American Welding Society overshoot beam index point pulser/receiver bypass phased array calibration printer control language curved surface correction peak distance amplitude correction part number direct current pulse repetition frequency distance gain size... - Page 12 910-269-EN, Rev. B, June 2011 xii List of Abbreviations...
-
Page 13: Labels And Symbols
A rating plate with safety-related labels and symbols is attached under the instrument at the location shown in the following figure. If labels or symbols are missing or illegible, please contact Olympus. Location of rating plate label (see Table 1 on page 2) -
Page 14: Table 1 Content Of The Rating Plate Label
The EFUP for the EPOCH 1000 Series has been determined to be 15 years. Note: The Environmental Friendly Usage Period (EFUP) is not meant to be interpreted as the period assuring functionality and product performance. - Page 15 910-269-EN, Rev. B, June 2011 Table 1 Content of the rating plate label (continued) SERIAL The serial number is a nine (9) digit number in the following format: yynnnddmm where: Production year Unit Number manufactured that day. Production Day. Production Month. For example, the 080011612 serial number indicates the first unit (001) produced on the December 16, 2008.
- Page 16 910-269-EN, Rev. B, June 2011 Do not touch the inner conductor of the BNC (or LEMO) connectors to avoid risks of an electrical shock. Up to 475 V can be present on the inner conductor. The warning symbol between the Transmit/Receive (T/R) and the Receive (R) BNC connectors shown in the figure below indicates this electrical shock risk.
-
Page 17: Important Information - Please Read Before Use
The EPOCH 1000 Series instruments are designed to perform nondestructive inspections of industrial and commercial materials. Do not use the EPOCH 1000 Series instruments for any purpose other than their intended use. In particular, do not use the instruments for the inspection or examination of human or animal body parts. -
Page 18: Instrument Compatibility
910-269-EN, Rev. B, June 2011 Instrument Compatibility Only use the EPOCH 1000 Series instrument with the following ancillary equipment: • Rechargeable lithium-ion (Li-ion) battery pack (PN: EPXT-BAT-L) • Optional standalone external battery charger (PN: EPXT-EC) • Charger/adaptor (PN: EP-MCA) Using incompatible equipment can result in a malfunction and/or in equipment damage. -
Page 19: Safety Signal Words
910-269-EN, Rev. B, June 2011 High voltage warning symbol: This symbol is used to alert you to potential electric shock hazards higher than 1,000 volts. All safety messages that follow this symbol shall be obeyed to avoid possible harm. Safety Signal Words The following safety symbols may appear in the documentation of the instrument: The DANGER signal word indicates an imminently hazardous situation. -
Page 20: Notes Signal Words
Safety Before applying power to the EPOCH 1000 Series, verify that the correct safety precautions have been taken (see the following warnings.) In addition, note the external markings on the instrument that are described in the “Important Information —... -
Page 21: Weee Directive
Service instructions, when applicable, are for trained service personnel. To avoid a dangerous electric shock, do not perform any service unless qualified to do so. For any problem or question regarding this apparatus, contact Olympus or an authorized Olympus representative. -
Page 22: China Rohs
The EFUP for the EPOCH 1000 Series has been determined to be 15 years. Note: The Environmental Friendly Usage Period (EFUP) is not meant to be interpreted as the period assuring functionality and product performance. -
Page 23: Warranty Information
Olympus NDT Terms and Conditions available at http://www.olympus-ims.com/en/terms/. The Olympus warranty only covers equipment that has been used in a proper manner as described in this instruction manual, and that has not been subjected to excessive abuse, attempted unauthorized repair, or modification. - Page 24 910-269-EN, Rev. B, June 2011 12 Important Information — Please Read Before Use...
-
Page 25: Preface
910-269-EN, Rev. B, June 2011 Preface The preface contains the following topics: • Product Description • EPOCH 1000 Series Models • About This Document • Audience • Typographical Conventions • If You Have Documentation Comments • Revision History Product Description... -
Page 26: Epoch 1000 Series Models
EPOCH 1000/1000iR/1000i in hand so that you can combine reading the descriptions and examples with the actual use of the instrument. EPOCH 1000 Series Models The EPOCH 1000 Series offers three instrument configuration levels to suit many inspection needs: EPOCH 1000 Advanced UT An advanced conventional ultrasonic flaw detector that can be upgraded with phased array imaging at an authorized Olympus service center. -
Page 27: About This Document
910-269-EN, Rev. B, June 2011 About This Document This document is the user’s manual for the EPOCH 1000/1000iR/1000i. This manual describes routine tasks for operating the EPOCH 1000 Series. These tasks include: • Operating the power supply • Managing basic operations •... -
Page 28: Typographical Conventions
Used to represent a variable. If You Have Documentation Comments Olympus is always interested in improving its documentation. We value your comments about the manual and other Olympus documentation. Complete the survey in section “Documentation Comments” on page 353 of this document. -
Page 29: Revision History
910-269-EN, Rev. B, June 2011 Revision History Publication dates are updated when a change is made to the documentation. In addition, the document number is also changed to reflect the revision. Table 3 on page 17 shows a list of revisions for this document. Table 3 Revision history Date Part number... - Page 30 910-269-EN, Rev. B, June 2011 18 Preface...
-
Page 31: Epoch 1000 Series Hardware Features
910-269-EN, Rev. B, June 2011 1. EPOCH 1000 Series Hardware Features The EPOCH 1000 Series has many physical features that are either completely new or improved compared to previous EPOCH flaw detector instruments. It is important for you to be familiar with the use and maintenance of these items. -
Page 32: Hardware Overview
910-269-EN, Rev. B, June 2011 Hardware Overview Figure 1-1 on page 20 shows the EPOCH 1000 Series instrument and identifies its main components. Removable rubber handle Conventional UT BNC Protective rubber connectors bumpers Front panel user interface D-rings (4) to attach the... -
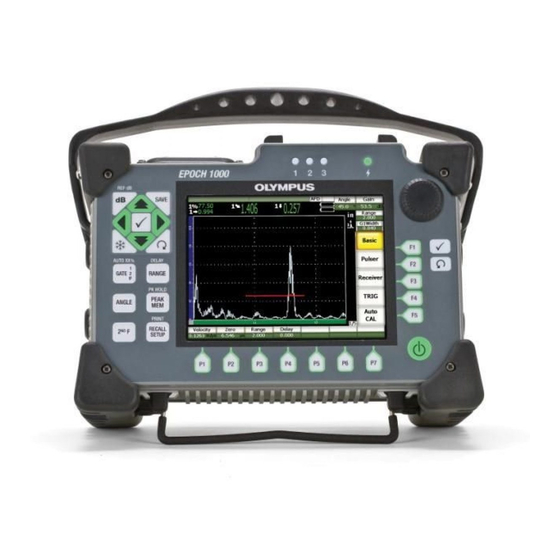
Page 33: Front Panel User Interface
910-269-EN, Rev. B, June 2011 Front Panel User Interface The EPOCH 1000 Series front panel shown in Figure 1-2 on page 21 features a combination of direct-access keys, navigation arrows, and dynamic function and parameter access keys to optimize the usability of the instrument in any mode. The... -
Page 34: General Purpose Keys And Knob
(see Figure 1-3 on page 22). They are general purpose keys, regardless of instrument mode or function. The [CHECK] and [ESCAPE] keys are available on both the left and right side of the EPOCH 1000 Series front panel. [UP]... -
Page 35: Function And Parameter Keys
1.2.2 Function and Parameter Keys The EPOCH 1000 Series handles adjustments and/or the activation of most software functions via an intuitive menu system. Menu system software buttons appear at all times, vertically on the right side and horizontally at the bottom of the display. Five function keys ([F1] through [F5]) and seven parameter keys ([P1] through [P7]) are located around the display, allowing you to individually activate a software button. -
Page 36: About The Direct-Access Keypad
910-269-EN, Rev. B, June 2011 The [CHECK] key sets the coarse/fine mode and the [ESCAPE] key returns the focus one level up in the menu hierarchy. 1.2.4 About the Direct-Access Keypad Important, commonly used parameters can be accessed via keys on the instrument direct-access keypad. -
Page 37: Figure 1-5 The English Direct-Access Keypad With Model Differences
Saves to the selected File and ID. F], [SAVE] (UT-PA) Switches back and forth between the conventional (UT) and the phased array (PA) modes. [FREEZE] Freeze holds the displayed waveform until [FREEZE] is pressed again. EPOCH 1000 Series Hardware Features 25... -
Page 38: About Indicators
1.2.5 About Indicators The EPOCH 1000 Series instruments provide one power and three alarm indicator lights (see Figure 1-6 on page 27). The indicators are located on the front panel above the display window (see Figure 1-2 on page 21). -
Page 39: Usb Keyboard And Mouse Control
USB Keyboard and Mouse Control You can connect a USB keyboard and a USB mouse to the EPOCH 1000 Series and use them to control standard instrument functions. Function control via the USB keyboard and mouse is similar to direct function control via the methods described previously in this document. -
Page 40: Conventional Transducer Connections
1.4.1 Conventional Transducer Connections The EPOCH 1000 Series instruments are supplied with either BNC or LEMO 01 conventional transducer connectors. The type of conventional transducer connector is chosen at the time of order. If necessary, it is possible to change the type of transducer connection at an authorized Olympus service center for a small charge. -
Page 41: Phased Array Transducer Connector (Epoch 1000Ir/1000I Only)
This connector is also used with other Olympus products, including the OmniScan instruments. Any phased array transducer with element count matching the capabilities of the EPOCH 1000 Series may be used with this standard connector. Refer to section 19.4 on page 318 for specifications of compatible PA probes. - Page 42 When not in use, the phased array connection cover attaches to the battery compartment cover of the EPOCH 1000 Series via two thumb screws. This allows easy transportation of this connection cover and reduces the risk of loss or damage.
-
Page 43: Input/Output Connectors
(see Figure 1-10 on page 32). A rubber cover protects each connector. The connectors provide analog outputs, digital alarm outputs, a digital input, and encoder outputs. Refer to section 19.3 on page 316 for the complete specifications of the supported I/O signals. EPOCH 1000 Series Hardware Features 31... -
Page 44: Battery Compartment Connections
1.4.4 Battery Compartment Connections The EPOCH 1000 Series battery compartment cover allows you to quickly access the battery and connections without the need for tools. Four thumb screws on the battery compartment cover secure it to the instrument case and ensure the compartment is sealed. -
Page 45: Computer Connection Compartment
1.4.5 Computer Connection Compartment On the right side of the EPOCH 1000 Series instruments, a door covers the instruments’ computer connection compartment (see Figure 1-12 on page 34). This door has an integral membrane seal to keep liquids away from the unsealed connections behind the door. -
Page 46: Figure 1-12 The Connectors Behind The Computer Connection Compartment Door
USB client Used to connect the to a computer. The EPOCH 1000 instrument is compatible with the Olympus GageView Pro software (see section 3.5 on page 86 and section 8.5.1 on page 131). USB hosts Used to connect USB peripherals such as a printer, a keyboard, a mouse or a storage device (see section 8.5.2 on... -
Page 47: Various Hardware Features
Each stand is bent in the center to easily accommodate being placed on a curved surface. One EPOCH 1000 Series pipe stand is located on the back of the instrument, attached to the battery compartment cover (see Figure 1-1 on page 20). This pipe stand allows for steep viewing angles. -
Page 48: O-Ring Gasket And Membrane Seals
Figure 1-13 Tilting angles using the bottom and rear stands 1.5.3 O-Ring Gasket and Membrane Seals The EPOCH 1000 Series contains seals that are used to protect the instrument’s internal hardware from the environment. These include: • Battery compartment cover seal •... -
Page 49: Environmental Ratings
Olympus has adopted the IP (ingress protection) system to rate how well the instrument is sealed. The EPOCH 1000 Series has been tested to the requirements of IP66. All instruments are designed and manufactured to meet this level of ingress protection when they leave the factory. - Page 50 910-269-EN, Rev. B, June 2011 38 Chapter 1...
-
Page 51: Powering The Epoch 1000 Series
910-269-EN, Rev. B, June 2011 2. Powering the EPOCH 1000 Series This chapter describes how to operate the EPOCH 1000 Series using different power supply options. The topics are as follows: • Starting the EPOCH 1000 Series • Using the AC Line Power •... -
Page 52: Starting The Epoch 1000 Series
910-269-EN, Rev. B, June 2011 Starting the EPOCH 1000 Series Figure 2-1 on page 40 shows the location of the power key and of the power indicator. Power indicator [ON/OFF] power key Figure 2-1 Location of the EPOCH 1000 power key and indicator Pressing the [ON/OFF] power key causes an initial beep. -
Page 53: Using The Ac Line Power
910-269-EN, Rev. B, June 2011 When a phased array probe is connected to the EPOCH 1000 Series, the instrument automatically detects it and completes the startup process by opening the Beam setup page, allowing you to validate probe parameters (see Figure 2-2 on page 41). Refer to section 12.2 on page 240 for details on the Beam setup page. -
Page 54: Using Battery Power
Connect the DC output power cable from the charger/adaptor to the AC adaptor input jack (see Figure 2-3 on page 42). Turn on the EPOCH 1000 Series by pressing the front panel power key (see Figure 2-1 on page 40). -
Page 55: Figure 2-4 The Battery Charge Indicator
910-269-EN, Rev. B, June 2011 Only use the Olympus rechargeable Li-ion battery pack (PN: EPXT-BAT-L) with an EPOCH 1000 Series instrument. Using any other battery can cause death or serious personal injury as the result of the explosion while charging the battery. -
Page 56: Charging The Battery
When the EPOCH 1000 Series is connected to AC power and powered ON, the battery indicator displays a lightning bolt symbol instead of the standard level indicator with percentage showing remaining battery life. - Page 57 Avoid long-term storage under sunlight or in other excessively hot places such as an automobile trunk. • While in storage, fully recharge batteries at least once every two (2) months. • Never place partially discharged batteries in storage without a full recharge. Powering the EPOCH 1000 Series 45...
-
Page 58: Replacing The Battery
Remove the battery (EPXT-BAR-L). Only use the Olympus rechargeable Li-ion battery pack (PN: EPXT-BAT-L) with an EPOCH 1000 Series instrument. Using any other battery may cause death or serious personal injury as the result of the explosion while charging the battery. - Page 59 Ensure that the gasket of the battery compartment cover is clean and in good condition. Install the battery compartment cover at the back of the instrument and then tighten the four thumb screws using your fingers. Powering the EPOCH 1000 Series 47...
- Page 60 910-269-EN, Rev. B, June 2011 48 Chapter 2...
-
Page 61: Epoch 1000 Series Software Features
910-269-EN, Rev. B, June 2011 3. EPOCH 1000 Series Software Features This chapter describes the software components. Topics are as follows: • Software Main Display • Menu Contents • About Setup Pages • Basic Procedures • Managing Data with GageView Pro Interface Program... -
Page 62: Software Main Display
910-269-EN, Rev. B, June 2011 Software Main Display The EPOCH 1000 Series software main display elements are exploded in Figure 3-1 on page 50. The following sections describe each of the main display elements. File name/ Software indicators Permanent parameters... -
Page 63: Figure 3-2 Overview Of The Menu System In Ut Operation Mode
(see Figure 3-3 on page 51). For example, the menu indicator showing , means that there are five standard available menus and that the first one is currently selected. Menu indicator Figure 3-3 The menu indicator (1/5) EPOCH 1000 Series Software Features 51... -
Page 64: About The Convention To Identify Menu Elements
910-269-EN, Rev. B, June 2011 Each menu contains up to five submenu buttons appearing vertically on the right side of the software main display. The submenu buttons of only one menu appear at a given time on the software main display. Use the corresponding [F<n>] function key, the arrow keys, or the adjustment knob to select a submenu. -
Page 65: Figure 3-4 Concise Convention To Identify Menu Elements
Choose 2/5 > Gate 1 > Width. Activating an optional feature that introduces another menu increases the total number of menus shown by the menu indicator (Ex.: 1/5 becomes 1/6). EPOCH 1000 Series Software Features 53... -
Page 66: About The Focus
910-269-EN, Rev. B, June 2011 3.1.3 About the Focus The button that appears with a yellow background is the element that has the focus. There is always only one element that has the focus. When the focus is on a parameter button, the button background of the submenu to which it belongs, appears green (see the Range and the Basic buttons in Figure 3-5 on page 54). -
Page 67: About The File Name/Message Bar
Current identifier Figure 3-6 Message bar with a file name example The EPOCH 1000 Series text messages also appear in the bar as needed, following your actions (see example in Figure 3-7 on page 55). Figure 3-7 Message bar with a message example 3.1.6... -
Page 68: About Permanent Parameters
910-269-EN, Rev. B, June 2011 Operation mode indicator Scan type indicator Leg indicator Battery charge indicator Figure 3-8 Example of software indicators Table 8 Software indicators Indicator Icon Description Operation mode Instrument in phased array mode Instrument in conventional UT mode Scan type S-scan sector scan Battery charge... -
Page 69: About Direct-Access Parameters
(see Figure 3-11 on page 57). Refer to section 3.3.3 on page 71 for details on how to select measurements and for a description of available measurements. Figure 3-11 Example of measurement reading boxes with their icons EPOCH 1000 Series Software Features 57... -
Page 70: About The Live-Scan Area
910-269-EN, Rev. B, June 2011 3.1.10 About the Live-Scan Area The large fixed-size live-scan area displays the ultrasonic data graphically (see Figure 3-12 on page 58). In PA operation mode, different views are available (refer to section 14.1 on page 253 for details). A-scan S-scan Sound path axis... -
Page 71: About Flags
3.1.11 About Flags The EPOCH 1000 Series indicates when particular functions are active by displaying a set of flags, in a thin vertical area on the right of the live-scan area (see Figure 3-13 on page 59). Table 9 on page 59 provides a description of the possible flags. - Page 72 910-269-EN, Rev. B, June 2011 Table 9 Flag description (continued) Flag Description Indicates that the [2 F] key has been pressed. Gate 1 is in peak measurement mode. Gate 2 is in peak measurement mode. Gate 1 is in edge (or flank) measurement mode. Gate 2 is in edge (or flank) measurement mode.
-
Page 73: Menu Contents
Access to all instrument function keys except [ON/OFF] is locked see section 3.3.4 on page 76). Menu Contents The EPOCH 1000 Series uses menus to categorize similar functions in both conventional ultrasound and phased array modes. EPOCH 1000 Series Software Features 61... -
Page 74: Conventional Ut Mode Menus
910-269-EN, Rev. B, June 2011 3.2.1 Conventional UT Mode Menus The EPOCH 1000 Series conventional UT mode includes five standard menus shown in Table 10 on page 62. Table 10 Standard menus in UT mode Menu Submenu Display Sizing buttons... -
Page 75: Table 12 Content Of The 2/5 Standard Menu In Ut Mode
Table 14 Content of the 4/5 standard menu in UT mode Submenu Parameters Sizing DAC/TVG AWS D1.1 Option Table 15 Content of the 5/5 standard menu in UT mode Submenu Parameters Page Files Open Create Reset First ID Last ID Setup EPOCH 1000 Series Software Features 63... -
Page 76: Phased Array Mode Menus
910-269-EN, Rev. B, June 2011 3.2.2 Phased Array Mode Menus The EPOCH 1000 Series phased array mode includes five standard menus shown in Table 16 on page 64. Many of these menus are identical to their corresponding conventional UT mode menus. -
Page 77: Table 17 Content Of The 1/5 Standard Menu In Pa Mode
Table 19 Content of the 3/5 standard menu in PA mode Submenu Parameters Display A-Scan Image Color Setup Setup Setup Overlay Meas Reading Unit TH Res % Res Trigger A-Out Setup Setup Inst Owner General Status Setup Info EPOCH 1000 Series Software Features 65... -
Page 78: About Setup
Setup About Setup Pages The EPOCH 1000 Series software features a number of setup pages allowing you to adjust instrument features and functions to your preferences. The setup pages are accessible by selecting the corresponding parameter. For example, in PA operation mode, choose 1/5 >... -
Page 79: Figure 3-14 The Beam Setup Page And Its Elements
Press [ESCAPE] to leave a setup page. With a USB keyboard connected to the EPOCH 1000 Series, pressing the ESCAPE key also allows you to leave a setup page. The following sections describe the available setup pages. -
Page 80: Color Setup Page
910-269-EN, Rev. B, June 2011 3.3.1 Color Setup Page The Color setup page, shown in Figure 3-15 on page 68, is accessible by choosing 3/5 > Display Setup > Color Setup. Figure 3-15 The Color setup page The available parameters are: Brightness Used to adjust the screen brightness in 5 % increments or by choosing one of the preset values (0%, 25%, 50%, 75%, or 100%). -
Page 81: A-Scan Setup Page
Used to automatically turn on the VGA output at start up. 3.3.2 A-Scan Setup Page The A-Scan setup page, shown in Figure 3-16 on page 69, is accessible by choosing 3/5 > Display Setup > A-Scan Setup. Figure 3-16 A-Scan setup page EPOCH 1000 Series Software Features 69... - Page 82 910-269-EN, Rev. B, June 2011 The available parameters are: Live A-Scan Display Used to set the live A-scan drawing mode: • Outline • Filled Envelope Display Used to set the peak memory and peak hold A-scan envelope drawing mode: • Outline •...
-
Page 83: Meas Setup Page
Used to set the measurement reading box definition mode to be automatically selected based on instrument function (Auto), or to be manually defined (Manual). Description Used to select custom measurement schemes loaded using the GageView Pro interface program. EPOCH 1000 Series Software Features 71... -
Page 84: Figure 3-18 Example Of Measurement Reading Boxes With Icons
910-269-EN, Rev. B, June 2011 Reading 1 to 6 Each measurement reading box is defined independently when in manual mode. Below the reading selection parameters, an example of the measurement reading boxes is displayed to illustrate the position of the measurement being adjusted (see Figure 3-17 on page 71). - Page 85 Gate 1 Min. Amplitude Minimum amplitude in gate 1. Resets on gate adjustment and on most pulser/receiver adjustments. Gate 2 Min. Amplitude Minimum amplitude in gate 2. Resets on gate adjustment and on most pulser/receiver adjustments. EPOCH 1000 Series Software Features 73...
- Page 86 910-269-EN, Rev. B, June 2011 Table 22 Available measurement readings (continued) Icon Measurement readings Description Gate 1 Amplitude to Curve Amplitude measurement in gate 1. Displays echo height as a percentage of DAC/TVG curve height. Gate 2 Amplitude to Curve Amplitude measurement in gate 2.
- Page 87 X1 and cursor Y1 in frozen S-scan sizing mode. Cursor X1, Cursor Y1 Value of the thickness/depth Intersect Depth measurement at the intersection of cursor X1 and cursor Y1 in frozen S-scan sizing mode. EPOCH 1000 Series Software Features 75...
-
Page 88: General Setup Page
910-269-EN, Rev. B, June 2011 3.3.4 General Setup Page The General setup page, shown in Figure 3-19 on page 76, is accessible by choosing 3/5 > Inst Setup > General and allows you to configure general parameters such as the user interface language and the instrument date and time. Figure 3-19 The General setup page The available parameters are: Language... - Page 89 Used to set the day of the month for the instrument internal clock. Hour Used to set the hour for the instrument internal clock. Minute Used to set the minutes for the instrument internal clock. EPOCH 1000 Series Software Features 77...
-
Page 90: Owner Info (Inst Setup Group)
910-269-EN, Rev. B, June 2011 Mode Used to set the hour display mode (AM, PM, or 24H) for the instrument internal clock. 3.3.5 Owner Info (Inst Setup Group) The Owner Info setup page, shown in Figure 3-20 on page 78, is accessible by choosing 3/5 >... -
Page 91: Status Setup Page
The Status page allows you to enter a activate code to allow access to a software option not included with the standard package of instrument features. This is provided by an Olympus representative after the purchase of a particular software option. Refer to section 11.1 on page 195 for details on software option activation. -
Page 92: Figure 3-22 The Image Overlay Setup Page
910-269-EN, Rev. B, June 2011 Figure 3-22 The Image Overlay setup page The available parameters are: Leg Indicator Used to display a visual marker in the S-scan image representing skip distance. This parameter is active when the part thickness is defined in the 1/5 > PA Probe > Beam setup page. -
Page 93: Basic Procedures
The menu indicator identifies the selected menu (see section 3.1.1 on page 50 for details on the menu structure). Select the desired submenu using one of the following methods: a) Press the [F<n>] function key corresponding to the desired submenu button. EPOCH 1000 Series Software Features 81... -
Page 94: Navigating In A Setup Page
Press the [UP] or the [DOWN] arrow key until the desired parameter has the focus. b) With a USB mouse connected to the EPOCH 1000 Series, click the desired parameter. With a USB keyboard connected to the EPOCH 1000 Series, press the [UP] or the [DOWN] arrow keys until the desired parameter is selected. -
Page 95: Changing A Parameter Value
[P<n>] parameter key. d) With a USB mouse connected to the EPOCH 1000 Series, rotate the wheel of the mouse. With a USB keyboard connected to the EPOCH 1000 Series, press the RIGHT or the LEFT arrow key. -
Page 96: Entering An Alphanumeric Value Using The Virtual Keyboard
910-269-EN, Rev. B, June 2011 To change the value of a parameter with an editable value Select the parameter with an editable value for which you want to change the value (see section 3.4.1 on page 81 for details). The button background of the selected parameter turns to yellow, showing that it now has the focus (see section 3.1.3 on page 54 for details on the focus concept). -
Page 97: Figure 3-23 The Owner Info Setup Page With Its Virtual Keyboard
Turn the adjustment knob until the desired character is selected, and then press [CHECK] to add the character to the parameter. b) With a USB mouse connected to the EPOCH 1000 Series, click the desired character. Press and hold [2 F] while clicking a character to enter an uppercase letter. -
Page 98: Interacting With A Dialog Box
To save the entered data and exit the setup page, press [ESCAPE]. 3.4.5 Interacting With a Dialog Box The EPOCH 1000 Series software presents dialog boxes, for example during calibration, to allow you to edit the value of a parameter. The following procedure describes how to interact with a dialog box. - Page 99 910-269-EN, Rev. B, June 2011 Refer to the GageView Pro User’s Manual. EPOCH 1000 Series Software Features 87...
- Page 100 910-269-EN, Rev. B, June 2011 88 Chapter 3...
-
Page 101: Adjusting The Pulser/Receiver (Conventional Ut Mode)
910-269-EN, Rev. B, June 2011 4. Adjusting the Pulser/Receiver (Conventional UT Mode) This chapter describes how to adjust the EPOCH 1000 Series pulser/receiver in conventional ultrasound mode. The topics are as follows: • Adjusting the System Sensitivity (Gain) • Using the AUTO-XX% Feature •... -
Page 102: Using The Auto-Xx% Feature
The AUTO-XX% feature was formerly known as the AUTO-80 % in the EPOCH 4 Series. The default setting for AUTO-XX% in the EPOCH 1000 Series is 80 % full- screen height (FSH). You can adjust the FSH target value (XX) to meet the demands of the application. -
Page 103: Setting Reference Gain And Scanning Gain
910-269-EN, Rev. B, June 2011 Setting Reference Gain and Scanning Gain Establishing the current system gain as the reference (base) level is useful for inspections that require the establishment of a reference gain level, and then the addition or subtraction of scanning gain. To add scanning gain Press [2 F], [GAIN] (REF dB). -
Page 104: Pulser Adjustments
The EPOCH 1000 Series allows you to manually adjust the PRF from 5 Hz to 6000 Hz in 50 Hz (coarse) or 5 Hz (fine) increments. The instrument also has two Auto-PRF settings to automatically adjust the PRF based on screen range. -
Page 105: Pulse Energy (Voltage)
Choose 1/5 > Pulser > PRF, and then vary the setting. When needed, press [CHECK] to toggle between coarse and fine adjustment. The EPOCH 1000 Series is a single-shot instrument. This means that the instrument acquires, measures, and draws the complete A-scan with each pulse rather than using multiple acquisitions to construct a full waveform. -
Page 106: Damping
The damping control allows you to optimize the waveform shape for high resolution measurements using an internal resistive circuit. There are four damping settings on the EPOCH 1000 Series conventional ultrasound mode: 50 Ω, 100 Ω, 200 Ω, or 400 Ω. To adjust the Damping ... -
Page 107: Pulser Waveform
910-269-EN, Rev. B, June 2011 To compensate for the one-way sound path in through transmission (Thru) mode, the EPOCH 1000 Series does not divide transit time by two when calculating thickness measurements. To adjust the test mode Choose 1/5 > Pulser > Mode, and then vary the setting. -
Page 108: Pulser Frequency Selection (Pulse Width)
Try various settings with a transducer and test piece to maximize ultrasonic performance. Receiver Adjustments The receiver settings in the EPOCH 1000 Series conventional ultrasound mode are accessed from the 1/5 > Receiver submenu. The receiver parameters are: •... -
Page 109: Digital Receiver Filters
4.5.2 Digital Receiver Filters The EPOCH 1000 Series has a total instrument bandwidth of 26.5 MHz at –3 dB. The instrument offers several broadband and narrow-band digital filters. These are designed to improve the instrument’s signal-to-noise ratio by filtering out unwanted high and/or low frequency noise outside of the test frequency spectrum. -
Page 110: Advanced Filter Set
8.0 MHz to 26.5 MHz (high-pass) 4.5.2.2 Advanced Filter Set The EPOCH 1000 Series Advanced filter set takes advantage of the instrument’s unique digital receiver design and allows unprecedented filtering flexibility. There are several distinct performance advantages that result from this filter set. Specific performance improvements include: •... -
Page 111: Waveform Rectification
EN12668-1. 4.5.3 Waveform Rectification The EPOCH 1000 Series can operate in one of four different rectification modes that you can select using the 1/5 > Receiver > Rect parameter: Full-wave, Half-wave Positive, Half-wave Negative, or RF (unrectified). -
Page 112: Custom Filter Sets
Choose 1/5 > Receiver > Rect, and then vary the rectification setting. Custom Filter Sets The EPOCH 1000 Series is capable of storing custom filter sets that are developed at a customer’s request by Olympus. The AxleInspFR filter selection is an example of this custom filter design to meet the demands of a particular application. -
Page 113: Managing Special Waveform Functions (Conventional Ut Mode)
910-269-EN, Rev. B, June 2011 5. Managing Special Waveform Functions (Conventional UT Mode) This chapter describes how to manage special waveform functions. The topics are as follows: • Reject • Peak Memory • Peak Hold • Freeze • Grid Modes Reject The 1/5 >... -
Page 114: Peak Memory
910-269-EN, Rev. B, June 2011 Reject level line Figure 5-1 Horizontal line indicating the reject level Peak Memory The peak memory function enables the display to capture and store on the screen the amplitude of each A-scan acquisition. The display updates each pixel if a signal of greater amplitude is acquired. -
Page 115: Figure 5-2 Peak Memory Signal Envelope Example
910-269-EN, Rev. B, June 2011 Peak memory flag Peak memory signal envelope (green line) Current live waveform (white line) Figure 5-2 Peak memory signal envelope example This function is useful when it is necessary to find the peak from an indication during an angle beam inspection. -
Page 116: Peak Hold
[FREEZE]. Once the freeze function is activated, the pulser/receiver of the EPOCH 1000 Series becomes inactive and does not acquire any further data. A symbol appears on the right side of the screen indicating that the function is active. -
Page 117: Grid Modes
• Pulser/Receiver settings other than gain Grid Modes The EPOCH 1000 Series provides multiple grid modes for easy A-scan interpretation, depending on the application. To adjust the grid modes Choose 3/5 > Display Setup > A-Scan Setup to open the A-Scan setup page. -
Page 118: Figure 5-3 Selecting The X-Axis Grid Mode
910-269-EN, Rev. B, June 2011 Figure 5-3 Selecting the x-axis grid mode Choose the desired x-axis grid mode using the [RIGHT] and [LEFT] arrow keys, or using the corresponding direct-access [P<n>] key (see Figure 5-4 on page 107). 106 Chapter 5... -
Page 119: Figure 5-4 The X-Axis Grid Modes
910-269-EN, Rev. B, June 2011 Standard grid: traditional flaw detector view with 10 divisions equally spaced across the screen range, and the numbers 1 - 10 appearing below each division. Sound Path grid: displaying actual sound path measurements at equally spaced increments along the horizontal axis. -
Page 120: Figure 5-5 The Y-Axis Grid Modes
910-269-EN, Rev. B, June 2011 100% 110% maximum amplitude height displayed grid: on the vertical Y-Axis. 100 % 110 % Figure 5-5 The y-axis grid modes 108 Chapter 5... -
Page 121: Gates (Conventional Ut Mode)
910-269-EN, Rev. B, June 2011 6. Gates (Conventional UT Mode) This chapter describes how to use the gates in the conventional ultrasound mode of the EPOCH 1000 Series. The topics covered are as follows: • Measurement Gates 1 and 2 •... -
Page 122: Measurement Gates 1 And 2
910-269-EN, Rev. B, June 2011 Measurement Gates 1 and 2 The EPOCH 1000 Series has two independent flaw gates. In the A-scan, a gate is represented by an horizontal line. The length and horizontal position of the line identifies the sound path range, while the vertical position of the gate line represents a threshold amplitude level for echoes of interest. -
Page 123: Figure 6-2 The Gate 1 Submenu
910-269-EN, Rev. B, June 2011 Figure 6-2 The Gate 1 submenu The available gate parameters are: Zoom Used to zoom the display on the width of the gate (refer to section 6.8 on page 119 for details). Start Used to adjust the gate start position. Width Used to adjust the gate width. -
Page 124: Quickly Adjusting Basic Gate Parameters
910-269-EN, Rev. B, June 2011 Min Depth Used to adjust the minimum depth value which triggers a minimum depth alarm. Status Used to toggle the state (On and Off) of the gate. Quickly Adjusting Basic Gate Parameters You can perform basic gate adjustments using the [GATE] direct-access key. To quickly adjust the position of a gate Press the [GATE] direct-access key. -
Page 125: Interface Gate (Optional)
234. Gate Measurement Modes The EPOCH 1000 Series’ gate 1 and gate 2 provide measurements of a gated indication based on one of three possible measurements modes. You can define the measurement mode of each gate in the Gates setup page (shown in Figure 6-4 on page 114) accessible by choosing 2/5 >... -
Page 126: Figure 6-4 The Gates Setup Page
910-269-EN, Rev. B, June 2011 Figure 6-4 The Gates setup page The available parameters are: Gate n Measurement Mode Each gate can make measurements using the following modes: Edge Acquires measurement readings based on the position of the first crossing point of a gated signal. -
Page 127: Figure 6-5 Arrow Indicating Measurement Trigger In Edge, Peak, And 1Stpeak Modes
910-269-EN, Rev. B, June 2011 When a measurement is being made using one of the measurement gates, a small triangle appears on the gate to indicate from which echo/point the measurement is being acquired (Figure 6-5 on page 115). Edge Peak 1stPeak Figure 6-5 Arrow indicating measurement trigger in Edge, Peak, and 1stPeak... -
Page 128: Viewing Measurement Readings
3.3.3 on page 71. Gate Tracking and Echo-to-Echo Measurements The gate tracking feature of the EPOCH 1000 Series allows you to make echo-to-echo measurements whenever this feature is required by an application. Echo-to-echo measurements can be made between: Gate 2 – Gate 1, Gate 2 – IF Gate, and Gate 1 –... -
Page 129: Figure 6-6 Echo-To-Echo Measurement Example
910-269-EN, Rev. B, June 2011 Gate tracking maintains a constant separation between the position of the indication in the first gate and the start position of the second gate. With this dynamic mobility, the tracking gate is always positioned where you want to measure other indications. When gate tracking is active, the start position value of the tracking gate (the second gate involved in the measurement) defines the separation between the gates, not a fixed start position. -
Page 130: Operating In Time-Of-Flight Mode
G2-1 parameter (see section 3.3.3 on page 71 for details). Operating in Time-of-Flight Mode The EPOCH 1000 Series is capable of displaying time-of-flight (TOF) sound path data for a gated indication. Time-of-flight is the location of the reflector in terms of microseconds (µs). -
Page 131: Using The Zoom
910-269-EN, Rev. B, June 2011 Using the Zoom The EPOCH 1000 Series allows you to quickly zoom the screen range to provide fine resolution of a particular inspection zone. Using the zoom, the instrument automatically uses screen delay to bring the point that corresponds to the gate start to the left side of the screen and adjusts the displayed range to match the gate width. -
Page 132: Gate Alarms
In unrectified (RF) mode, these alarms can be used in positive, negative, or dual gate modes. By default, when an alarm condition is triggered, the EPOCH 1000 Series emits an audible beep. The instrument also illuminates the red indicator, above the display window, corresponding to the gate with which the alarm has been triggered. -
Page 133: Minimum Depth Alarm
6.9.2 Minimum Depth Alarm The EPOCH 1000 Series is equipped with a minimum depth alarm that is triggered whenever the current thickness measurement reading falls below an operator-defined level. The minimum depth alarm can be used either with a single gate or in echo-to- echo measurement mode. -
Page 134: Minimum Depth Alarm With Gate Tracking
6.9.4 Minimum Depth Alarm with Gate Tracking The EPOCH 1000 Series can use the minimum-depth alarm when making echo-to- echo thickness measurements with gate tracking. When gate tracking is active, the tracking gate moves side-to-side, tracking the position of the echo in the non tracking (first) gate. -
Page 135: Reference Cursors
• Cursor Measurements Cursors A and B The EPOCH 1000 Series provides two visual and measurement reference cursors that can be displayed on the instrument’s A-scan view. These cursors are controlled with parameters from the 2/5 > Ref Cursor submenu. -
Page 136: Activating And Positioning Cursors
910-269-EN, Rev. B, June 2011 Figure 7-1 A-scan with active reference cursors Reference cursors allow you to position one or two vertical lines on the A-scan display as a visual marker. These cursors represent a particular point in the screen range of the current inspection, and can represent a variety of meaningful benchmarks within the displayed range. -
Page 137: Cursor Measurements
Cursor Measurements The EPOCH 1000 Series reference cursors can also be used to display reference measurement readings. These measurements are comparative and can be made between cursors A and B, or between one cursor and a gate. Gate tracking is not available with cursors. - Page 138 910-269-EN, Rev. B, June 2011 If the gated indication used in a cursor-to-gate comparative measurement precedes the position of the cursor, the EPOCH 1000 Series displays a negative value. 126 Chapter 7...
-
Page 139: Input And Output Features
This port is a combination VGA/RS-232 port. Using the VGA output, you are able to display the full contents of the EPOCH 1000 Series screen on any device that accepts VGA input. -
Page 140: Analog Outputs
Figure 8-1 The VGA/RS-232 output connector Turn on the EPOCH 1000 Series and the VGA device. Activate the VGA output of the EPOCH 1000 Series by selecting 3/5 > Display Setup > VGA = On. The content of the instrument screen appears on the display of the VGA device. -
Page 141: Figure 8-2 The A-Out Setup Page
Used to select the scale of the output voltage based either on the full-screen range (Range) or on the gate width (GateWidth). Load<n> Used to select the value for the impedance of the peripheral device measuring the analog output of the EPOCH 1000 Series instrument. Input and Output Features 129... -
Page 142: Trigger Input And Output
Internal Standard operational mode internally controlling the pulse timing and frequency. The EPOCH 1000 Series is not affected by the external trigger input but outputs a synchronization pulse, allowing to trigger other devices at the same rate and timing as it is sending a pulse to the connected transducer(s). -
Page 143: Serial Communication (Rs-232)
EPOCH 1000 Series, but does not allow the EPOCH 1000 Series to command a peripheral device. The USB Client port is the standard port for communication with the EPOCH 1000 Series’ computer interface program, GageView Pro. -
Page 144: Serial/Usb Command Protocol
For more information regarding report printing see section 10.4 on page 188. Serial/USB Command Protocol The EPOCH 1000 Series can be remotely controlled via either the serial (RS-232) communications port or the USB client port. A comprehensive series of remote commands is available to allow access to all functions of the instrument. -
Page 145: Calibrating The Epoch 1000 Series (Conventional Ut Mode)
You must adjust the zero offset and velocity parameters of the EPOCH 1000 Series during calibration. Zero offset (sometimes referred to as probe delay) compensates for the dead time between the firing of the main bang and the entry of the sound into the test piece. -
Page 146: Getting Started
• Common Angle Beam Calibration Block Diagrams Getting Started Until you are completely comfortable operating the EPOCH 1000 Series, we recommend that a basic review and setup procedure be used prior to starting the actual calibration. To setup the EPOCH 1000 Series conventional UT mode before calibrating Press [GAIN] to select an initial gain value that is appropriate for the calibration. -
Page 147: Calibration Modes
3.3.3 on page 71. Calibration Modes The EPOCH 1000 Series features multiple calibration modes to accurately meet the requirements of the selected transducer, calibration test block, and application. These calibration modes can be adjusted in the 1/5 > Auto CAL submenu. There are two modes for straight beam transducers and two modes for angle beam transducers. -
Page 148: Straight Beam Modes
For accurate measurements, you must first verify the refracted angle of the transducer, as the EPOCH 1000 Series calculates depth values based on sound path and known refracted angle. The shallow reflector depth allows for zero offset calibration, and the deep reflector depth allows for velocity calibration. -
Page 149: Calibrating With A Straight Beam Transducer
The steps measure 0.100 in., 0.200 in., 0.300 in., 0.400 in., and 0.500 in. If the EPOCH 1000 Series is set to work in metric units, the calibration process is exactly the same, except that the entries are in millimeters rather than inches. -
Page 150: Figure 9-1 Example Of A Gated Calibration Signal
910-269-EN, Rev. B, June 2011 A thickness measurement reading appears in large text above the A-scan (see Figure 9-1 on page 138). Thickness measurement Figure 9-1 Example of a gated calibration signal Once a steady reading is achieved, choose 1/5 > Auto CAL > CAL Zero. The screen freezes and the Enter Value for Zero Cal dialog box appears (see Figure 9-2 on page 138). -
Page 151: Figure 9-3 The Second Gated Calibration Signal
10. Use the [GATE] key to position gate 1 so that the first back-wall echo from the known thickness step exceeds the gate threshold. 11. Press [GAIN] to adjust the gain setting so that the echo amplitude is at approximately 80 %. Calibrating the EPOCH 1000 Series (Conventional UT Mode) 139... -
Page 152: Calibrating With A Delay Line Transducer
0.100 in., 0.200 in., 0.300 in., 0.400 in., and 0.500 in. If the EPOCH 1000 Series is set to work in metric units, the calibration process is exactly the same, except that the entries are in millimeters rather than inches. - Page 153 Press [GAIN], and then adjust the gain value so that the echo amplitude is at approximately 80 %. A thickness measurement reading appears in large text above the A-scan (see Figure 9-4 on page 142). Calibrating the EPOCH 1000 Series (Conventional UT Mode) 141...
-
Page 154: Figure 9-4 Example Of A Gated Calibration Signal
910-269-EN, Rev. B, June 2011 Thickness measurement Figure 9-4 Example of a gated calibration signal Ensure that it is the first back-wall echo being gated, not a multiple echo from the end of the delay line tip. 10. Once a steady reading is achieved, choose 1/5 > Auto CAL > CAL Zero. The screen freezes and the Enter Value for Zero Cal dialog box appears (see Figure 9-2 on page 138). -
Page 155: Figure 9-5 The Enter Value For Zero Cal Dialog Box
(see Figure 9-6 on page 144). If for any reason you need to exit without acquiring calibration data, use the [RIGHT] and [LEFT] arrow keys to highlight Cancel, and then press [CHECK]. Calibrating the EPOCH 1000 Series (Conventional UT Mode) 143... -
Page 156: Figure 9-6 The Second Gated Calibration Signal
910-269-EN, Rev. B, June 2011 Figure 9-6 The second gated calibration signal 12. Couple the transducer to the thick calibration block step. In this example, the transducer is coupled to the 0.500 in. step. 13. Use the [GATE] key to position gate 1 so that the first back-wall echo from the known thickness step exceeds the gate threshold. -
Page 157: Calibrating With A Dual Element Transducer
It has steps measuring 0.100 in., 0.200 in., 0.300 in., 0.400 in., and 0.500 in. If the EPOCH 1000 Series is set to work in metric units, the calibration process is exactly the same, except that the entries are in millimeters rather than inches. - Page 158 If thickness measurements are to be made over a wide temperature range, it is strongly recommended to use Olympus dual transducers that are designed for high- temperature applications and that have built-in delay lines with a stable sound velocity that does not change significantly with temperature.
-
Page 159: Figure 9-7 Example Of A Gated Calibration Signal
Figure 9-7 Example of a gated calibration signal 10. Once a steady reading is achieved, Choose 1/5 > Auto CAL > CAL Zero. The screen freezes and the Enter Value for Zero Cal dialog box appears. Calibrating the EPOCH 1000 Series (Conventional UT Mode) 147... -
Page 160: Figure 9-8 The Enter Value For Zero Cal Dialog Box
910-269-EN, Rev. B, June 2011 Figure 9-8 The Enter Value for Zero Cal dialog box 11. Adjust the value to match the known thickness of the gated indication (0.100 in. in this example), and then choose Continue to continue to the second calibration step. -
Page 161: Calibrating In Echo-To-Echo Mode
Calculate to complete the calibration process. Calibrating in Echo-to-Echo Mode The sample echo-to-echo calibration described below is performed using Olympus delay line transducer part number V202-RM, with a frequency of 10.0 MHz and an element diameter of 0.25 in. (6 mm). - Page 162 2214E. The steps measure 0.100 in., 0.200 in., 0.300 in., 0.400 in., and 0.500 in. If the EPOCH 1000 Series is set to work in metric units, the calibration process is exactly the same, except that the entries are in millimeters rather than inches.
- Page 163 (see section 6.4 on page 113 for details). Ensure that gate 1 and gate 2 are capturing successive back-wall echoes, not multiple echoes from the end of the delay line tip. Calibrating the EPOCH 1000 Series (Conventional UT Mode) 151...
-
Page 164: Figure 9-10 Example Of A Gated Calibration Signal
910-269-EN, Rev. B, June 2011 Thickness measurement Figure 9-10 Example of a gated calibration signal 13. Once a steady reading is achieved, choose 1/5 > Auto CAL > CAL Velocity. The screen freezes and the Enter Value for Velocity Cal dialog box appears. Figure 9-11 The Enter Value for Velocity Cal dialog box 14. -
Page 165: Calibrating To Known Sound Path Values With An Angle Beam Transducer
The following sample angle beam calibration procedure is performed using an Olympus transducer part number A430S-SB with a frequency of 2.25 MHz and an element size of 0.625 in. x 0.625 in. The transducer is mounted on a 45° wedge, part number ABWS-6-45. -
Page 166: Locating The Beam Index Point
910-269-EN, Rev. B, June 2011 9.7.1 Locating the Beam Index Point The beam index point (BIP) is the point at which the sound leaves the wedge and enters the material with maximum energy. The following procedure provides a method to identify the BIP for your probe/wedge. To locate the BIP Couple the probe to the test block at the 0 mark. -
Page 167: Verifying The Refracted Angle
The expected refracted angle of the probe should already have been entered in the EPOCH 1000 Series in the initial steps of the calibration procedure. Although the wedge may be marked 45°, for example, the actual refracted angle could be slightly different due to the properties of the test material or the amount of wear on the wedge. -
Page 168: Figure 9-14 The Iiw Block With Probe At The 45° Mark
910-269-EN, Rev. B, June 2011 To verify the refracted angle Position the probe over the appropriate angle mark on the block (45° in this example). Figure 9-14 The IIW block with probe at the 45° mark Move the probe backward and forward to maximize the amplitude of the echo coming from the large circular hole in the side of the block. -
Page 169: Calibrating For Distance
9.10 on page 168. If the EPOCH 1000 Series is set to work in metric units, the calibration process is exactly the same, except that the entries are in millimeters rather than inches. -
Page 170: Figure 9-15 Example Of A Gated Calibration Signal
910-269-EN, Rev. B, June 2011 Thickness measurement Figure 9-15 Example of a gated calibration signal Once a steady reading is achieved, choose 1/5 > Auto CAL > CAL Zero. The screen freezes and the Enter Value for Zero Cal dialog box appears. Figure 9-16 The Enter Value for Zero Cal dialog box Adjust the value to match the known thickness of the gated indication (4.000 in. -
Page 171: Figure 9-17 The Second Gated Calibration Signal
Disregard this echo as it is usually the result of beam spreading and sound bouncing off the side of the block. Ensure that gate 1 is not over this echo. Calibrating the EPOCH 1000 Series (Conventional UT Mode) 159... -
Page 172: Calibrating For Sensitivity
910-269-EN, Rev. B, June 2011 Press [GAIN], and then adjust the gain so that the echo amplitude is at approximately 80 %. A thickness measurement reading appears in large text above the A-scan. 10. Once a steady reading is achieved, choose 1/5 > Auto CAL > CAL Velocity. The screen freezes and the Enter Value for Velocity Cal dialog box appears. -
Page 173: Figure 9-19 The Iiw Block With Probe Facing Sensitivity Hole
Use the 1/5 > Basic > Add, Scan dB, and Off parameters to make scanning gain adjustments once the reference gain (Ref) is active. For more information on these functions, please see section 4.3 on page 91. Calibrating the EPOCH 1000 Series (Conventional UT Mode) 161... -
Page 174: Calibrating To Known Depth Values With An Angle Beam Transducer
Calibrating to Known Depth Values with an Angle Beam Transducer The EPOCH 1000 Series allows you to perform distance calibration with an angle beam transducer based on the known depth of equal sized reflectors (usually side- drilled holes) instead of known sound paths. The following sample angle beam calibration details the procedure for the depth calibration. - Page 175 For information on distance calibration with other standard calibration blocks, see section 9.10 on page 168. If the EPOCH 1000 Series is set to work in metric units, the calibration process is exactly the same, except that the entries are in millimeters rather than inches.
-
Page 176: Figure 9-21 Example Of A Gated Calibration Signal
910-269-EN, Rev. B, June 2011 Use the [GATE] key to position gate 1 so that the reflection from the first side- drilled hole is exceeding the gate threshold. This reflection should be close to 0.5 in. (12.5 mm). Thickness measurement Figure 9-21 Example of a gated calibration signal Press [GAIN], and then adjust the gain so that the echo amplitude is at approximately 80 %. -
Page 177: Figure 9-22 The Enter Value For Zero Cal Dialog Box
Continue to continue to the second calibration step. If for any reason you need to exit without acquiring calibration data, use the [RIGHT] or [LEFT] arrow keys to highlight the Cancel box, and then press [CHECK]. Calibrating the EPOCH 1000 Series (Conventional UT Mode) 165... -
Page 178: Figure 9-23 The Second Gated Calibration Signal
910-269-EN, Rev. B, June 2011 Figure 9-23 The second gated calibration signal Use the [GATE] key to position gate 1 so that the reflection from the second side- drilled hole is within the gated region. This reflection should be close to 1.5 in. (38.1 mm). Press [GAIN] and adjust the gain so that the echo amplitude is at approximately 80 %. -
Page 179: Curved Surface Correction
Calculate to complete the calibration process. Curved Surface Correction The EPOCH 1000 Series provides for surface distance correction when inspecting pipes, cylinders, and other curved surfaces using an angle beam transducer. This applies only to inspections where the surface of the test piece is curved in the direction of the sound path of the transducer. -
Page 180: Common Angle Beam Calibration Block Diagrams
910-269-EN, Rev. B, June 2011 9.10 Common Angle Beam Calibration Block Diagrams Figure 9-25 on page 168 to Figure 9-31 on page 173 illustrate calibration blocks commonly used with angle beam probes. 9 in. 4 in. Figure 9-25 The ASTM E164 IIW type calibration block (P/N TB7541-1) 168 Chapter 9... -
Page 181: Figure 9-26 The Iiw Type 2 Reference Block (P/N Tb5939-1)
910-269-EN, Rev. B, June 2011 Figure 9-26 The IIW type 2 reference block (P/N TB5939-1) Calibrating the EPOCH 1000 Series (Conventional UT Mode) 169... -
Page 182: Figure 9-27 The Distance And Sensitivity Calibration (Dsc) Test Block (P/Ntb7549-1)
910-269-EN, Rev. B, June 2011 1 in. 7 in. 3 in. 5 in. Figure 9-27 The distance and sensitivity calibration (DSC) test block (P/N TB7549-1) 170 Chapter 9... -
Page 183: Figure 9-28 The Astm E164 Iiw Type Metric Calibration Block (P/N Tb1054-2)
910-269-EN, Rev. B, June 2011 225 mm 100 mm Figure 9-28 The ASTM E164 IIW type metric calibration block (P/N TB1054-2) Calibrating the EPOCH 1000 Series (Conventional UT Mode) 171... -
Page 184: Figure 9-29 The Iso 7963 Mab Calibration Block (P/N Tb1065-1)
910-269-EN, Rev. B, June 2011 Figure 9-29 The ISO 7963 MAB calibration block (P/N TB1065-1) Figure 9-30 The Navships cylindrical reflector block (P/N TB7567-1) 172 Chapter 9... -
Page 185: Figure 9-31 The 5-Step Precision Thickness Calibration Block (P/N 2214E)
910-269-EN, Rev. B, June 2011 Figure 9-31 The 5-step precision thickness calibration block (P/N 2214E) Calibrating the EPOCH 1000 Series (Conventional UT Mode) 173... - Page 186 910-269-EN, Rev. B, June 2011 174 Chapter 9...
-
Page 187: Managing The Data Logger
Hard Instrument Reset 10.1 Data Logger Overview Olympus has designed the data logger for ease of use and a wide range of file types and features for flaw detection and corrosion thickness gaging requirements. The data logger includes the following capabilities: •... -
Page 188: Data Logger Storage Capacity
• Active software feature(s) (DAC/TVG, DGS/AVG, AWS D1.1/D1.5) The EPOCH 1000 Series data logger can store over 300,000 IDs with the information listed above. All data is stored for every ID that you choose to save on the 2 GB CompactFlash card provided with each instrument. -
Page 189: Creating Data Files
910-269-EN, Rev. B, June 2011 Create Used to create a new file. Reset Used to access the instrument and database reset functions. Page Setup Used to access printing functions and removable storage setup items. First ID Used to jump the current file to the first identifier (ID) in the file. Last ID Used to jump the current file to the last identifier (ID) in the file. -
Page 190: Figure 10-1 The Create Setup Page
910-269-EN, Rev. B, June 2011 File type tab File type parameters Figure 10-1 The Create setup page In the Create setup page, choose File, and then enter a file name up to 8 characters long using the virtual keyboard or a USB keyboard. Optionally enter information for the following parameters: a) Choose Description, and then enter a file description. -
Page 191: Opening Data Files
10.3.2 Opening Data Files The EPOCH 1000 Series maintains a list of all files that have been created or downloaded to the instrument. To save information to a file, you must first open a specific file to select it as the active storage location. -
Page 192: Figure 10-2 The Open Setup Page
910-269-EN, Rev. B, June 2011 Figure 10-2 The Open setup page The list of available files appears at the top-left of the setup page. Use the [UP] and [DOWN] arrow keys to scroll through each file. The IDs stored in each file are listed on the right of the screen when the file is highlighted. -
Page 193: Figure 10-3 The File Id Review Screen
910-269-EN, Rev. B, June 2011 Figure 10-3 The File ID review screen While the focus is on a file name, five parameter functions are available at the bottom of the setup page: Open Used to open the highlighted file as the active storage location. Cancel Used to leave the setup page and return to the live screen. -
Page 194: Saving Data To Files
10.3.3 Saving Data to Files The EPOCH 1000 Series allows you to save data whenever there is an active file (survey) and an ID has been entered. Files are created by choosing 5/5 > Files > Create as described in section 10.3.1 on page 177, or in GageView Pro and transferred to the instrument. -
Page 195: File Review
Software feature/option setups 10.3.4 File Review The EPOCH 1000 Series allows you to review the full contents of saved information within each file. To access the full file content review Choose 5/5 > Files > Open to open the Open setup page. -
Page 196: Figure 10-4 The Quick Recall Dialog Box
910-269-EN, Rev. B, June 2011 Figure 10-4 The Quick Recall dialog box Only files created using the CAL file type are displayed in the quick recall setup window. To quickly recall a file using the recall setup Press [RECALL SETUP]. The Quick Recall dialog box appears. -
Page 197: Data File Types
10.3.6 Data File Types The EPOCH 1000 Series supports two file types. These files allow storage of calibration data or standard inspection data. Each file type appears as a separate tab in the Create setup page, accessible by choosing 5/5 > Files > Create. -
Page 198: Incremental
Incremental After entering a starting ID number (up to 11 alphanumeric characters in the ID Prefix and up to 10 alphanumeric characters in the ID number itself), the EPOCH 1000 Series automatically increments the subsequent ID numbers using the following incrementing rules: •... -
Page 199: Figure 10-6 Example Of An Inc File Type
910-269-EN, Rev. B, June 2011 To make the instrument increment through a range of numbers several digits wide while beginning with a single digit ID number, the maximum number of digit positions must be entered initially using leading zeroes (see Figure 10-6 on page 187). -
Page 200: Setting Up And Printing Reports
910-269-EN, Rev. B, June 2011 10.4 Setting Up and Printing Reports The EPOCH 1000 Series allows you to create basic reports on the instrument from stored or live data and print them out in the field using the USB host port of the instrument. -
Page 201: Figure 10-8 Report Example
910-269-EN, Rev. B, June 2011 Choose Printer, and then select between PCL Inkjet or PCL Laser, corresponding to the type of printer that you connect to the instrument. Optionally, choose Draft Mode = On to print a low-resolution draft of the report. Optionally, choose Color = On to print the report in color (Off for black and white). -
Page 202: Saving Screen Captures
910-269-EN, Rev. B, June 2011 10.5 Saving Screen Captures You can save screen captures of the EPOCH 1000 Series software either to the CompactFlash card included with the instrument or to a USB storage device connected to the instrument. This allows you to quickly capture live inspection data information for use in reports. -
Page 203: Instrument Resets
\Olympus-NDT\EPOCH1000\<instrument_s/n>\ScreenCapture<#>.png 10.6 Instrument Resets The EPOCH 1000 Series allows you to reset its current settings to default values, when necessary. The instrument reset parameters are available in the Resets setup page accessible by choosing 5/5 > Files > Reset. Use the [UP] and [DOWN] arrow keys to highlight the desired data set. -
Page 204: Hard Instrument Reset
The EPOCH 1000 Series allows you to perform a hard reset on the instrument. A hard reset clears the data logger and returns all settings to the factory default values. - Page 205 910-269-EN, Rev. B, June 2011 The instrument detects the presence of the file on the USB storage RESET device, performs a hard instrument reset and restarts the instrument. Allow the instrument to complete the startup process. For more information on troubleshooting tips, see chapter 18 on page 307. Managing the Data Logger 193...
- Page 206 910-269-EN, Rev. B, June 2011 194 Chapter 10...
-
Page 207: Software Features And Options (Conventional Ut Mode)
• AWS D1.1/D1.5 Weld Rating Software The EPOCH 1000 Series also has two software options available. These options are not standard inclusions of the base instrument, and must be purchased and added to the unit. These two options, interface gate and floating gate, can be activated at the time of purchase of the instrument, or can be activated remotely after purchase of the instrument. -
Page 208: Figure 11-1 The Option Key Entry Dialog Box
If a software option is not activated, you do not have access to the submenu that controls this function. Olympus can provide an activation code that is entered in the instrument and allows access to the option. This allows the software to be activated without having to return the instrument to a service center. -
Page 209: Dynamic Dac/Tvg
When a DAC curve is created in the EPOCH 1000 Series, the instrument also creates a time-varied gain (TVG) setup. TVG is used to compensate for the same factors as DAC, but the presentation is different. -
Page 210: Feature Activation And Reference Correct
910-269-EN, Rev. B, June 2011 11.2.1 Feature Activation and Reference Correct Prior to the activation of any options associated with DAC/TVG, the instrument must be properly calibrated to the material being inspected. DAC/TVG can be activated in the DAC/TVG setup page accessible by choosing 4/5 > Sizing Option > DAC/TVG (see Figure 11-2 on page 198). -
Page 211: Asme/Asme Iii Dac/Tvg
910-269-EN, Rev. B, June 2011 Once the proper selection of DAC/TVG has been made (including activation of Ref Correct where applicable), use the [ESCAPE] key to return to the live A-scan screen and begin DAC/TVG setup. Once in the live A-scan mode, a new menu appears (6/6), dedicated to DAC/TVG features. -
Page 212: Figure 11-3 First Dac Setup Step
To capture DAC points, you must move gate 1 to the echo, and then choose 6/6 > DAC Setup > Add. The EPOCH 1000 Series allows you to bring each echo used to create a DAC curve to 80 % FSH before acquiring the point. This feature can help create a more precise DAC curve, especially in the far-field. -
Page 213: Figure 11-4 Dac Setup One Point
910-269-EN, Rev. B, June 2011 Figure 11-4 DAC Setup one point Figure 11-5 on page 202 shows the EPOCH 1000 Series display when the second point has been captured. Software Features and Options (Conventional UT Mode) 201... -
Page 214: Figure 11-5 Dac Setup Two Points
910-269-EN, Rev. B, June 2011 Figure 11-5 DAC setup two points The instrument has drawn a DAC curve with three levels from the first point to the second. You have used the auto-80 % function to bring the second point to 80 % full- screen height. -
Page 215: Figure 11-6 Dac Setup Five Points
910-269-EN, Rev. B, June 2011 Figure 11-6 on page 203 shows a DAC curve after 5 points have been acquired. In this example, every point was automatically adjusted to 80 % FSH prior to capture. Figure 11-6 DAC Setup five points If you need to continue capturing points, you may increase the instrument range or increase the display delay to view echoes further out in time. -
Page 216: Figure 11-7 The Completed Dac Curve
910-269-EN, Rev. B, June 2011 Figure 11-7 The completed DAC curve Once the DAC curve is complete and the instrument is in inspection mode, the instrument provides a new set of parameters: TVGView (DAC View) This function allows you to toggle between the DAC curve acquired and the corresponding TVG setup based on the DAC curve information. -
Page 217: Figure 11-8 Completed Dac Curves In Dac View Mode
910-269-EN, Rev. B, June 2011 Figure 11-8 Completed DAC curves in DAC view mode While DAC/TVG is active, you have full control of the Range, Delay, and Zoom settings. With this you can focus on areas of interest within the DAC setup. Figure 11-9 on page 206 shows a reduced range with delay. -
Page 218: Gain Adjustment Options
In order to quickly find and identify potential defects, it is commonly required by code to increase the gain (scanning gain) on the EPOCH 1000 Series from the reference (calibration) gain for scanning purposes. However, once a potential defect is identified, this gain is usually removed to view the reflector at Ref gain level, set at calibration. -
Page 219: Figure 11-10 Asme Dac With 3 Db Scanning Gain
910-269-EN, Rev. B, June 2011 To add temporary scanning gain Press [GAIN]. Use the [UP] and [DOWN] arrow keys or the adjustment knob to increase or decrease scanning gain. Press [ESCAPE] twice to return to the 1/5 > Basic submenu. Choose 1/5 >... -
Page 220: Curve Adjustment Gain (Dac Gain Or Tvg Gain)
910-269-EN, Rev. B, June 2011 When reference correction is active, the digital comparison between a captured reflector and the DAC curve is accurate even with the scanning gain applied to the inspection provided that the gated echo is not saturated. Figure 11-11 on page 208 shows the same setup as above but with Reference Correction active. -
Page 221: Transfer Correction
A-scan and the DAC curve to continue the inspection. This is accomplished on the EPOCH 1000 Series using the curve gain (DAC curve adjustment gain). To adjust the Curve Gain Choose 6/6 >... -
Page 222: Jis Dac
DAC curve, which results in inaccurate comparisons of the test reflectors with the calibrated DAC curve. The EPOCH 1000 Series can be easily adjusted for this potential difference by adding transfer correction to the calibrated base gain after completing the DAC curve setup. -
Page 223: Figure 11-13 Custom Dac Setup
910-269-EN, Rev. B, June 2011 To activate and set up the customized curves Open the DAC/TVG setup page by choosing 4/6 > Sizing Options > DAC/TVG. Use the [RIGHT] and [LEFT] arrow keys, the adjustment knob, or the direct- access [P] keys to select the Custom DAC mode. Select Curve Type (polynomial [curved] or straight-line segments). -
Page 224: 80 % Dac
910-269-EN, Rev. B, June 2011 Figure 11-14 Completed custom DAC Once the custom DAC curve points have been captured and completed, you have full capability to toggle between DAC and TVG views, to manipulate Range, Delay, CAL Zero, and Angle, and also to add necessary scanning gain, curve gain adjustment or transfer correction. -
Page 225: Figure 11-15 Completed 20-80 Dac
910-269-EN, Rev. B, June 2011 The 20 %-80 % DAC feature takes advantage of the TVG functionality of DAC/TVG to create a DAC curve that only falls between 20 % and 80 % screen height. Any echo that falls below 20 % FSH during setup has 12 dB added to it automatically. A new DAC curve section starting at 80 % FSH is created. -
Page 226: Tvg Table
11.2.8 TVG Table The TVG table option for the EPOCH 1000 Series is a powerful tool designed to facilitate manual definition of TVG setups, including gain manipulation, fine gain adjustment, and TVG point addition or deletion. The TVG table option only applies to TVG curves. -
Page 227: Tvg Table Setup
910-269-EN, Rev. B, June 2011 Highly Attenuating Material In many highly attenuating materials, such as many composites, it takes a large amount of gain to successfully penetrate to the back wall of a particular part. This high level of gain can cause significant noise in nearer areas of the part and completely obscure any potential defects in the beginning half of the inspected material. -
Page 228: Building A Tvg With The Tvg Table
The EPOCH 1000 Series uses these points as a reference and draws a straight line, representing change in gain across the screen range, to connect each point. - Page 229 910-269-EN, Rev. B, June 2011 The TVG table has four columns: A running count of the number of points that contribute to the TVG setup. The maximum number of points is 50. Depth (TOF) The exact depth, in microseconds, along the screen range where a gain adjustment is defined.
-
Page 230: Figure 11-17 Tvg Table Being Set Up
910-269-EN, Rev. B, June 2011 Figure 11-17 TVG table being set up Use the [UP] and [DOWN] arrow keys to move up and down between rows to edit previously adjusted points. When finished, choose TVGTable Off to hide the setup table and inspect using a full-screen A-scan view. -
Page 231: Dgs/Avg
DAC or TVG method that requires that you have representative defects at various depths within a part in order to create a curve for flaw sizing. To setup DGS/AVG curves on the instrument very quickly, Olympus has developed a transducer library that is stored in the instrument’s memory. This library contains the entire Atlas Series European specification conventional transducers as well as several other transducers that are commonly used by inspectors. -
Page 232: Option Activation And Setup
If you want to use a probe that is not in the default library, you can enter the required transducer characteristics in the GageView Pro computer interface program and download them to the EPOCH 1000 Series. Probes that are downloaded to the instrument appear in the custom transducers section of the transducer library. -
Page 233: Figure 11-19 Dgs/Avg Setup Page
910-269-EN, Rev. B, June 2011 Figure 11-19 DGS/AVG setup page This screen allows you to define the exact probe being used for the inspection, and to set up the DGS/AVG curve to be drawn. There are several adjustments that can be made from this setup page: DGS/AVG Activate/Deactivate the DGS/AVG function... - Page 234 910-269-EN, Rev. B, June 2011 • Back wall • Side-drilled hole (SDH) • For angle beam probes, the available reflectors are: • K1-IIW block arc • K2-DSC block • Side-drilled hole (SDH) • Flat-bottom hole (FBH) Reflector Dia. Used for angle beam inspections only. This allows you to define the diameter of the flat-bottom hole (FBH) or side-drilled hole (SDH) used as a reference-reflector.
- Page 235 910-269-EN, Rev. B, June 2011 X Value Used for angle beam inspections only. This is the length of the transducer wedge from the BIP to the front of the wedge, and is used to remove the wedge length from the surface distance measurements. You, as a trained operator, must be aware of when it is necessary to apply values to AcvSpecimen and AcvCalBlock.
-
Page 236: Figure 11-20 Reference-Reflector Before Capture
910-269-EN, Rev. B, June 2011 Figure 11-20 Reference-reflector before capture After capturing the reference-reflector, the EPOCH 1000 Series automatically calculates the DGS/AVG curve(s) and displays them at the correct registration level amplitude on the screen. 224 Chapter 11... -
Page 237: Curve Adjustment Options
11.3.2 Curve Adjustment Options Once a DGS/AVG curve has been calculated on the EPOCH 1000 Series, it is possible to make adjustments to that curve during an inspection. These adjustments include gain adjustments allowing proper defect scanning and code-compliant defect sizing, as well as reference-reflector adjustments. -
Page 238: Dgs/Avg Curve Gain
20 % FSH. Therefore, to inspect beyond a certain depth/sound path time within a part, it is necessary to raise the gain of both the live A-scan and the DGS/AVG curve to continue the inspection. This is accomplished on the EPOCH 1000 Series using DGS/AVG curve-adjustment gain. -
Page 239: Registration Level Adjustment
This curve-height adjustment is possible because the DGS/AVG curves are calculated based on a captured reference-reflector and mathematical probe data. This allows the EPOCH 1000 Series to plot the attenuation curve (in steel) for a particular size reflector without having to acquire individual data points, as is required in a DAC/TVG setup. -
Page 240: Relative Attenuation Measurement
910-269-EN, Rev. B, June 2011 To adjust the registration level Choose 7/7 > DGS > Reg. Level to adjust the current registration-level value. 11.3.6 Relative Attenuation Measurement There are several methods for measuring the ultrasonic attenuation within a material. Often the procedure measures absolute attenuation in a material. -
Page 241: Aws D1.1/D1.5 Weld Rating Software
910-269-EN, Rev. B, June 2011 11.4 AWS D1.1/D1.5 Weld Rating Software The AWS D1.1 software option for the EPOCH 1000 Series has been created to assist you in performing inspections covered under the American Welding Society D1.1 (or D1.5) Structural Welding code for steel. This code provides inspectors with a method to classify discontinuities found in welds using ultrasonic inspection. -
Page 242: Option Activation
11.4.2 Option Activation The first step in operating the EPOCH 1000 Series for AWS D1.1 inspections is to calibrate the instrument for the transducer and test conditions. For information on the angle beam calibration of the EPOCH 1000 Series, see the calibration section of this manual or the appropriate guidelines from the American Welding Society. -
Page 243: Figure 11-23 Reference B Being Stored
910-269-EN, Rev. B, June 2011 Figure 11-23 Reference B being stored Once the Ref B value is stored, the instrument displays a live D rating of any gated indication. This live D value, which represents the defect indication rating used with the published “AWS Acceptance - Rejection Criteria”... -
Page 244: Scanning Gain
910-269-EN, Rev. B, June 2011 Figure 11-24 Active AWS with D rating 11.4.3 Scanning Gain AWS codes require that you enter a certain amount of scanning gain to the Ref B gain value. This allows you to locate flaws that might be smaller or deeper in the test piece than the reference flaw. -
Page 245: Calculating A And C Values
For A, the EPOCH 1000 Series automatically calculates the required dB value to bring the gated echo to 80 % FSH. To calculate C, the EPOCH 1000 Series uses the data in the sound path calculator to generate an attenuation factor. -
Page 246: Interface Gate
910-269-EN, Rev. B, June 2011 11.5 Interface Gate The EPOCH 1000 Series offers a third gate, the interface gate, as a software option. This interface gate is principally used in immersion applications where the water path distance between the front surface of the test material and the transducer face is continuously changing. -
Page 247: Gate Measurements And Alarms
6 on page 109. 11.6 Floating Gate The EPOCH 1000 Series features a floating gate software option. This optional gate function is used to track the peak echo amplitude at a specified gain level below that amplitude (-1 dB to –14 dB in 1 dB increments). -
Page 248: Operating In -6 Db Mode
910-269-EN, Rev. B, June 2011 IF Float Activate/Deactivate the floating gate feature for the interface gate (if available). Level Level (in dB) at which the gate tracks below the peak amplitude of the gated indication (interface gate). Figure 11-26 Floating gate setup page Once the desired setup for floating gate is adjusted, press [ESCAPE] to return to the live A-scan view and begin the inspection with floating gate features active. -
Page 249: Operating In -14 Db Mode
910-269-EN, Rev. B, June 2011 Figure 11-27 Indication using –6 dB floating gate 11.6.3 Operating in –14 dB Mode In –14 dB mode, the desired gate floats at 14 dB below the peak-echo amplitude in the gate. This corresponds to 20 % of the echo’s maximum height. Figure 11-28 on page 238 depicts gate 1 with floating gate active in the –14 dB mode. -
Page 250: Gate Alarms
910-269-EN, Rev. B, June 2011 Figure 11-28 Indication using –14 dB floating gate The floating gate option is not valid in RF mode. Also, the floating gate cannot be turned on or off while the screen is frozen. 11.6.4 Gate Alarms Individual gate alarms can be set while floating gate is active. -
Page 251: Probe And Beam Setup (Phased Array Mode)
910-269-EN, Rev. B, June 2011 12. Probe and Beam Setup (Phased Array Mode) This chapter describes how to set up a phased array probe on the EPOCH 1000 Series. The topics are as follows: • Automatic Probe Identification • Beam Setup Page •... -
Page 252: Beam Setup Page
1/5 > PA Probe > Beam. Figure 12-1 The Beam setup page The EPOCH 1000 Series phased array mode provides a sector scan (S-scan) image with associated A-scans. This S-scan creates an image using amplitude information from the full sound path range of multiple A-scans. The image is built by acquiring A-scans in regular increments between two fixed angles. -
Page 253: Probe And Wedge Selection
The name of the phased array probe connected to the instrument. This item is automatically populated with the correct probe ID name in most cases when using an Olympus phased array probe. Wedge ID The name of the wedge attached to the phased array probe. Changing the Wedge ID adjusts many of the remaining items in the Beam setup page to common settings based on the type of wedge selected. -
Page 254: Inspection Material And Geometry
910-269-EN, Rev. B, June 2011 The EPOCH 1000 Series recognizes six phased array probes as standard probes. These six probes have been designed to closely match the specifications and frequencies of common conventional transducers used in manual inspections. When one of these six probes is selected, the Wedge ID item limits possible selections to wedges that are compatible with the selected probe. -
Page 255: Focal Law Range And Resolution
(longitudinal or shear-based on wedge selection). Standard wedges are designed to be used with 1018 carbon steel. When used with other materials, the actual refracted angle might vary. Contact Olympus for more information. 12.2.3... -
Page 256: Edit Probe Setup Page
Unfocused are recommended. Focusing optimizes the transducer response for indications at a particular depth. The EPOCH 1000 Series is limited to 60 focal laws for a given probe setup. To avoid focal law setup errors, use the following formula: EndAngle StartAngle –... -
Page 257: Figure 12-3 The Edit Probe Setup Page
910-269-EN, Rev. B, June 2011 Figure 12-3 The Edit Probe setup page Probe and Beam Setup (Phased Array Mode) 245... - Page 258 910-269-EN, Rev. B, June 2011 246 Chapter 12...
-
Page 259: Adjusting The Pulser Receiver (Phased Array Mode)
The values can be reviewed using in the 1/5 > PA P/R submenu. For phased array probes that are not automatically recognized, or to allow optimization of the pulser and receiver settings, the EPOCH 1000 Series allows you to manually adjust pulser and receiver parameters. -
Page 260: Pulse Repetition Frequency (Prf)
Pulse repetition frequency (PRF) is a measurement of how often the transducer is being pulsed by the electronic circuitry in the EPOCH 1000 Series. PRF is typically adjusted based on the test method or test-piece geometry. For parts with long sound paths, it is necessary to lower the PRF to avoid wrap-around interference that results in spurious signals on the display. -
Page 261: Manual Receiver Adjustments
To maximize instrument battery life and transducer life, it is recommended that you use the Low energy setting when the application permits it. 13.3 Manual Receiver Adjustments The EPOCH 1000 Series phased array receiver settings are found in the 1/5 > PA P/R submenu. The receiver setup parameters are: •... -
Page 262: Video Filtering
13.3.2 Video Filtering The EPOCH 1000 Series allows video filtering in phased array mode. Video filtering is a digital algorithm that mathematically smoothes the shape of each A-scan. By smoothing the shape of each acquired A-scan, the instrument produces a smoothed S-scan image that is easier to interpret. -
Page 263: Digital Receiver Filters
13.3.3 Digital Receiver Filters The EPOCH 1000 Series has a total instrument bandwidth of 26.5 MHz at –3 dB. The instrument has several broadband and narrow band digital filter settings. These are designed to improve the instrument’s signal-to-noise ratio by filtering out unwanted high and/or low frequency noise outside of the test frequency spectrum. - Page 264 910-269-EN, Rev. B, June 2011 The phased array mode of the EPOCH 1000 Series can access all 37 digital filter settings available on the instrument. For a full description of these available filter sets, see chapter 4 on page 89. Based on the selected phased array probe, the instrument only allows access to a subset of all available filters during manual adjustment.
-
Page 265: Managing Phased Array Image Display
910-269-EN, Rev. B, June 2011 14. Managing Phased Array Image Display This chapter describes how to manage EPOCH 1000 Series display settings in the phased array mode. Topics are as follows: • Display View Mode • Focal Law (Angle) Selection Cursor •... -
Page 266: Figure 14-1 The Four Display View Modes
S-scan on the display. Figure 14-1 The four display view modes The EPOCH 1000 Series displays all A-scans in sound path mode only. The S-scan view is displayed in true-depth mode. This means that in A/S Vert mode, indications viewed in the selected A-scan do not line up horizontally with their corresponding point in the S-scan. -
Page 267: Focal Law (Angle) Selection Cursor
910-269-EN, Rev. B, June 2011 14.2 Focal Law (Angle) Selection Cursor The EPOCH 1000 Series features a dedicated focal law (angle) cursor on the S-scan image that identifies the currently selected A-scan. The currently selected A-scan is the viewable A-scan in A/S Vert, A/S Horz, and Ascan view modes, and is also the source of measurement readings while in phased array mode. -
Page 268: Figure 14-2 A-Scan And S-Scan With The Focal Law Cursor And The Angle Parameter Box
(red line) Figure 14-2 A-scan and S-scan with the focal law cursor and the angle parameter The EPOCH 1000 Series offers two S-scan color palettes, while operating in phased array mode. The S-scan palette allows you to identify amplitude variations in the S-scan image. A color gradient is applied to the image, which allows the instrument to visually display variation in amplitude from 0 % to 110 % FSH. -
Page 269: Figure 14-3 S-Scan Example With The Color Palette
Default setting. Full color palette from white (LOS) to red (high/saturated signal). Grey Scale Grey scale palette from black (LOS) to white (high/saturated signal). To adjust the EPOCH 1000 Series S-scan palette, choose 1/5 > PA Display > Scan Palette. Managing Phased Array Image Display 257... -
Page 270: Best Fit Mode
910-269-EN, Rev. B, June 2011 Figure 14-4 The color and the grey scale palettes 14.3 Best Fit Mode The S-scan image created during a phased array inspection displays the full sound path (as defined by [RANGE]) for each angle within the focal law range (sweep). This S-scan image is drawn on the display as a to-scale representation of the angular coverage within the test piece. -
Page 271: Figure 14-5 S-Scan Showing The Location Of Visible Defects
70° S-scan image, almost 30 % of the vertical display window used to draw the S-scan is left blank. The EPOCH 1000 Series phased array mode uses the best fit feature to rotate the S-scan image so that it uses the maximum amount of screen area possible to draw the S-scan. -
Page 272: Image And A-Scan Grid And Rulers
S-scan rulers are not correct when best fit is active. Best fit mode is automatically deactivated when freeze is activated. 14.4 Image and A-Scan Grid and Rulers The EPOCH 1000 Series phased array mode provides separate rulers for the A-scan display and S-scan display. 260 Chapter 14... -
Page 273: A-Scan Grid Mode
910-269-EN, Rev. B, June 2011 14.4.1 A-scan Grid Mode The rulers available for display on the A-scan representation are the same as in conventional ultrasound mode. They are available from the A-Scan setup page accessible by choosing 3/5 > Display Setup > A-Scan Setup. These include: Y-Axis Grid Mode Amplitude height in 100 % or 110 %. -
Page 274: Peak Memory
For a full description of the peak memory function, refer to section 5.2 on page 102. 14.6 Peak Hold The peak hold feature in the EPOCH 1000 Series phased array mode applies only to the selected A-scan display (current focal law). -
Page 275: Freeze
910-269-EN, Rev. B, June 2011 14.7 Freeze The freeze function of the EPOCH 1000 Series in phased array mode is similar to the freeze function in conventional ultrasound mode. For a full description of the freeze function, refer to section 5.4 on page 104. -
Page 276: Probe Front Cursor
910-269-EN, Rev. B, June 2011 Figure 14-7 Display setup page 14.8.1 Probe Front Cursor The probe front cursor uses the probe and wedge specifications defined in the initial phased array setup (see chapter 12 on page 239) to determine the horizontal position of the front of the transducer wedge. -
Page 277: Leg Indicators
910-269-EN, Rev. B, June 2011 Probe front cursor (vertical white line) Figure 14-8 S-scan with the probe front cursor active 14.8.2 Leg Indicators When a part thickness is defined in the Beam setup page (see chapter 12 on page 239), the instrument draws (multiple) horizontal line(s), depending on the overall inspection range, to visually indicate the part thickness on the S-scan image. -
Page 278: Grid Modes
910-269-EN, Rev. B, June 2011 Leg indicators (horizontal white lines) Figure 14-9 S-scan with the leg indicators active 14.8.3 Grid Modes The Display setup page allows you to turn grid views of the A-scan and S-scan on or off independently. To turn a grid mode on or off To open the Display setup page, choose 3/5 >... -
Page 279: Figure 14-10 A-Scan And S-Scan In Grey Scale Mode With Indication
910-269-EN, Rev. B, June 2011 In A/S Vert and A/S Horz, the x-axis grid modes of the A-scan and S-scan are directly correspondent to each other. For example, in A/S Vert screen mode with the Standard x-axis grid pattern active, the horizontally oriented A-scan grids from 0 to 10 connect with the grids on the S-scan. - Page 280 910-269-EN, Rev. B, June 2011 268 Chapter 14...
-
Page 281: Gates (Phased Array Mode)
15.2 Gate S-Scan View The EPOCH 1000 Series displays gates in both the A-scan and S-scan views. The placement of the gate(s) in A-scan view is identical to placement of the gate(s) in conventional ultrasound mode. -
Page 282: Figure 15-1 A-Scan And S-Scan With Viewable Gate
910-269-EN, Rev. B, June 2011 Other phased array instruments might display true-depth gates, which appear as straight horizontal lines on the S-scan image. These gate start and gate end positions correspond to depths within the test piece, not sound paths. True depth and sound path gates are only equivalent at the 0°... -
Page 283: Image-Sizing Cursors (Phased Array Mode)
Cursor Measurements 16.1 Cursors X and Y The EPOCH 1000 Series provides two sets of sizing cursors in phased array mode. These cursor sets are only available when freeze is active on the instrument. These two cursor sets are applied to the S-scan image to allow visual reference and sizing of image components. -
Page 284: Cursor Positioning
910-269-EN, Rev. B, June 2011 16.3 Cursor Positioning Each cursor set has two measurement cursors. This allows cursor-to-cursor measurements in the horizontal (X) and vertical (Y) directions. To position image-sizing cursors on the display Press [FREEZE] to activate freeze. Select 1/5 > PA Cursors > Cursor X = On and Cursor Y = On. Choose 1/5 >... -
Page 285: Cursor Measurements
910-269-EN, Rev. B, June 2011 16.4 Cursor Measurements The EPOCH 1000 Series image-sizing cursors allow four main types of measurements that you can select from the Reading Setup setup page accessible by choosing 3/5 > Meas Setup > Reading Setup. You can select the following cursor measurements: X2 - X1 The horizontal distance between X cursors. - Page 286 910-269-EN, Rev. B, June 2011 274 Chapter 16...
-
Page 287: Calibrating The Epoch 1000 Series (Phased Array Mode)
The EPOCH 1000 Series has an advanced auto-calibration feature, which provides a fast and easy calibration process. The following section details the procedure for calibrating the EPOCH 1000 Series for each of the parameters listed above in angle or straight beam (zero degree) mode. The topics covered are as follows: •... -
Page 288: Calibration Types
17.2 Calibration Types The EPOCH 1000 Series phased array mode requires up to three types of calibration to be performed to attain accurate distance and amplitude measurements across all focal laws within the angular coverage area (sweep). These three calibration types are described in the following sections. -
Page 289: Wedge Delay
When the currently selected focal law changes, the instrument dynamically applies the corresponding wedge delay to the measurement readings. The EPOCH 1000 Series allows you to use a single calibration step to calculate the wedge delay for all focal laws. This allows accurate measurement readings of sound path, depth, and/or surface distances for all angles of inspection through a single calibration. -
Page 290: Single Sensitivity (Gain) Calibration
2214E) is used (see Figure 9-31 on page 173 for details). If the EPOCH 1000 Series is set to work in metric units, the calibration process is exactly the same, except that the entries are in millimeters rather than inches. -
Page 291: Calibrating The Velocity With A Zero Degree Transducer
Adjust the gain so that the echo amplitude is at approximately 80 %. A thickness measurement reading appears in large text above the image. Figure 17-1 Example of gated calibration signal Calibrating the EPOCH 1000 Series (Phased Array Mode) 279... -
Page 292: Figure 17-2 The Enter Value For Thin Standard Dialog Box
910-269-EN, Rev. B, June 2011 Once a steady reading is achieved, choose 1/5 > PA CAL > Depth 1. The screen freezes and the Enter Value for Thin Standard dialog box appears. Figure 17-2 The Enter Value for Thin Standard dialog box Adjust the value to match the known thickness of the gated indication (0.200 in. -
Page 293: Figure 17-3 Example Of The Second Gated Calibration Signal
Figure 17-4 The Enter Value for Thick Standard dialog box 13. Adjust the value to match the known thickness of the gated indication (0.500 in. in this example), and then choose Continue to continue to complete the calibration process. Calibrating the EPOCH 1000 Series (Phased Array Mode) 281... -
Page 294: Calibrating The Wedge Delay With A Zero Degree Transducer
910-269-EN, Rev. B, June 2011 17.3.2 Calibrating the Wedge Delay With a Zero Degree Transducer Wedge delay can be calibrated using a discrete reflector, such as a side-drilled hole, or a back-wall reflection. In the following example the first back wall of the IIW block is used to calculate the wedge delay. -
Page 295: Figure 17-6 The Enter Value For Zero Cal Dialog Box
In this example, the uncalibrated line should look like the one shown in Figure 17-7 on page 284. Calibrating the EPOCH 1000 Series (Phased Array Mode) 283... -
Page 296: Figure 17-7 The Wedge Delay Acquisition Screen With Thickness Measurement Reading At The Top
910-269-EN, Rev. B, June 2011 Thickness measurement (yellow line) for the gated indication across all focal laws Figure 17-7 The Wedge Delay acquisition screen with thickness measurement reading at the top If necessary, move the probe back and forth to acquire uncalibrated thickness- measurement data across all focal laws. -
Page 297: Figure 17-8 A Completed Wedge Delay Calibration
Figure 17-8 A completed wedge delay calibration When using a side-drilled hole to calibrate wedge delay, it is necessary to move the probe across the side-drilled hole to acquire a thickness measurement for all focal laws. Calibrating the EPOCH 1000 Series (Phased Array Mode) 285... -
Page 298: Calibrating The Sensitivity (Gain) With A Zero Degree Transducer
910-269-EN, Rev. B, June 2011 The gated region must capture the wedge delay indication for all focal laws. If the wedge delay indication is out of the gated region for any focal law during calibration, the instrument does not properly calculate wedge delay for that/those focal laws. -
Page 299: Figure 17-9 Example Of The Captured Echo
(when that reflector is peaked up). In this example, the uncalibrated line should look like the one shown in Figure 17-10 on page 288. Calibrating the EPOCH 1000 Series (Phased Array Mode) 287... -
Page 300: Figure 17-10 The Cal Gain Acquisition Screen
910-269-EN, Rev. B, June 2011 Figure 17-10 The CAL Gain acquisition screen Move the probe back and forth over the side-drilled hole to acquire uncalibrated peak amplitude measurement data across all focal laws. To acquire the most accurate curve, move the probe slowly, use a guide when possible to avoid probe skew, and make multiple passes over the reflector. -
Page 301: Figure 17-11 The Completed Gain Calibration
In some cases, normalizing the amplitude response of a given reflector allows a more precise thickness measurement during wedge delay calibration. However, velocity calibration must always be the first calibration step. Calibrating the EPOCH 1000 Series (Phased Array Mode) 289... -
Page 302: Calibrating With An Angle Beam Transducer
910-269-EN, Rev. B, June 2011 17.4 Calibrating With an Angle Beam Transducer The procedures of the following sections use an Olympus IIW Type I carbon-steel calibration block, part number TB7541-1. To calibrate using an angle beam transducer Follow the initial setup procedure described in section 17.1 on page 275. -
Page 303: Figure 17-13 The Gated Calibration Signal
Adjust the gain so that the echo amplitude is at approximately 80 %. A thickness measurement reading appears in large text as shown in Figure 17-13 on page 291. Figure 17-13 The gated calibration signal Calibrating the EPOCH 1000 Series (Phased Array Mode) 291... -
Page 304: Figure 17-14 The Enter Value For Thin Standard Dialog Box
910-269-EN, Rev. B, June 2011 Once a steady reading is achieved, choose 1/5 > PA Cal > Depth 1. The screen freezes and the Enter Value For Thin Standard dialog box appears. Figure 17-14 The Enter Value For Thin Standard dialog box 10. -
Page 305: Figure 17-15 The Second Gated Calibration Signal
14. Once a steady reading is achieved, choose 1/5 > PA Cal > Depth 2. The screen freezes and the Enter Value For Thick Standard dialog box appears. Figure 17-16 The Enter Value For Thick Standard dialog box Calibrating the EPOCH 1000 Series (Phased Array Mode) 293... -
Page 306: Calibrating The Wedge Delay With An Angle Beam Transducer
910-269-EN, Rev. B, June 2011 15. Adjust the value to match the known thickness of the gated indication (9.000 in. in this example), and then choose Calculate to complete the calibration process. 17.4.2 Calibrating the Wedge Delay With an Angle Beam Transducer The wedge delay can be calibrated using a discrete reflector, such as a side-drilled hole, or a back-wall reflection. -
Page 307: Figure 17-17 The Transducer Coupled To The 0-Mark Of The Iiw Block
Use the [GATE] key to position gate 1 so that the first reflection from the arc of the block is exceeding the gate threshold. This reflection should be close to 4 in. (100 mm). Adjust the gain so that the echo amplitude is at approximately 80 %. Calibrating the EPOCH 1000 Series (Phased Array Mode) 295... -
Page 308: Figure 17-18 The First Echo
910-269-EN, Rev. B, June 2011 Figure 17-18 The first echo Choose 1/5 > PA Cal > Start to begin the calibration process. The screen freezes and the Enter Value for Zero Cal dialog box appears. Figure 17-19 The Enter Value for Zero Cal dialog box Adjust the value to match the known thickness of the gated indication (4.000 in. -
Page 309: Figure 17-20 The Wedge Delay Acquisition Screen
To acquire the most accurate curve, move the probe slowly. Use a guide when possible to avoid probe skew. Make multiple passes over the reflector. Calibrating the EPOCH 1000 Series (Phased Array Mode) 297... -
Page 310: Figure 17-21 The Completed Wedge Delay Calibration
910-269-EN, Rev. B, June 2011 11. Choose 1/5 > PA Cal > Erase to clear the current wedge delay curve and to redraw a new curve. If the yellow wedge delay curve saturates the screen, adjust the gain to a lower value and redraw the curve. -
Page 311: Calibrating The Sensitivity (Gain) With An Angle Beam Transducer
Use the [GATE] key to position gate 1 to surround only the first reflection from the side-drilled hole. Adjust the gain so that the echo amplitude is at approximately 80 %. Calibrating the EPOCH 1000 Series (Phased Array Mode) 299... -
Page 312: Figure 17-22 The Captured Echo
910-269-EN, Rev. B, June 2011 Figure 17-22 The captured echo Choose 1/5 > PA Cal > Add to begin the calibration process. The A-scan on the left side of the screen is replaced by a new view representing the amplitude reading (yellow line) for the gated indication across all focal laws. Ideally, this amplitude reading line should be a straight line, indicating that the instrument is making the same amplitude measurement from the same reflector at each focal law (when that reflector is peaked up). -
Page 313: Figure 17-23 The Gain Acquisition Screen
When the yellow gain curve saturates the screen, adjust the gain to a lower value and redraw the curve. 10. Choose 1/5 > PA Cal > Done to accept the drawn line and calculate sensitivity. Calibrating the EPOCH 1000 Series (Phased Array Mode) 301... -
Page 314: Figure 17-24 The Completed Gain Calibration
910-269-EN, Rev. B, June 2011 Figure 17-24 The completed gain calibration The gated region must capture the side-drilled hole indication for all focal laws. If the side-drilled hole indication is out of the gated region for any focal law during calibration, the instrument does not properly calculate sensitivity (gain) for that/those focal laws. -
Page 315: Gate Adjustment During Calibration
Figure 17-25 Wide gate with two echoes interfering The EPOCH 1000 Series allows you to adjust the start position and/or width of gate 1 while acquiring data during a calibration procedure. This allows you to use a narrow gate width to measure the amplitude/thickness of the desired calibration reflection for one subset of focal laws. -
Page 316: Calibration On And Off
17.6 Calibration On and Off The EPOCH 1000 Series allows you to toggle both the wedge delay and sensitivity (gain) calibration on and off. Both calibrations have an impact on the image displayed in the S-scan. -
Page 317: Curved Surface Correction
This feature corrects the horizontal distance and depth- to-reflector measurements based on part thickness and part diameter. The EPOCH 1000 Series allows you to correct for curved surface inspections where the transducer is placed on the outer diameter of the part, as well as inspections from the inner diameter. - Page 318 910-269-EN, Rev. B, June 2011 306 Chapter 17...
-
Page 319: Maintenance & Trouble Shooting
When needed, wash the instrument only with mild soap and water on a damp cloth. 18.2 Verifying O-Ring Gaskets and Seals The EPOCH 1000 Series contains seals that are used to protect the instrument’s internal hardware from the environment. These include: •... -
Page 320: Annual Calibration
18.4 Annual Calibration Send your EPOCH 1000 Series instrument once a year to an Olympus service center for annual calibration. The service includes calibration, o-ring gasket, and membrane seal evaluation and replacement as needed to assure environmental durability. - Page 321 (following a software update). Possible cause Interrupted, incomplete, or corrupted software update. Solution Remove the battery from the EPOCH 1000 Series as well as the AC line power. Replace the battery in the EPOCH 1000 Series. Start the unit. Symptom The instrument indefinitely stays in the start up process.
- Page 322 910-269-EN, Rev. B, June 2011 310 Chapter 18...
-
Page 323: Specifications
910-269-EN, Rev. B, June 2011 19. Specifications 19.1 General and Environmental Specifications 292 mm 123 mm 272 mm Figure 19-1 Overall EPOCH 1000 Series dimensions Specifications 311... -
Page 324: Table 23 General Specifications
910-269-EN, Rev. B, June 2011 Table 23 General specifications Parameter Value Overall dimensions 292 mm x 196 mm x 123 mm (W x H x D) 11.5 in. x 7.7 in. x 4.8 in. (see Figure 19-1 on page 311) Weight lithium-ion 3.67 kg (8.1 lb), including... -
Page 325: Channel Specifications
910-269-EN, Rev. B, June 2011 19.2 Channel Specifications Table 25 EPOCH 1000i phased array specifications Parameter Value Focal laws Physical probe 16 elements Virtual probe 16 elements Video filtering Off, Low, High Display modes A-scan, A-scan/S-scan, S-scan Image update rate 60 Hz update for all A-scans 20 Hz update for all images Table 26 Pulser specifications... -
Page 326: Table 28 Calibration Specifications
910-269-EN, Rev. B, June 2011 Table 27 Receiver specifications (continued) Parameter EPOCH 1000/1000iR/1000i EPOCH 1000i Receiver delay Not applicable 0 µs to 10 µs, 2.5 ns resolution Digital filter settings Standard filter set (EN12668-1 Automatic by probe Test & Compliant): 7 filters Advanced Filter Set (not tested to EN12668-1): 30 filters Rectification... -
Page 327: Table 30 Measurements Specifications
910-269-EN, Rev. B, June 2011 Table 29 Gates specifications (continued) Parameter EPOCH 1000/1000iR/1000i EPOCH 1000i Interface gate Optional, with gate 1 and gate 2 Not applicable tracking Gate start Variable over entire displayed range Gate width Variable from gate start to end of displayed range Gate height Variable from 2 % to 95 % FSH Alarms... -
Page 328: Input/Output Specifications
910-269-EN, Rev. B, June 2011 19.3 Input/Output Specifications Table 31 on page 316 provides the specifications for the input output signals. Table 31 Input/output specifications Parameter Value USB ports 1 USB client, 2 USB hosts (USB 1.1) Video output VGA output standard RS-232 Analog outputs 4 analog outputs, selectable 1 V/10 V full scale, 4 mA max. -
Page 329: Table 33 Pinout Of The Analog Out Connector
910-269-EN, Rev. B, June 2011 Table 32 Pinout of the ALARMS connector (continued) Signal Description Ground Ground ENCD INT X X-axis encoder increment ENCD DIR X X-axis encoder direction ENCD DIR Y Y-axis encoder direction ENCD INT Y Y-axis encoder increment SPARE IN 0 Spare input 0 EXT TRIG IN... -
Page 330: Probe And Wedges Specifications
9.6 x 10 44.6 22.5 20.0 (1.76) (0.89) (0.79) a.All probes supplied with 2.5 m cable and OmniScan style connector. For other variations contact Olympus. b.For 16-element pulse group Table 35 EPOCH 1000i supported Wedges Nominal Dimensions Probe Part Matching probes refracted beam Sweep (°) - Page 331 910-269-EN, Rev. B, June 2011 Table 35 EPOCH 1000i supported Wedges (continued) Nominal Dimensions Probe Part Matching probes refracted beam Sweep (°) in mm (in.) orientation angle (in steel) L x W x H SA12-0L 5L64-A12 0° LW –30 to 30 Normal 61.8 23.0...
- Page 332 910-269-EN, Rev. B, June 2011 320 Chapter 19...
-
Page 333: Appendix A: Sound Velocities
910-269-EN, Rev. B, June 2011 Appendix A: Sound Velocities Table 36 on page 321 lists the ultrasonic velocity in a variety of common materials. This is only a guide. The actual velocity in these materials might vary significantly due to a variety of causes, such as, composition, preferred crystallographic orientation, porosity, and temperature. - Page 334 910-269-EN, Rev. B, June 2011 Table 36 Ultrasonic velocities in a variety of common materials (continued) Material V (in./µs) V (m/s) Nickel, pure 0.222 5630 Polyamide (slow) 0.087 2200 Nylon, fast 0.102 2600 Polyethylene, high density (HDPE) 0.097 2460 Polyethylene, low density (LDPE) 0.082 2080 Polystyrene...
-
Page 335: Appendix B: Glossary
910-269-EN, Rev. B, June 2011 Appendix B: Glossary Table 37 Glossary Term Definition Acoustic impedance A material property defined as the product of sound velocity (C) and the material’s density (d). Acoustic interface The boundary between two media of different acoustic impedance. - Page 336 910-269-EN, Rev. B, June 2011 Table 37 Glossary (continued) Term Definition Attenuation The loss in acoustic energy that occurs between any two points of travel. This loss may be due to absorption, reflection, scattering, and other phenomena. Back or back-wall The echo received from the side of the specimen opposite echo the side to which the transducer is coupled.
- Page 337 910-269-EN, Rev. B, June 2011 Table 37 Glossary (continued) Term Definition Decibel (dB) A unit which compares levels of power. Two power levels P1 and P2, are said to differ by n decibels when: n = 10 ----- ...
- Page 338 910-269-EN, Rev. B, June 2011 Table 37 Glossary (continued) Term Definition Gain Used in electronics with reference to an increase in signal power; usually expressed as the ratio of the output power to the input power in decibels. Gate An electronic baseline display used to electronically monitor portions of the displayed range with reference to distance or amplitude.
- Page 339 910-269-EN, Rev. B, June 2011 Table 37 Glossary (continued) Term Definition Linearity, vertical or The characteristics of an ultrasonic test system indicating amplitude its ability to respond in a proportional manner to a range of echo amplitudes produced by specified reflectors. Linearity, horizontal The characteristics of an ultrasonic test system indicating or distance...
- Page 340 910-269-EN, Rev. B, June 2011 Table 37 Glossary (continued) Term Definition Pulse repetition rate The frequency with which the clock circuit sends its or pulse repetition trigger pulses to the sweep generator and the transmitter, frequency (PRF) usually quoted in terms of pulses per second (PPS). Range The distance represented by the entire horizontal data display.
- Page 341 910-269-EN, Rev. B, June 2011 Table 37 Glossary (continued) Term Definition Resolution The ability of the test system (instrument and transducer) to distinguish reflectors at slightly different depths. Scanning level The number of decibels of calibrated gain above the reference level added to ensure seeing potentially significant reflectors at the end of the V-path in a weld inspection.
- Page 342 910-269-EN, Rev. B, June 2011 Table 37 Glossary (continued) Term Definition Through A test method in which the vibrations emitted by one transmission transducer are directed toward, and received by, another transducer. The ratio between quantity of vibration sent and received is a measure of the integrity, or quality of the material being tested.
-
Page 343: Appendix C: Parts List
Description EP1000I-B-UEE-L EPOCH 1000 flaw detector with BNC connectors, HW I/O, US power supply, English keypad, and large transport case option Table 39 Items included with the EPOCH 1000 Series (spares can be purchased) Part Description EPXT-BAT-L Lithium-ion battery EP-MCA-X Charger/adaptor (“X”= power cord configuration) -
Page 344: Table 41 Gageview Pro Interface Program And Accessories
910-269-EN, Rev. B, June 2011 Table 41 GageView PRO interface program and accessories Part Description GAGEVIEW-PRO- GageView PRO interface program KIT-USB GAGEVIEW-PRO GageView PRO interface program (software only) Table 42 Optional hardware accessories Part Description EP4P-C-USB-6 USB client cable EPXT-EC External stand-alone battery charger EP4-CH Chest harness... -
Page 345: List Of Figures
910-269-EN, Rev. B, June 2011 List of Figures Figure 1-1 Overview of the EPOCH 1000i hardware ............20 Figure 1-2 The EPOCH 1000i hardware user interface elements ........21 Figure 1-3 General purpose keys and knob ..............22 Figure 1-4 [F<n>] and [P<n>] keys pointing to software buttons ........ - Page 346 910-269-EN, Rev. B, June 2011 Figure 3-12 Example the live-scan area in A/S Vert mode ..........58 Figure 3-13 The area displaying flags .................. 59 Figure 3-14 The Beam setup page and its elements ............67 Figure 3-15 The Color setup page ..................68 Figure 3-16 A-Scan setup page .....................
- Page 347 910-269-EN, Rev. B, June 2011 Figure 9-13 Using the peak memory to find the BIP ............155 Figure 9-14 The IIW block with probe at the 45° mark ........... 156 Figure 9-15 Example of a gated calibration signal ............158 Figure 9-16 The Enter Value for Zero Cal dialog box ............
- Page 348 910-269-EN, Rev. B, June 2011 Figure 11-14 Completed custom DAC ................. 212 Figure 11-15 Completed 20-80 DAC ..................213 Figure 11-16 Completed TVG table with table view ............216 Figure 11-17 TVG table being set up ..................218 Figure 11-18 A-scan inspection with TVG table (table view off) ........219 Figure 11-19 DGS/AVG setup page ..................
- Page 349 Figure 17-24 The completed gain calibration ..............302 Figure 17-25 Wide gate with two echoes interfering ............303 Figure 17-26 Narrow gate to capture only one echo ............304 Figure 19-1 Overall EPOCH 1000 Series dimensions ............311 List of Figures 337...
- Page 350 910-269-EN, Rev. B, June 2011 338 List of Figures...
-
Page 351: List Of Tables
910-269-EN, Rev. B, June 2011 List of Tables Table 1 Content of the rating plate label ................2 Table 2 Typographic conventions ..................16 Table 3 Revision history ..................... 17 Table 4 English keypad key description ............... 25 Table 5 Computer connection compartment connectors .......... - Page 352 Glossary ........................ 323 Table 38 EPOCH 1000 Series ultrasonic flaw detector ..........331 Table 39 Items included with the EPOCH 1000 Series (spares can be purchased) ... 331 Table 40 Instrument software options ................331 Table 41 GageView PRO interface program and accessories ........332 Table 42 Optional hardware accessories ................
-
Page 353: Index
910-269-EN, Rev. B, June 2011 Index Numerics scanning gain 91, 232 temporary scanning gain 207 100% or 110% grid mode 108 transfer correction to a completed DAC curve 20% - 80% DAC 212 5-step test block 173 transfer correction to a completed DGS/AVG curve 226 A and C accuracy, note 233 adjusting... - Page 354 910-269-EN, Rev. B, June 2011 analog out connector 20, 31, 32 operating time 43 pinout 317 replacing 46 analog outputs 128 usage instructions 45 angle beam modes 136 USB host port in compartment 33 angle beam transducer using 42 calibrating (PA) 290 beam calibrating (UT) 153 menu 240...
- Page 355 910-269-EN, Rev. B, June 2011 annual maintenance 308 blocks 168 client connector 34 file 185 hosts connector 34 full coverage, tip 276 video output connector 34, 128 gate adjustment 303 compatibility with instrument 6 modes (UT) 135 completing DGS/AVG curve setup 223 on and off 304 compliance sensitivity 277...
- Page 356 910-269-EN, Rev. B, June 2011 PA mode 271 curve completing setup 223 positioning 124, 272 curve gain 226 probe front 264 curve gain adjusting, note 226 reference 123 curve gain, adjusting 226 status 124 option activation and setup 220 curve adjustment gain 208 registration level 227 curve gain, adjusting 209 relative attenuation measurement 228...
- Page 357 910-269-EN, Rev. B, June 2011 electrical shock, danger note 4, 29 focal law EMC directive compliance 10 range and resolution 243 EN12668-1 and filter set 99 selection cursor, adjusting 255 entering freeze text information 178 disabling 105 environmental ratings 37, 312 display 263 EP-MCA, use only with EPOCH 1000 44 front panel user interface 20, 21...
- Page 358 910-269-EN, Rev. B, June 2011 display 263 input/output leg 107 connectors 31 sound path 107 features 127 standard 107 specifications 316 turning on or off 266 inspection material 242 group menu contents 61 instruction manual 5 instrument cleaning 307 handle, removable 20, 35 compatibility 6 hard reset clears data logger, caution note 192 dimensions 311...
- Page 359 910-269-EN, Rev. B, June 2011 keyboard, USB 27 models, instrument 14 keypad 24 mouse, USB 27 direct access 21 key description 25 NAVSHIPS cylindrical reflector block 172 versions 25 negative value, cursor-to-gate, note 126 knob 21, 22 note A and C accuracy 233 label, rating plate 2 acquisition for all focal laws 298 leading zeroes for instrument increment, note...
- Page 360 102, 262 calibration with known reflectors 294 function and RF mode, note 103 curve saturation 284, 298 tip 156, 161, 163 PerfectSquare technology, note 95 Olympus phased array office address ii connection cover 20, 30 technical support 11 menus 64...
- Page 361 910-269-EN, Rev. B, June 2011 power indicator 27, 40 reference status 40 correct 198 power key 21, 40 correction accuracy, note 208 preface 13 cursor, activating 124 cursors 123 adjustment method, selecting 92 gain 91 definition 248 refracted angle, verifying 156 value, adjusting 93 registration level 227 printing...
- Page 362 910-269-EN, Rev. B, June 2011 adding 91, 232 grid mode 107 scheme for scan, color 256 spare parts 332 screen capture storage, note 191 S-scan curved grid, note 267 seals, membrane 36 stand 35 selecting PRF adjustment method 92 back 20 sensitivity bottom 36 calibrating 160...
- Page 363 910-269-EN, Rev. B, June 2011 auto-calibration and single thickness test USB hosts connector 34 block 140 use only EPXT-BAT-L batteries, warning note calibration full coverage 276 43, 44, 46 coarse/fine mode 24 user interface DAC curve to 80% FSH 200 front panel 20, 21 damping 94 using...
- Page 364 910-269-EN, Rev. B, June 2011 with a zero degree transducer 282 with an angle beam transducer 294 zero degree transducer, calibrating 278 with known reflectors, note 294 zoom wedge delay curve saturation, note 284, 298 activating 119 WEEE directive 2, 9 applications 119 352 Index...