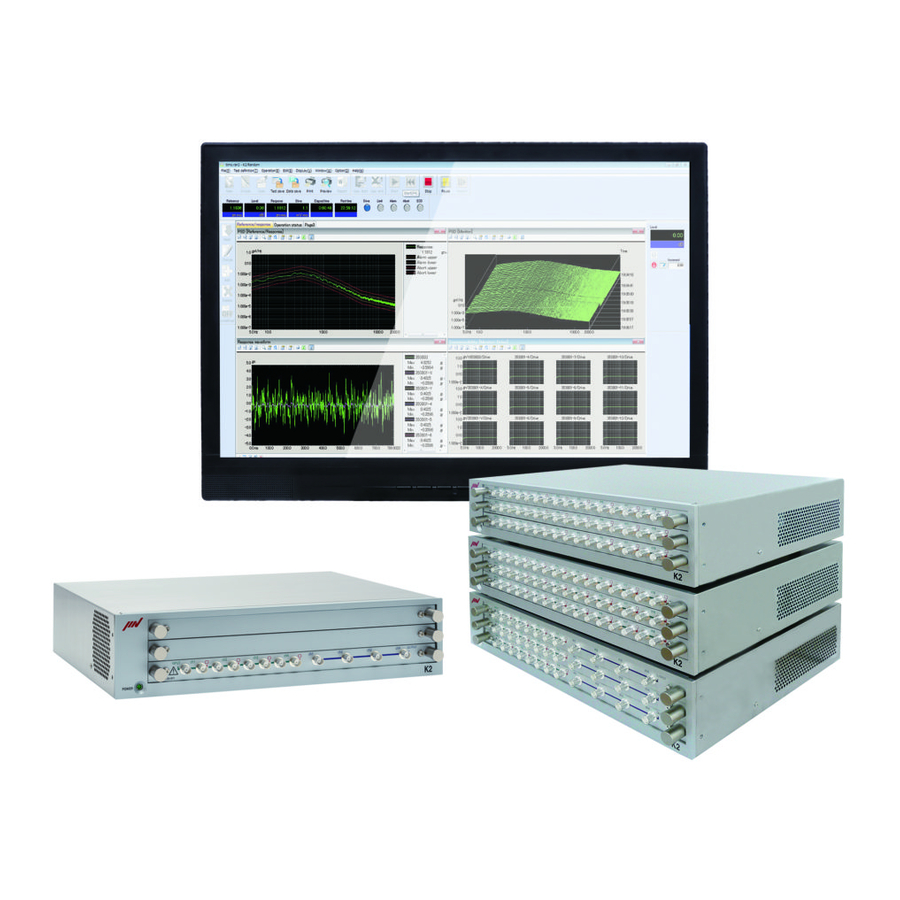
IMV K2 Instruction Manual
Multi-degree-of-freedom sine vibration control system
Hide thumbs
Also See for K2:
- Instruction manual (237 pages) ,
- Instruction manual (156 pages) ,
- Instruction manual (186 pages)

Subscribe to Our Youtube Channel
Related Manuals for IMV K2


Summary of Contents for IMV K2
- Page 1 Multi-Degree-Of-Freedom Sine Vibration Control System Multi-SINE Instruction Manual IMV CORPORATION...
- Page 2 Type of document Instruction manual System applied Software <K2/Multi-SINE> later than Version 14.3.0...
- Page 3 Japanese edition Version Date Contents 6.0.0 2010.12.01 First edition 6.1.0 2011.09.26 Additional description of “Minimum value control” 10.0.0 2013.08.09 Renewal of screen display, modified description of test files and modified description of input channels 13.0.0 2017.03.10 Additional description of the setting for skip of saving data files of auto-save at each sweep turnover (or spot repeat), correction of misprints 13.5.0 2017.06.27...
-
Page 5: Table Of Contents
Chapter 1 Outline of the System............1-1 1.1 Specifications ..............1-1 1.1.1 Multi-SINE ..............1-1 1.1.2 Limit Control (Option of Multi-SINE) ........1-3 Chapter 2 Operation System of K2 Application ..........2-1 2.1 Outline ................2-1 2.2 Test File ................. 2-2 2.3 Test Type ................. 2-2 Chapter 3 Basic Operation.............. - Page 6 4.4.3.6.2 Output voltage ..........4-18 4.4.3.6.3 Severity ............4-18 4.4.3.6.4 Environment noise limit ........4-19 4.4.3.6.5 Response linearity check ........4-19 4.4.3.6.6 Response upper limit check ........4-19 4.5 Control reference ..............4-20 4.5.1 Sweep test ..............4-21 4.5.1.1 Sweep mode............4-21 4.5.1.2 Direction.............
- Page 7 4.5.3.1 Simplified definition ..........4-36 4.5.3.2 Detailed definition (Constant) ........4-37 4.5.3.2.1 Break point / Frequency (Constant) ......4-38 4.5.3.2.2 Break point / Level (Constant) ........4-38 4.5.3.3 Detailed Definition (Interpolation) ........4-39 4.5.3.3.1 Type of interpolation ........... 4-40 4.5.3.3.2 Unit of slope ........... 4-40 4.5.3.3.3 Break Point / Frequency (Interpolation) ......
- Page 8 Chapter 5 Messages and Meanings ............5-1 5.1 Multi-SINE Error Messages ............5-1 Chapter 6 Supplemental Explanation ............6-1 6.1 Timer ................6-1 6.2 Set Up ................6-2 6.3 Manual Operation ..............6-4 6.4 Using / Deleting of Live Data in Operation ........6-7 6.4.1 Using of Live Data in Operation ..........
-
Page 9: Chapter 1 Outline Of The System
Chapter 1 Outline of the System 1.1 Specifications 1.1.1 Multi-SINE (1) Control Method : ①Amplitude Control Portion :Level control of the swept sine waveform by using the feed-back method ②Phase Control Portion:Real time waveform control by using the feedforward method(Cross-talk control between each axis)... - Page 10 (9) Output Channel : (However, it may be limited by conditions.) 1) Number of channels : maximum 16 2) Waveform distortion : Less than 0.1 % (1V rms) Analysis / Display Data (10) In Level measurement of Multi-SINE, it is assumed that the object signal for measurement is the sine wave having the same frequency as the rated SINE force.
-
Page 11: Limit Control (Option Of Multi-Sine)
1.1.2 Limit Control (Option of Multi-SINE) (1) Method Observation Level is given to each limit control channel. Number of Channels All the input channels are available to be used (however, the license is needed to be set.) Objective Physical Quantities Physical quantity having a different unit from controlled variables is available to be used as a Limit Control Channel. -
Page 12: Chapter 2 Operation System Of K2 Application
The commands used frequently are displayed as icons in each Tool bar. A command is executed or a dialog box corresponding to the command is opened when the icon is clicked. Operation status of K2 Controller is displayed in Status bar. The state during the excitation operation is displayed in Operation status panel. -
Page 13: Test File
2.2 Test File In K2 application, necessary information to operate a test is saved in a specified file called ‘Test file’ . Following kinds of Test file are available in this system. Necessary Test Files for test operation ・Test Definition File : The file created inVer10.0.0.0 or later K2Multi-SINE(*.mswp2, *.mspt2)... -
Page 14: Chapter 3 Basic Operation
Chapter 3 Basic Operation 3.1 Sweep (Simplified definition) < Example > An example of sweep test is described as below ;(two shakers are used) [Reference pattern] Acceleration [m/s Displacement: 1.0[mm] 20.0 31.83 2000 Frequency [Hz] [Test time] Sweep rate : 1.000 (octave/min) The times of double sweep : 1 (double-sweep) [Information of sensors to be used] Two acceleration pickups of piezoelectric :... - Page 15 < Procedures > < Step 1 > Press the button of [New] to start new definition. < Step 2 > Select the item of ‘Sweep’ in Test type. 3 - 2...
- Page 16 < Step 3 > Select an excitation system from the list of ‘Excitation System Information’. < Step 4 > Click the checkbox of ‘Input Environment Information’ and select an input environment information from the list. ① ② 3 - 3...
- Page 17 < Step 5 > Press the [OK] button. < Step 6 > Press the button of [Next] to go to the next definition. 3 - 4...
- Page 18 < Step 7 > Press [OK]. < Step 8 > Press the button of [Next] to go to the next definition. 3 - 5...
- Page 19 < Step 9 > Press [OK]. < Step 10 > Press the button of [Next] to go to the next definition. 3 - 6...
- Page 20 <Step11> Select an excitation group among the available excitation groups. Here, select ‘Grp1’ and press the button to add. ① ② <Step12> Input the values to ‘XFR loop check voltage‘ as 40 [mVrms].and ‘XFR function measurement voltage’as 80.0 [mVrms]. Then press [OK]. ①...
- Page 21 <Step13> Select an excitation group in the available excitation groups. Here, select ‘Grp2’ and press the button to add. ① ② <Step14> Input the values to ‘XFR loop check voltage‘ as 40 [mVrms].and ‘XFR function measurement voltage’as 80.0 [mVrms]. Then press [OK]. ②...
- Page 22 < Step 15 > Press [OK]. < Step 16 > Press the button of [Next] to go to the next definition. 3 - 9...
- Page 23 < Step 17 > Select the item of ‘Simplified definition (Specify by level and frequency range only)’ and press [Next]. ① ② < Step 18 > Input the values to ‘Frequency range’ as 10~2000.0 [Hz]. Check the item of ‘Acc. (Acceleration)’ and input as 20.0 [m/s ①...
- Page 24 < Step 19 > Check the item of ‘Disp. (Displacement)’ and input as 1 [mm]. Then press [OK]. ① ③ ② < Step 20 > Press [OK]. 3 - 11...
- Page 25 < Step 21 > Input the value to ‘Sweep rate’ as 1.000 [octave/min]. And press [OK]. <Step 22> Select a group name, ‘Grp1’. Then press the definition button. ② ① 3 - 12...
- Page 26 <Step 23> Select a group name, ‘Grp2’. Then press the definition button. ① ② < Step 24 > Press [OK]. 3 - 13...
- Page 27 < Step 25 > Press the button of [Next] to go to the next definition. <Step 26> Select a channel name, ‘Ch1’ in the list of input channels. Then Set the channel type to Principal Control and the excitation group to ‘Grp1’ ①...
- Page 28 <Step 27> Select a channel name, ‘Ch2’ in the list of input channels. Then Set the channel type to Principal Control and the excitation group to ‘Grp2’ ① ② ③ < Step 28 > Press [OK]. 3 - 15...
- Page 29 < Step 29 > Press the button of [Next] to go to the next definition. < Step30 > Select ‘Not save’ and press the button of [OK]. ① ② 3 - 16...
- Page 30 < Step31 > The definition is completed. 3 - 17...
- Page 31 < Save test > < Step 1 > Press the button of [Test Save]. < Step 2 > Input a name in ‘File name’ and press [Save]. ① ② 3 - 18...
- Page 32 < Operation of test > < Step 1 > Press the button of [Operation start]. 3 - 19...
- Page 33 <Step 2> Press the button of XFR measurement start. Initial loop check is automatically operated and the XFR measurement is started. The system proceeds to the state of waiting for excitation start when the XFR measurement is finished. 3 - 20...
- Page 34 <Step 3> Press the button of operation start. Initial loop check and initial equalization are automatically operated. 3 - 21...
- Page 35 < Step 4 > Test operation is completed when the test time passed. The system returns to the test definition mode by pressing the [Operation end] button. 3 - 22...
-
Page 36: Sweep (Detailed Definition Break Point)
3.2 Sweep (Detailed Definition Break Point) < Example > An example of sweep test is described as below ; (two shakers are used) [Reference pattern] Acceleration [m/s Slope:-3[dB/oct] Slope:0[dB/oct] 2000 300 500 Frequency[Hz] [Test time] Sweep rate : 1.000 (octave/min) The times of double sweep : 1 (double-sweep) [Information of sensors to be used] Two acceleration pickups of piezoelectric... - Page 37 < Procedures > < Step 1 > Press the button of [New] to start new definition. < Step 2 > Select the item of ‘Sweep’ in Test type. 3 - 24...
- Page 38 < Step 3 > Select an excitation system from the list of ‘Excitation System Information’. < Step 4 > Click the checkbox of ‘Input Environment Information’ and select an input environment information from the list. ① ② 3 - 25...
- Page 39 < Step 5 > Press the [OK] button. < Step 6 > Press the button of [Next] to go to the next definition. 3 - 26...
- Page 40 < Step 7 > Press [OK]. < Step 8 > Press the button of [Next] to go to the next definition. 3 - 27...
- Page 41 < Step 9 > Press [OK]. < Step 10 > Press the button of [Next] to go to the next definition. 3 - 28...
- Page 42 <Step 11> Select an excitation group among the available excitation groups. Here, select ‘Grp1’ and press the button to add. ① ② <Step 12> Input the values to ‘XFR loop check voltage‘ as 40 [mVrms].and ‘XFR function measurement voltage’as 80.0 [mVrms]. Then press [OK]. ①...
- Page 43 <Step 13> Select an excitation group in the available excitation groups. Here, select ‘Grp2’ and press the button to add. ① ② <Step 14> Input the values to ‘XFR loop check voltage‘ as 40 [mVrms].and ‘XFR function measurement voltage’as 80.0 [mVrms]. Then press [OK]. ①...
- Page 44 <Step 15> Press [OK]. < Step 16 > Press the button of [Next] to go to the next definition. 3 - 31...
- Page 45 < Step 17 > Select the item of ‘Detailed definition (Break point)’. And select ‘Interpolation’. Then press [Next]. ① ② ③ < Step 18 > Select ‘Level’. Specify Type of interpolation as ‘Frequency : Log – Level : Log’ and Unit of slope as ‘dB/octave’.
- Page 46 < Step 19 > Input the values to ‘Frequency’ as 30 [Hz] and ‘Level’ as 5.0 [m/s ]. And press the [Add] button. ② ① < Step 20 > Input the values to ‘Frequency’ as 100 [Hz] and ‘Level’ as 10.0 [m/s ].
- Page 47 < Step 21 > Select ‘Slope’. Input the values to ‘Frequency’ as 300 [Hz] and ‘Slope’ as 0.0 [dB/octave]. And press the [Add] button. ① ③ ② < Step 22 > Select ‘Level’. Input the values to ‘Frequency’ as 500 [Hz] and ‘Level’ as 20.0 [m/s ].
- Page 48 < Step 23 > Select ‘Slope’. Input the values to ‘Frequency’ as 2000 [Hz] and ‘Slope’ as -3.0 [dB/octave]. And press the [Add] button. Then press [OK]. ① ③ ④ ② < Step 24 > Press the [OK] button. 3 - 35...
- Page 49 < Step 25 > Input the value to ‘Sweep rate’ as 1.000 [octave/min]. <Step 26> Select a group name, ‘Grp1’. Then press the definition button. ② ① 3 - 36...
- Page 50 <Step 27> Select a group name, ‘Grp2’. Then press the definition button. ② ① < Step 28 > Press [OK]. 3 - 37...
- Page 51 < Step 29 > Press the button of [Next] to go to the next definition. <Step 30> Select a channel name, ‘Ch1’ in the list of input channels. Then Set the channel type to Principal Control and the excitation group to ‘Grp1’ ①...
- Page 52 <Step 31> Select a channel name, ‘Ch2’ in the list of input channels. Then Set the channel type to Principal Control and the excitation group to ‘Grp2’ ① ② ③ < Step 32 > Press [OK]. 3 - 39...
- Page 53 < Step 33 > Press the button of [Next] to go to the next definition. < Step34 > Select ‘Not save’ and press the button of [OK]. ① ② 3 - 40...
- Page 54 < Step35 > The definition is completed. 3 - 41...
- Page 55 < Save test > < Step 1 > Press the button of [Test Save]. < Step 2 > Input a name in ‘File name’ and press [Save]. ② ① 3 - 42...
- Page 56 < Operation of test > < Step 1 > Press the button of [Operation start]. 3 - 43...
- Page 57 <Step 2> Press the button of XFR measurement start. Initial loop check is automatically operated and the XFR measurement is started. The system proceeds to the state of waiting for excitation start when the XFR measurement is finished. 3 - 44...
- Page 58 <Step 3> Press the button of operation start. Initial loop check and initial equalization are automatically operated. 3 - 45...
- Page 59 < Step 4 > Test operation is completed when the test time passed. The system returns to the test definition mode by pressing the [Operation end] button. 3 - 46...
-
Page 60: Spot Test
3.3 Spot Test < Example > An example of Spot test is described as below ; ( two shakers are used. ) [Reference pattern] The relation of Frequency and Level in the following list specifies a spot. Frequency Level Stay time 200[Hz] 100[m/s 0-p]... - Page 61 < Procedures > < Step 1 > Press the button of [New] to start new definition. < Step 2 > Select the item of ‘Spot test’ in Test type. 3 - 48...
- Page 62 < Step 3 > Select an excitation system from the list of ‘Excitation System Information’. < Step 4 > Click the checkbox of ‘Input Environment Information’ and select an input environment information from the list. ① ② 3 - 49...
- Page 63 < Step 5 > Press the [OK] button. < Step 6 > Press the button of [Next] to go to the next definition. 3 - 50...
- Page 64 < Step 7 > Press [OK]. < Step 8 > Press the button of [Next] to go to the next definition. 3 - 51...
- Page 65 < Step 9 > Press [OK]. < Step 10 > Press the button of [Next] to go to the next definition. 3 - 52...
- Page 66 <Step 11> Select an excitation group among the available excitation groups. Here, select ‘Grp1’ and press the button to add. ① ② <Step 12> Input the values to ‘XFR loop check voltage‘ as 40 [mVrms].and ‘XFR function measurement voltage’as 80.0 [mVrms]. Then press [OK]. ①...
- Page 67 <Step 13> Select an excitation group in the available excitation groups. Here, select ‘Grp2’ and press the button to add. ① ② <Step 14> Input the values to ‘XFR loop check voltage‘ as 40 [mVrms].and ‘XFR function measurement voltage’as 80.0 [mVrms]. Then press [OK]. ①...
- Page 68 < Step 15 > Press [OK]. < Step 16 > Press the button of [Next] to go to the next definition. 3 - 55...
- Page 69 < Step 17 > Input the values to ‘Frequency’ as 200 [Hz], ‘Level’ as 100 [m/s 0-p] and ‘Stay time’ as 10:00 [sec] (10 minutes). Press the [Add] button. ① ② ④ ③ 3 - 56...
- Page 70 < Step 18 > As in the same procedure, input the value to ‘Frequency’ as 5 [Hz], ‘Level’ as 21 [mm p-p] and ‘Stay time’ as 100 [cycle]. Press the [Add] button. ① ② ④ ③ 3 - 57...
- Page 71 < Step 19 > As in the same procedure, input the value to ‘Frequency’ as 500 [Hz], ‘Level’ as 5 [cm/s 0-p] and ‘Stay time’ as 300 [kcycle]. Press the [Add] button. ① ② ④ ③ 3 - 58...
- Page 72 <Step 20> Select a group name, ‘Grp1’. Then press the definition button. ② ① 3 - 59...
- Page 73 <Step 21> Select a group name, ‘Grp2’. Then press the definition button. ① ② 3 - 60...
- Page 74 < Step 22 > Press [OK]. 3 - 61...
- Page 75 < Step 23 > Press the button of [Next] to go to the next definition. 3 - 62...
- Page 76 <Step 24> Select a channel name, ‘Ch1’ in the list of input channels. Then Set the channel type to Principal Control and the excitation group to ‘Grp1’ ① ② ③ <Step 25> Select a channel name, ‘Ch2’ in the list of input channels. Then Set the channel type to Principal Control and the excitation group to ‘Grp2’...
- Page 77 < Step 26 > Press [OK]. < Step 27 > Press the button of [Next] to go to the next definition. 3 - 64...
- Page 78 < Step28 > Select ‘Not save’ and press the button of [OK]. < Step29 > The definition is completed. 3 - 65...
- Page 79 < Save test > < Step 1 > Press the button of [Test save]. < Step 2 > Input a name in ‘File name’ and press [Save]. ① ② 3 - 66...
- Page 80 < Operation of test > < Step 1 > Press the button of [Operation start]. 3 - 67...
- Page 81 <Step 2> Press the button of XFR measurement start. Initial loop check is automatically operated and the XFR measurement is started. The system proceeds to the state of waiting for excitation start when the XFR measurement is finished. 3 - 68...
- Page 82 <Step 3> Press the button of operation start. Initial loop check and initial equalization are automatically operated. 3 - 69...
- Page 83 < Step 4 > Test operation is completed when the test time passed. The system returns to the test definition mode by pressing the [Operation end] button. 3 - 70...
-
Page 84: Chapter 4 Test Definition
Chapter 4 Test Definition 4.1 Outline In this system, the series of necessary information to operate a test is called ‘Test’. It is necessary to define a ‘Test’ at first for the test operation when a specified test is wanted to be operated. -
Page 85: Fundamental/Control Condition
4.2.1 Controlled variable (1) Meaning Unit of physical quantity (controlled variable) used as a control objective for K2 controller is specified. Control unit defined in this item is treated as a unit in test definition. A unit specified in ‘Other units’ is added as a control unit only when the rating information of ‘Other units’... -
Page 86: Peak Amplitude Estimation
4.2.3 Peak amplitude estimation (1) Meaning For calculating the amplitude (peak level) of a response signal waveform or the control channel, a method of Peak Amplitude Estimation is selected from the following five types ; 1. rms Equivalent peak estimation method by rms (Root Mean Square) value : That is, under the assumption that the response waveform is a sinusoid having the frequency of controlled value, the following processing is done ;... -
Page 87: Loop Check
results lager (that is, a severer testing will be operated here). 4. Max. peak For each cycle of response waveform signal, the peak values at plus (+) and minus (-) direction are detected. The larger detected peak value (the maximum absolute value of response waveform data for a cycle) is averaged by frequency of analysis. -
Page 88: Equalization Mode
A : Pre-check In the state of waiting for the excitation start, when the environment noise (ambient noise) inputted to the input channels is measured just after pressing the button for excitation start, the gain of the excitation system is checked whether it is normal or not before the control operation starts. -
Page 89: Shutdown Time
1. Sharp This item is for setting of the control at a faster response speed. For controlled system with instability of the response, when the resonance magnification is too high, the control may become unstable and the ‘hunting’ may occur by this setting. 2. - Page 90 When ‘Specify’ is selected or the button of Detailed Definition is pressed, the parameter for the setting of Shutdown Time can be defined arbitrary. In this case, the detailed Definition dialog of the Shutdown Time appears and the suitable values can be inputted to each parameter. The standard values provided in this system are as follows ;...
-
Page 91: Multi-Axis/Multi-Point Control Condition
4.3 Multi-axis/multi-point control condition The items for the condition of waveform control are defined in the multi-axis / multi-point operation. 4.3.1 Frequency Resolution (1) Meaning This item is for specifying of the Resolution (Line Number) of FFT. For avoiding the complication of the setting, the Resolution (Line Number) of FFT is defined at the proper value in this system. -
Page 92: Cross-Talk Control
2) XFR measurement excitation The excitation of transfer function matrix measurement is operated by drive output signals defined as XFR measurement output voltage of the excitation groups. This item specifies the excitation times for the measurement. Also, the spectrum of excitation drive signal is controlled for the purpose of utilizing the measurement as much as possible;... - Page 93 In general, the regularization process yields a smaller drive signal (the larger the regularization parameter is set, the smaller the drive signal becomes). The name of this item is derived from this relation. This item is effective only if the calculation of the equalization matrix G is unstable. Drive saving is not any kind of actual energy-saving measure to achieve the same result.
- Page 94 The selection range is described as follows : Stricter solution : The regularization stated above is not almost done, but a strict mathematical solution is searched. When the solution is unstable or almost unstable, too large a drive voltage may be given. In this event, actual excitation may be impossible, so Stricter Solution is insubstantial.
-
Page 95: Multi-Axis/Multi-Point Control Speed
4.3.5 Multi-axis/multi-point control speed (1) Meaning Generally, the concept of Multi-Shaker Control Speed means the pursuing ability of the transfer function change in the controlled system during the control operation. In Multi-Shaker Control, especially, the phase information of the transfer function in the controlled system is important. - Page 96 effective for using the control of the hydraulic shaker. 4. Specify (or Detail Definition button) Control parameter set of Multi- axis / multi- point control speed is properly defined according to the setting of ‘Fast’, ‘Normal’ and ‘Slow’. However, this item is provided for the testing with a specimen which is too difficult to control by the setting of the standard items.
-
Page 97: Excitation Group
4.4 Excitation group Excitation groups/output system for control is defined. 4.4.1 Outline (1) Meaning The set of parameters concerning the excitation systems is called as ‘excitation group’. The excitation and output system composed by the test definition are fixed on the basis of the excitation group defined in this item. -
Page 98: Excitation Group Configuration
4.4.2 Excitation group configuration (1) Meaning This item is for setting the used excitation group by operating the buttons in the display of excitation group configuration. However, only one excitation group can be defined for single group of the excitation group configuration. -
Page 99: Excitation Group Information
4.4.3 Excitation group information Excitation group information of each excitation group is defined. 4.4.3.1 XFR loop check voltage (1) Meaning The system checks whether the control loop is normal before XFR measurement. The system outputs the drive of white-noize signal defined as ‘XFR loop check voltage’ for this loop check. -
Page 100: Initial Output Voltage
components to be equalized to have almost flat spectrum, mark the checkbox for “Excited by white noise”. This input system is designed to be flexible. Therefore the input channels are not corresponding to a specific shaker (but to an excitation group). 4.4.3.3 Initial output voltage (1) Meaning ‘Initial output voltage’... -
Page 101: Operate Initial Loop Check
4.4.3.6 Operate initial loop check (1) Outline Two types of loop check are available in this system ; A : Initial loop check This loop check is operated just after the excitation start button was pressed in the waiting state for excitation start. Before the control operation start, the environment noise (ambient noise) inputted to the input channel is measured and the gain of the excitation system is checked whether it is normal or not. -
Page 102: Environment Noise Limit
Following three types are available in this system ; 1. Severe : The severest criterion is set. It can be used for a specimen with a small resonance characteristics and a good linearity. 2. Normal : The criterion allows an ordinary level of resonance characteristics and non- linearity. -
Page 103: Control Reference
4.5 Control reference This item is for setting of the control reference, and the testing pattern us decided by this item. For the definition of this item, because the definition format peculiar to each test type is needed, the different definition methods are provided for each test type. However, the main definition contents for the control reference are basically the same for each test type. -
Page 104: Sweep Test
4.5.1 Sweep test (1) Outline This item is for defining the control reference for Sweep test. Sweep test is the most popular testing method in the sine vibration tests. In this test, the sine control is executed with changing the frequency continuously according to the specified condition. -
Page 105: Direction
2. Log sweep This item is for setting of the sweep mode of which frequency f is expressed by an exponential function of the elapsed time t ; f = f ・exp(R・t) That is, this Sweep is the type of which logarithm of frequency f varies proportionally to the elapsed time t, and it is called ‘Log Sweep’. -
Page 106: Sweep Rate
When this item is selected, a ‘single-sweep’ or a ‘double-sweep’ is used as a unit for setting of Sweep Count. In case of the setting by ‘single-sweep’, ‘f2→f1’ or ‘f1→f2’ is treated for one time of Sweep Count. In case of the setting by ‘double-sweep’, ‘f2 →f1→f2’... -
Page 107: Sweep Pause Time
4.5.1.5 Sweep pause time (1) Meaning This item is for setting of the time for signal output stop (Sweep pause time) at the turning of the sweeping between the points at the ending of a sweep and at the beginning of the next sweep. -
Page 108: Zero Reference
‘double sweep’ is available to be selected only when the direction is specified as ‘Forward double’ or ‘Backward double’. And ‘double-sweep’ is used as the unit of a sweep. The sweeping is operated as below with specifying ‘double-sweep’ as the unit of sweeping and setting the sweep times to 2 ;... -
Page 109: Relative Phase
4.5.1.11 Relative Phase (1) Meaning This item is for setting of the phase of the control reference for the Excitation Group. The phase is set as a relative value to the control reference of the whole testing which is specified as ‘zero degree’. 4 –26... -
Page 110: Spot Test
4.5.2 Spot test (1) Outline This item is for defining the control reference for Spot test. In Spot test, the frequency and the reference level at which the excitation is executed are specified at first, and the testing operation of the set condition is executed in order. Therefore, the sweeping is not done in Spot test. -
Page 111: Spot Reference Definition
4.5.2.1 Spot Reference definition (1) Meaning This item is for defining the spot element. The buttons described as below are usable in the definition dialog. Spot elements can be registered for maximum 9999. [Add] : This button is for registering of a new spot element. A spot element is to be registered and displayed in the list of the definition by pressing of this button after the necessary items to define a spot element such as frequency and reference level were set. -
Page 112: Frequency
4.5.2.1.1 Frequency (1) Meaning This item is for setting of the excitation frequency of a spot element. 4.5.2.1.2 Level (1) Meaning This item is for setting of the reference level for the spot element. The unit or the reference level is to be selected among ‘Acceleration / Velocity / Displacement’... -
Page 113: Stay Time
4.5.2.1.4 Stay time (1) Meaning This item is for setting of Stay time for a spot element. Stay time is to be measured when the excitation level is set as the specified level and the control becomes stationary. 4.5.2.2 Auto-generation condition of the spot by profile (1) Outline This function is for generating the fixed frequency excitation of the frequency sequence defined by the specified spacing. -
Page 114: Generating Mode
4.5.2.2.1 Generating mode (1) Meaning Available generation modes of spot are ‘Log (equivalent ratio)’ and ‘Linear (equivalent ratio)’. 4.5.2.2.2 Generation interval (1) Meaning This item is for defining of the frequency interval at each spot. The definition methods are different according to the Generating mode. Spot interval is set by ‘equivalent interval’... -
Page 115: Stay Time (By Vibration Cycles)
4.5.2.2.5 Stay time (By vibration cycles) (1) Meaning This item is for specifying the stay time of excitation at each spot frequency by vibration cycles. Excitation time at each spot is specified by the number of vibration cycles in this item and the prior item. -
Page 116: Repeat Pause Time
4.5.2.4 Repeat pause time (1) Meaning This item is for setting of the time for the signal output stop at the turning point if the spot sequence. The excitation is stopped at the turning point of the spot sequence for the specified times. -
Page 117: Zero Reference
4.5.2.7 Zero Reference (1) Meaning As one of the important usage of the multi-axis excitation system, the shakers are used for suppressing of cross-talk vibration in order to realize the exact one directional excitation. In this case, only one reference is required basically. Then the reference of response points corresponding to the other excitation axes are to be set to have all ‘zero’... -
Page 118: Profile Definition
‘Profile’ is a table in which the series of break points specified by the frequency data and the level are defined. In K2 application, three methods of sweep reference definition are available for ‘Profile’ definition as below ; Simplified definition (Specify by level and frequency range only) -
Page 119: Simplified Definition
4.5.3.1 Simplified definition (1) Meaning Generally, the Sine vibration test is executed by using the quantity of ‘Acceleration / Velocity / Displacement’ as a reference level, and the reference profile of sweep sine vibration test is defined as follows in the most cases ; <... -
Page 120: Detailed Definition (Constant)
4.5.3.2 Detailed definition (Constant) Constant profile is a traditional and the most popular definition method in Sine vibration test, and it defines the level to keep the definition quantity at the constant value in each segment dividing the test range on the frequency axis into some segments. When a reference level to keep the definition quantity at the constant value in each segment is defined, this level defined at a break point specifies the level in the whole range of the current segment extended to the next break point. -
Page 121: Break Point / Frequency (Constant)
< Example 2 > 10[Hz]~30[Hz] : 2.0 [mm] Constant 30[Hz]~40[Hz] : 1.0 [cm/s] Constant 40[Hz]~100[Hz] : 10 [m/s ] Constant 100[Hz] : The last break point Note) The vertical axis displays the control unit in the graph of profile. 4.5.3.2.1 Break point / Frequency (Constant) (1) Meaning A pair of the frequency data and the reference level data that specifies the border of each segment is set from the lower frequency range in order as a break point data. -
Page 122: Detailed Definition (Interpolation)
4.5.3.3 Detailed Definition (Interpolation) Interpolation profile has a generalized concept of the constant profile which is popularly used. The value on the straight line that connects the two adjoining break points in the frequency level plane defines the level for each frequency point in the current segment. The level is always needed to be set as the same physical quantity. -
Page 123: Type Of Interpolation
4.5.3.3.1 Type of interpolation Meaning In this item, interpolation method between the break points is selected among the followings. Also, the initial graph scale (Log or Linear) is set to the same as that of the selected type. ・Frequency : Log – Level : Log ・Frequency : Log –... -
Page 124: Break Point / Slope (Interpolation)
conversion calculation between ‘Acceleration / Velocity / Displacement’. The [CALC function] can be used pressing the [CALC] button. Refer to “4.5.5 CALC function” about the details. 4.5.3.3.5 Break Point / Slope (Interpolation) (1) Meaning At registering of the break point data, the slope data corresponding to the frequency data is inputted. -
Page 125: Measured Profile Definition
4.5.3.4 Measured Profile Definition An original data file of CSV format written as the specified format or a properly processed data as the demands is used as the reference data. See the common operation manual about the format in detail. 4.5.3.4.1 Outline Reference profile is defined by using measured data. -
Page 126: Load The Data File
4.5.3.4.2 Load the Data File (1) Meaning CSV Data File used as the reference profile is selected. When the [CSV File open] button in the dialog of Measured Profile Definition is selected, the dialog box for selecting CSV File appears. Select a data file to be referred to. -
Page 127: Type Of Interpolation
<Unit> This item is for selecting the level unit of the data file. <Configuration> The data line corresponding to the frequency data is selected among the data. <Level> The data line corresponding to the level data is selected among the data. 4.5.3.4.3 Type of interpolation (1) Meaning When the data to be used is specified, the measured data is displayed and the type of... -
Page 128: Hpf (High Pass Filter) Setting
4.5.3.4.4.2 HPF (High Pass Filter) Setting (1) Meaning This item is for processing the data by High Pass Filter. When the [HPF setting] button is pressed, the dialog box of HPF setting appears. ・Cut-off Frequency Input the value of cut-off frequency for filtering process. 4.5.3.4.4.3 Level Change (1) Meaning This item is for changing the data level by ratio. -
Page 129: Csv Data File (Measured Profile)
4.5.3.4.5 CSV data file (Measured profile) (1) File Format Text File (MS-DOS) (2) Description formats of Data The frequency domain data are described as follows. 1st. column 2nd. column 3rd. column 1st. line Frequency[Hz], Data name 1, Data name 2, ……... -
Page 130: Tolerance Definition
4.5.4 Tolerance definition (1) Outline In the operation of the vibration test, it may be difficult to realize the response level that coincide with the reference just as it is required according to the condition of the specimen (sharpness of resonance, having the non-linearity components). Therefore, the condition for continuing the testing such a case is needed to be defined in advance. -
Page 131: Tolerance
4.5.4.1 Tolerance (1) Meaning The condition of Tolerance in the whole frequency band is defined in standard definition. < Level> Alarm / Abort level for monitoring the deviation from the profile are specified. Level is specified by a relative level to the profile. At the setting of Alarm check, the following relation should be satisfied between Alarm and Abort levels. -
Page 132: Calc Function
4.5.5 CALC Function (1) Meaning In the sine vibration test, one vibration state is usually defined by using one of the quantities as Frequency f, Acceleration Acc and Displacement Disp. Therefore, the conversion calculation between these quantities (Acc / Vel / Disp) is needed to be done quickly. - Page 133 < Example > The setting of items as ‘Sweep reference – Detailed definition (break point) – Constant’ are executed. When f = 100 Hz, V = 120 cm/s are given, the acceleration A [m/s 2 ] is to be calculated. And the break point is inputted by the acceleration.
- Page 134 < Step 3 > Input 120 to the item of Velocity (Vel.). < Step 4 > Calculation results of Acceleration and Displacement are displayed when the value of Velocity was inputted. Then press [OK]. ② ① 4 - 51...
- Page 135 < Step 5> Input the value of the break point by pressing of the [Add] button. 4 - 52...
-
Page 136: Input Channel
4.6 Input Channel 4.6.1 Outline In this system, there are three types of input channel ;. ・Principal Control channel ・Control channel ・Monitor channel <Principal Control channel> This item is available to be set only when an applicable channel is specified as a control channel. - Page 137 <Monitor channel> Monitor channel is for observing the response at the specified response point independently of the control channels. The physical quantities of measuring object are available to set to each channel individually. For example, when a controlled variable is acceleration, one monitor channel can monitor a displacement signal while another can monitor a force signal.
-
Page 138: Input Channel
4.6.2 Input Channel The input channels to be used are set in the definition dialog of input channel configuration. [Add] : A new input channel is added. [Change] : The definition contents of an input channel are changed. [Delete] : A selected input channel is deleted from the registration. -
Page 139: Input Channel Element
Input channel element 4.6.3 Each input channel element is available to be defined in the display below. The detailed input channel element is to be defined in the detailed definition display. Simplified definition display Detailed definition display 4 - 56... -
Page 140: Weighting Of Drive Generation
4.6.3.1 Weighting of drive generation (1) Meaning This item can be set only when the current channel is specified as the Principal Control channel. In this system, the weighting factor which can be assigned for each control channel is specified when the equalization matrix G is calculated from the transfer function matrix H (this calculation is basically done as the inverse matrix calculation, however the more complicated calculation is done in this system because it adopts the algorithm which can be used even if H is not a square matrix). -
Page 141: Maximum Control
In this system, when multiple control channels exist, basically the definition of average value control is executed for all the control channels, and the maximum value control which is explained in the next clause is selected at an arbitrary control channel on demand. This item is for specifying of weighting factor for each control channel to calculate the average of the control response spectrum for the average value control. -
Page 142: Peak Estimation Method Peculiar To The Channel
4.6.3.5 Peak Estimation Method peculiar to the Channel (1) Meaning This item is for specifying whether the Peak Estimation Method for the monitor response peculiar to the current input channel is executed or not. And when this item is executed, the Peak Estimation Method peculiar to the concerning channel is specified specially. -
Page 143: Profile Definition
4.6.3.7.1 Profile definition (1) Meaning The following two Profile definition methods are provided ; ① Definition by Profile The monitor level is defined by the profile. The monitoring can be done in an arbitrary frequency band and level by defining the monitor level with using profile. -
Page 144: Tolerance Definition
4.6.3.7.2 Tolerance definition (1) Meaning Observation toleranceis set. Press [Define] of Observation Profile. Then the dialog for setting appears. The definition method of Tolerance is the same as those in “4.5.4 Tolerance definition”. 4.6.3.7.3 Limit by Observation Profile (1) Meaning Limit Control is to be executed by checking the checkbox of ‘Limit by Observation Profile’. -
Page 145: Data Save Condition
This function is for setting of each item for saving the data measured in a test operation to the hard disc. In K2 system, all of the data measured in a test operation are saved in a binary file (*.VDF). However, the data in initial measurement cannot be saved. Only the data in a test operation is treated as a data to be saved. - Page 146 4. Sequence number The data files added prefixes are given sequence numbers for each. Beginning value : This item is for setting of a number to start. Example) Input ‘1’ to this item : ‘Data001. VDF’ Min. digits number : This item is for setting of numbers for digit of sequence number. Example) Input ‘2’...
-
Page 147: Operation Status
4.8 Operation Status (1) Meaning Various information concerning with the excitation operation is displayed. The window of Operation status is opened by selecting the commands [Window] – [Operation status] in the menu bar. < Display contents > (1) Present status The message about the present state of the system, such as ‘In operation’, ‘Excitation pause’... - Page 148 (5) Manual The operation status of the present manual operation is displayed. As the operation status, the changing rate of the present excitation level and the changing ration of the present sweep rate are displayed. (6) Check result (total) When all the conditions of the Alarm and Abort check defined in the test definition are satisfied, the check results in ‘OK’.
-
Page 149: Chapter 5 Messages And Meanings
Chapter 5 Messages and Meanings 5.1 Multi-SINE Error Messages Message Meaning / Action (Meaning) Unusual phenomenon is detected The test operation is aborted due to the error in Pre-check. by Pre-check. The detail about the error is displayed at the input channel in which an error detected in Operation status. - Page 150 Message Meaning / Action [7] Set the check standard to ‘Specify’ and increase the value of response linearity check of Pre-check in Excitation System setting. (Meaning) Unusual phenomenon is detected The test operation is aborted due to the error in Initial loop by Loop Check in excitation.
- Page 151 Message Meaning / Action [3] Decrease the value of initial output voltage in the excitation system setting. (If error occurred in the initial measurement or in the initial equalization.) [4] At charge input, set the input type of input channel to ‘Charge input (1mV/pC)’.
- Page 152 If these errors occur even after checking the above points, please contact with IMV. (Meaning) License required to operate the An error is detected in K2 Protect information check program is not registered in the (Action) server. ・ License information ・...
- Page 153 Test operation is aborted because too much loading is of CPU. detected in operation. (Action) ・ Exit form the other applications than K2 executed by the system when they are used. ・ Decrease the value of Max. Observation Frequency in Fundamental Condition.
-
Page 154: Chapter 6 Supplemental Explanation
Chapter 6 Supplemental Explanation 6.1 Timer Various operations, such as Level Change and Sweep Pause, can be executed during the Test Operation in K2 Multi-SINE. The relations between these operations and the function of Timer are described as below ; Condition... -
Page 155: Set Up
6.2 Set Up Specifying unit of Tolerance level is specified among ‘dB’ or ‘%’. <Procedures> Select [Option] in the menu bar and click [Set up]. A dialog of ‘Set up’ appears. ② ① 6 - 2... - Page 156 [Tolerance level unit setting] ‘dB’, ‘%’ Specifying unit of Tolerance level is specified among ‘dB’ or ‘%’. Denoting A[dB] and B[%], the relation between ‘dB’ and ‘%’ is described as below ; A = 20 log (B / 100 + 1) A / 20 B = (10 –...
-
Page 157: Manual Operation
6.3 Manual Operation Control Reference can be changed during the excitation operation by using Manual operation tool bar. Usually, “Manual operation tool bar” is displayed at the right side of operation window. Manual operation tool If the tool bar is not displayed, select [Display] and click [Manual operation tool bar]. ①... - Page 158 < Items in Manual Operation (Continuous sweep) > This item is for holding of Sweep and canceling of This item is for reversing the direction of sweep. Sweep is counted when the sweeping is turned at the Sweep Hold(continuing the sweep operation). maximum or minimum frequency of control reference.
- Page 159 < Items in Manual Operation (Spot) > This item is for fixing spot and canceling of fixed spot (continuing the spot operation). Excitation is stopped at the current spot and skipped to the next spot. Excitation is stopped at the current spot and skipped to the first spot.
-
Page 160: Using / Deleting Of Live Data In Operation
6.4 Using / Deleting of Live Data in Operation The data (necessary for test operation) obtained at test abort (end) can be used by saving that of Test Definition File in the condition of Excitation Stop. The saved data is called as Live Data in Operation. The types of Live Data in Operation are as below ;... -
Page 161: Using Of Live Data In Operation
6.4.1 Using of Live Data in Operation Live Data in Operation can be used when the excitation operation is finished. 6.4.1.1 Add the live data in operation at finishing the operation <Procedures> <Step 1> At finishing the operation, a message window appears as below. The system asks that the current status is needed to be added to the definition file. - Page 162 <Step 2> The names of data related to the definition are added in the display of Test Definition. 6 - 9...
-
Page 163: Add The Live Data In Operation In Test Definition Mode
6.4.1.2 Add the live data in operation in Test definition mode <Procedures> <Step 1> In Test definition mode, the XFR function data can be imported from data files by the operation below. The data available to import is the XFR function. Select [File] →... - Page 164 <Step2> Select a file to import (the XFR function) and press [Open]. These items are available only when the selected test data file has consistent condition having the same sampling frequency other parameters with the Test definition. ① ② 6 - 11...
- Page 165 <Step3> The imported data is added and displayed in the Test definition information as a related data. 6 - 12...
-
Page 166: Deleting Of Live Data In Operation
6.4.2 Deleting of Live Data in Operation The added Live Data in Operation can be deleted by the procedures as below ; <Procedures> <Step 1> Select the Live Data in Operation to be deleted. Press the [Delete] button. ① ② <Step 2>... -
Page 167: Skipping Of Xfr Measurement (Use The Xfr Function Of Live Data In Operation)
6.5 Skipping of XFR Measurement (Use the XFR Function of Live Data in Operation) In a Test File having the XFR Function of Live Data in Operation, the related XFR Function can be used and XFR Measurement can be skipped in test operation. However, pay attention to the danger when the system configuration and the condition of sensors and specimens are different. - Page 168 <Step 2> XFR Measurement of the controlled system is executed. Press [XFR measurement start] button. 6 - 15...
- Page 169 <Step 3> The dialog for selecting operations concerning with XFR Measurement appears when XFR Function of Live Data in Operation is used in the test. When both Loop Check and XFR Measurement are needed to be skipped, cancel the checks in all of the check boxes and press [OK].
-
Page 170: Continuous Xfr Measurement
6.6 Continuous XFR Measurement This item is for operating XFR measurement continuously and adding the measured data to the current XFR function. It is usable when the averaging times of XFR function need to be increased after operating XFR Measurement. The condition of continuous XFR Measurement is described as below;... - Page 171 Or otherwise, select [Operation] in the menu bar after completing the XFR Measurement. Select [XFR measurement again] Then, the confirmation message appears. Select [Yes] in this dialog. ① ② ③ 6 - 18...
- Page 172 <Step 2> Press [XFR measurement start] button. 6 - 19...
- Page 173 <Step3> The dialog for specifying the measurement method of XFR function is displayed. Check the check box of “Operate XFR Measurement continuously” and press [OK] after setting the required usage below. Then, the continuous measurement of XFR function is executed. ・...
-
Page 174: Restarting Suspended Test
6.7 Restarting suspended test In the test file that Continuing excitation data was added, the suspended test can be restarted from the status that Continuing excitation data was added. <Procedures> <Step 1> Load the test file in which Continuing excitation data was added, and press [Operation start] button. 6 - 21... - Page 175 <Step 2> Measure the XFR function of the controlled system, and proceed to the status of waiting for excitation start. 6 - 22...
- Page 176 <Step 3> As for the test that Continuing excitation data was added, a dialogue box to decide whether the test should be continuously executed or not appears. To restart the test that test was suspended, check “Carry on the live data in operation”, and press the [OK] button.
- Page 177 INDEX A Abort level at XFR mesurement ............4-59 Ambient noise ................5-1 Auto-generation condition of the spot by profile ........4-30 Average .................. 4-3 Average peak ................4-4 Averaged value ..............1-1, 4-3 Averaging Weighting Factor .............. 4-57 B B.P.
- Page 178 Equalization mode ..............4-5, 5-3 Excitation group ................ 4-14 Excitation group configuration ............4-15 Excitation group information ............4-16 Excitation System ................ 5-3 Excitation system information ......3-1, 3-3, 3-23, 3-25, 3-47, 3-49, 4-1, 4-2 Excitation System setting ..........4-1, 5-1, 5-2, 5-3 Excited by white noise ..............
- Page 179 Max. Observation Frequency ............4-2, 5-5 Max. peak ................4-4 Maximum Control ................. 4-58 Measured Profile Definition ............. 4-42 Menu bar ................2-1, 4-64 Multi-axis/multi-point control condition ..........4-1, 4-8 Multi-axis/multi-point control speed ............ 4-12 O Observation tolerance ..............4-61 Operate initial loop check ..............
- Page 180 Spot ............1-1, 2-2, 3-47, 3-48, 4-1, 4-20 Spot Reference definition ............... 4-28 Spot test ............. 4-27, 4-33, 4-63, 4-64 Spot test ................3-47 Stay time ..............4-30, 4-31, 4-32 Sweep ....... 1-1, 2-2, 3-1, 3-2, 3-23, 3-24, 4-1, 4-20, 4-21, 4-30, 4-35, 4-63 Sweep mode .................
Need help?
Do you have a question about the K2 and is the answer not in the manual?
Questions and answers