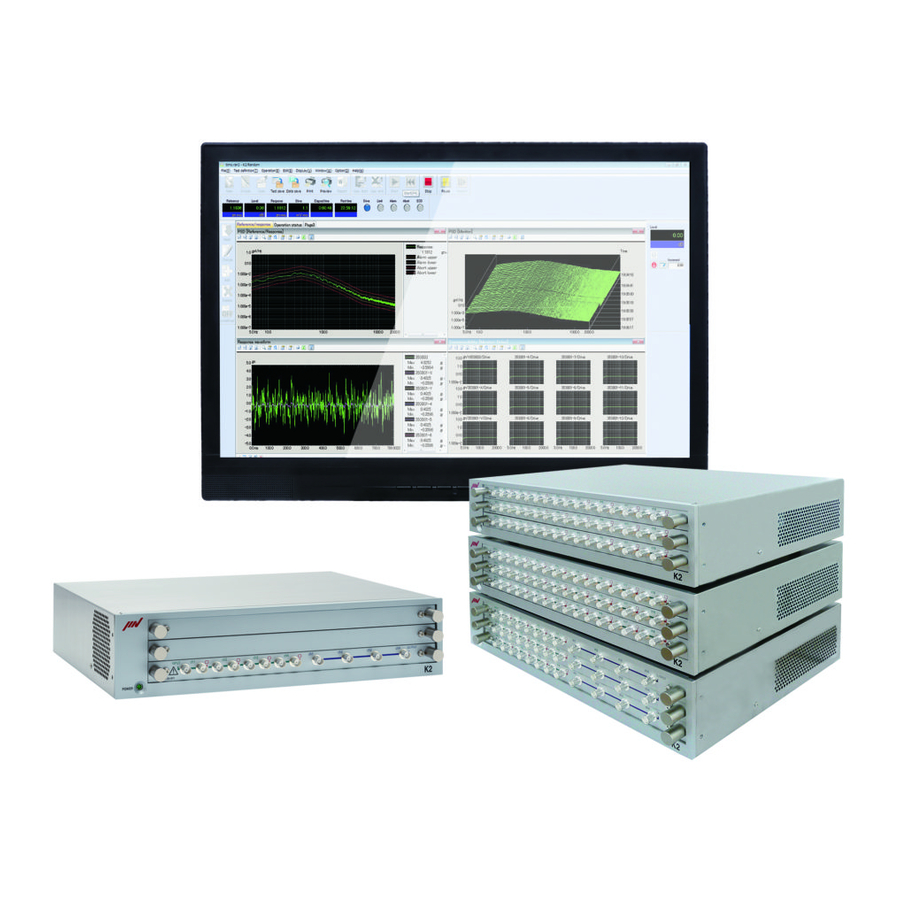
IMV K2 Instruction Manual
Random vibration control system
Hide thumbs
Also See for K2:
- Instruction manual (237 pages) ,
- Instruction manual (181 pages) ,
- Instruction manual (186 pages)

Related Manuals for IMV K2


Summary of Contents for IMV K2
- Page 1 Random Vibration Control System K2Sprint RANDOM Instruction Manual Limitation of K2Sprint/RANDOM ・Maximum numbers of usable input channel are ‘2’ channels. ・Option of LIMIT CONTROL can not be added. IMV CORPORATION...
- Page 2 Type of Document : Instruction Manual System Applied : K2/K2Sprint Software < RANDOM, SOR/ROR > Later than Version 20.1.0...
- Page 3 Japanese Edition Version Date Contents 1.0.0 2004.01.30 First edition 1.0.1 2004.04.02 Correction of a misprint 2.0.0 2004.08.10 Additional descriptions of Simplified Definition, and Level Schedule function. 3.0.0 2005.03.31 Additional description of “Transmissibility display unit”, “Excitation level mode” in Setup and “Observation freq. can be set within the Reference freq. range”.
- Page 4 English Edition Version Date Contents 1.0.1 2004.04.02 First edition, Correction of a misprint 2.0.0 2004.08.19 Additional descriptions of Simplified Definition, and Level Schedule function. 3.0.0 2005.04.06 Additional description of “Transmissibility display unit”, “Excitation level mode” in Setup and “Observation freq. can be set within the Reference freq. range”.
-
Page 5: Table Of Contents
1.1.4 PSD Limit (Option of RANDOM) ..........1-5 1.1.5 Non Gaussian (Option of RANDOM) ..........1-5 1.1.6 Soft-Clipping (Option of RANDOM) ..........1-6 Chapter 2 Operation System of K2 Application ..........2-1 2.1 Outline ................2-1 2.2 Test File ................. 2-2 2.3 Test Type ................. - Page 6 4.2.13.3 Tolerance Enlarge............ 4-10 4.2.14 Observation freq. can be set within the Reference freq. range ....4-11 4.2.15 Pause before transitioning to "In excitation" ......4-11 4.3 Excitation System Setting ............4-12 4.3.1 Initial output voltage ............4-12 4.3.2 Clipping ..............4-12 4.3.2.1 Clipping by crest factor..........
- Page 7 4.10 Aux. Output ..............4-50 4.10.1 Outline ..............4-50 4.10.2 Fundamental Operation Example ..........4-50 Chapter 5 Message and Meanings............5-1 5.1 K2 Random Error Message ............5-1 Chapter 6 Supplemental Explanation ............6-1 6.1 Set Up ................6-1 6.2 Manual Operation ..............6-4...
-
Page 8: Chapter 1 Outline Of The System
Chapter 1 Outline of the System 1.1 Specifications 1.1.1 RANDOM (1) Control method : PSD control of the random waveform signal with the Gaussian nature by using the feed-forward method (2) Control frequency fmax : Maximum 20 kHz (However, it may be limited by conditions.) (3) Number of control lines L : Maximum 25600 lines (However, it may be limited by conditions.) (4) Control dynamic range : More than 94 dB (5) Loop time : 200 ms(120 DOF, fmax=2000 Hz, L= 400 line)... - Page 9 (9) Data save : Automatic / Manual Display data save as CSV format (10) Control operation information save and use 1) Storing of the test operation time information and continuing of test operation (Partial execution of the test) 2) Storing the control information (Live data in operation) and continuing of the control (Prompt mode) (11) Option : PSD Limit Sine On Random...
-
Page 10: Sine On Random (Option Of Random)
1.1.2 Sine On Random (Option of RANDOM) (1) Specification for Broad band Based on K2/RANDOM (However, ‘(3) Special mention for SOR’ should be referred to.) (2) Specification for Narrow band 1) Control method : Based on K2/SINE 2) Base narrow band to be defined : 1... -
Page 11: Random On Random (Option Of Random)
1.1.3 Random On Random (Option of RANDOM) (1) Specification for Broad band Based on K2/RANDOM (However, ‘(3) Special mention for ROR’ should be referred to.) (2) Specification for Narrow band 1) Control method : Based on K2/RANDOM 2) Base narrow band to be defined : 1... -
Page 12: Extended Random On Random (Option Of Random On Random)
To implement this option, it will be necessary to use the Extended Random On Random option in addition to the Random On Random option. (1) Specification for Broad band Based on K2/RANDOM (However, ‘1.1.3 Random On Random (Option of RANDOM) (3) Special mention for ROR’ should be referred to.) (2) Specification for Narrow band... -
Page 13: Soft-Clipping (Option Of Random)
1.1.6 Soft-Clipping (Option of RANDOM) A functionality of ‘Hard-Clipping specified by crest factor’ has been provided since the first release of this system. Using this clipping, the spectrum of the clipped drive signal is more or less modified. As a result, the spectrum of the response signal would be more or less different from the plan. -
Page 14: Chapter 2 Operation System Of K2 Application
The commands used frequently are displayed as icons in each Tool bar. A command is executed or a dialog box corresponding to the command is opened when the icon is clicked. Operation status of K2 Controller is displayed in Status bar. The state during the excitation operation is displayed in Operation status panel. -
Page 15: Test File
2.2 Test File In K2 application, necessary information to operate a test is saved in a specified file called ‘Test File’. Following kinds of Test File are available in this system. Necessary Test Files for test operation ・Test Definition File : The file created inVer10.0.0.0 or later K2RANDOM (*.ran2, *.sor2,*.ror2,... -
Page 16: Test Type
2.3 Test Type In K2/RANDOM, three test types as below are available. ① Random Test A vibration test operated by the random vibration. ② SOR Test SOR test is a vibration test composed by adding the random vibration to the sine vibration simultaneously. -
Page 17: Chapter 3 Basic Operation
Chapter 3 Basic Operation 3.1 Random Test < Example > An example of random test is described as below ; [Reference pattern] Level [(m/s / Hz] Slope:6[dB/oct] 1000 Frequency [Hz] The PSD is specified to 10 [(m/s )rms] having the shape as in the above between 10 [Hz] and 1000 [Hz]. - Page 18 < Procedures > < Step 1 > Press the button of [New] to start ‘New definition’. < Step 2 > Select the item of ‘Random test’ in Test type. (If SOR, ROR option is not installed, only ‘Random test’ can be chosen.) 3 - 2...
- Page 19 < Step 3 > Select an Excitation system from the list of ‘Excitation system information’. < Step 4 > Click the checkbox of ‘Input channel information selection’ and select an input channel information from the list. ① ② 3 - 3...
- Page 20 < Step 5 > Press the button of [OK]. < Step 6 > Press the button of [Next]. 3 - 4...
- Page 21 < Step 7 > Set the Frequency range to ‘1000Hz’. < Step 8 > Set the Control frequency lines to ‘400’. 3 - 5...
- Page 22 < Step 9 > Specify the Test time as ‘Specify time’. And input the value as ‘Test time : 0 : 01 : 00 (60 sec)’. < Step 10 > Press the button of [OK]. 3 - 6...
- Page 23 < Step 11 > Press the button of [Next]. < Step 12 > Press the button of [OK]. 3 - 7...
- Page 24 < Step 13 > Press the button of [Next]. < Step 14 > Select the item of Break point PSD and press the button of [ PSD definition ① ② 3 - 8...
- Page 25 < Step 15 > Select the item of Level and input the values as ‘Level : 1[(m/s /Hz], Frequency : 10 [Hz]’. Then, press the button of [Add]. ③ ② ① < Step 16 > Select the item of Slope and specify Unit of Slope as ‘dB/octave’. Input the values as ‘Slope : 6 [dB/octave], Frequency : 100 [Hz]’.
- Page 26 < Step 17 > As in the same way, select the item of Slope and specify the Unit of Slope as ‘dB/octave’. Input the values as ‘Slope : 0 [dB/octave], Frequency : 1000 [Hz]’. Then, press the button of [Add]. ②...
- Page 27 < Step 19 > Select the item of New rms value and input the value as ‘New rms value : 50 [(m/s ) rms]. And press the button of [OK]. ① ② < Step 20 > Press the button of [OK]. 3 - 11...
- Page 28 < Step 21 > Press the button of [Tolerance definition]. < Step 22 > Press the button of [OK]. 3 - 12...
- Page 29 < Step 23 > Press the button of [OK]. < Step 24 > Press the button of [Next]. 3 - 13...
- Page 30 < Step 25 > Select ‘Ch.1’ and set as ‘Control’. Also, select ‘Ch.2’ and set as ‘Monitor’. Then, press the button of [OK]. ① ② < Step 26 > Press the button of [Next]. 3 - 14...
- Page 31 < Step 27 > Select ‘Not save’ and press the button of [OK]. ① ② < Step 28 > Press the button of [Next]. 3 - 15...
- Page 32 < Step 29 > Select ‘Excitation force check’ and input the value as ‘Specimen mass : 10 [kg]. And press the button of [OK]. ③ ② ① < Step 30 > The definition is completed. 3 - 16...
- Page 33 < Save of test> < Step 1 > Save the defined test information to a test file. Click the button of [Save]. < Step 2 > The dialog box as below appears. Specify an arbitrary directory in ‘Save in’ and input a name to ‘File name’.
- Page 34 < Operation of test > < Step 1 > Press the button of [Operation start] for ‘Operation start’. < Step 2 > Press the button of [Start] for ‘Excitation start’. When [Exc. Start] is pressed, Initial Loop Check, and Initial Equalization are automatically operated. Then, the test operation is executed at the initial excitation level (-10 dB in this example).
- Page 35 < Step 3 > The excitation is operated at the initial excitation level (-10 dB in this example) when the initial equalization is finished. Set the excitation level to 0 dB by pressing of [Level Up] button. 3 - 19...
- Page 36 < Step 4 > Test time is started to be counted when the excitation level is set to 0 dB. 3 - 20...
- Page 37 < Step 5 > The test operation is completed when the specified test time has passed. The system returns to Test Definition mode by pressing the button of [Operation end]. 3 - 21...
-
Page 38: Simplified Definition
[Information of sensors to be used] One accelerometer of piezo-electric Input terminal of K2 Hardware to be used : Ch.1 of Module ID 0 Channel name : Ch.1 (Sensitivity :3 pC/(m/s Also, the rating information of excitation system has already been registered in Excitation System Information (in this example, ‘System1’). - Page 39 < Procedures > < Step 1 > Press the button of [Simplified] to start the ‘Simplified Definition’. < Step 2 > Select ‘System1’ among the items of Excitation System Information. And input the value to ‘Frequency range’ as 1000 [Hz]. ①...
- Page 40 < Step 3 > Input the value to ‘Control frequency lines’ as 400. < Step 4 > Input the value to ‘Test time’ as 1 [minute] (60 seconds) and press the button of [PSD definition]. ① ② 3 - 24...
- Page 41 < Step 5 > Select the item of Level and input the values as ‘Frequency : 10 [Hz], Level : 1[(m/s /Hz]’. Then, press the button of [Add]. ② ③ ① < Step 6 > Select the item of Slope and specify Unit of Slope as ‘dB/octave’. Input the values as ‘Frequency : 100 [Hz], Slope : 6 [dB/octave]’.
- Page 42 < Step 7 > As in the same way, select the item of Slope and specify the Unit of Slope as ‘dB/octave’. Input the values as ‘Frequency : 1000 [Hz], Slope : 0 [dB/octave],’. Then, press the button of [Add]. ②...
- Page 43 < Step 9 > Select the item of New rms value and input the value as ‘New rms value : 10 [(m/s ) rms]. And press the button of [OK]. ① ② ③ < Step 10 > Press the button of [OK]. 3 - 27...
- Page 44 < Step 11 > Press the button of [Tolerance definition]. < Step 12 > Press the button of [OK]. 3 - 28...
- Page 45 < Step 13 > Press the button of [Add] of Input channel. < Step 14 > Set the items as below and press the button of [OK]. Channel name : Ch.1 Module ID : 000 Ch : Ch.1 Input sensitivity : 3.0 pC/(m/s Input channel type : Control ②...
- Page 46 < Step 15 > Press the button of [OK]. < Step 16 > Select ‘Safety check’ and press the button of [Change]. ② ① 3 - 30...
- Page 47 < Step 17> Select ‘Excitation force check’ and input the value as ‘Specimen mass : 10 [kg]. And press the button of [OK]. ③ ① ② < Step18 > The definition is completed. 3 - 31...
- Page 48 < Save of test > < Step 1 > Press the button of [Save]. < Step 2 > Input the file name and press the button of [Save]. ① ② 3 - 32...
- Page 49 < Operation of test > < Step 1 > Press the button of [Operation start]. < Step 2 > Press the button of [Start] (Excitation start). When [Start] is pressed, Initial loop check and Initial equalization is automatically operated. Then, test operation is started at the Initial excitation level (-10dB in this example). Initial excitation level is displayed.
- Page 50 < Step 3 > The excitation is started to operate at the Initial excitation level (-10dB in this example) when the Initial equalization operation is finished. Set the excitation level to 0dB by pressing the button of [Level up]. 3 - 34...
- Page 51 < Step 4 > Test time is started to count when the excitation level is set to 0dB. 3 - 35...
- Page 52 < Step 5 > The test operation is completed when the specified test time has passed. The system returns to the test definition mode by pressing the button of [Exit]. 3 - 36...
-
Page 53: Chapter 4 Test Definition
Chapter 4 Test Definition 4.1 Outline In this system, a complete set of information needed for test operation is called ‘Test’. To perform a test, Test must be defined first of all. This chapter describes the procedure to define the Test. A Test is defined by the setting of the information in Table 4-1 in order for each Test types. -
Page 54: Fundamental/Control Condition
4.2 Fundamental/Control Condition Control condition of K2 controller is defined. 4.2.1 Frequency range fmax (1) Meaning This item is for specifying the Frequency range for the spectrum analysis. An appropriate value should be set in order to cover the frequency elements included in the reference PSD to be reproduced. -
Page 55: Max. Observation Frequency (Max. Observation Freq.)
4.2.4 Controlled variable (1) Meaning Unit of quantity (controlled variable) used as a control objective for K2 controller is specified. Control unit defined in this item is treated as a unit in test definition. A unit specified in ‘Other units’ is added as a Control unit only when the rating information of ‘Other units’... -
Page 56: Averaging Parameters
4.2.5 Averaging Parameters (1) Meaning The Degree-Of-Freedom of measurement, that is, the accuracy of spectrum estimation (averaging operation) is specified in this item. Averaging operation is necessary to execute an accurate spectrum estimation in the analysis of random signal because the spectrum data obtained in FFT analysis for one time has too large dispersion. -
Page 57: Equalization Mode
4.2.6 Equalization Mode (1) Meaning This item is for setting of the control speed t the initial equalization during the time from the control operation start (a white-noise-like output start), and through the coincidence of the response spectrum with the reference spectrum (within the Tolerance), to the beginning point of the elapsed time counting start. -
Page 58: Ambient Noise Upper Limit
to the control loop before the measurement. If the control loop is normal, it is followed by the transfer function measurement with abnormal check. In this item, an abnormal detection criterion for loop check is selected from the followings ; 1. -
Page 59: Transmissibility Check Value [In Test Operation]
4.2.7.3 Transmissibility check value [in test operation] (1) Meaning This item is intended for specifying the allowance for the transmissibility variations during test operation. If the transmissibility variations exceed the specified value, the test is aborted. 4.2.7.4 Overload check value (1) Meaning This item is intended for the continuance of test even if input signal exceeds the input range to some extent. -
Page 60: Level Increment
is called the ‘Initial output level’. This item defines the ‘Initial output level’, which is defined in the form of a level ratio (dB value) as the standard (0 dB) of the reference waveform level. The setting of excitation level can be changed (0 dB or less) any time during the testing of actual excitation, but there is a danger to make the mistake of doing excitation at 0 dB from the beginning. -
Page 61: Level Scheduling
output level should be gradually reduced to zero with taking proper duration. The time for reducing the output level is called ‘Shutdown time’ and this quantity can be set in this item. On the other hand, the same danger of the above may occur at the drive output start. Therefore, for this system, the operation specification that the full level output is produced with taking a specified time of this item is provided. -
Page 62: Level
[Add] : This button is for registering a new schedule item After inputting the values to Level and Time, press this button to register and display the current schedule in the list. [Change] : This button is for changing the values of a registered schedule. Selecting a schedule by a mouse, input the values to be changed and press this button. -
Page 63: Observation Freq. Can Be Set Within The Reference Freq. Range
4.2.14 Observation freq. can be set within the Reference freq. range (1) Meaning This item is for limiting the observation frequency to set within the reference frequency range*. When this item “Observation freq. can be set within the Reference freq. range” is checked, the available frequency range for calculating the RMS value and for graph data is limited within the reference frequency range only. -
Page 64: Excitation System Setting
4.3 Excitation System Setting This item is for setting of the excitation / output system for control. 4.3.1 Initial output voltage (1) Meaning ‘Initial output voltage’ means the voltage to be outputted to the shaker at the first loop check. The control is always started at this drive voltage when the excitation starts from the state of no drive. -
Page 65: Output Voltage Limit Value
When the function of ‘Clipping by crest factor’ is to be executed, this item is checked and the level of Clipping should be specified as a relative ratio to standard deviation σ of the output signal. 1. Soft-Clipping To use the Soft-Clipping, the Soft-Clipping option is required. It is possible to clip the drive signal without deteriorating the control performance. -
Page 66: High Pass Filter(Hpf)
4.3.3 High Pass Filter(HPF) (1) Meaning This item is for setting of inserting or not-inserting of a high pass filter to the drive signal output circuit which is the concrete mechanism to realize ‘the function of Extra-displacement reduction’. The following can be chosen for setting of usage of the high pass filter, and for setting of cut- off frequency fc. -
Page 67: Control Reference
4.4 Control Reference This item is for defining the control reference. Test pattern is determined by the setting of this definition. 4.4.1 PSD definition (1) Meaning This item is for specifying the types of PSD. In this system, the definition method of PSD data are provided as below ; ①... -
Page 68: Break Point Psd Definition
< RMS value of PSD data > When PSD data is defined, the RMS value if the defined PSD data is shown in the display. (If the control unit is in acceleration, the RMS values of the velocity and the displacement are also shown.) The RMS value of the PSD data shown in this definition display is the calculated value which depends on the control line (Δf) specified in Spectrum Analysis Condition. -
Page 69: Frequency
Break Point PSD Data Definition is independent from the frequency resolution Δf . If the defined break point PSD data has a component of which frequency has a fraction when divided by Δf, the PSD data of each control line is defined as below ; Draw a strait line between the PSD levels of the frequency adjoining each other in the defined Break Point PSD data. -
Page 70: Slope
4.4.1.1.4 Slope (1) Meaning At registering of B.P. data, the slope data corresponding to the frequency data is inputted. The slope value can be inputted to this item by pressing of the [Slope] button. The unit of slope can be selected from 2 types, that is, ‘dB/octave’ and ‘dB/decade’. One of these units can be used for a PSD data. -
Page 71: Measured Psd Definition
4.4.1.2 Measured PSD Definition 4.4.1.2.1 Outline Reference PSD is defined by using of a measured PSD data. The measured PSD data to be used should be a CSV file written in the specified format. Refer to “4.4.1.2.4 CSV data file” about the details of this format. The frequency resolution Δf of the used PSD data file is not necessary to coincide with the Δf defined in Test Definition. -
Page 72: Psd Data File Load
[Level change] : The specified level of frequency band is changed. [rms change] : The RMS value is changed. [Undo] / The state of the edited data is returned to the previous state for one step. 4.4.1.2.2 PSD Data File Load (1) Meaning This item is for selecting the ‘measured PSD data file’... -
Page 73: Psd Data Processing
< PSD Unit selection > Unit for the level of Data File is selected. < Configuration of Frequency Data > The data of column corresponding with the frequency data is selected among the data in Data File. < Level Data Selection > The data of column corresponding with the level data is selected among the data in Data File. -
Page 74: Hpf (High Pass Filter)
The items for setting are as below ; ・Cut-off Frequency This item is for setting of the Cut-off Frequency for a filtering process. ・Processing Contents The processing contents of LPF are to be selected ; [Truncate] : This item is for cutting off the data at the higher band than the specified Cut-off Frequency. -
Page 75: Level Change
4.4.1.2.3.3 Level Change (1) Meaning This item is for changing the PSD data level in the specified Frequency range. When the button [Level Change] is pressed, the dialog of Level Change appears. The items for setting are as below ; ・Frequency range This item is for setting of the Frequency range for Level Change. -
Page 76: Rms Change
4.4.1.2.3.4 rms change (1) Meaning This item is for converting the defined PSD into the data having the required RMS value by changing only its level without changing its shape. When the button [rms change] is pressed, the dialog box of rms change appears. Specifying method of RMS value can be selected among the following two methods ;... -
Page 77: Measured Waveform Definition
4.4.1.3 Measured Waveform definition 4.4.1.3.1 Outline Reference PSD is defined by using of a measured waveform data. First, select waveform data, and edit the waveform as necessary. Calculate PSD data from the waveform data. Edit the data furthermore as necessary, and use them as reference PSD data. -
Page 78: Waveform Data File Loading
4.4.1.3.2 Waveform Data File loading (1) Meaning The ‘Measured waveformdata file’, the base of PSD data, is selected and edited. First, a dialogue box to select CSV file is displayed. After the reference data file is selected, data to be used for definition is selected from the data in the data file. - Page 79 <Sampling frequency> Sampling frequency of data file is specified. When sampling frequency is automatically calculated from time data, the calculated sampling frequency is displayed (In this case, changing sampling frequency is not allowed.) <Calculation of sampling frequency from time data> Sampling frequency is automatically calculated by the data assigned as time data.
- Page 80 <Selection of waveform data file> Waveform data file is selected by using the buttons shown below. [ File loading ]: This button is for loading waveform data files. <Display data selection> The graph data can be selected from the items below. ・Waveform display Waveform graph is displayed.
-
Page 81: Data Edit
4.4.1.3.3 Data edit (1) Meaning When the PSD data is determined, the selected measured waveform data is displayed and the buttons in ‘Data edit’ become valid. The data can be edited by a selected button to be executed on demand. 4.4.1.3.3.1 Filtering (1) Meaning This item is for operating of Filtering to the waveform data loaded. - Page 82 phase change to the input signal. This system adopts the specifications that the slope at the attenuation band can be defined without changing the phase in all the frequency elements at all. ・TRUNCATE The characteristics of the Frequency range which is the object for the filter processing is truncated to zero bounded by the specified cut-off frequency fc.
-
Page 83: Edging
4.4.1.3.3.2 Edging (1) Meaning This item is for operating the edging process that achieves to smooth the loaded waveform data at the beginning/ending edge to zero. Half-length Hanning Windowing is used in this process. When [Edging] button is pressed in the definition dialog, the definition dialog of Edging appears as below. - Page 84 ・Clipping The waveform data in the defined region is clipped by the defined clipping level. When the clipping level is positive (+), the data over the level is replaced by the clipping level. When the level is negative (-), the data below the level is replaced by the clipping level.
-
Page 85: Scalar Calculation
4.4.1.3.3.3 Scalar calculation (1) Meaning This item is for setting of the calculation between numeral values of the waveform data loaded. When [Scalar calculation] is pressed in the definition dialog, the definition dialog of Scalar calculation appears as below ; <Calculation>... - Page 86 <Setting Method> This item defines the objective range to be calculated. ・Region To specify the objective region of the calculation by defining the beginning point and ending point. Select [Objective region] to display the dialog as below. And define the beginning and the ending points that become the objects for calculation.
-
Page 87: Data Length Change
4.4.1.3.3.4 Data length change (1) Meaning This item is for changing the waveform data length. Select [Data length change] in the definition dialog. The definition dialog of Data length change as below appears. <Processing type> When Data Length of waveform data is converted, the following methods are available ;... - Page 88 <Data Length> This item is specified only when Processing type is specified as Data length conversion and is defined a new Data Length R’. In this item, the waveform data of a new Data Length is generated, while Sampling frequency fs is kept unchanged. In other words, the Frame Time T increases or decreases in proportion to the Data Length as follows ;...
- Page 89 <Objective Region> This item is valid only when ‘Data trimming’ or ‘Data editing’ is set in Processing type. When [Objective Region] is pressed, the dialog box for setting of objective region appears. 4 - 37...
-
Page 90: Csv Data File
4.4.1.3.4 CSV data file (1) File Format Text File (MS-DOS format) (2) Data Sampling frequency data at each time is described as below in order of time passing. 1st column 2nd column 3rd column 1st line Time (ms) Data Name 1, Data Name 2, Data Name 3, ……... -
Page 91: Tolerance Definition
4.4.2 Tolerance Definition (1) Meaning This item is for defining the condition of Tolerance check. It may be happened that the response PSD control to be equal to the reference PSD cannot be obtained as you need depending on the condition of specimen (degree of sharpness in resonance characteristics, having the non-linearity elements, etc.) in vibration test operation. -
Page 92: Tolerance
4.4.2.1 Tolerance (1) Meaning The condition of Tolerance check is defined in the whole band in which the reference PSD exists. Tolerance must be set for each test definition. And this Tolerance is called ‘Basic Tolerance’ in the following description. Tolerance is defined by the definition items as below ;... -
Page 93: Rms Check
4.4.3 RMS Check This item is for specifying whether the RMS value of the current control response is to be monitored or not during the testing operation. The following two items are provided for monitoring. ① Alarm Check by Response RMS Value This system sounds an alarm when the RMS value of the control response exceeds over (or falls below) the defined value of this item. -
Page 94: Input Channel
4.5 Input Channel 4.5.1 Outline In this system, there are two types of response input channel ;. ・Control channel ・Monitor channel In this system, all of the used input channels are defined as Monitor channels. Therefore, Control channels also have the function as Monitor. Control channels are important one of which response signals are controlled to meet with the control reference. -
Page 95: Data Save Condition
Each item for saving the data measured in test operation to the hard disc is defined. In K2 system, all the data measured in test operation are saved in a binary file (*.VDF). Only the data ‘In excitation’ is storable. The data ‘In initial measurement’ can not be saved. -
Page 96: Saving Condition
4.6.2 Saving Condition Saving conditions are described as below ; 1. “Save” & “Not save” buttons Select “Save” to save the data file automatically and select “Not save” if it is not necessary to save the data. 2. Specify the destination folder Specify the destination folder for the data file. -
Page 97: Amplitude Probability Density Analysis
Amplitude probability density analysis 4.7.1 Outline This item is for setting of analysis time and for selecting input channels to analyze amplitude probability density. <Analysis Time > The time of analyzing amplitude probability density is specified. <Analysis channel> Input channel to analyze amplitude probability density is selected. Limitations shown below are applied depending on the input channel type. -
Page 98: Operation Status
4.8 Operation Status (1) Meaning The information concerning to the excitation operation is displayed in this dialog. Some information in this display are renewed at every control loop time depending on the conditions. < Random Test > < Display Contents > (1) Current status The message of the current status of the system is displayed. - Page 99 (5) Check result All the results of the checks (such as each checks for the control response, the result of the check for the output drive and each checks for the monitor response) are totally displayed. (6) Real-time processing CPU load factor The current CPU load factor is displayed.
-
Page 100: Safety Check
4.9 Safety check 4.9.1 Outline The system has the feature of Rating check* to evaluate whether the defined test can be performed on the excitation system as a protective feature. The safety check expands this protective feature and makes it possible to use the excitation system more safely. (1) Excitation force check This check is made to evaluate whether the excitation force required for the test is held within the excitation system rating. - Page 101 Similarly, the rating checks for the velocity and displacement are also performed based on the composite PSD. (2) Frequency range check This check is made to evaluate whether the frequency range of reference is within the usable frequency range. Although there is a similar protective feature of “control frequency range” setting in the excitation system information, this is a feature to perform this check for each test.
-
Page 102: Aux. Output
4.10 Aux. Output 4.10.1 Outline Aux-output is a function for real-time outputting the information for the control operation as analog signal. The following output information can be outputted DC voltage which indicates the quantities (Log / Linear) as Aux- output ; ・Control reference level for each input channels[rms] ・Control response level for each input channels[rms] ・Drive voltage level[rms]... - Page 103 <Step 2> Set the ‘Module ID’ of I/O board and output channel ‘Ch2’. Select the item of ‘Monitor’. ① ② <Step 3> Set ‘Ch1’ to input channel. 4 - 51...
- Page 104 <Step 4> Input the values to Data range (1 ~ 100 [m/s ]) and DC Output voltage range (0 ~ 100 [mV]) . Select the item of ‘Linear’. ① ② <Step 5> Press the button of [Add]. Exit from the definition of Aux-output by pressing the button of [OK]. ①...
-
Page 105: Chapter 5 Message And Meanings
Chapter 5 Message and Meanings 5.1 K2 Random Error Message Message Meaning / Action (Meaning) Unusual phenomenon is detected The test operation is aborted due to the error in Initial loop check. by loop check. The detail about the error is displayed at the input channel in which an error detected in Operation status. - Page 106 Message Meaning / Action upper limit value in Fundamental/Control Condition. [5] Set the Loop check to ‘Specify’ in Fundamental/Control Condition and set as follows. ・If error occurred in Initial measurement or in Initial equalization Increase the value of ‘Transmissibility check value (in initial excitation)’.
- Page 107 ・ Between the PC and I/O unit is not connected. ・ Incorrect connection of I/O unit board. ・ Incorrect connection of K2 I/F board. ・ Incorrect action of Driver. Check the above points and retry the testing operation for several times.
- Page 108 Test operation is aborted because too much loading is detected in operation. (Action) ・ Exit form the other applications than K2 executed by the system when they are used. ・ Decrease the value of Frequency range in Fundamental/ Control Condition.
-
Page 109: Chapter 6 Supplemental Explanation
Chapter 6 Supplemental Explanation 6.1 Set Up <Procedures> Select [Option] in the menu bar and click [Set up]. A dialog of ‘Set up’ appears. ② ① [Transmissibility display unit] This item is for selecting the display unit of amplitude value in Transmissibility Graph. This unit selected in this item is valid only for the transmissibility graphs calculated from the two data giving the same unit. - Page 110 [Response data save] The data of Elapsed time, Excitation level, Reference, Control response and Monitor response are saved as CSV file in time series. The CSV files are generated according to the rule as below. Test file name XXX-Y.CSV : The number of data which is numbered serially in the order of testing operation. : The data lines available to be saved in a file are 65536.
- Page 111 [Store the display status for operation] ・‘Store the display config’ check box Check ‘Store the display config’ to store the display configuration during testing. Display configuration is stored for each test type. If the display configuration is stored, graphs and others based on the same settings as those for the previous testing will be displayed during next testing.
-
Page 112: Manual Operation
6.2 Manual Operation Control Reference can be changed during the excitation operation by using Manual operation bar. Manual operation bar is at right side of window. Manual operation bar If Manual operation bar is not displayed, select [Display] in the menu bar and click [Manual operation tool bar]. - Page 113 < Items in Manual Operation (RANDOM) > This item is for changing of Excitation This item is for setting of an Level, the increase/decrease value of upper Excitation Level by Excitation Level, Controlled state of Loop pressing this button once for an update.
- Page 114 INDEX A Abort Ratio ................4-13 Ambient noise upper limit ..............4-6 Amplitude ................4-30 Amplitude probability density ............4-45 Amplitude probability density analysis ..........4-1, 4-45 Analysis Time ................4-45 Auto-start ................4-8 Aux. Output ................ 4-1, 4-50 Averaging Parameters ..............4-4 B...
- Page 115 Extended ROR Test ................ 2-3 F Filter order ................4-30 Filter slope ................4-30 Filtering ..............4-28, 4-29, 4-30 Frequency range ............3-5, 4-2, 4-3, 5-4 Frequency range check ..............4-49 Frequency ratio ..............1-3, 1-4 Frequency resolution ..............4-30 Fundamental Operation Example ............
- Page 116 Processing type ............. 4-35, 4-36, 4-37 PSD Data File Load ..............4-20 PSD Data Processing ..............4-21 PSD definition ..............3-8, 4-15 R Random test ................3-2 Rating check ..............4-48, 4-49 Reference PSD ..............4-15, 4-25 Response data save ............... 6-2 rms change ................
Need help?
Do you have a question about the K2 and is the answer not in the manual?
Questions and answers