
Related Manuals for Anritsu BERTWave MP2100B


Summary of Contents for Anritsu BERTWave MP2100B
- Page 1 MP2100B BERTWave Operation Manual Eighth Edition For safety and warning information, please read this manual before attempting to use the equipment. Keep this manual with the equipment. ANRITSU CORPORATION Document No.: M-W3772AE-8.0...
- Page 2 Ensure that you clearly understand the meanings of the symbols BEFORE using the equipment. Some or all of the following symbols may be used on all Anritsu equipment. In addition, there may be other labels attached to products that are not shown in the diagrams in this manual.
- Page 3 For Safety WARNING ● ALWAYS refer to the operation manual when working near locations at which the alert mark shown on the left is attached. If the advice in the operation manual is not followed, there is a risk of personal injury or reduced equipment performance.
- Page 4 Calibration ● The performance-guarantee seal verifies the integrity of the equipment. To ensure the continued integrity of the equipment, only Anritsu service personnel, or service personnel of an Anritsu sales representative, should break this seal to repair or calibrate the equipment. Be careful not to break the seal by opening the equipment or unit covers.
- Page 5 For Safety CAUTION Cleaning ● Always remove the main power cable from the power outlet before cleaning dust around the power supply and fan. Clean the power inlet regularly. If dust accumulates around the power pins, there is a risk of fire. Keep the cooling fan clean so that the ventilation holes are not obstructed.
- Page 6 For Safety Class 1 indicates the danger degree of the laser radiation specified Laser Safety below according to IEC 60825-1:2007. Class 1: Lasers that are safe under reasonably foreseeable conditions of operation, including the use of optical instruments for intrabeam viewing. Class I indicates the degree of danger of the laser radiation outlined below as defined by 21 CFR 1040.10:1995.
- Page 7 For Safety Laser Safety The model names of “Anritsu-recommended SFP/SFP+” written on label are listed in Table 1. Table 1 Laser Safety Classifications Based on IEC 60825-1:2007 Beam Max. Optical Emitted Pulse Width (s)/ Radiation Laser Model Name Class Output Power...
- Page 8 For Safety Table3 Labels on Product Type Label Location Model Name MP2100B and Explanation Figure 1, A MP2100B-051 MP2100B and Certification Figure 1, B MP2100B-051 MP2100B and Identification Figure 1, C MP2100B-051 viii...
- Page 9 For Safety Laser Radiation Markings Figure 1 Locations of Labels (Top View) Figure 2 Location of Laser Aperture...
- Page 10 Back-up Battery backup the memory. This battery must be replaced by service personnel when it has reached the end of its useful life; contact the Anritsu sales section or your nearest representative. Note: The battery used in this equipment has a maximum useful life of 2 years.
- Page 11 Anritsu will not be held responsible for lost data. Note: The flash memory used in this equipment has a maximum writing time of one million.
- Page 12 In addition, this warranty is valid only for the original equipment purchaser. It is not transferable if the equipment is resold. Anritsu Corporation shall assume no liability for damage or financial loss of the customer due to the use of or a failure to use this equipment, unless the damage or loss is caused due to Anritsu Corporation’s intentional or gross...
- Page 13 Anritsu Corporation Contact In the event of this equipment malfunctions, please contact an Anritsu Service and Sales office. Contact information can be found on the last page of the printed version of this manual, and is available in a separate file on the PDF version.
- Page 14 Notes On Export Management This product and its manuals may require an Export License/Approval by the Government of the product's country of origin for re-export from your country. Before re-exporting the product or manuals, please contact us to confirm whether they are export-controlled items or not. When you dispose of export-controlled items, the products/manuals need to be broken/shredded so as not to be unlawfully used for military purpose.
- Page 15 2012/19/EU (the “WEEE Directive”) in European Union. For Products placed on the EU market after August 13, 2005, please contact your local Anritsu representative at the end of the product's useful life to arrange disposal in accordance with your initial contract and the local law.
- Page 16 Anritsu electronic equipment, etc.). By using this Software, you shall be deemed to have agreed to be bound by the terms of this EULA, and Anritsu Corporation (hereafter Anritsu) hereby grants you the right to use this Software with the Anritsu specified equipment (hereafter Equipment) for the purposes set out in this EULA.
- Page 17 US embargoed countries or (b) to anyone financial or otherwise, due to your violation restricted by the Japanese export control of the terms of this EULA, Anritsu shall have regulations, or the US Treasury the right to seek proportional damages from Department's list of Specially Designated you.
- Page 18 Cautions Against Computer Virus Infection Copying files and data ● Only files that have been provided directly from Anritsu or generated using Anritsu equipment should be copied to the instrument. All other required files should be transferred by means of USB flash drive or CompactFlash media after undergoing a thorough virus check.
- Page 19 CE Conformity Marking Anritsu affixes the CE conformity marking on the following product(s) in accordance with the Decision 768/2008/EC to indicate that they conform to the EMC, LVD, and RoHS directive of the European Union (EU). CE marking 1. Product Model...
- Page 20 B: The equipment shall continue to operate as intended after the test. No degradation of performance or loss of function is allowed below a performance level specified by the manufacturer, when the equipment is used as intended. The performance level may be replaced by a permissible loss of performance.
- Page 21 4. Contact Name: Anritsu GmbH Address, city: Nemetschek Haus, Konrad-Zuse-Platz 1 81829 München, Country: Germany Name: ANRITSU EMEA Ltd. Address, city: 200 Capability Green, Luton Bedfordshire, LU1 3LU Country: United Kingdom...
- Page 22 RCM Conformity Marking Anritsu affixes the RCM mark on the following product(s) in accordance with the regulation to indicate that they conform to the EMC framework of Australia/New Zealand. RCM marking 1. Product Model Model: MP2100B BERTWave 2. Applied Standards...
- Page 23 About Eco label The label shown on the left is attached to Anritsu products meeting our environmental standards. Details about this label and the environmental standards are available on the Anritsu website at https://www.anritsu.com xxiii...
- Page 24 xxiv...
- Page 25 About This Manual The manual set for the BERTWave Series consists of the following five operation manuals: MP2100B BERTWave Operation Manual Operation (M-W3772AE) (This Manual) This manual is intended for those who use the MP2100B BERTWave, and explains the installation procedure, handling precautions, connector connection procedures, panel operations, maintenance procedures, specifications and various functions.
- Page 26 This operation manual assumes the reader has the following basic knowledge: • Optical communications, handling optical parts • Windows file operations and the Windows Control Panel Manual Notation System The MP2100B BERTWave is referred to as the BERTWave in this manual.
- Page 27 Table of Contents For Safety ............iii About This Manual ..........I Chapter 1 Outline ..........1-1 Introduction of BERTWave .......... 1-2 Configuration .............. 1-3 Features ..............1-8 Intended Use .............. 1-9 Technical Terms ............1-13 Abbreviations ............1-23 Chapter 2 Before Use ......... 2-1 Unpacking and Installation ..........
- Page 28 Chapter 4 Screen Operation ......4-1 Screen Configuration ..........4-2 Data Input Method ............4-5 Setting System Menu ..........4-8 Multi-channel Signal Output ........4-15 Simultaneous Measurement Start and Stop at Multi-channels............4-16 Linking Measurement Settings for Multiple Channels . 4-17 Displaying BER Measurement Results for Multiple Channels ..............
- Page 29 Measurement Procedure ........... 7-20 Calibrating Sampling Oscilloscope ......7-21 Setting Clock Recovery and Rate ......7-25 Setting Data Collection Method ......... 7-30 Setting Pattern Length ..........7-35 Collecting Data ............7-36 7.10 Adjusting Screen Scale ..........7-38 7.11 Measuring Waveform ..........7-44 7.12 Using Marker ............
- Page 30 Appendix A Specifications ....... A-1 Appendix B Initial Values ......... B-1 Appendix C Keyboard and Mouse Operations ........C-1 Appendix D Pattern Files ........D-1 Appendix E Performance Test Record Form .. E-1 Appendix F Bibliography ........F-1 Index ........... Index-1...
- Page 31 Chapter 1 Outline This chapter explains the BERTWave types and features, and technical terms used in this manual. Introduction of BERTWave ........... 1-2 Configuration ..............1-3 1.2.1 Standard Configuration ........1-3 1.2.2 Options ............. 1-4 1.2.3 Optional Accessories ........1-6 Features ................
- Page 32 Chapter 1 Outline 1.1 Introduction of BERTWave The MP2100B BERTWave is a measuring instrument that combines the functions of a pulse pattern generator (PPG), bit error detector (ED) and sampling oscilloscope all-in-one instrument. The PPG creates a digital signal with editable data transmission speed, pulse voltage level, and send data pattern.
- Page 33 Configuration 1.2 Configuration 1.2.1 Standard Configuration The following table lists the standard configuration of the BERTWave. Table 1.2.1-1 Standard Configurations Model/ Item Product Name Q’ty Remarks Ordering No. Main unit MP2100B BERTWave Accessories MX210000A BERTWave Control Contained Software (CD-ROM) in accessory box.
- Page 34 The numbers of the options added are indicated on the label on the rear panel. For details of whether retro-fitted options or software options are included, please refer to the ordering information on the Anritsu website. https://www.anritsu.com/en-us/test-measurement/products/mp2100b Table 1.2.2-1 MP2100B Option List...
- Page 35 Configuration Table 1.2.2-1 MP2100B Option List (Cont’d) Option Number Name Description MP2100B-053* Clock Recovery (External Data) MP2100B-054* Clock Recovery (Optical Data) MP2100B-055* Clock Recovery (with BER Measurement) MP2100B-063* High Rate Filter Bank MP2100B-065* Low Rate Filter Bank MP2100B-069* Multi Rate Filter Bank MP2100B-070 LPF for 156M (L) MP2100B-071...
- Page 36 Chapter 1 Outline 1.2.3 Optional Accessories Table 1.2.3-1 shows the optional accessories for BERTWave. Table 1.2.3-1 Optional Accessories Model/Order No. Name Remarks MX210001A Jitter Analysis Software MX210002A Transmission Analysis Software B0650A Rack Mount Kit B0716A Carrying Case G0177A 850 nm SFP Module (1.062 to 4.25Gbit/s) G0178A 1310 nm SFP Module (0.155 to 2.67Gbit/s) G0179A...
- Page 37 Configuration Table 1.2.3-1 Optional Accessories (Cont’d) Model/Order No. Name Remarks J1349A Coaxial Cable 0.3 m J1359A Coaxial Adaptor (K-P.K-J,SMA) J1510A Pick OFF Tee J1512A 7.5G Passive Probe Set J1519A Optical Fiber Cord (MM, 12FIBER, MPO, 3M) J1680A 4Channel CWDM MUX or DEMUX J1681A MPO Loopback Cable J1682A...
- Page 38 Easy touch panel operation Compact size (180 mm deep) 4-channel simultaneous BER measurement, handy for QSFP module testing (Option 014) GPIB interface option for remote control Compatibility of remote commands with previous Anritsu measuring instruments...
- Page 39 Intended Use 1.4 Intended Use The BERTWave can be used for the following applications: Evaluating optical transceivers used in optical fiber communications Evaluating parts for digital communications Evaluating optical transceivers used in optical fiber communications Computer-based and public communications systems send and receive digital signals.
- Page 40 Chapter 1 Outline Table 1.4-1 Transmitter Optical Output Item Specifications Transmission rate 9.95328 Gbit/s ±20 ppm (10GBASE-LR) 10.3125 Gbit/s ±20 ppm (10GBASE-LW) Center wavelength 1260 to 1355 nm Averaging output –8.5 to 0.5 dBm Minimum modulation amplitude –5.2 dBm Minimum extinction ratio 3.5 dB Eye mask pattern (0.25, 0.40, 0.45, 0.25, 0.28, 0.40)
- Page 41 Intended Use Excluding center wavelength, the items in Table 1.4-1 are tested with the BERTWave. The following figure shows a connection example between the DUT and the measurement. BERTWave (Option 014 and 023) Sampling Scope Optical Input PPG (Pulse Pattern Generator) Output Transmitter (DUT) Figure 1.4-3 Transmitter Test Method...
- Page 42 Chapter 1 Outline Excluding center wavelength, the items in Table 1.4-2 are used to test E/O converters, optical power meters, optical attenuator, and optical couplers with the BERTWave. The following figure shows a connection example for the BERTWave when SFP + module is being measured. BERTWave (Option 014) PPG output ED input...
- Page 43 Technical Terms 1.5 Technical Terms This section explains the technical terms used in this manual. 0 Level (Zero Level) At Eye pattern measurement, the maximum level at the center 20% of the bit interval is the average value of the low histogram. 1 Level (One Level) At Eye pattern measurement, the maximum level at the center 20% of the bit interval is the average value of the high histogram.
- Page 44 Chapter 1 Outline PRBS (Pseudo-Random Bit Sequence) PRBS is the abbreviation for pseudorandom bit sequence. It is a bit string approximating actual communications data with a random distribution of “1” and “0”. In a bit length of 2 -1, n is called the number of the PRBS. Using the BERTWave, n can be set to 7, 9, 15, 23, and 31.
- Page 45 Technical Terms SNR (Signal to Noise Ratio) This is the ratio of the signal amplitude to the noise amplitude. The sampling oscilloscope can be calculated by the following formula. SNR= (1 Level–0 Level)/( + : 1 Level Standard Deviation ...
- Page 46 Chapter 1 Outline Eye Pattern The Eye Pattern is the pattern created by superimposing the digital waveforms sampled at the same timing. First measured waveform Second measured waveform Third measured waveform Fourth measured waveform Super- imposed waveforms Eye pattern Figure 1.5-3 Eye Pattern Drawing Method 1-16...
- Page 47 Technical Terms Eye Width Eye Width is equivalent to Eye Height in the horizontal direction. It is calculated from a histogram of the two eye pattern crossing points in the time direction. Eye Width = (t –3 ) – (t +3...
- Page 48 Chapter 1 Outline Sampling Oscilloscope The sampling oscilloscope is a function for monitoring the waveform of the input signal. It requires a clock input sampling and the waveform is drawn out of the clock timing. For a periodic signal like PRBS, the waveform data is obtained by slightly varying the sampling timing.
- Page 49 Technical Terms Extinction Ratio The extinction ratio is the ratio of 1 Level and 0 Level; it is used for evaluating optical signal waveforms. The extinction ratio is calculated by the following formula. Extinction Ratio = 10log – L )/(L –...
- Page 50 Chapter 1 Outline Rise/Fall Time The Rise Time is time taken for the signal level to change to the next level. From 20% level of amplitude to 80% From 10% level of amplitude to 90% The Fall Time is the time taken for the signal level to change to the next level.
- Page 51 Technical Terms Bit Error Rate The Bite Error Rate is the ratio of the total received bits and error bits. It depends on the SNR (signal to noise ratio). Standard Deviation of Noise Amplitude n Signal Amplitude s Threshold Bit error ratio Figure 1.5-11 Bit Error Rate When the distribution of the noise voltage amplitude is assumed to follow a normal distribution, the standard deviation is assumed to be n and the...
- Page 52 Chapter 1 Outline Bit Rate The Bit Rate is the speed at which the communications interface sends and receives data. It is expressed in its center per second as bit/s or bps. Mask Margin This is margin of the masked waveform at the eye pattern mask test. The margin in the amplitude direction is the ratio to the interval from the edge of the eye mask to the 1 Level or the 0 Level.
- Page 53 Abbreviations 1.6 Abbreviations The abbreviations used in this manual are listed in Table 1.6-1. Table 1.6-1 Abbreviation Abbreviation Formal Name 10 GbE 10 Giga bit Ethernet Application Attenuator Average Bit Error Rate BERT Bit Error Rate Tester BERTS Bit Error Rate Test Set Binary bit per second Band Width...
- Page 54 Chapter 1 Outline Table 1.2.3-1 Abbreviation (Cont’d) Abbreviation Formal Name Insertion Internal International Telecommunication Union Local Area Network LVDS Low Voltage Differential Signaling LVPECL Low-Voltage Positive Emitter-Coupled Logic NECL Negative Emitter Coupled Logic Negative Non Return Zero OBSAI Open Base Station Architecture Initiative Optical to Electrical Omission Optical Transport Network...
- Page 55 Chapter 2 Before Use This chapter explains the following items: Procedures from unpacking through turning power-on Panel name and operation Control panel and peripheral devices settings Damage prevention measures Unpacking and Installation ..........2-2 2.1.1 Unpacking ............2-2 2.1.2 Installation ............
- Page 56 Chapter 2 Before Use 2.1 Unpacking and Installation 2.1.1 Unpacking At unpacking, check that all items are included. Contact an Anritsu Service and Sales office if any parts are missing or damaged. Keep the original packaging materials. They are required when transporting the BERTWave in future.
- Page 57 Unpacking and Installation Figure 2.1.2-2 Prohibited Installation—Stacking CAUTION Do not stack multiple BERTWave units one on top of the other when using them. There is a risk of injury, because stacked units are unstable and can fall due to vibration or shock.
- Page 58 Chapter 2 Before Use units side-by-side, make sure that hot air exhausted from one unit is not taken into the adjacent unit, otherwise overheating may occur. CAUTION Although BERTWave operates ambient temperature of 5 to 40°C, avoid using it in locations, such as the following, since it may cause failure.
- Page 59 Part Names 2.2 Part Names 2.2.1 Front Panel Disk Access Lamp Display Stand by Lamp Power On Lamp Rotary Knob Power Switch Earth Terminal Scope O/E Data In (Ch B In) Optical Input Connector* Trigger Clk In CRU Out Clock Recovery Sampling O scilloscope Unit Output Terminal* Trigger Input Terminal *...
- Page 60 Chapter 2 Before Use Scope Ch B In Ch A In Data Out Data Out Data Out Data Out Data Out Data Out Data Out Data Out Data/CRU In Data In Data In Data In Data In Data In Data In Data In Pulse Pattern Generator Sampling O scilloscope...
- Page 61 Part Names The following table describes the input terminals. Table 2.2.1-2 Input Terminal List Name Description Maximum Input Level O/E Data In When the Option 023 is installed 1.58 mW (+2 dBm)* (Ch B In) For signal input to channel B of the sampling oscilloscope When the Option 054 is installed This also serves as clock recovery...
- Page 62 Chapter 2 Before Use 2.2.2 Rear Panel External Clock Input* 10 MHz Clock Input* GPIB Connector Serial Number, Option Number Label Functional Ground Inlet Terminal Figure 2.2.2-1 Rear Panel When the Option 011, 012, or 014 is installed The following table describes the clock input terminals. Table 2.2.2-1 Clock Input Terminal List Name Description...
- Page 63 Part Names 2.2.3 Side Panel Line Input Line Output Mic Input Ethernet Monitor Output Monitor (VGA) Output (DVI) Serial Serial Interface Interface Figure 2.2.3-1 Left Side Panel WARNING Do not insert any metal object like, such as tweezers or a screwdriver, into vents on the side panels.
- Page 64 Chapter 2 Before Use 2.3 Power Connection 2.3.1 Power Requirements For normal operation of the BERTWave, use the power voltage range described below. Table 2.3.1-1 Power Requirements Power source Voltage range Frequency 100 Vac system 100 to 120 V 50 to 60 Hz 200 Vac system 200 to 240 V 50 to 60 Hz...
- Page 65 Power Connection 2.3.2 Connecting Power Cord Insert the power plug into an outlet, and connect the other end to the power inlet on the rear panel. To ensure that the BERTWave is grounded, always use the supplied 3-pin power cord, and insert the plug into an outlet with an earth terminal.
- Page 66 Chapter 2 Before Use 2.4 Connecting Peripheral Devices USB devices USB devices such as mouse, keyboard, storage, etc., can be connected to the left side panel USB connector. No panel operations are required before removing USB devices from the BERTWave. USB devices can be removed at any time as long as no files are being written to or read from the USB device.
- Page 67 Connecting Remote Control Devices 2.5 Connecting Remote Control Devices Ethernet Connects to the connector on the either up or down side of the two Ethernet connectors on the left side panel. Use a category-5 or better crossover cable. GPIB GPIB can be used when the GPIB Option 030 is installed. Connect the cable to the rear-panel GPIB connector.
- Page 68 Chapter 2 Before Use 2.6 Cautions on Handling Optical Fiber Cables Optical fiber cables may degrade in performance or be damaged if handled improperly. Note the following points when handling them. CAUTION Do not pull the cable when removing the connector.
- Page 69 Cautions on Handling Optical Fiber Cables CAUTION Do not excessively pull on or twist an optical fiber cable. Also, do not hang anything by using a cable. Doing so may break the optical fiber inside the cable. CAUTION Be careful not to hit the end of an optical connector against anything hard such as the floor or a desk by dropping the optical fiber cable.
- Page 70 Chapter 2 Before Use 2.7 Connecting Coaxial Cable Connect the coaxial cable to the BERTWave coaxial connector. Note the following precautions when handling coaxial cable. WARNING Always use a coaxial cable with sufficiently low loss matching signal measured. Correct measurement may be impossible if the cable loss is too large.
- Page 71 Installing Optical Transceiver 2.8 Installing Optical Transceiver An optical transceiver can be used by adding the Option 051. For recommended optical transceiver model names, refer to Section 8.2.2 “Optical Transceiver Types”. The optical transceiver can be installed or removed (hot-swap) while the BERTWave power is on.
- Page 72 Operation is not assured if an optical transceiver other than those recommended by Anritsu is used. Only use recommended modules. The list of recommended modules are available at our website: https://www.anritsu.com/en-us/test-measurement/prod ucts/mp2100b ...
- Page 73 Installing Optical Transceiver 2.8.2 Removing Optical Transceiver Set the optical output of the optical transceiver to OFF. Turn off the signal input to the Tx Data In connector. Disconnect the optical fiber from the optical transceiver. Tilt the optical transceiver lever towards you. Pull the optical transceiver out by the lever.
- Page 74 Chapter 2 Before Use 2.9 Turning Power On/Off 2.9.1 Power-on Connect the power cord plug, referring to Section 2.3 “Power Connection”. The BERTWave enters the standby state and the power switch lamp lights orange. Press the power switch. The power lamp lights green and the Windows start-up begins. In 30 seconds, the selector screen is displayed.
- Page 75 Turning Power On/Off The Selector screen buttons execute the following processing: [Main Application]: Displays the application screen where you can configure settings for the PPG, ED, sampling oscilloscope, and optical interface and view the measurement results. For details on how to use the screen, refer to the following chapters: ...
- Page 76 A fault may have occurred if the power cannot be turned off even by pressing the Power switch for 4 or more seconds. Unplug the power cord from the power outlet and contact your Anritsu Service and Sales Office or agent. ...
- Page 77 2.10 Using Touch Panel and Rotary Knob 2.10 Using Touch Panel and Rotary Knob The BERTWave can be operated using the touch panel and rotary knob. Touch Panel Operation The touch panel has the same hardness as a 3H lead pencil. Touching the screen with anything sharp or hard will damage it.
- Page 78 Windows settings are changed. Read the general notes in this section carefully when changes to the Windows settings are required. CAUTION Anritsu guarantees the BERTWave to work properly only when the factory settings for Windows have not been changed. BERTWave operations are not guaranteed if program installation or update, including Windows Update, is performed.
- Page 79 2.11 Setting Control Panel 2.11.2 Setting Control Panel The system time, external display settings and touch panel settings are set at the Windows Control Panel. Do not change any settings other than those listed in Table 2.11.2-1. Table 2.11.2-1 Description of Control Panel Icon Description Date and Time...
- Page 80 Chapter 2 Before Use 2.12 Using External Monitor When using a DVI connector You don’t need to make any settings when using a DVI connector to connect the BERTWave to an external monitor. When the external monitor is connected with the DVI connector, the BERTWave screen will be displayed on the external monitor.
- Page 81 2.12 Using External Monitor 12. Touch the button if [Aspect Ratio Options] is enabled. A new window opens. If [Aspect Ratio Options] is not available, proceed to step 15. 13. Touch [Maintain Aspect Ratio]. 14. Touch [OK] to close the separate window. 15.
- Page 82 Chapter 2 Before Use 2.13 Configuring Power Options You can increase the life of the monitor by using the standby feature in Windows. Follow the procedure described below to set to turn off the monitor after a specified period of time. Touch [Start] on the right bottom of the screen.
- Page 83 2.14 Setting Interface for Remote Control 2.14 Setting Interface for Remote Control This section describes how to set the type and address of the interface used for remote control of the BERTWave. 2.14.1 To display setup window Touch [Setup Utility] in the selector screen. Touch [Remote Control].
- Page 84 Chapter 2 Before Use 2.14.2 To set GPIB In the Active Interface area of the Remote Control window, touch the button to change the button name to GPIB. If the Option 030 is not installed, GPIB is not displayed. Touch the GPIB Address text box. A dialog box for inputting the address is displayed.
- Page 85 2.14 Setting Interface for Remote Control 2.14.3 To set Ethernet In the Active Interface area of the Remote Control window, touch the button to change the button name to Ethernet. Set the IP address, Subnet Mask and Gateway for the Ethernet connector.
- Page 86 Chapter 2 Before Use [Network Connections]. Do not change the Windows [Control Panel] - [Network Connections] Internal Connection setting. Otherwise, the BERTWave may not work correctly. If the IP address has been changed, restore the settings to the following values. IP address: 192.168.1.1 Subnet mask:...
- Page 87 2.14 Setting Interface for Remote Control Right-click [Local Area Connection (Upper)] or [Local Area Connection (Lower)], and then click [Properties]. The Local Area Connection Properties dialog box opens. Click [Internet Protocol (TCP/IP)] in the list box, and click the [Properties] button. Click [Use the following IP Address] or [Obtain an IP address automatically].
- Page 88 Never open the case of the BERTWave. If you open it and BERTWave has failed or sufficient performance cannot be obtained, Anritsu may not accept a request for repair. 2.15.1 Precautions on Electrostatic Discharge and Electrical Overstress CAUTION ...
- Page 89 2.15 Precautions for Preventing Damage CAUTION The outer conductor and core of the coaxial cable may become charged as a capacitor. Use any metal to discharge the outer conductor and core before use. The BERTWave has many important circuits and parts including hybrid ICs.
- Page 90 Chapter 2 Before Use BERTWave AC Outlets Connect to a common ground. Coaxial Cable Connect a protective attenuator, within the Be sure to connect the ground structure Use 3-pin power cords. (like frame ground) and the ground range not affecting results of measurement. DUT: Device Under Test terminal with a ground wire.
- Page 91 2.15 Precautions for Preventing Damage Notes: If it is impossible to connect a ground wire to DUT, follow the instructions below so that the voltage to be measured in step 3 becomes 0 V. Check that the 3-pin power cords described in 2.3.2 “Connecting Power Cord”...
- Page 92 Chapter 2 Before Use 2.15.2 Precautions When Using Bias-T When connecting an external device such as a Bias-T to the output connectors of the BERTWave, if the output signal includes any DC voltage, variations in the output of the DC power supply or load may change the level of the output signal, risking damage to the internal circuits.
- Page 93 2.15 Precautions for Preventing Damage <Recommended procedures> Measurement Preparation 1: Connect the BERTWave and all equipment. Set the DC power supply output to ON. Set the BERTWave output to ON, and start measurement. Measurement Preparation 2: Set the BERTWave output to OFF. Set the DC power supply output to OFF.
- Page 94 Chapter 2 Before Use 2.16 System Recovery Function The BERTWave has system recovery function to restore data on the hard disk to the factory shipment status. These functions can be used in the event of system instability. CAUTION Fully understand the following and back up all necessary data before performing a system recovery.
- Page 95 2.16 System Recovery Function <Procedure> Disconnect the BERTWave from the network if connected. Connect the keyboard and mouse to the mainframe, and then turn the BERTWave power On. After the BIOS screen is displayed, press the F4 key on the keyboard when [Press F4 to start recovery from Backup Capsule] appears.
- Page 96 Chapter 2 Before Use 2-42.
- Page 97 Chapter 3 Connecting with DUT The connection methods depend upon either optical or electrical DUT interface. When changing the optical level input to the DUT such as the reception sensibility measurement, connect other measurement instruments such as optical attenuator. This chapter explains how to connect the BERTWave and the DUT. Measuring Bit Error Rate ..........
- Page 98 Chapter 3 Connecting with DUT 3.1 Measuring Bit Error Rate When the DUT input/output signal is electrical: Connect the DUT input terminal to PPG2 Data Out and Data Out connectors using the coaxial cable. If the DUT has only one input connector, connect it to the Data Output connector of PPG2.
- Page 99 Measuring Bit Error Rate When DUT is Optical Receiver: Use the Option 051 and follow the connection procedures. Connect the PPG2 Data Out and Tx Data In using a coaxial cable. Connect the DUT input connector to the Optical transceiver using an optical fiber.
- Page 100 Chapter 3 Connecting with DUT When the DUT changes the signal level using the optical receiver: When measuring the sensibility of the optical receiver, connect to the optical attenuator to change the signal level input to the DUT. Connect to the optical power meter to measure the optical level. Use the optical coupler to bifurcate the optical signal into the optical power meter and DUT.
- Page 101 Measuring Bit Error Rate Connect as shown in the following figure. Tx Data In PPG2 Coaxial Cable Optical Fiber Optical Attenuator Optical coupler or optical switch Optical Power Meter Figure 3.1-3 Connection for Changing Optical Level Input to Optical Receiver...
- Page 102 Chapter 3 Connecting with DUT When the DUT is an optical transmitter: Use the Option 051 and follow the connection procedures. Connect the PPG2 Data Out and Data Out to the DUT input terminal using a coaxial cable. Connect the DUT output connector to optical transceiver for an optical input connector using an optical fiber.
- Page 103 Measuring Waveform 3.2 Measuring Waveform When the DUT input/output signal is electrical: Input the output of the PPG in the BERTWave to the DUT, and then measure the DUT output using the sampling oscilloscope. Connect the DUT input terminal to PPG1 Data Out/Data Out using a coaxial cable.
- Page 104 Chapter 3 Connecting with DUT When the DUT is an optical transceiver: When the Option 023 is selected, the output waveform of the optical transceiver can be measured using the O/E converter. Input the output of the PPG in the BERTWave to the DUT, and then connect the DUT optical output to the O/E Data In converter.
- Page 105 Measuring Waveform O/E Data In Trigger Clk Input PPG1 Sync Out Coaxial Cable Optical Fiber Figure 3.2-2 Optical Transceiver Used as DUT (Option 012, 023)
- Page 106 Chapter 3 Connecting with DUT When the DUT is an optical transceiver (using clock recovery) The trigger clock can be generated from the received signal when the Option 023 is installed and the Option 054 is added. Connect the CRU Out to Trigger Clk In using a coaxial cable. Connect the PPG output to the DUT input connector using a coaxial cable.
- Page 107 Measuring Waveform O/E Data In CRU Out Trigger Clk In Coaxial Cable Optical Fiber Pulse Pattern Generator CLK Out Data Data Figure 3.2-3 Optical Transceiver Used as DUT (Option 023,054) 3-11...
- Page 108 Chapter 3 Connecting with DUT 3.3 Simultaneously Measuring Bit Error Rate and Waveform When the optical transceiver is set as the DUT, the reception sensibility of the optical receiver and the waveform of the optical transmitter can be measured simultaneously. To measure the reception sensibility of the optical receiver, the bit error rate must be measured using the measurement type that can change the optical level input to the DUT.
- Page 109 Simultaneously Measuring Bit Error Rate and Waveform CAUTION Check the following before connecting the optical fiber: The output power for the optical module inserted with the Option 051 is within the input level range for the DUT. The DUT optical output level does not exceed the rated optical input level for O/E Data In.
- Page 110 Chapter 3 Connecting with DUT 3.4 Measuring QSFP Module Bit Error Rate The QSFP module contains four pairs of transmitters and receivers. With the Option 014, the QSFP Module bit error rate can be measured for four channels simultaneously. If using a separate QSFP for transmission in addition to the DUT QSFP, connect as follows.
- Page 111 Measuring QSFP Module Bit Error Rate PPG1 to PPG4 ED1 to ED4 QSFP for Signal Optical Attenuator QSFP Under Test Coaxial Cable Optical Power Meter Optical Fiber Optical Coupler or Optical Switch Figure 3.4-1 Simultaneously Measuring Bit Error Rate for 4 Channels (Option 014) CAUTION Check that the optical output level input to the DUT QSFP...
- Page 112 Chapter 3 Connecting with DUT 3-16.
- Page 113 Chapter 4 Screen Operation This chapter explains the screen name and common operating method of the BERTWave series. Screen Configuration ............ 4-2 Data Input Method ............4-5 Setting System Menu ............ 4-8 Multi-channel Signal Output ........4-15 Simultaneous Measurement Start and Stop at Multi-channels .............
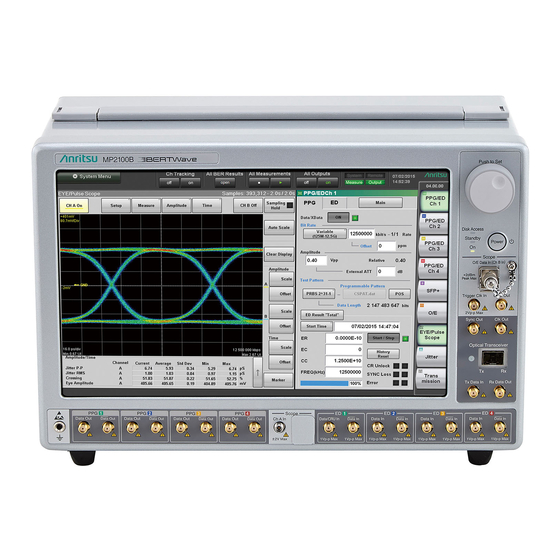
- Page 114 Chapter 4 Screen Operation 4.1 Screen Configuration Touch [Main Application] on the selector screen, and then the application screen is displayed. Figure 4.1-1 shows the names of application screen elements. Measurement Screen Date/Time All Output All Measurement Status System Menu Function Menu Display Area Display...
- Page 115 Screen Configuration Table 4.1-1 Application Screen Elements Name Description All BER Results Displays the BER measurement results for multiple channels. All Measurements Starts and stops up to four channels of error rate measurement (Options 011, 012, 014) and two channels of waveform data (Options 021, 023) sampling at the same time.
- Page 116 Chapter 4 Screen Operation The buttons available on the function menu will vary depending on the installed options and software. The following table shows the relation between available buttons and installed options and software. Table 4.1-2 Buttons Displayed on Function Menu Option Software Function menu...
- Page 117 Data Input Method 4.2 Data Input Method The measurement setting item selection, numeric data, and character data are input from the panel displayed on the screen. The displayed panel varies depending on the input data types. Arrow Key Entry Panel Touch the numeric data area when entering the numeric data of the bit rate or power voltage.
- Page 118 Chapter 4 Screen Operation Numeric value entry panel Touch the button for switching the display of the numeric value entry/ arrow key entry panel as shown in Figure 4.2-1, and then the numeric value entry panel as shown in Figure 4.2-2 is displayed. The key type, unit and input range displayed on the panel vary depending on the data.
- Page 119 Data Input Method Software Keyboard When entering character string data such as file name, touch the [Screen Keyboard]. The keyboard as shown in Figure 4.2-3 is displayed, and then touch the key and enter the character. If you touch [Shift] or [Caps] once, all keys are locked.
- Page 120 Chapter 4 Screen Operation 4.3 Setting System Menu The following items can be set and confirmed at the system menu. Saving measurement conditions and measurement results Reading measurement conditions Saving screen image Initializing device settings Buzzer ...
- Page 121 When saving the file name, touch [OK]. Also, when canceling the saving procedure, touch the close button. The measurement condition file is saved in the following folder. C:\Program Files\Anritsu\MP2100A\MX21000A\UserData\Setting The measurement result file is saved in the following folder. C:\Program Files\Anritsu\MP2100A\MX21000A\UserData\Result\CSV C:\Program Files\Anritsu\MP2100A\MX21000A\UserData\Result\TXT The CSV file cannot be read in the spreadsheet software.
- Page 122 Chapter 4 Screen Operation Reading measurement conditions from file Touch [Open] to display the Open panel. Select the target module form the following: [All], [PPG/ED Ch1], [PPG/ED Ch2], [PPG/ED Ch3], [PPG/ED Ch4], [SFP+], [EYE/Pulse Scope], [O/E], [Jitter], [Transmission] The displayed module varies with the model name and options. The file selection screen is displayed.
- Page 123 The initial value of the folder is as follows. C:\Program Files\Anritsu\MP2100A\MX21000A\UserData\Screen Copy The initial value of the file name is configured as date and time. For example, file 523 saved at 12:05:55 on 17 July 2015will have the...
- Page 124 Chapter 4 Screen Operation Initializing measurement conditions Touch [Initialize]. Then, the dialog box indicating the initialization process is displayed. Touch [OK] to initialize the measurement condition and touch [Cancel] to stop the initialization. When overwriting the screen file, the confirmation message is displayed.
- Page 125 Setting System Menu Figure 4.3-3 System Alarm Occurred Time The displayed time indicates the time when alarm occurred first. If the multiple alarms occur, the time after the second alarm is not record. Note: When the system alarm occurs, the system alarm screen is displayed automatically.
- Page 126 Chapter 4 Screen Operation Displaying the device internal signal connection Touch [Block Diagram]. The device internal block diagram is displayed, so the clock and signal connection can be confirmed. Touch [OK] or the close button, and then the block diagram is closed. Figure 4.3-4 Example of Block Diagram Minimizing the screen display Touch [Minimize] to display the desk top.
- Page 127 Multi-channel Signal Output 4.4 Multi-channel Signal Output The BERTWave can set PPG channels 1 to 4 and optical transceiver output to On/Off at the same time. To output signal of PPG and optical transceiver: Touch [On] as shown in Figure 4.4-1. The characters of [on] are changed to green and then the Output lamp for the status display is turned on.
- Page 128 Chapter 4 Screen Operation 4.5 Simultaneous Measurement Start and Stop at Multi-channels This BERTWave can measure error rates for four channels and sample waveform data for two channels simultaneously. To start simultaneous measurement, touch the [ ] key shown in Figure 4.5-1 while the Measure lamp is lit.
- Page 129 Linking Measurement Settings for Multiple Channels 4.6 Linking Measurement Settings for Multiple Channels Ch Tracking is displayed for the Options 012 or 014. Touching [on] sets the PPG and ED settings for Ch1 to the PPG and ED settings for other channels. In this state, altering settings for Ch1 also alters the settings for other channels.
- Page 130 Chapter 4 Screen Operation 4.7 Displaying BER Measurement Results for Multiple Channels All BER Results is displayed for the Options 012 or 014. Touching [Open] displays the BER measurement results for all channels. Figure 4.7-1 All BER Results Figure 4.7-2 All BER Results Display Table 4.7-1 All BER Results Screen Settings Name Description...
- Page 131 Displaying Date/Time and Status 4.8 Displaying Date/Time and Status To display date and time Date and time is displayed on the upper right side of the screen. Date and time can be changed from the Windows control panel. To display status The following four kinds of indicators indicate the status.
- Page 132 EYE/Pulse Scope calibration is necessary. Calibrate it according to Section 7.5 “Calibrating Sampling Oscilloscope”. PPG/ED Hardware Error Hardware error In the event of PPG/ED Hardware Error, contact an Anritsu Service and Sales office. You can check the system alarm occurred time from [System Menu] – [System Alarm].
- Page 133 Chapter 5 Generating Pulse Signal To measure the bit error rate or monitor a waveform, first a signal for input to the device under test (DUT) must be generated. In these measurements, a pulse signal with a time cycle is used. This chapter explains how to generate the pulse pattern signal while setting the output waveform and data pattern of the PPG.
- Page 134 Chapter 5 Generating Pulse Signal 5.1 List of Setting Items The following table items can be set using the PPG. Table 5.1-1 Setting Items of PPG Item Description Reference CLK Selects the clock to be used from the following items: Internal 10MHz: Use the internal clock based on the internal 10 MHz transmitter Ext 10MHz In:...
- Page 135 List of Setting Items Table 5.1-2 Setting Items of PPG Item Description Reference CLK Status Displays the reference clock synchronization status. Display Red: Reference clock cannot be detected. Yellow: Reference clock was detected, but is not synchronized with pattern data. Green: Reference clock is synchronized with pattern data.
- Page 136 Chapter 5 Generating Pulse Signal Screen size change Output switch Output indicator Divide ratio Reference CLK Reference CLK button Status Indicator Apply Bit Rate Sync Output Bit Rate Standard Bit Rate Offset External Amplitude Attenuator Programmable Factor Pattern Error Addition Test Pattern POS/NEG Insert Error...
- Page 137 List of Setting Items The PPG setting range is as follows: Amplitude 0.10 to 0.80 Vp-p Bit Rate Variable* 125 000 to 12 500 000 kbit/s Offset –100 to 100 ppm 1GFC 2GFC 4GFC 8GFC 10GFC 10GFC-FEC 1GbE 2GbE CPRI CPRI-2 CPRI-4 CPRI-5*...
- Page 138 Chapter 5 Generating Pulse Signal G.975 EFC OTU-2 Rate* 1/16 1/32 1/64 Data/XData Error Addition Repeat 1E–2 1E–3 1E–4 1E–5 1E–6 1E–7 1E–8 1E–9 1E–10 1E–11 1E–12 Single Insert Error External Attenuation 0 to 30 dB Reference CLK Internal 10MHz Ext 10MHz In Ext 1/16 In Ch1*...
- Page 139 List of Setting Items PPG2_1/1 Clk* PPG2_1/2 Clk* PPG2_1/4 Clk* PPG2_1/8 Clk* PPG2_1/16 Clk* PPG2_1/64 Clk* ED1_1/4 Clk* ED1_1/8 Clk* ED1_1/16 Clk ED2_1/4 Clk* ED2_1/8 Clk* ED2_1/16 Clk * ED3_1/4 Clk* ED3_1/8 Clk* ED3_1/16 Clk* ED4_1/4 Clk* ED4_1/8 Clk* ED4_1/16 Clk* PPG1_Pattern Sync PPG2_Pattern Sync* PPG3_Pattern Sync*...
- Page 140 Chapter 5 Generating Pulse Signal *9: 1/1, 1/2, 1/4 at Rate display *10: Option 012 or 014 *11: 1/2 at ED rate display *12: 1/1 at ED rate display *13: Option 014...
- Page 141 Setting Restrictions 5.2 Setting Restrictions The setting items of the PPG have the following restrictions. The clock and bit rate cannot be set for Ch3 or Ch4 with the Option 014. The clock and bit rate values will always be the same as for Ch1 or Ch2.
- Page 142 Chapter 5 Generating Pulse Signal 5.3 Procedure for Generating Pulse Signal The basic procedure is as shown in the following figure. Starting The pattern is set. Select a standard clock. Is the pattern Is the external Programmable clock used? Pattern? The pattern file is set.
- Page 143 Setting Reference Clock 5.4 Setting Reference Clock The PPG uses the reference clock to generate the data. The reference clock can be selected from the following supply sources: Internal clock generated inside the BERTWave External clock input from the Ext Clk In connector ...
- Page 144 Chapter 5 Generating Pulse Signal Improving PPG phase differences by synchronizing clock with Ch1 When Reference Clock is set to Internal at the Option 012 or 014, the data rates of PPG1 and PPG2 become the same but there is phase error in the data.
- Page 145 Setting Reference Clock Figure 5.4-2 Eye Pattern when Reference Clock is Internal Figure 5.4-3 Eye Pattern when Reference Clock is Ch1 Synchronized 5-13...
- Page 146 Chapter 5 Generating Pulse Signal When monitoring the waveforms of two DUTs simultaneously, make the following connections. Sampling Set Ch2 Reference Oscilloscope Option 012 or 014 Clk to Ch1 Ch A Ch B Input Input Sync Trigger Input Figure 5.4-4 Setup for Simultaneous Monitoring of Two Channels Set the Ch2 Reference Clock to Ch1 even when the measurement system includes long-distance transmission.
- Page 147 Setting Reference Clock CAUTION The impedance of the Ext Clk In and External 10 MHz Input connectors is 50 Ω. Measurement may not be performed correctly if a cable with another impedance is used. The amplitude of the signal input to the Ext Clk In connector is 1.6 Vp-p max.
- Page 148 Chapter 5 Generating Pulse Signal 5.5 Setting Output Waveform The PPG output terminal is the PPG Data and Data connectors on the front panel. The connector block diagram is as shown below. Data Data Amplitude Control Figure 5.5-1 Output Terminal Block Diagram The connector is an AC coupling.
- Page 149 Setting Output Waveform Set the bit rate and amplitude of the waveform output to the Data and Data connectors. Voltage (V) Cycle=1/(Bit Rate) Amplitude Time Figure 5.5-2 Waveform Setting Item To set bit rate Set the bit rate when Reference CLK has been set to [Internal 10MHz] or [Ext 10MHz In].
- Page 150 Chapter 5 Generating Pulse Signal Touch the bit rate specifications button. The number displayed in the button is the specified bit rate (bit/s). When indicating 1.25G, this means 1.25 Gbit/s. When selecting [Variable], touch the bit rate and offset text boxes and input the value.
- Page 151 Setting Output Waveform The following are the specifications for the voltage level of the high-speed interface. Table 5.5-2 lists the specified signal amplitude. Table 5.5-2 Signal Specifications and Amplitude Specifications Amplitude (V) LVDS 0.35 LVPECL NCML NECL PCML PECL 5-19...
- Page 152 Chapter 5 Generating Pulse Signal 5.6 Setting Patterns The following two test patterns can be selected. PRBS Programmable Pattern PRBS PRBS is the pattern generated at the hardware. The generated pattern length, maximum length of contiguous 1s, and maximum length of contiguous 0s differ depending on the hardware configuration.
- Page 153 The pattern length is 1305600 bits or less. When the file data length is over 1305600 bits, the first 1305600 bits are used. When using pattern files created for existing Anritsu products, use Pattern A only when the pattern file type is Alternate.
- Page 154 Chapter 5 Generating Pulse Signal Pattern Logic There are two types of logic; Positive Logic (POS) and Negative Logic (NEG). With positive logic, the voltage at the Data connector goes High when the data is “1”. With negative logic, the voltage at the Data connector goes Low when the data is “1”.
- Page 155 PCP or PTN). The compatibility with the previous product file is as shown in the following table. The file must be saved in the following folder before reading these files. C: \ Program Files \ Anritsu \ MP2100A \ MX210000A \ UserData \ Pattern 5-23...
- Page 156 Chapter 5 Generating Pulse Signal Table 5.6-1 File Compatibility with Previous Product File Supported/Not Product Name Pattern extension supported MU181020A Data MU181020B Alternate * Mixed (Data) Mixed (Alternate) * Sequence MP1758A PRGM 1ch PRGM 2ch ...
- Page 157 Inserting Bit Error 5.7 Inserting Bit Error Insert a bit error when confirming whether to detect the bit error at the ED. Bit errors can be inserted either by inserting bits one at a time using screen operation or by inserting a fixed rate to the bit string. Inserting bit errors one bit at a time using screen operation Touch the button under Error Addition and set to [Single].
- Page 158 Chapter 5 Generating Pulse Signal 5.8 Setting Sync Output Set the signal type output from the front-panel Sync Out connector. Sync Output connector outputs either a pulse synchronized to the data generated by the PPG, or a pulse synchronized to the data received by the ED, and outputs it at the front-panel Sync Out connector.
- Page 159 Setting Sync Output The Sync Output amplitude cannot be set. The time interval outputting the pulse varies depending on the pattern length and bit rate when Sync Output is PPG Pattern Sync . Select the pattern for the measurement referring to Table 5.8-1. Table 5.8-1 Cycle of Sync Output (PPG Pattern Sync) Bit Rate (kbit/s) Pattern Name...
- Page 160 Chapter 5 Generating Pulse Signal The signal types that can be selected will vary depending on the dividing ratio displayed in the PPG/ED Bit Rate setting. Sync Output combinations that can be selected depending on dividing ratio are shown in the following table. For PPG Ch2 and ED Ch2, Ch3, Ch4, replace PPG1 in the table with PPG2, and ED1 with ED2, ED3, and ED4.
- Page 161 Chapter 6 Measuring Bit Error This chapter explains how to set the interface of the ED and the measurement conditions and the conditions of the error detection for measuring the bit error rate. Function List ..............6-2 Procedure of Measuring Bit Error Rate ......6-9 Setting Conditions for Error Detection ......
- Page 162 Chapter 6 Measuring Bit Error 6.1 Function List The bit error rate can be measured at the Error Detector (ED). The ED has the following functions. Table 6.1-1 Items Set at ED Item Description Tracking Sets test pattern setting at PPG. Data Input Condition Sets connector used for inputting signal.
- Page 163 Function List Table 6.1-1 Items Set at ED (Cont’d) Item Description Bit Rate Standard Displays the communication specifications applying to transmission rate. Bit Rate Displays the bit rate. This is always the same as the bit rate set for the PPG. Data Length Displays the pattern length as bits.
- Page 164 Chapter 6 Measuring Bit Error Channel Display Screen size change ED tab button Figure 6.1-1 ED Setting Panel Bit Rate Screen size change Divide ratio Auto SYNC button Tracking Threshold Bit Rate Standard (Auto SYNC) Threshold (Data Input SYNC Control Condition) Data Input Frame head...
- Page 165 Function List Bit error rate (insertion) Bit error rate (omission) Bit error count (insertion) Bit error count (omission) Figure 6.1-3 ED Panel Result Display 2 Bit error rate Bit error count Alarm display/ History display Measurement progressing Measurement rate start/stop Figure 6.1-4 ED Panel Result Display 3 Bit error rate (total) Bit error rate (insertion)
- Page 166 Chapter 6 Measuring Bit Error Bit error rate (total) Bit error rate (insertion) Measurement Bit error rate (omission) start/stop Bit error count (total) Bit error count (insertion) Bit error count (omission) Clock count Frequency Measurement Alarm History progressing rate indicator indicator Figure 6.1-6 ED Panel Result Display 5 The setting range of the ED is as follows:...
- Page 167 Function List CPRI-10* Infiniband* Infiniband×2 Infiniband×4 10GbE WAN 10GbE LAN/PHY 10GbE OTU1e 10GbE OTU2e OBSAIRP3* OBSAIRP3×2* OBSAIRP3×4* OC-3/STM-1* OC-12/STM-4* OC-24* OC-48/STM-16* OTU-1* OC-192/STM-64 G.975 FEC OTU-2 Data Input Condition Differential 50 Ohm Electrical Single-Ended Data Electrical Single-Ended XData Threshold –85 to 85 mV (External Attenuator Factor = 0 dB) External Attenuation 0 to 30 dB ED Result...
- Page 168 Chapter 6 Measuring Bit Error Remaining Time Start Time SYNC Control Frame Position 1 to Data Pattern Length–64 Test Pattern PRBS2^7–1 PRBS2^9–1 PRBS2^15–1 PRBS2^23–1 PRBS2^31–1 Programmable Pattern Programmable Pattern POS/NEG Tracking *1: Refer to Table 5.5-1 for the setting ranges when the Option 092 is not installed.
- Page 169 Procedure of Measuring Bit Error Rate Procedure of Measuring Bit Error Rate The following figure shows the basic procedure for measuring the bit error rate. Start Set Auto S ync to O N. Track bit rate and pattern at PPG ? Set A uto S ync threshold rate.
- Page 170 Chapter 6 Measuring Bit Error 6.3 Setting Conditions for Error Detection The conditions for detecting bit errors must be set. Signal input terminal The signal input terminals for the ED are the ED1, ED2, ED3, and ED4 Data In connectors and Data In connector on the panel. The ED1 connector supports ED_Ch1 and the ED2 connector supports ED_Ch2.
- Page 171 Setting Conditions for Error Detection Select the signal input terminal depending on the Data Input Condition [Differential 50 Ohm]: Signal input terminal for both Data In and Data In connectors. The differential voltage of each signal input to two connectors is the input voltage. [Electrical Single-Ended Data]: Signal input terminal for Data In connector [Electrical Single-Ended XData]:...
- Page 172 Chapter 6 Measuring Bit Error Logic Select the positive logic (POS) or negative logic (NEG). Voltage (V) Input waveform to Time the Data In connector Input waveform to Time the Data In connector Logic Figure 6.3-3 Values Defined as Input Waveform Pattern The ED compares the received bit string and the internally generated bit stream bit-by-bit and evaluates it differences as it errors.
- Page 173 Setting Conditions for Error Detection To shorten the pattern sync time when SYNC Control is ON, set the value of the 64-bit string which is not duplicate in other portion in the same string to Frame Position in programmable pattern. The pattern synchronization takes much time if there are multiple 64-bit strings, which is the same as 64-bit string used for the same string synchronization detection.
- Page 174 Chapter 6 Measuring Bit Error 512 bits Received bit string 101010101010101010………101010101010101010101010…. Detected bit string 1010101010………101010101010 64 bits Figure 6.3-5 Pattern Detection Bit String when Frame Position is 1 The bit string used at pattern synchronization must occur at least once within the programmable pattern.
- Page 175 Setting Conditions for Error Detection An example is shown in Figure 6.3-7. There is just one bit different between data addresses 0x000000 to 0x00007F and addresses 0x000080 to 0x0000FF. When Frame Position is set to 1 at this programmable pattern, the 8 bytes of data from address 0x000000 to 0x000007 are used to detect pattern synchronization.
- Page 176 Chapter 6 Measuring Bit Error Pattern Sync Auto SYNC sets the pattern sync method. [On]: If the bit error rate set at Sync Threshold is exceeded, patterns synchronization is evaluated as lost and synchronization processing is performed. [Off]: Pattern synchronization processing is not performed. Set Auto Sync to [On] at measurement start.
- Page 177 Setting Conditions for Error Detection The following table shows the sync processing start and stop levels for each Sync Threshold selection. Table 6.3-1 Bit Error Rate when Threshold setting is INT Bit Error Rate Sync Sync Test Pattern Sync Control Pattern Length Processing Processing...
- Page 178 Chapter 6 Measuring Bit Error Table 6.3-2 Threshold Settings and Bit Error Rate (at 1E–2 to 1E–8) Bit Error Rate Sync Sync Processing Sync Processing Threshold Start Level Stop Level 2 2 1E–2 2.5 × 10 1.56 × 10 ...
- Page 179 Setting Conditions for Error Detection The setting procedure of the error detection conditions is as follows: When changing the bit rate and pattern of the PPG and applying the changing settings to the ED touch the Tracking button and set to [On].
- Page 180 Chapter 6 Measuring Bit Error CAUTION ● When attenuators are connected to both the Data In and Data In connectors, use attenuators with the same attenuation. If the amount of attenuation is different, the displayed threshold voltage and the actual threshold voltage may be different.
- Page 181 Setting Measurement Conditions 6.4 Setting Measurement Conditions To set how to measure bit error: Set Gating Cycle at Gating. [Single]: Performs measurement until the time set at the measurement period is exceeded. [Repeat]: Performs measurement until ER Result button display becomes [Stop].
- Page 182 Chapter 6 Measuring Bit Error Measurement method The ED Result display can be refreshed either in real time (approx. 1 s intervals) or when the progress bar reaches 100%. The display method is set at Current of Gating. [On]: Updates measurement results in real time. [Off]: Updates measurement results when progress reaches 100% for either Single or Repeat Gating Cycle.
- Page 183 Setting Measurement Conditions When SYNC Loss is displayed in red Pattern synchronization has not been obtained; check the following: The Test Pattern generated by the DUT matches the Test Pattern for the error detector. The Logic POS and NEG settings are correct. ...
- Page 184 Chapter 6 Measuring Bit Error 6.5 Measurement Result The following measurement result is displayed in the ED Result. Start Time: Time when bit error measurement started Elapsed Time: Time elapsed from start of bit error rate measurement When Gating Cycle is Single or Repeat, when time exceeds the Time setting at Gating, the time is reset back to 0.
- Page 185 The measurement result of the saved bit error is as follows: Bit Error Measurement Result CC (Clock Count) EC (Error Count) ER (Error Rate) Frequency Start Time Stop Time Test Pattern Anritsu;MP2100B ;01.00;TXT---------------------------------- Pattern PRBS2^23-1 Option 14,23,92,52 Start 2015/06/04 17:48:24 2015/06/04 17:57:31 | Total --------+-------------------------------------------------------------- | 2.0000E-08 8.0000E-02 1.2000E-0...
- Page 186 Input the file name. When changing the file name, touch [OK], and when canceling the procedure, touch [Cancel] and go back to the step 4. The measurement result file is saved in the following folder. C:\Program Files\Anritsu\MP2100A\MX210000A\UserData\Result\CSV C:\Program Files\Anritsu\MP2100A\MX210000A\UserData\Result\TXT 6-26.
- Page 187 Chapter 7 Measuring Waveform This chapter explains how to measure waveforms of periodic signal in time. EYE/Pulse Scope Screen ..........7-2 7.1.1 Sampling oscilloscope features ......7-2 7.1.2 Description of items on the EYE/Pulse Scope window ..... 7-3 Setting Item List ............7-12 Restrictions for Setting Parameters ......
- Page 188 Chapter 7 Measuring Waveform 7.1 EYE/Pulse Scope Screen 7.1.1 Sampling oscilloscope features The sampling oscilloscope, measuring the waveform, has the following main features. ● Data collection method Trigger clock frequency setting, eye mode/pulse mode display, and waveform cumulative display ● Clock Recovery Frequency bandwidth of clock recover unit and loop filter settings The clock recovered from the input data is output at the panel CRU Out connector.
- Page 189 EYE/Pulse Scope Screen 7.1.2 Description of items on the EYE/Pulse Scope window In the function menu, touch [EYE/Pulse Scope], and then the EYE/Pulse Scope result window is displayed. Measurement dialog display Time dialog display Channel A trace display Setup dialog Amplitude Channel B display...
- Page 190 Chapter 7 Measuring Waveform Touching [Setup] – [Measure] – [Amplitude] – [Time] displays the dialog box. Touching [Marker] displays the marker panel. Setup dialog box Touch [Setup] shown in Figure 7.1.2-1 to display the Setup dialog box shown in Figure 7.1.2-2. Figure 7.1.2-2 Setup Dialog Box...
- Page 191 EYE/Pulse Scope Screen Item Description General Sampling Mode Switches to Eye/Pulse/ Coherent Eye mode. Fast Sampling Mode Increases the eye pattern data sampling speed if set to [On]. This parameter can be set when Sampling Mode is Eye. Number of Samples Sets the number of samples.
- Page 192 Chapter 7 Measuring Waveform Measure dialog box Touch [Measure] as shown in Figure 7.1.2-1 “Result Window” to display the Measure dialog box as shown in Figure 7.1.2-3. Touch the measure item button (for example, [Off] in Figure 7.1.2-3), and you can select a measurement item in the Measure Item dialog box. Figure 7.1.2-3 Measure Dialog Box Figure 7.1.2-4 Measure Item Dialog Box...
- Page 193 EYE/Pulse Scope Screen Item Description Active Channel Selection Selects channel to execute histogram measurement or mask test. Measure Item Selects items to be measured. Sets display of measurement item to Off. Amplitude/Time Displays screen to select measurement items for waveform amplitude and time. Mask Test Displays screen to set mask test pattern, eye margin, and measurement method.
- Page 194 Chapter 7 Measuring Waveform Amplitude dialog box Touch [Amplitude] as shown in Figure 7.1.2-1 “Result Window” to display the Amplitude dialog box as shown in Figure 7.1.2-5. Figure 7.1.2-5 Amplitude Dialog Box (Optical/Single End Electrical Receiver)
- Page 195 EYE/Pulse Scope Screen Item Description Channel Math [Off]: Displays waveforms for Channel A and B separately. [On]: Calculates waveforms for Channel A and B, and then that calculated result is displayed as Channel A. Scale Offset Sets the level scale for Channel A and B. Channel A/B [Off]: Sets scales for Channel A and B...
- Page 196 Chapter 7 Measuring Waveform Time Dialog Box Touch [Time] as shown in Figure 7.1.2-1 "Result Window", and then the Time dialog box as shown in Figure 7.1.2-6 is displayed. Figure 7.1.2-6 Time Dialog Box 7-10...
- Page 197 EYE/Pulse Scope Screen Item Description Rate Data Clock Rate Sets input data speed, clock frequency, and frequency dividing rate. Tracking [Off]: Inputs bit rate to Bit Rate [On]: Applies bit rate selected at Master to Bit Rate Master Sets items affecting clock and bit rate. Recalculate option [Clock Rate]: Calculates Clock Rate from Bit...
- Page 198 Chapter 7 Measuring Waveform 7.2 Setting Item List The setting items are listed below. Amplitude Channel Math Channel A/B Tracking Attenuation Offset Scale Attenuation Scale Offset Define Function CH A + CH B CH A – CH B CH B – CH A Offset Scale Auto Scale...
- Page 199 Setting Item List Marker All Off Center Measure Active Channel Selection Channel A Channel B Measurement Item Amplitude/Time Amplitude/Time&Histogram Amplitude/Time&Mask Histogram Mask Test Amp/Time Average Power (dBm)* Average Power (mW)* Crossing Extinction Ratio* Eye Amplitude Eye Height Eye Width Fall Time Jitter p-p Jitter RMS OMA (dBm)*...
- Page 200 Chapter 7 Measuring Waveform One Level Rise Time Zero Level Correction Factor Delete Eye Boundary Offset from Crossing Width Measuring Area Marker Item Move Rise/Fall Time 10/90% 20/80% Rise/Fall Time Correction Histogram Axis Amplitude Time Histogram Marker Center Marker Mask Test Eye Mask Select 10GbE FEC 10GbE LAN...
- Page 201 Setting Item List OC192/STM64 OC192/STM64 FEC(G.975) OC3/STM1 OC48/STM16 OTU-1 OTU-2 1310nm OTU-2 1550nm OTU-2 1550nm Expand OTU-2 Amplified User Defined Mask Area Restriction Angle –90 to 90 Width 0.01 to 1.00 Align Method Zero/One/ Crossing Mask Alignment Update User Defined Alignment Marker Display Off Display On...
- Page 202 Chapter 7 Measuring Waveform Limit Type Sample Samples Time Time Waveform Waveforms None Persistency Persistence Time Clock Recovery <2.7G* >8.5G* CRU Loop BW 1 MHz 2 MHz 4 MHz 8 MHz CRU Lock Continue Scan Label Delete Label Delete NEW Label Maintenance Calibration Application Test...
- Page 203 Setting Item List Coherent Eye Fast Sampling Mode Pulse Screen Copy Eye/Pulse Shot Capture Inverse background color Waveforms Only Trace Memory Clear Reference Ref.Trace Channel Ch A Ch A & Ch B Ch B Set Reference Time Bits on Screen Data Clock Rate Tracking Acquire Clock Rate...
- Page 204 Chapter 7 Measuring Waveform Offset Pattern Length Tracking Length 2 to 16777216 Master PPG1 PPG2* PPG3* PPG4* ED2* ED3* ED4* Skew Channel A Channel B Unit Time *1: When with the Option 021 *2: When with the Option 011, 012, or 014 *3: When with the Option 023 *4: When with the Option 053, 054, or 055 *5: When Sampling Mode is Eye...
- Page 205 Restrictions for Setting Parameters 7.3 Restrictions for Setting Parameters The restrictions for setting parameters vary depending on the model name and options. Option 021 The measurement results of Average Power (dBm), Average Power (mW), Extinction Rate, OMA (mW), and OMA (dBm) at Amplitude/Time of the Measurement dialog box are invalid.
- Page 206 Chapter 7 Measuring Waveform 7.4 Measurement Procedure The following figure shows the basic measurement procedure. Start Calibration required? Pulse mode? Perform calibration. Set pattern length. Using clock Input measurement signal to recovery unit (CRU)? either Ch A or Ch B In*. Connect Trigger Set Ch A or Ch B Clk In and CRU...
- Page 207 Calibrating Sampling Oscilloscope 7.5 Calibrating Sampling Oscilloscope 7.5.1 Calibrating Level The amplitude accuracy of the sampling oscilloscope is guaranteed after performing calibration. When the calibration is required, the error message "Calibration is required" is displayed in the Setup dialog box in red. Perform the calibration, when using the BERTWave for the first time or the message is displayed.
- Page 208 Chapter 7 Measuring Waveform Upon completion of the calibration, a dialog box appears and gives you the calibration result. Figure 7.5.1-1 Calibration Result Display (When Calibration Is Successful) When the Calibration of CHA Fails When the Calibration of CHB Fails When the Calibration of CHA and CHB Fails Figure 7.5.1-2 Calibration Result Display (When Calibration Fails) If the calibration fails, follow the instruction that applies to your situation,...
- Page 209 Calibrating Sampling Oscilloscope After the following operations, CAL alarm is displayed on the screen. When the CAL alarm is displayed, calibrate the level. ● Change [Sampling Mode] in the Setup dialog box. ● When Sampling Mode is [Pulse] or [Coherent Eye], change [Pattern Length] in the Time dialog box.
- Page 210 Perform the self test again. If the frequency test result shows “failed”, calibrate the sampling oscilloscope again. And then, perform the self test again. Nonetheless, in cases where the test result fails, contact an Anritsu Service and Sales office. Perform the self test again.
- Page 211 Setting Clock Recovery and Rate 7.6 Setting Clock Recovery and Rate The trigger clock synchronized with the input signal is required to collect data. With the Options 011, 012, or 014, the PPG or ED synchronizing clock (Sync Out) can be used. The clock can be generated from the signal input to the following connectors if the Option 053, 054, 055 clock recovery units are added to the BERTWave.
- Page 212 Chapter 7 Measuring Waveform 7.6.1 Setting Clock Recovery Unit The Option 053, 054, or 055 Clock Recover Unit (CRU) can generate a clock from the signal collecting data. The waveform can be measured using the generated clock. The following can be set using the clock recovery unit. ●...
- Page 213 Setting Clock Recovery and Rate CAUTION ● Set the amplitude of the signal input to the CRU In connector to not exceed the following values. This is equivalent to + 10 dBm for a sine-wave signal. Inputting a signal with a larger voltage risks damaging the internal circuits.
- Page 214 Chapter 7 Measuring Waveform When using the clock recovery unit, the bit rate displayed on the right bottom side of the waveform area might not be an expected value. In this case, touch [Continue Scan] at the CRU Lock. 7.6.2 Setting Bit Rate Touch [Time].
- Page 215 Setting Clock Recovery and Rate 7.6.3 Setting Clock Rate and Divide Rate The bit rate can be set by measuring the clock rate from the signal input to the Trigger Clk In connector of the front panel. Touch [Time]. Touch the Tracking button of the Data Clock Rate to set to [Off]. Touch the Recalculate Option button to select [Bit Rate].
- Page 216 Chapter 7 Measuring Waveform 7.7 Setting Data Collection Method The data collection method is composed of the following types. Data synchronized method: Eye mode, Pulse mode, Coherent eye mode Cumulative display for waveform: None, Infinite, Limited, Persistency, Average Note: In this document, measurement of one data item on the screen is described as “data capture”...
- Page 217 Setting Data Collection Method Figure 7.7-2 Pulse Mode Display Example Setting overwritten waveform display When setting the display method to [Infinite], [Limited] or [Persistency], the acquired data is overwritten on the screen. Touch [Setup] to open the Setup dialog box. Select the single waveform data collection count from the following number of samples.
- Page 218 Chapter 7 Measuring Waveform When selecting [Limited] at step 3, set the at-end condition. ● To end overwriting waveform when the set time is passed, set Limit Type to [Time]. Touch the Time text box to input the time. ● To end overwriting waveform when the data count set at the screen is reached, set Limit Type to [Sample].
- Page 219 Setting Data Collection Method Figure 7.7-4 Accumulation Type Settings (Infinite) Displaying averaging waveform When setting the display method to [Averaging] at the pulse mode, the averaging process is performed. Averaging process is used to suppress waveform noise. Touch [Setup] to open the Setup dialog box. Touch the Accumulation Type button to select [Averaging].
- Page 220 Chapter 7 Measuring Waveform Averaging 1 Averaging 100 Figure 7.7-5 Example of Averaging Process The averaging is calculated using the following formula. Number of waveforms ≤Averaging setting count: ...
- Page 221 Setting Pattern Length 7.8 Setting Pattern Length When the Pulse mode is set as described in Section 7.7 “Setting Data Collection Method”, the pattern length can be set. In the Pulse mode, the pattern is synchronized by collecting data at the pattern length time cycle.
- Page 222 Chapter 7 Measuring Waveform 7.9 Collecting Data Once the data collection is started, the waveform is displayed on the screen. Starting data collection The waveform of the channel with the monitor signal input is displayed. When monitoring the signal input to the Ch A In connector, touch the Channel A trace display button to set the button display to [CH A On].
- Page 223 Collecting Data Discarding screen display When temporarily deleting screen display: Touch the Channel A trace display button, and then set the button display to [CH A Off]. Touch the Channel B trace display button, and then set the button display to [CH B Off].
- Page 224 Chapter 7 Measuring Waveform 7.10 Adjusting Screen Scale 7.10.1 Adjusting scale automatically Measure the waveform amplitude and period, and then set to the easily viewable scale. For Eye/Pulse/Coherent Mode Touch [Auto Scale]. The waveform is displayed at the center of the screen. 1 level position 0 level position Insertion...
- Page 225 7.10 Adjusting Screen Scale For Pulse Mode Touch [Auto Scale]. The waveform is displayed at the screen center. 1 level position 0 level position Figure 7.10.1-2 Waveform Display after Auto Scale (Pulse Mode) When the pattern length is 127 bits or less, a 20-bit waveform is displayed. When the pattern length is 128 bits or more, a 50-bit waveform is displayed.
- Page 226 Chapter 7 Measuring Waveform 7.10.2 Adjusting Vertical-axis of Screen To adjust voltage or optical power at center of vertical axis Touch [Offset] at Amplitude on the left side of the waveform display area. The rotary knob icon is displayed in the button. Input the power voltage or optical power at the screen center position using the rotary knob.
- Page 227 7.10 Adjusting Screen Scale Setting same vertical scale for two waveforms The vertical scales at Channel A and Channel B can be set to the equal value using the Option 021. Touch [Amplitude]. Touch the Channel A/B Tracking button, and set to [On]. And then, the text box for Channel A is only available.
- Page 228 Chapter 7 Measuring Waveform 7.10.3 Adjusting Horizontal-axis of Screen Adjusting time at left edge of screen Touch [Offset] at Time in the right side of the waveform display area. The rotary knob icon is displayed in the button. Input the time at left edge of screen using the rotary knob. The time entered is displayed at the left lower corner of the waveform display.
- Page 229 7.10 Adjusting Screen Scale 7.10.4 Calibrating attenuation of Adjusting External Attenuator Adjusting attenuation of external attenuator The attenuation amount of an external attenuator connected to the Ch A In and Ch B In connectors can be adjusted as described below. Touch [Amplitude].
- Page 230 Chapter 7 Measuring Waveform 7.11 Measuring Waveform The waveform measurement methods are as follows. For the explanation of the measurement items, refer to 1.5 “Technical Terms”. ● Amplitude and time measurements Select the measurement items from the following: Average power, Crossing%, Duty cycle distortion, Extinction rate, Eye amplitude, Eye height, Eye width, Fall time, Jitter p-p, Jitter RMS, One level, Rise time, SNR, Zero level, OMA The extinction rate, average optical power, and OMA can be...
- Page 231 7.11 Measuring Waveform 7.11.1 Amplitude and Time Measurements When collecting data in the Eye pattern mode, up to 4 amplitude and time measurements can be performed. Figure 7.11.1-1 Setting Example of Amplitude/Time Measurement 7-45...
- Page 232 Chapter 7 Measuring Waveform To set measurement items: Touch [Measure] to open the Measure dialog box. Touch the Measure Item button. Touch [Amplitude/Time], [Amplitude/Time&Mask], or [Amp/Histogram. When selecting [Amplitude/Time&Mask] or [Amp/Histogram], touch the [Amp/Time] tab. Touch [Add] at Item Selection. The screen for selecting the measurement items is displayed.
- Page 233 7.11 Measuring Waveform Figure 7.11.1-2 Display Example of EYE Boundary When there is a possibility the waveform may not have been measured correctly due to too small amplitude or too large jitter, “EYE? and channel name (CHA/CHB/CHA,CHB)” in red is indicated as shown below. In this case, check the settings for the amplitude and trigger of the measured signal and make sure the connectors are secure.
- Page 234 Chapter 7 Measuring Waveform To change EYE Boundary The 1 and 0 level measurement area can be changed. Touch the Offset in the Crossing text box to set the area center position. Touch the Width text box to set the area width. Offset from Width Crossing...
- Page 235 7.11 Measuring Waveform To set measurement method of rise/fall time When measuring the rise time and fall time levels, select from amplitude 10/90% level or 20/80% level. ● Touch the Rise/Fall Time button to display [10/90%] or [20/80%]. The bandwidth of the sampling oscilloscope is corrected with the measurement value of the Rise/Fall time, and the corrected bandwidth is displayed.
- Page 236 Chapter 7 Measuring Waveform To change display order The display order of the measurement result is the same as that of Item Selection. The display order of Item Selection can be changed using the following procedures. Touch [↑] or [↓] at Item Selection to highlight the item for changing the display order.
- Page 237 7.11 Measuring Waveform 7.11.2 Displaying Histogram The histogram display displays the data distribution in the set field to measure the mean, standard deviation, and dispersion width. To display histogram, set the axis, time, or amplitude for measuring histogram. And then, set the screen area to display histogram using the histogram marker.
- Page 238 Chapter 7 Measuring Waveform Touch [Measure] to open the Measure dialog box. Touch the Active Channel Selection button, and then select the channel to be measured. Touch the Measure Item button. Touch [Histogram], or [Amp/Histogram]. When selecting [Amp/Histogram], touch the [Histogram] tab. When measuring histogram for time direction, touch [Time] at [Axis].
- Page 239 7.11 Measuring Waveform Figure 7.11.2-2 Histogram Measurement Example (Amplitude) Figure 7.11.2-3 Histogram Measurement Example (Time) 7-53...
- Page 240 Chapter 7 Measuring Waveform 7.11.3 Executing Mask Test To execute the mask test, first select measurement channel and mask. There are two types of mask tests as follows: ● Set the upper data error count and measure the mask margin. ●...
- Page 241 7.11 Measuring Waveform To select channel and mask Touch [Measure] to open the Measure dialog box. Touch the Active Channel Selection button, and then select the channel to be measured. Touch the Measure Item button. Touch [Mask Test] or [Amplitude/Time&Mask]. When selecting [Amplitude/Time&Mask], touch the [Mask Test] tab.
- Page 242 Chapter 7 Measuring Waveform Table 7.11.3-2 Files That Can Be Selected When User Defined Is Selected File Name Supported Standard Bit Rate 10GE-LX4.txt 10G Ethernet LX4 10G_BASE-LRM.txt 10G BASE-LRM 10.3125 Gbit/s 10G_LAN.txt 10 LAN 10.3125 Gbit/s 10xGE.txt 10 x 1 Gbit/s Ethernet 12.5 Gbit/s 100BASE-BX_LX10.txt 100BASE-BX LX10...
- Page 243 7.11 Measuring Waveform To measure mask margin Touch [Setup]. Touch the Sampling Mode button to set the display [Eye] or [Coherent Eye]. Touch [Sampling] to set the display Run. When the trace is displayed, touch [Auto Scale]. Check that the eye pattern is displayed in the center of the screen. Touch [Measure].
- Page 244 Chapter 7 Measuring Waveform To set Mask Margin and execute mask test Touch [Setup]. Touch the Sampling Mode button to set the display [Eye] or [Coherent Eye]. Touch [Sampling] to set the display Run. When the trace is displayed, touch [Auto Scale]. Check that the eye pattern is displayed in the center of the screen.
- Page 245 7.11 Measuring Waveform Figure 7.11.3-2 Mask Test Example The following values are displayed in the measurement result: Total Samples: Total data count displayed on the screen Total Waveforms: Total waveform count displayed on the screen Mask Margin: Mask Margin measurement results or settings Hit Count or Hit Ratio: Threshold set for Mask Margin...
- Page 246 Chapter 7 Measuring Waveform Adjusting mask position To adjust mask position automatically When Align Method is [Zero/One/Crossing], touch the Mask Alignment [Update]. When touching the Mask Alignment [Update], calculate [One/Zero Crossing] of the currently described waveform and optimize the mask position automatically.
- Page 247 7.11 Measuring Waveform Although the marker is not displayed at [Display Off], the marker position can be adjusted by changing the value in the text box. To limit mask area To examine in which part of the mask at the center the error occurs when the error occurs in the mask test, the mask area can be limited.
- Page 248 Chapter 7 Measuring Waveform “Restriction enabled” is displayed in the measurement result display area. Figure 7.11.3-4 Example of Area Limited Mask Test 7-62...
- Page 249 7.12 Using Marker 7.12 Using Marker The marker is used to read the amplitude and time values of the waveform. Also, the level and time differences between two points can be measured. There are two markers each for the x- and y-axes. Display of each marker can be set to on or off separately.
- Page 250 Chapter 7 Measuring Waveform Figure 7.12-1 Marker Display 7-64...
- Page 251 7.13 Waveform Math Calculation 7.13 Waveform Math Calculation The calculated math results for the two CH A and CH B waveforms can be displayed as a different waveform. The calculated math results can be measured at Section 7.11 “Measuring Waveform”. Note: When calculating the EYE pattern waveform, set Sampling Mode to [Coherent Eye] and collect the data.
- Page 252 Chapter 7 Measuring Waveform 7.14 Using Trace Memory The trace memory is a function to save the measurement waveform in the memory. The waveform saved in the trace memory calls the reference trace. To save the waveform in the trace memory Touch [Setup] to open the Setup dialog box.
- Page 253 7.15 Displaying a Label 7.15 Displaying a Label This section describes how to display an arbitrary string (label) in the EYE/Pulse Scope screen. Label Figure 7.15-1 Label Display Displaying a label Touch [Setup] to open the Setup dialog box. Touch [Utilities] tab. Touch [Add] for NEW Label, and the software keyboard appears.
- Page 254 Chapter 7 Measuring Waveform 7.16 Saving Measurement Results The sampling oscilloscope results can be saved in the following file types: ● Screen image The image of the entire screen or only the measurement screen is saved to a PNG or JPEG file. ●...
- Page 255 Touch [OK] to save the screen image. When overwriting a file, a confirmation dialog box is displayed. The path to the default folder is: C:\Program Files\Anritsu\MP2100A\MX21000A\UserData\Screen Copy The date and time are recorded in the default file name. When saving the measurement screen: Touch [Setup].
- Page 256 The measurement condition file is saved in the following folder. The extension for saved files is WFS. C:\Program Files\Anritsu\MP2100A\MX21000A\UserData\Setting The measurement result file is saved in the following folder. The extension of the measurement data file is CSV and TXT.
- Page 257 7.16 Saving Measurement Results Amplitude/Time Measurement [Results] One Level CH A 192.12 191.80 0.10 191.66 192.12 One Level CH B N/A N/A N/A N/A N/A Zero Level CH A -185.98 -185.63 0.10 -186.00 -185.43 Zero Level CH B N/A N/A N/A N/A N/A Eye Amplitude CH A 378.10 377.44 0.19 377.16 378.12 Eye Amplitude CH B N/A N/A N/A N/A N/A Eye Height CH A 330.00 329.46 0.19 329.13 330.03...
- Page 258 Chapter 7 Measuring Waveform Amplitude/Time and Mask Measurement - Channel A [Setups] Current Mask 1G Optical Fibre Channel Mask (1.0625 Gbps) [Results] One Level CH A 189.37 189.71 0.20 189.32 190.04 One Level CH B N/A N/A N/A N/A N/A Zero Level CH A -185.00 -185.35 0.20 -185.73 -184.89 Zero Level CH B N/A N/A N/A N/A N/A Eye Amplitude CH A 374.37 375.07 0.39 374.21 375.73...
- Page 259 7.16 Saving Measurement Results Amplitude/Time and Histogram Measurement - Channel A [Setups] Axis Time X1 Marker 0.50UI X2 Marker 1.50UI Y1 Marker 9mV Y2 Marker -10mV [Results] One Level CH A 189.65 189.84 0.13 189.60 190.04 One Level CH B N/A N/A N/A N/A N/A Zero Level CH A -185.34 -185.48 0.14 -185.73 -185.12 Zero Level CH B N/A N/A N/A N/A N/A Eye Amplitude CH A 374.99 375.31 0.26 374.72 375.73...
- Page 260 Chapter 7 Measuring Waveform Histogram Measurement - Channel A [Setups] Axis Amplitude X1 Marker 0.73UI X2 Marker 0.75UI Y1 Marker 287mV Y2 Marker -276mV [Results] Mean 5.27 Std Dev 188.49 P-P 423.91 Hits 11979 Hit Point Detail 287mV 0 Hits 284mV 0 Hits 281mV 0 Hits 279mV 0 Hits...
- Page 261 7.16 Saving Measurement Results Mask Measurement - Channel A [Setups] Current Mask 8G Optical Fibre Channel Mask (8.5 Gbps) [Results] Total Samples 991111 Total Waveforms 121 Mask Margin 0 Hit Count 1 Total Failed Samples 0 Top Mask Failed Samples 0 Center Mask Failed Samples 0 Bottom Mask Failed Samples 0 Waveform...
- Page 262 Chapter 7 Measuring Waveform 7-76.
- Page 263 Chapter 8 Operating Optical Interface This chapter explains how to use the optical interface option. Optical Interface Types ..........8-2 Operating Optical Transceiver ........8-5 8.2.1 Function List ............. 8-5 8.2.2 Optical Transceiver Types ........ 8-6 8.2.3 Connecting Panel Connector and Optical Transceiver ............
- Page 264 Chapter 8 Operating Optical Interface 8.1 Optical Interface Types The following optical interface types are available. ● O/E converter ● Optical transceiver (SFP+) O/E Converter The O/E converter configured by the wide bandwidth photo diode and amplifier can convert the optical signal to the electrical signal. The block diagram for the O/E converter included in the Option 023 is as follows, and the converted electrical signal is connected internally to the sampling oscilloscope.
- Page 265 Optical Interface Types Optical Transceiver (SFP+) Optical transceivers combine the following two functions in one module: ● Tx for converting electrical signal into optical signal for transmission ● Rx for converting optical signal into electrical signal for reception The format and pin layout of the optical transceiver for communication are standardized by the industry organization.
- Page 266 Chapter 8 Operating Optical Interface CAUTION ● Be sure that the optical power input to the Rx of the optical transceiver is the specified max .value or less. Inputting an optical power rather than this power risks damaging the internal circuits. ●...
- Page 267 Operating Optical Transceiver 8.2 Operating Optical Transceiver 8.2.1 Function list The following items is set and displayed for the optical transceiver. Table 8.2.1-1 Optical Transceiver Setting Items and Display Items Item Description Wavelength Displays wavelength of light output from the optical transceiver.
- Page 268 Chapter 8 Operating Optical Interface 8.2.2 Optical transceiver types The recommended optical transceivers are listed in Table 8.2.2-1. For the specifications of the optical transceivers, refer to A.2 “Optical Transceiver Module”. For how to install the optical transceiver, refer to Section 2.8 “Installing Optical Transceiver”.
- Page 269 Operating O/E Converter 8.3 Operating O/E Converter 8.3.1 Function list The following items are set and displayed when installing the O/E converter. Table 8.3.1-1 O/E Converter Setting Items Item Description Filter On/Off When installing the Option 086, the internal low pass filter is set to On/Off.
- Page 270 Chapter 8 Operating Optical Interface For these wavelength bands, calibrated values have been set before shipment from the factory. To measure an optical signal at the other wavelength than 850 nm, 1310 nm or 1550 nm, change the setting values of Conversion Gain, Responsivity and System Conversion Gain according to the changed wavelength.
- Page 271 Operating O/E Converter The setting range of the O/E converter is as follows. Filter* No Filter 1GFC 2GFC 4GFC 8GFC 10GFC 10GFC FEC 10GFC-LX4 1GbE 2GbE 10GbE FEC 10GbE LAN/PHY 10GbE WAN 10GbE-LX4 CPRI CPRI2 CPRI4 CPRI5 CPRI8 CPRI10 Infiniband Infiniband2 Infiniband4 OC-3/STM-1...
- Page 272 Chapter 8 Operating Optical Interface Responsivity 0.001 to 999.999 A/W Input Power –2 to –10 dBm Extinction Ratio Correction Extinction Ratio Correction Factor –9.99 to 9.99 % *1: The filters displayed will vary depending on the option(s) installed. Table 8.3.1-2 Option List shows the option numbers and the names of the filter standards supported by the options *2: When installing Option, the upper limit may sometimes be lower than 7404.
- Page 273 Operating O/E Converter Table 8.3.1-2 Option List Option* Filter 070 071 072 073 075 076 078 079 080 081 082 086 087 088 089 1GFC 2GFC 4GFC 8GFC 10GFC 10GFC FEC ...
- Page 274 Chapter 8 Operating Optical Interface 8.3.2 Calibrating O/E module When light is not input to the O/E module, the output voltage is adjusted. The output voltage of the O/E module changes depending on the ambient temperature. Calibrate the BERTWave before using the O/E module. Screw in the O/E Data In cap.
- Page 275 Operating O/E Converter Adjustment method of Responsivity Adjust the wavelength of the optical power meter to the optical signal. Measure unmodulated optical signal power with the optical power meter. Input the optical signal to the optical input connector. Measure the Average Power (mW) or Average Power (dBm) of the optical signal by using the Amplitude/Time function of the sampling oscilloscope.
- Page 276 Chapter 8 Operating Optical Interface 8-14.
- Page 277 Chapter 9 Performance Test This chapter describes how to test the performance of the BERTWave. Performance Test for Pulse Pattern Generator .... 9-2 9.1.1 Required equipment ......... 9-2 9.1.2 Frequency accuracy ......... 9-2 9.1.3 Waveform ............9-4 Performance Test for Error Detector ......9-8 9.2.1 Required equipment .........
- Page 278 Recommended Product Name Required Performance Equipment Sampling Electrical interface MP2100B oscilloscope Bandwidth: 20 GHz or more (Anritsu) Frequency counter Frequency range: MF2412C 500 MHz to 20 GHz (Anritsu) Accuracy: 0.1 ppm max. 9.1.2 Frequency accuracy (1) Specification ±10 ppm (One hour after power on)
- Page 279 Performance Test for Pulse Pattern Generator (2) Setup Frequency Counter Sync Out 3 125 000 002.3 Hz Input Coaxial Terminator Figure 9.1.2-1 Operation Frequency Range Test Setup (3) Procedure Connect the Sync Output connector to the input connector of the frequency counter.
- Page 280 Chapter 9 Performance Test 9.1.3 Waveform (1) Specification Amplitude: 0.1 to 0.8 Vp-p Accuracy: (±20% of setting) ±20 mV Data Crossing: 50±10% (Amplitude: 0.8 Vp-p, Bit rate: 11.32 Gbit/s (12.5 Gbit/s when with the Option 092)) Rise/fall time: 28 ps (Amplitude: 0.8 Vp-p, Percentage: 20-80%, Bit rate: 11.32 Gbit/s (12.5 Gbit/s when with the Option 092))
- Page 281 Performance Test for Pulse Pattern Generator Sampling Oscilloscope Trigger Input Sync Out Input Coaxial Terminator PPG1 Data Out Figure 9.1.3-2 PPG1 Data Out Waveform Test Connection Diagram (3) Procedure Connect the coaxial terminator to the PPG1 Data Out connector. (Refer to Figure 9.1.3-1.) Connect the Sync Output connector and the trigger input connector of the sampling oscilloscope using a coaxial cable.
- Page 282 Chapter 9 Performance Test 19. Connect the PPG1 Data Out connector to the input connector of the sampling oscilloscope. 20. Repeat steps 11 to 14. PPG2 can be tested in the same way with the Option 012. The connection diagram is as follows. Sampling Oscilloscope Trigger Input...
- Page 283 Performance Test for Pulse Pattern Generator Sampling Oscilloscope Trigger Input Sync Out Input Coaxial Terminator PPG3 Data Out Figure 9.1.3-5 PPG3 Data Out Waveform Test Connection Diagram Sampling Oscilloscope Trigger Input Sync Out Input Coaxial Terminator PPG3 Data Out Figure 9.1.3-6 PPG3 Data Out Waveform Test Connection Diagram...
- Page 284 Before starting performance tests, warm up the BERTWave and the measuring instruments for at least 1 hour. Table 9.2.1-1 Equipment for Performance Test Recommended Product Name Required Performance Equipment Sampling Electrical interface MP2100B oscilloscope Bandwidth: 20 GHz or more (Anritsu) Fixed 20 dB 41KC-20 attenuator SMA connector (Anritsu)
- Page 285 Performance Test for Error Detector 9.2.2 Operating frequency (1) Specification 0.05 to 0.8 Vp-p BER 10 or less under the following conditions: –12 Pattern: PRBS31 Mark ratio: Single-end Back-to-back connection Without the Option 092: 132.813 Mbit/s to 11.32 Gbit/s With the Option 092: 125 Mbit/s to 12.5 Gbit/s (2) Setup...
- Page 286 Chapter 9 Performance Test (3) Procedure 1. Attach a 20 dB fixed attenuator to the PPG1 Data Out connector. (Refer to (a) in Figure 9.2.2-1.) Connect coaxial terminators to the PPG1 Data Out and ED1 Data In connectors. Connect the Sync Out and Trigger Clk In connectors using a coaxial cable.
- Page 287 Performance Test for Error Detector 15. Adjust the PPG1 Amplitude so that the Eye/Pulse Scope amplitude is 50±1 mV. 16. Connect the PPG1 Data Out and ED1 Data In connectors using a coaxial cable. (Refer to (b) in Figure 9.2.2-1.) 17.
- Page 288 Chapter 9 Performance Test ED2 can be tested in the same way with the Option 012. The connection diagram is as follows. Fixed Attenuator Fixed Attenuator Coaxial Terminator Coaxial Terminator Ch A In Coaxial Terminator ED2 Data In Coaxial PPG1 Data Out PPG1 Data Out Terminator (a) Amplitude Check...
- Page 289 Performance Test for Error Detector ED3 and ED4 can be tested in the same way with the Option 014. The connection diagram for measuring the ED3 input level is as follows. Fixed Attenuator Fixed Attenuator Coaxial Terminator Coaxial Terminator Ch A In Coaxial Terminator ED3 Data In Coaxial...
- Page 290 Chapter 9 Performance Test 9.2.3 Rx sensitivity (1) Specification 20 mVp-p BER 10 or less under the following conditions: –12 Pattern: PRBS31 Mark ratio: Single-end Back-to-back connection Without the Option 092: 11.32 Gbit/s With the Option 092: 12.5 Gbit/s (2) Setup Same as Figure 9.2.2-1 and Figure 9.2.2-2.
- Page 291 Performance Test for Error Detector Connect the PPG1 Data Out and ED1 Data In connectors using a coaxial cable. (Refer to (b) in Figure 9.2.2-1.) 10. Touch [Start] at Measure. 11. Record the error rate ER for the ED Result after measurement is complete.
- Page 292 Chapter 9 Performance Test 9.2.4 Maximum input level and patterns (1) Specification 800 mVp-p BER 10 or less under the following conditions: – Pattern: PRBS31, PRBS23, PRBS20, PRBS15, PRBS9, PRBS7 Mark ratio: Single-end Back-to-back connection Without the Option 092: 11.32 Gbit/s With the Option 092: 12.5 Gbit/s (2) Setup...
- Page 293 Performance Test for Error Detector (3) Procedure Connect coaxial terminators to the PPG1 Data Out and ED1 Data In connectors. (Refer to Figure 9.2.4-1.) Connect the PPG1 Data Out and ED1 Data In connectors using a coaxial cable. Touch [PPG/ED Ch1] and set [PPG] as follows: Amplitude: 0.8 V Bit Rate: Variable, 11320000 kbit/s (Without the Option 092)
- Page 294 Chapter 9 Performance Test ED2 can be tested in the same way with the Option 012. The connection diagram is as follows. Coaxial terminator ED2 Data In Coaxial terminator PPG1 Data Out Figure 9.2.4-3 ED2 Data In Pattern Test Connection Diagram Coaxial terminator Coaxial terminator ED2 Data In...
- Page 295 Performance Test for Error Detector 9.2.5 Error detection (1) Specification 50 mVp-p Error detection is possible for pattern PRBS31, mark ratio 50%, single end, and back to back connection. Without the Option 092: 11.32 Gbit/s With the Option 092: 12.5 Gbit/s (2) Setup Same as Figure 9.2.2-1 and Figure 9.2.2-2.
- Page 296 Chapter 9 Performance Test 11. Touch [PPG] at [Insert Error] once. 12. After measurement, confirm that the error count is 1. 13. Connect coaxial terminators to the PPG1 Data Out and ED1 Data In connectors. (Refer to (a) in Figure 9.2.2-2.) 14.
- Page 297 Required Performance Name Equipment Pulse Pattern Clock frequency: 10 GHz MP1800A, Generator MU181000A Amplitude: 0.5 Vp-p MU181020A (Anritsu) DC Power Power voltage: ±2.5 V 2400 Source Power current: ±50 mA (Keithley Instruments) Setting accuracy: 1% or less With current limiting function...
- Page 298 Chapter 9 Performance Test 9.3.2 Amplitude accuracy (1) Specification (–2%–offset amplitude accuracy) to (+2%+offset amplitude accuracy) The offset amplitude accuracy after calibration is as shown in the following figure. Figure 9.3.2-1 Offset Amplitude Accuracy (2) Setup Pulse Pattern Generator DC Power Supply Coaxial Cable –...
- Page 299 Performance Test for Sampling Oscilloscope (3) Procedure Connect the Trigger Input and the clock output connector of the PPG using a coaxial cable. Set the clock output of the PPG as follows: Amplitude: 0.5 Vp-p Frequency: 10 GHz Touch [Setup], and set as follows: Sampling Mode: Accumulation Type: None Clock Recovery:...
- Page 300 Chapter 9 Performance Test 13. Set the DC voltage to 200 mV. 14. Record the average value of the histogram measurement result. 15. Set the DC voltage to –200 mV. 16. Record the average value of the histogram measurement result. With the Option 021, test the amplitude accuracy for Ch B after measuring the amplitude accuracy for Ch A.
- Page 301 For multimode fiber 8163B+81578A Attenuation: 800 to 900 nm (Keysight Technologies) Insertion loss: 3 dB max. Attenuation: 0 to 30 dB Resolution: 0.1 dB max. Pulse Pattern Clock frequency: 100 MHz MG3740A Generator or Amplitude: 0.5 Vp-p (Anritsu) Signal Generator 9-25...
- Page 302 Chapter 9 Performance Test 9.4.2 Optical Power Meter (1) Specification Accuracy: ±0.35 dB if the input level is –12 dBm or greater (2) Setup Light Source Optical Fiber Optical Input Variable Optical Attenuator Optical Output Pulse Pattern Generator or Signal Generator Coaxial Cable Optical Power Meter Figure 9.4.2-1 Optical Power Meter Test Connection Diagram (Option 023)
- Page 303 Performance Test for Optical Interface (O/E Converter) Adjust the variable optical attenuation to set the optical power meter display to around –1 dBm (0.8 mW). Record the optical power meter display P (dBm). 10. Disconnect the optical fiber from the optical power meter and connect it to the O/E Data In connector.
- Page 304 Chapter 9 Performance Test 9-28.
- Page 305 Chapter 10 Maintenance This chapter describes maintenance, storage and disposal procedures. 10.1 Daily Maintenance ............10-2 10.2 Replacement of Optical Connector ......10-3 10.3 Optical Connector/Optical Adapter Cleaning ....10-5 10.4 Displaying Software Version ........10-8 10.5 Updating Software ............ 10-10 10.6 Touch Panel Position Calibration......
- Page 306 Chapter 10 Maintenance 10.1 Daily Maintenance Before daily maintenance of the BERTWave, be sure to turn the power off and unplug it from the AC outlet. Panel surface dirt When surface dirt is noticeable, after the BERTWave has been used in a dusty environment, or when the BERTWave has not been used for an extended period of time, wipe its surface with a cloth moistened in detergent and wrung enough.
- Page 307 10.2 Replacement of Optical Connector 10.2 Replacement of Optical Connector The standard optical connector is the FC type. The optical connector of the plug-in unit and pull-out type optical sensor can be removed and replaced with another connector (sold separately), and its interior can be cleaned.
- Page 308 Chapter 10 Maintenance To remove the optical connector: Open the cover. Pull up the connector lever toward you. Check that the latch has been released, and then, gently pull the connector out straight toward you. Latch Figure 10.2-2 How to Remove the Optical Connector 10-4...
- Page 309 10.3 Optical Connector/Optical Adapter Cleaning 10.3 Optical Connector/Optical Adapter Cleaning Cleaning the Ferrule End Surface Use an approved adapter cleaner to clean the ferrule end surface in the optical connector. The ferrule in the optical connectors needs periodic cleaning. Although the following procedures use the FC connector and adapter as an example, use the same methods when cleaning other connector and adapter types.
- Page 310 Chapter 10 Maintenance Press the tip of a new (dry) adapter cleaner into the ferrule end surface and then wipe in one direction 2 or 3 times to dry the surface. Clean the adapter interior with adapter cleaner. (Refer to “Cleaning the optical adapter” below.) Attach the adapter in the reverse order.
- Page 311 10.3 Optical Connector/Optical Adapter Cleaning Cleaning the Optical Fiber Cable Ferrule End Surface Use an approved ferrule cleaner to clean the optical fiber cable ferrule end surface. Although the following procedures use the FC connector and adapter as an example, use the same methods when cleaning other connector and adapter types.
- Page 312 Chapter 10 Maintenance 10.4 Displaying Software Version Confirm the software version using the following procedures. Touch [Setup Utility] at the selector screen, and then the Setup Utility screen opens. Touch [Information], and then the Information screen is displayed. When the button display is Software, the version of the Windows application software is displayed.
- Page 313 10.4 Displaying Software Version Touch [Exit], and then the software version display screen is closed. 10-9...
- Page 314 Chapter 10 Maintenance 10.5 Updating Software To update the software, install the new software in the BERTWave. For how to install the software, refer to the document attached to the software. Start the BERTWave after installing the software, and then the version mismatch warning is displayed.
- Page 315 10.6 Touch Panel Position Calibration 10.6 Touch Panel Position Calibration Touch panel position may be misaligned depending on the changes of ambient environment (temperature/humidity). If the touch panel position is misaligned, calibrate the position using the following procedures. When calibrating the detecting position, use the sharp-nose stick but do not scratch the panel surface.
- Page 316 Chapter 10 Maintenance Touch the center of the brown cross using the sharp-noise stick. The next cross to be touch is displayed in brown. Touch the four crosses, and then the property window of the touch panel is displayed. Touch the [OK] button. 10-12...
- Page 317 The recommended calibration cycle after delivery of the BERTWave is twelve months. If you require support after delivery, contact an Anritsu Service and Sales office. Contact information can be found on the last page of the printed version of this manual, and is available in a separate file on the PDF version.
- Page 318 Chapter 10 Maintenance 10.8 Storage Wipe off dust, fingerprint marks, stains, spots, etc. from the surface of the BERTWave before storing it. Fit the attached coaxial connector cover to the coaxial connector on the front panel. Also, put the cap on the optical connector. Put the power cord, CD-ROM and other accessories in the accessory box and store it with the main frame.
- Page 319 10.9 Transporting and Disposal 10.9 Transporting and Disposal The following describes precautions for transporting and disposing of the BERTWave. Repackaging Repack the BERTWave in the packing material (box) in which it was delivered. If the packing material has been thrown away or damaged, repack the BERTWave in the following manner: Prepare a corrugated cardboard, wooden, or aluminum box large enough to pack cushioning material in around the BERTWave.
- Page 320 Chapter 10 Maintenance 10-16.
- Page 321 Appendix A Specifications Appendix A describes the specifications for the BERTWave. For the configuration of the BERTWave, refer to Section 1.2 “Configuration”. MP2100B BERTWave ..........A-2 A.1.1 Pulse Pattern Generator ......... A-2 A.1.2 Error Detector ..........A-8 A.1.3 Sampling Oscilloscope ......... A-12 A.1.4 General Performance ........
- Page 322 Appendix A Specifications A.1 MP2100B BERTWave A.1.1 Pulse Pattern Generator Table A.1.1-1 Reference Clock Item Specifications Internal reference Frequency: 10 MHz clock Accuracy: ±10 ppm* External 10 MHz Frequency: 10 MHz ±100 ppm input Connector: BNC jack Termination: 50 Ω, AC coupling Amplitude: 0.7 to 2 Vp-p Waveform:...
- Page 323 MP2100B BERTWave Table A.1.1-2 Bit Rate Item Specifications Bit Rate (kbit/s) Standard Name Without Option 092 With Option 092 Variable 8500000 to 11320000 125000 to 12500000 Variable 1/2* 4250000 to 5660000 – Variable 1/4* 2125000 to 2830000 – Variable 1/8* 1062500 to 1415000 –...
- Page 324 Appendix A Specifications Table A.1.1-2 Bit Rate (Cont’d) Item Specifications Bit Rate (kbit/s) (Cont’d) Standard Name Without Option 092 With Option 092 OC-3/STM-1 155520 155520 OC-12/STM-4 622080 622080 OC-24 1244160 1244160 OC-48/STM-16 2488320 2488320 OTU-1 2666057 2666057 OC-192/STM-64 9953280 9953280 OC-192/STM-64 10664228 10664228...
- Page 325 MP2100B BERTWave Table A.1.1-3 Data Output Item Specifications Number of Channels Option 011: Option 012: Option 014: Amplitude 0.1 to 0.8 Vp-p, 10 mV resolution* Accuracy: ±20 mV ±20% for settings Relative display* available Termination AC coupling, 50 Ω Data Crossing Accuracy: ±10%* Rise/Fall time...
- Page 326 Appendix A Specifications Table A.1.1-4 Sync Output Item Specifications Frequency Sync Signal PPG3, PPG1, PPG2 ED1 to ED4 Source PPG4 1/16 1/64 Pattern Pattern 1/16 Division Ratio Bit Rate Sync. Sync. Division Ratio Rate 1/64 Rate 1/32 Rate 1/16 Rate 1/8 Rate 1/4 Rate 1/2 Rate 1/1...
- Page 327 MP2100B BERTWave Table A.1.1-6 Slot for Optical Transceiver Item Specifications SFP+Slot Transmission data input (MP2100B-051) Connector: SMA jack Terminator voltage: 0 V Impedance: 50 Ω* Input amplitude: 0.6 to 0.8 Vp-p (When using G0238A) 0.25 to 0.35 Vp-p (When using G0239A) Waveform: Received data output Connector:...
- Page 328 Appendix A Specifications A.1.2 Error Detector Table A.1.2-1 Data Input Item Specifications Bit Rate Refer to “bit rate” in Table A.1.1-2. Number of Option 011: Channel * Option 012: Option 014: Data format NRZ, mark ratio 1/2 Amplitude 0.05 to 0.8 Vp-p* Coupling method DC coupling, termination voltage 0 V Threshold...
- Page 329 MP2100B BERTWave *4: Terminator: Single-ended, External attenuation factor: 0 dB *5: Without Option 092: 11.32 Gbit/s, 20 to 30°C With Option 092: 12.5 Gbit/s, 20 to 30°C *6: Guaranteed by design. *7: At 10.315 Gbit/s, 4.25 Gbit/s, and 2.125 Gbit/s *8: The thresholds corrected by the external attenuation factor are displayed.
- Page 330 Appendix A Specifications Table A.1.2-2 Clock Recovery Item Specifications Consecutive 72 bits or more* identical digit immunity Lock range ±100 ppm* Jitter tolerance* Modulation frequency Jitter tolerance 40 kHz to 4 MHz 5 to 0.05UI 4 to 160 MHz 0.05UI 5 UI 0.05 UI 40 kHz...
- Page 331 MP2100B BERTWave Table A.1.2-3 Measurement Function Item Specifications Test pattern Pseudorandom (PRBS) pattern: Pattern length: 2^7–1, 2^9–1, 2^15–1, 2^23–1, 2^31–1 Logic invertible Data pattern (Programmable Pattern): Pattern length: 2 to 1305600 bits, editable by text editor and sample file available Warning display •...
- Page 332 Appendix A Specifications A.1.3 Sampling Oscilloscope Table A.1.3-1 Function Item Specifications Sampling Sampling Mode: Eye, Pulse, Coherent Eye Number of Sampling: Eye: 509, 1021, 1350, 2039, 4093, 8191, 16381 Pulse, Coherent Eye: 512, 1024, 2048, 4096, 8192, 16384 Sampling can be switched between Run and Hold, Display Channel A, Channel B Accumulation Type:...
- Page 333 MP2100B BERTWave Table A.1.3-3 Histogram Measurement Item Specifications Axis Amplitude, Time Marker X1, X2, Y1, Y2 Display Item Mean, Standard deviation, Peak-to-peak value, the number of hits Table A.1.3-4 Mask Test Item Specifications For supported mask 1GFC 2GFC 4GFC 8GFC 8GFC_Elect_Tx 8GFC_Elect_Rx 10GFC...
- Page 334 Appendix A Specifications Table A.1.3-4 Mask Test (Cont’d) Item Specifications Mask Margin Test One Shot, Continuous Mask Alignment Auto: Zero/One/Crossing User Defined: X1, ΔX, Y1, ΔY marker Mask Display ON/OFF Margin Measurement Mask Margin: –100 to +100% Fail criteria (The number of failed samples) 1 to 999999999 (1 step) Mask Area Restriction: ON/OFF Angle...
- Page 335 MP2100B BERTWave Table A.1.3-6 Vertical System Item Specifications Electrical input Data input: Option 021: CH A, CH B, Option 023: CH A Input connector: Termination: 50 Ω Absolute maximum input: ±2 V* Input range Offset: ±500 mV max. Dynamic range: ±400 mV max.
- Page 336 Appendix A Specifications Table A.1.3-6 Vertical System (Cont’d) Item Specifications Electrical input Amplitude accuracy (Cont’d) ±amplitude accuracy ±2% for reading value* The following figure shows the amplitude accuracy after calibration. Scale=1 mV/div Scale=15 mV/div Scale=50 mV/div Scale=100 mV/div Scale=200 mV/div Scale=250 mV/div Differences at Offset Values (mV) *3: After internal calibration...
- Page 337 MP2100B BERTWave In this example, the difference between 1 level voltage (200 mV) and offset voltage (50 mV) is 150 mV. At a scale of 50 mV/div for a voltage difference of 150 mV, the amplitude accuracy is 8 mV. At 1 level accuracy, the difference is calculated as follows: 200 ×...
- Page 338 Appendix A Specifications Table A.1.3-6 Vertical System (Cont’d) Item Specifications Optical input Data input Option 023: CH B Connector , SC* Suitable fiber Single mode fiber, multi-mode fiber (62.5 µm)* Wavelength range 750 to 1650 nm Bandwidth* DC to 9.0 GHz Optical noise* (Unit:µWrms) Wavelength...
- Page 339 MP2100B BERTWave Table A.1.3-7 Digital System Item Specifications Sampling speed 100 k sample/second* Fast sampling rate Effective sampling speed: 150 k sample/second* mode Number of samples: Eye pattern 509, 1021, 1350, 2039, 4093, 8191, 16381 Accumulation type: Infinite, Limited Bit on screen: 1 to 100, 1 bit step *1: Nominal value *2: Sampling mode: Eye, The number of samples: 1350, Bit on screen: 2...
- Page 340 Appendix A Specifications Table A.1.3-8 Clock Recovery Item Specifications Clock Recovery CRU Input (MP2100B-053) Sensitivity: 100 mVp-p* Maximum Amplitude: 2 Vp-p CRU Output Connector: SMA jack Termination: AC coupling, 50 Ω Amplitude: 0.1 to 2.7 GHz: 270 to 540 mVp-p 8.5 to 12.5 GHz: 500 to 1500 mVp-p Frequency:...
- Page 341 MP2100B BERTWave Table A.1.3-9 Filter Item Specifications High Rate Filter Bank Filter configuration (MP2100B-063) Up to four filters four of MP2100B-076 to 086 can be installed. Low Rate Filter Bank Filter configuration (MP2100B-065) Up to four sets of the following can be installed: MP2100B-070 to MP2100B-073, and MP2100B-075 Multi Rate Filter Filter configuration...
- Page 342 Appendix A Specifications Table A.1.3-9 Filter (Cont’d) Item Specifications Filter Bank Set Refer to MP2100B-071, MP2100B-073, MP2100B-075, MP2100B-080, (622M/1.2G/2.5G/4.2G MP2100B-082 and MP2100B-086 /6.2G/ Multi 10G) (MP2100B-087) Filter Bank Set Refer to MP2100B-080, MP2100B-081, MP2100B-082 and MP2100B-086 (4.2G/5.0G/6.2G/ Multi 10G) (MP2100B-088) Filter Bank Set Refer to MP2100B-070, MP2100B-071, MP2100B-073 and MP2100B-075 (156M/622M/1.2G/2.5...
- Page 343 MP2100B BERTWave A.1.4 General Performance Table A.1.4-1 General Performance Item Specifications Panel Input functions: Rotary , touch panel, power switch Display 12.1 inch LCD: WXGA (1280 × 800) LED: Disk access, standby, power Function Measurement buzzer, panel lock, file save/load, screen copy, system alarm, initialization, block diagram display, minimization of application window, OS recovery Peripheral Devices...
- Page 344 Appendix A Specifications A.2 Optical Transceiver Module Table A.2-1 850 nm SFP Item Specifications Model/Product Name G0177A 850 nm SFP Module Bit rate 1.062 to 4.25 Gbit/s Transmitter Output –9.0 to –2.5 dBm Laser safety class IEC60825-1: Class 1 Class I (FDA 21 CFR 1040.10) Center wavelength 830 to 860 nm RMS Spectrum width...
- Page 345 Optical Transceiver Module Table A.2-2 1310 nm SFP Item Specifications Model/Product Name G0178A 1310 nm SFP Module Bit rate 0.15 to 2.67 Gbit/s Transmitter*1 Output –5.0 to 0.0 dBm Laser safety class IEC60825-1: Class 1 Class I (FDA 21 CFR 1040.10) Center wavelength 1270 to 1360 nm SMSR...
- Page 346 Appendix A Specifications Table A.2-3 1550 nm SFP Item Specifications Model/Product Name G0179A 1550 nm SFP Module Bit rate 0.15 to 2.67 Gbit/s Transmitter* Output –5.0 to 0.0 dBm Laser safety class IEC60825-1: Class 1 Class I (FDA 21 CFR 1040.10) Center wavelength 1430 to 1590 nm SMSR...
- Page 347 Optical Transceiver Module Table A.2-4 850 nm SFP+ Item Specifications Model/Product Name G0238A 850 nm SFP+ Module Bit rate 10.3125 Gbit/s Transmitter Output –5.0 to –1.0 dBm Laser safety class IEC60825-1: Class 1 21 CFR 1040.10: Class I Center wavelength 840 to 860 nm RMS Spectrum width 0.45 nm or less...
- Page 348 Appendix A Specifications Table A.2-5 1310 nm SFP+ Item Specifications Model/Product Name G0239A 1310 nm SFP+ Module Bit rate 9.95328 to 10.3125 Gbit/s Transmitter* Output –8.2 to 0.5 dBm Laser safety class IEC60825-1: Class 1 21 CFR 1040.10: Class I Center wavelength 1260 to 1355 nm SMSR...
- Page 349 Appendix B Initial Values Table B-1 Initial Values of PPG/ED Item Initial Value Ch Tracking Reference CLK Ch1, Ch3: Internal 10 MHz Ch2, Ch4: Ch1 Sync Output PPG1_1/4Clk Table B-2 Initial Values of PPG Item Initial Value Data/XData Bit Rate Standard Variable Bit Rate 8500000 kbit/s...
- Page 350 Appendix B Initial Values Table B-3 Initial Values of ED Item Initial Value Tracking Bit Rate Standard Variable Bit Rate 8500000 kbit/s Data Input Condition Electrical Single-Ended-Data Data Input Condition 0 mV Threshold External ATT 0 dB Test Pattern PRBS 2^9–1 Programmable Pattern "--------------"...
- Page 351 Appendix B Initial Values Table B-4 Initial Values of Sampling Oscilloscope (EYE/Pulse Scope) Item Initial Value Amplitude Attenuation A 0 dB Attenuation B 0 dB Channel A/B Tracking Channel Math Define Function CHA+CHB Scale Offset 0 mV Offset A 0 mV Offset B 0 mV* 0 µW*...
- Page 352 Appendix B Initial Values Table B-4 Initial Values of Sampling Oscilloscope (Cont'd) Item Initial Value Measure Active Channel Selection Channel A Measurement Item Amplitude/Time Correction Factor 0 ps Item Item Selection (Ch.A) Jitter p-p (Ch.A) Jitter RMS (Ch.A) Crossing (Ch.A) Eye Amplitude Measuring Area Marker Offset form Crossing...
- Page 353 Appendix B Initial Values Table B-4 Initial Values of Sampling Oscilloscope (Cont'd) Item Initial Value Measure (Cont'd) Measurement Item Mask Test Align Marker Display Off 0.50 1.00 ∆X ∆Y Align Method Zero/One/Crossing Eye Mask Select 1GFC Mask Area Restriction Angle Width 0.10 UI Mask Margin...
- Page 354 Appendix B Initial Values Table B-4 Initial Values of Sampling Oscilloscope (Cont'd) Item Initial Value Setup Accumulation Type Persistency Averaging 10 wfms Clock Recovery CRU Loop BW 1 MHz Fast Sampling Mode Inverse background color Limit Type Time Number of Samples 8191 Ref.
- Page 355 Appendix B Initial Values Table B-5 Initial Values of Optical Transceiver (SFP+) Item Initial Value Output Table B-6 Initial Values of O/E Converter Item Initial Value Filter On/Off* Conversion Gain Extinction Ratio Correction Extinction Ratio Correction Factor 0.00% Filter Responsivity System Conversion Gain Wavelength 1550...
- Page 356 Appendix B Initial Values Table B-7 Initial Values of Setup Utility Item Initial Value Remote Control Active Interface Ethernet Protect GPIB* Address Ethernet Local Area Connection (Upper) IP Address 192 168 100 101 Subnet Mask 255 255 255 0 Gateway Local Area Connection (Lower) IP Address...
- Page 357 Appendix C Keyboard and Mouse Operations The operation of the rotary knob, arrow keys displayed on the screen, numeric input panel, and buttons in dialogue boxes and the corresponding keyboard and mouse operations are explained below. Table C-1 Correspondence between Rotary Knob Operation and Keyboard Rotary Knob Operation Keyboard...
- Page 358 Appendix C Keyboard and Mouse Operations Table C-3 Corresponding to Mouse Operation Mouse Operation Corresponding Operation Left button click Save same as touching touch panel Right button click No operation Wheel Same as turning rotary knob ↑Forwards: Clockwise ↓Backwards: Counterclockwise C-2.
- Page 359 Appendix D Pattern Files Appendix D describes the specifications for pattern files and mask files. Pattern File Specifications ..........D-2 Mask file Specifications ..........D-4...
- Page 360 D.1 Pattern File Specifications The specifications for data files read as PPG or ED are as follows: Table D.1-1 Specifications for Data Pattern File Item Specifications Save destination folder C:\Program Files\Anritsu\MP2100A \MX210000A\UserData\Pattern File extension Data length (bits) 2 to 1305600...
- Page 361 Pattern File Specifications Example of pattern file Figure D.1-1 Example of Pattern File Described by Hexadecimal Number Figure D.1-2 Example of Pattern File Described by Binary Number...
- Page 362 The mask file specifications reading with Sampling Scope is as follows. Table D.2-1 Mask File Specifications Item Specification Save folder C:\Program Files\Anritsu\MP2100A \MX210000A\UserData\Mask File extension The mask file is the test format file. The mask margin 0, –100 and 100% of the top mask of the coordinate value are described to the file.
- Page 363 Mask file Specifications The following items are described in the mask file. Table D.2-2 Details of Mask File Item Parameter to be set Description Version Masks Version#1 Make sure that the version is written. Mask name Mask name Mask name displayed on the measurement screen.
- Page 364 Appendix D Pattern Files >>>>>>>>>> START >>>>>>>>>> Masks Version#1 <1GFC ; 1G Optical Fibre Channel Mask (1.0625 Gbps)> Relative Mask; X_min Y_min X_max Y_max Middle X_min Y_min X_max Y_max 0.215 0.785 Bottom X X_min Y_min X_max Y_max -0.2 -0.4 -0.2 -0.4 >>>>>>>>>>...
- Page 365 Appendix E Performance Test Record Form Document number: Test Location: Date: Test person in charge: Product name: Serial number: Software version: Option: Power voltage: Power frequency: Ambient temperature °C Relative humidity Model name Serial number Instruments used Model name Serial number Model name Serial number Model name...
- Page 366 Appendix E Performance Test Record Form E.1 Pulse Pattern Generator Table E.1-1 Pulse Pattern Generator Performance Test Record Form (Without Option 092) Measurement Channel PPG Frequency Accuracy Set Bit Rate Minimum Measured Maximum Measurement Connector Pass/Fail (kbit/s) Value (kHz) Value (kHz) Value (kHz) Uncertainty Data Out...
- Page 367 Appendix E Performance Test Record FormPulse Pattern Generator Table E.1-2 Pulse Pattern Generator Performance Test Record Form (With Option 092) Measurement Channel PPG Frequency Accuracy Set Bit Measured Minimum Maximum Measurement Connector Rate Value Pass/Fail Value (kHz) Value (kHz) Uncertainty (kbit/s) (kHz) Data Out...
- Page 368 Appendix E Performance Test Record Form E.2 Error Detector Table E.2-1 Error Detector Performance Test Record Form (Without Option 092) Measurement Channel ED Input Level Minimum ER Measured Maximum Connector Set Bit Rate Pass/Fail Value Value Value Data Out 11320000 kbit/s 1E–12 Pass/Fail 132813 kbit/s...
- Page 369 Appendix E Performance Test Record FormError Detector Table E.2-1 Error Detector Performance Test Record Form (Without Option 092) (Cont’d) Error Detection Minimum ER Measured EC Measured Connector Set Bit Rate Pass/Fail Value Value Value Data Out 11320000 kbit/s Pass/Fail Data Out 11320000 kbit/s Pass/Fail...
- Page 370 Appendix E Performance Test Record Form Table E.2-2 Error Detector Performance Test Record Form (With Option 092) Measurement Channel ED Input Level Minimum ER Measured Maximum Connector Set Bit Rate Pass/Fail Value Value Value Data Out 12500000 kbit/s 1E–12 Pass/Fail 125000 kbit/s 1E–12 Pass/Fail...
- Page 371 Appendix E Performance Test Record FormError Detector Table E.2-2 Error Detector Performance Test Record Form (With Option 092) (Cont’d) Error Detection Minimum ER Measured EC Measured Connector Set Bit Rate Pass/Fail Value Value Value Data Out 12500000 kbit/s Pass/Fail Data Out 12500000 kbit/s Pass/Fail...
- Page 372 Appendix E Performance Test Record Form E.3 Sampling Oscilloscope Amplitude Accuracy Table E.3-1 Level Accuracy Setting Minimum Measured Maximum Measurement Connector Pass/Fail Voltage Value Value Value Uncertainty +200 mV +186.5 mV mV +213.5 mV Pass/Fail Ch A –200 mV –213.5 mV –186.5 mV Pass/Fail +200 mV...
- Page 373 Appendix E Performance Test Record FormOptical Interface E.4 Optical Interface Optical Power Meter: ±0.35 dB or less (–12 dBm or more) Table E.4-1 Accuracy of Optical Power Meter (Option 023) Average Reading of Power(dBm) Minimum Level Maximum Wavelength Optical Pass/Fail Value Difference Value...
- Page 374 Appendix E Performance Test Record Form E-10.
- Page 375 Appendix F Bibliography (1) IEC60825-1 Safety of laser products. Part 1: Equipment classification, requirements and user's guide (2) IEC61010-1 Safety requirements for electrical equipment for measurement, control, and laboratory use - Part 1:General requirements (3) IEC61280-2-1 Fibre optic communication subsystem basic test procedures - Part 2-1: Test procedures for digital systems - Receiver sensitivity and overload measurement (4) IEC61280-2-2 Fibre optic communication subsystem test procedures - Part...
- Page 376 (21) SFF Committee SFF-8635 QSFP+ 10 Gb/s 4X Pluggable Transceiver Solution (QSFP10) (22) Common Public Radio Interface CPRI Specification V6.0 (23) Open Base Station Architecture Initiative Reference Point 3 Specification Version 4.2 (24) Anritsu CorporationProcedure for Calculating Extinction Ratio Correction Factor https://www.anritsu.com/en-us/test-measurement/support/downloads/manuals/d wl010776 F-2.
- Page 377 Index References are to page numbers. Averaging process .......... 7-33 Axis ..............7-52 0 Level ............1-13 Basic Procedure of Generating Pulse Signal 5-10 1 Level ............1-13 BERTWave Types ..........1-2 1310 nm SFP ..........A-25 Bit Error Rate ..........1-21 1310 nm SFP+ ..........
- Page 378 Index Crossed-out Wheeled Bin Symbol ....xv Eye/Pulse Scope Fatal Temperature .... 4-20 CRU Band ............7-27 EYE/Pulse Scope Screen ......... 7-2 CRU loop BW ..........7-27 Eye/Pulse Scope Temperature ...... 4-20 Current Mask ..........7-59 F D Fall Time ............1-20 Daily Maintenance ........
- Page 379 Index L OMA ............... 1-20 Omission Error ..........1-20 Labels on Product ..........viii One Level ............1-13 Laser Radiation Markings ......... ix Open ............... 4-10 Laser Safety Classifications ......vii Operating O/E Converter ........ 8-7 Length ............7-35 Operating Optical Transceiver ....... 8-5 Lifetime of Parts ..........
- Page 380 Index R Setting same vertical scale for two waveforms ..............7-41 RCM Conformity Marking ....... xxi Setting Sync Output ........5-26 Reading measurement conditions from file . 4-10 Setting System Menu ........4-8 Rear Panel ............2-8 Setup Dialog Box ..........7-4 Reboot ............
- Page 381 Index Transporting and Destroy ......10-15 Turning Power On/Off ........2-20 U Unlocking the panel ........4-13 Unpacking ............2-2 Untimed ............6-21 Update ..........7-60, 10-10 Updating Software ........10-10 User defined ........... 7-55 Using External Monitor ........ 2-26 Using Marker ..........
- Page 382 Index Index-6.
Need help?
Do you have a question about the BERTWave MP2100B and is the answer not in the manual?
Questions and answers