LogTag TRED30-16R Manual
Training
Hide thumbs
Also See for TRED30-16R:
- Product user manual (55 pages) ,
- Quick start manual (17 pages) ,
- Battery replacement (3 pages)
Advertisement
Quick Links
Advertisement

Related Manuals for LogTag TRED30-16R


Summary of Contents for LogTag TRED30-16R
- Page 1 RAINING TRED30-16R L OGGER...
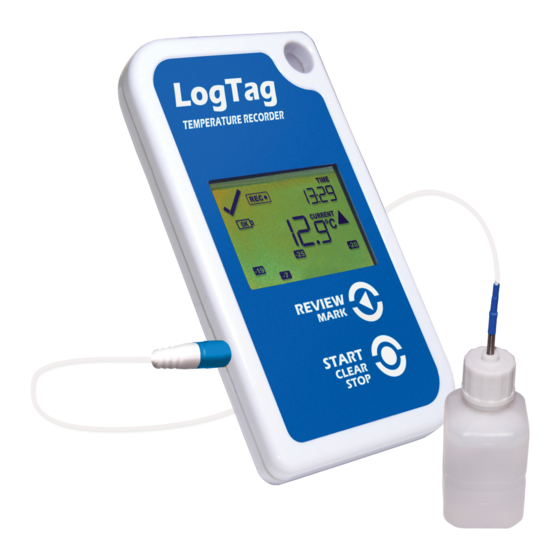
- Page 2 Unpacking the Loggers Each kit has been checked by our staff to ensure it is complete Each Kit Includes the following items: • TRED30 Data Logger • External Probe w/60ml Glycol Bottle • Label Stickers • Wall Mount Bracket • Spare Battery •...
- Page 3 Match the Probe & Logger – Important!! • Each logger and probe/vial must be matched by serial number • When unboxing take care to keep probe/vial & matching logger together...
- Page 4 Remove protective film from front of logger by peeling it off...
- Page 5 Each kit will come with a Fridge and Freezer adhesive label which you must affix to the front of the logger. label in image is only an example, your label may be different...
- Page 6 Install the Vial and Probe Cable • Place vial in center of fridge/freezer unit secure with tape or with Velcro included place vial in tray if used with wire rack • Run probe cable through hinge side of door •...
- Page 7 Example of installation on wire rack...
- Page 8 Installing the Logger • Identify mounting location outside of fridge/freezer • Be sure it’s within reach of both freezer/fridge probes & is easily accessible • Attach LTI-MOUNT (clear plastic mount) using the included double sided tape (located in each mount) •...
- Page 9 • Logger with probe attached in mount...
-
Page 10: Software Installation
Software Installation • If you have an IT Department, we recommend that you have them install the software. • We recommend being logged in with full administrator rights before installing the software. -
Page 11: System Requirements
System Requirements To ensure that the software will work on your computer the following a minimum specifications are required: • PC capable of running Windows 7 or later, or Windows 2008 Server or later • 60MB free disc space (plus 30MB if .NET is not yet installed) •... -
Page 12: Install Software
Install Software • Download the LogTag Analyzer Software from the software downloads page on our website: www.MicroDAQ.com/software • There are two versions of software available – Version 3.1.x should be used in most cases – Version 2.9.x should only be used if directed by your administrator... - Page 13 • Follow the on-screen instructions to complete the installation process. • Additional instructions can be found by downloading the LogTag Analyzer Software manual also located on the website. • If you have an IT Department, we recommend that you have them install the...
- Page 14 Install Software • Once software is installed plug the docking station (LTI-HID) into your PC by inserting the USB plug into an available USB port on your PC...
- Page 15 Launching and setting up the Software • Locate the LogTag Analyzer (LTA) icon on your desktop and double click it to launch the software...
- Page 16 General Software Settings The software will displays temp in Celsius by default. If you want to display your data in Fahrenheit: • Click on the “options” button to access the General Settings screen...
- Page 17 General Software Settings • You can change temperature from Celsius to Fahrenheit by using the drop down menu next to the “Show temperatures in” field. • To exit without making changes click “Cancel”. If you made changes click “OK” to save them...
-
Page 18: Configuring The Logger
Configuring the Logger The loggers will need to be configured for Fridge or Freezer use using the recommended setting for your state. Please contact your VFC/DOH rep or office for the specific configuration settings for your state. • The settings shown in the following slides are for example only – the settings for your state may vary. - Page 19 Configuring the Logger • Open LogTag Analyzer Software (LTA) (If not already open) • Drop Logger into docking station – Push down until you hear logger click into place • If this is your first time inserting the logger, a notification box will pop up telling you that there is no data on the device •...
- Page 20 Configuring the Logger • Launch the Configuration Wizard by clicking on the Wizard button • This will open the LogTag Wizard window.
- Page 21 Configuring the Logger • The LogTag Wizard will then scan for available loggers...
- Page 22 Configuring the Logger • Once the logger is discovered the “Configure” button becomes active • Click “Configure” to access the configuration options...
- Page 23 Configuring the Logger • Description: Give each logger a unique name for easy identification • We do not recommend using either password option • Choose “Push button start” in the drop down...
- Page 24 Configuring the Logger Confirm the following settings • “Record readings so that:” is selected • Set “Record a reading every” to your desired sample rate (HH:MM:SS) • Optional - Set “Begin recording after a delay of” to X minutes – This feature creates a delay from the time you start the logger to the time it starts recording. This can give you time to plug in the sensor cable before the logger starts recording data.
- Page 25 Configuring the Logger Confirm the following settings • Check box enabling the Audible alarm • Box checked next to “Trigger alarm when readings above/equal” • 46.5°F (8.1°C )* is in the field for Fridge or 5.1°F (-14.9°C)* for Freezer • Box checked next to “Trigger alarm when readings below/equal”...
- Page 26 Configuring the Logger • Click “Advanced Settings” button to continue...
- Page 27 Configuring the Logger Suggested settings* • Box is checked for “Alarm remains on even if readings return to non-violation range” • Box is checked for “Switch off display after 30 seconds (Power save)” • Box is checked for “Allow logging to stop with STOP button” •...
- Page 28 Configuring the Logger • With “Power Save” enabled the logger display will turn off after 30 seconds in order to maximize battery life. To turn on the display simply press the “Review” button on the logger • The logger continues to record even when the display is off...
- Page 29 Configuring the Logger • Once settings are complete click the “Configure” button...
- Page 30 Configuring the Logger Configuration is now being transferred to the logger Progress bar...
- Page 31 Configuring the Logger • When status bar shows “Configured” logger can be removed from docking station • If you are done configuring click “Close” or if you have another logger to configure insert it and click “Restart Wizard”...
- Page 32 Configuring the Logger • You can now bring the logger back to it’s proper location and carefully reattach the probe • Important – Loggers must be plugged into serial number matched probe...
- Page 33 Attach Probe to Logger • Important! - Make sure serial number on Logger matches serial number on Probe/Vial • Insert probe end into plug on logger. You should hear the probe “Click” into place • Care must be taken not to damage the probe tip. Inserting the probe into the logger at an angle will damage it...
- Page 35 Temperature - Temperature value (in °C or °F) Reading Type - CURRENT = The temperature of the last reading taken = The maximum reading in a given 24hr period = The minimum reading in a given 24hr period ALARM/OK Indicator – X appears when an alarm is triggered Check Mark = Ok Status...
- Page 36 Time value - The time (in HH:MM) can be current time, time remaining to start of delayed start, or duration of a given max/min value above/below the specified limits. Alarm Threshold Markers- The up-arrow is shown if the temperature displayed is above the specified upper temperature threshold.
- Page 37 The value displayed is indicated by the following: TIME Indicators Time: Represents the current time in hours and minutes (24- hour format) Delay: The time represents a start delay in hours and minutes Duration: The time represents the length of time in hours and minutes an alarm threshold was exceeded, for example the time above the upper alarm threshold...
- Page 38 Battery Low Symbol – The battery low symbol will appear if the battery is low and requires changing. If the symbol is not shown while the display is turned on, the battery is OK. Temperature Unit – Displays last recorded temperature while the logger is recording.
- Page 39 Recording State Indicators READY = Ready to start recording STARTING = Preparing to start recording. If a delayed start is configured then displays time remaining to recording start along with word DELAY REC = Logger is recording (logging data)
- Page 40 Recording State Indicators PAUSED = Max/Min statistics paused due to button press activity (if so configured) Logger is still recording but values are not taken into account when calculating alarm events and durations. Stopped = Recording has stopped...
- Page 41 Day Alarm Markers – Grid shows 3 rows of 10 markers, named Today [T] to Day - 29, which are switched on when an alarm event occurred on that day. Day Number – Default is the day number of the current selected day statistic is displayed when in review mode.
- Page 42 Starting the Logger It is recommended that you read through the next few slides before attempting to start your logger. Once done please go through them again while you follow along with your logger. Confirm that “Ready” is displayed on the LCD Screen Press and hold the start button and observe that the “STARTING”...
- Page 43 Starting the Logger • Once released “STARTING” icon stops flashing – If it doesn’t or goes back to “Ready” try again. • If correctly started the logger should show the current temperature and display the REC (record) symbol • If a Start Delay was used it will be shown on this screen – see below –...
- Page 44 Starting the Logger • It is important to release the start button as soon as the “starting” icon stops flashing. • Holding the button too long or releasing the button too soon will revert the logger back to “ready” status. It can take some practice to get your timing right. •...
- Page 45 During Recording During normal operation the display shows the most recently recorded temperature. This temperature is updated at the same rate as the logging interval. The current time is also displayed (in 24 hour format). A tick symbol is shown as long as no alarm event has occurred. If an alarm event is registered, a cross symbol is shown instead of the tick.
- Page 47 During Recording Clearing Alarms – Alarms are cleared by stopping the logger, downloading the data, and reviewing the excursion.
- Page 48 Reviewing Daily Statistics • Press the “Review” button to display the current day’s max temperature • Document this max temperature on your paper temperature log • The “T” marker flashes and 00 DAYS is shown to indicate that today’s data is being displayed.
- Page 49 Reviewing Daily Statistics • Pressing “Review” again displays the day’s minimum temperature • Document this min temperature on your paper temperature log • The “T” marker flashes and 00 DAYS is shown to indicate that today’s data is being displayed.
- Page 50 Reviewing Daily Statistics • Pressing “Review” again displays the next previous day’s max statistic • The -1 marker flashes and -01 DAYS is shown to indicate that yesterday’s data is being displayed • Yesterday, recordings above the upper threshold were recorded, indicated by the upper alarm threshold marker...
- Page 51 Reviewing Daily Statistics • The duration value shows the amount of time recorded above the limit yesterday, which was 12 hours and 30 minutes • An alarm was triggered, indicated by the , as this duration was longer than the allowed time above the threshold •...
- Page 52 Reviewing Daily Statistics • Pressing “Review” again displays the next previous days minimum temperature • - 1 still flashes and -01 DAYS still shows, as we are still looking at yesterday’s data • Yesterday, no temperature values were recorded below the lower alarm threshold. The alarm for the day -1 was generated by the upper alarm, not the lower alarm, so a check is displayed with the minimum statistic.
- Page 53 Reviewing Daily Statistics • Pressing “Review” again displays the next previous days maximum temperature • With each press of the “Review” button the logger will cycle through each previous days Min and Max temperature.
- Page 54 View/Save Logger Data • Slide logger out of mount • Stop the recording process by pressing and holding the “Start/clear/stop” button • When “STOPPED” is no longer flashing release the button • You should see “STOPPED” on screen • It is important to confirm that the logger is stopped before continuing to the next step of unplugging the probe...
- Page 55 View/Save Logger Data • Unplug probe from Logger – Important: Do not pull on the probe cable to unplug the probe from the logger as this can permanently damage the probe • To remove the probe grasp with fingers on probe end (blue band) and pull straight back from the Logger...
- Page 56 – Loggers must be plugged back into the proper serial number matched probe. Take care to return each logger to it’s original location • Open LogTag Analyzer Software (LTA) • Insert Logger into docking station – Be sure Logger “clicks” into place...
- Page 57 View/Save Logger Data • Data is automatically saved to computer and Analyzer launches data window and displays the “Chart” tab...
- Page 58 View/Save Logger Data • Additional views and report options can be chosen from the tabs at the bottom of the window...
- Page 59 View/Save Logger Data • Once graph is visible the data has been saved and the logger can be re- launched. • To re-launch the logger click on the Wizard button...
- Page 60 View/Save Logger Data • The logger can now be re-launched by following the same procedure described in the “Configuring the Logger” section • Analyzer will retain the configuration settings, however we recommend double checking that they are correct before sending the configuration to the logger and re-launching the logger –...
-
Page 61: Changing The Battery
Changing The Battery The battery life on your LogTag Logger is up to 1-year. If you see the low battery indicator on the LCD screen or get a pop up warning when downloading the logger you will need to replace the battery. Your logger kit included a spare coin cell battery which is to be used when a replacement is needed. - Page 62 Changing The Battery • Step 2 (cont.): Once you click on “Hibernate” you will get a pop-up warning you that all the data on the recorder (logger) will be deleted. Click “YES” to place the logger into Hibernation. Note: Failure to hibernate the logger may result in serious memory corruption.
- Page 63 Changing The Battery • Step 2 (cont.): Once you click “YES” and see a green check in the Hibernated column your logger will be in Hibernation mode – Once complete click “Close” and remove your logger from the docking station...
- Page 64 Changing The Battery • Step 3: Remove the old Battery...
- Page 65 Changing The Battery • Step 4: Insert the new battery (Continued)
- Page 66 Changing The Battery • Step 4 (cont.): Insert the new battery (Continued)
- Page 67 Changing The Battery • Step 4 (cont.): Insert the new battery • Step 5: Replace battery cover & reconfigure logger...
-
Page 68: Troubleshooting
Troubleshooting • Issue: Display or data shows --.- as temperature reading – Cause: Probe is/was not plugged into logger or not properly attached > reattach probe to logger • Issue: Logger doesn’t start after pressing “Start” button – Solution: Review section on Starting the Logger •... -
Page 69: Additional Support
Additional Support • Detailed instructions on using the logger and Analyzer Software can be found in the LogTag Analyzer manual • Manual can be downloaded from the website or by clicking on the “help” option from inside the LTA software •...
Need help?
Do you have a question about the TRED30-16R and is the answer not in the manual?
Questions and answers