Advertisement
Quick Links
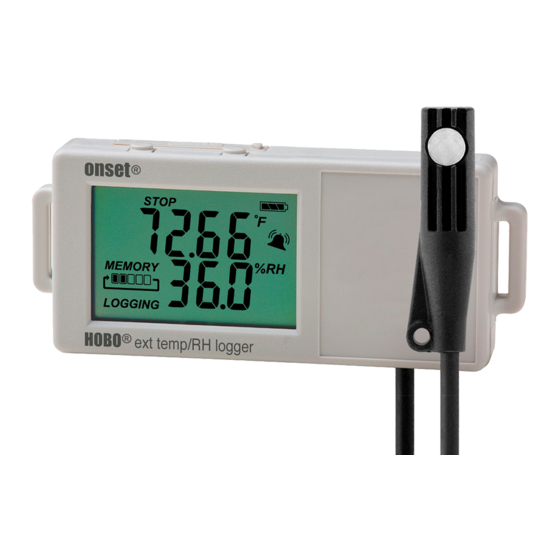
HOBO® External Temp/RH Data Logger (UX100‐023A) Manual
HOBO External
Temp/RH Data Logger
UX100‐023A
Included Items:
Command™ strip
Double‐sided tape
Hook & loop strap
Required Items:
HOBOware 3.7.16 or later
(download at
www.onsetcomp.com/
hoboware‐free‐download)
USB cable
22934‐B
The HOBO External Temp/RH data logger records temperature and relative humidity in an indoor
environment with its external sensor. Using HOBOware®, you can easily configure the logger
alarm to trip for specific high or low sensor readings. Or, you can set up burst logging in which the
logger records data at a different interval during certain conditions. The logger can also calculate
minimum, maximum, average, and standard deviation statistics. This compact data logger has a
built‐in LCD screen to monitor the current temperature, relative humidity, logging status, battery
use, and memory consumption in between readouts.
Specifications
Temperature Sensor
Range
Accuracy
Resolution
Response Time
Drift
RH Sensor
Range
Accuracy
Resolution
Response Time
Drift
Cable Length
Logger
Logger Operating Range
Logging Rate
Logging Modes
Memory Modes
Start Modes
Stop Modes
Restart Mode
Time Accuracy
Power Source
Battery Life
Memory
Download Type
Full Memory Download Time
LCD
Size
Weight
Environmental Rating
‐20° to 70°C (‐4° to 158°F)
±0.21°C from 0° to 50°C (±0.38°F from 32° to 122°F)
0.02°C (0.04°F)
3 minutes, 45 seconds in air moving 1 m/s (2.2 mph)
<0.1°C (0.18°F) per year
1% to 100% RH at ‐40° to 75°C (‐40° to 167°F), non‐condensing;
exposure to conditions below ‐20°C (‐4°F) or above 95% RH may
temporarily increase the maximum RH sensor error by an additional
1%
±2.5% from 10% to 90% RH typical to a maximum of ±3.5% including
hysteresis at 25°C (77°F); below 10% and above 90% ±5% typical
0.01%
15 seconds to 90% in airflow of 1 m/s (2.2 mph)
<1% per year typical
1.83 m (6 ft)
Logging: ‐20° to 70°C (‐4° to 158°F); 0 to 95% RH (non‐condensing)
Launch/Readout: 0° to 50°C (32° to 122°F) per USB specification
1 second to 18 hours, 12 minutes, 15 seconds
Fixed interval (normal), burst, or statistics
Wrap when full or stop when full
Immediate, push button, date & time, or next interval
When memory full, push button, or date & time
Push button
±1 minute per month at 25°C (77°F), see Plot A
One 3V CR2032 lithium battery and USB cable
1 year, typical with logging rate of 1 minute and sampling interval of
15 seconds or greater
128 KB (63,488 measurements, maximum)
USB 2.0 interface
20 seconds
LCD is visible from 0° to 50°C (32° to 122°F); the LCD may react
slowly or go blank in temperatures outside this range
3.66 x 8.48 x 1.52 cm (1.44 x 3.34 x 0.6 in.)
30 g (1.06 oz)
IP50
The CE Marking identifies this product as complying with all relevant
directives in the European Union (EU).
Advertisement

Related Manuals for Hobo UX100-023A


Summary of Contents for Hobo UX100-023A
- Page 1 HOBO® External Temp/RH Data Logger (UX100‐023A) Manual The HOBO External Temp/RH data logger records temperature and relative humidity in an indoor environment with its external sensor. Using HOBOware®, you can easily configure the logger alarm to trip for specific high or low sensor readings. Or, you can set up burst logging in which the logger records data at a different interval during certain conditions. The logger can also calculate minimum, maximum, average, and standard deviation statistics. This compact data logger has a built‐in LCD screen to monitor the current temperature, relative humidity, logging status, battery use, and memory consumption in between readouts. Specifications Temperature Sensor Range ‐20° to 70°C (‐4° to 158°F) Accuracy ±0.21°C from 0° to 50°C (±0.38°F from 32° to 122°F) Resolution 0.02°C (0.04°F) HOBO External Response Time 3 minutes, 45 seconds in air moving 1 m/s (2.2 mph) Temp/RH Data Logger Drift <0.1°C (0.18°F) per year UX100‐023A RH Sensor Range 1% to 100% RH at ‐40° to 75°C (‐40° to 167°F), non‐condensing; Included Items: exposure to conditions below ‐20°C (‐4°F) or above 95% RH may temporarily increase the maximum RH sensor error by an additional Command™ strip 1% Double‐sided tape Hook & loop strap Accuracy ±2.5% from 10% to 90% RH typical to a maximum of ±3.5% including ...
-
Page 2: Specifications
HOBO External Temp/RH Data Logger (UX100‐023A) Manual Specifications (continued) LCD Symbol Description The logger is waiting to be launched. Press and hold the Start/Stop button for 3 seconds to launch the logger. The logger has been launched with a push button stop enabled; press and hold the Start/Stop button for 3 seconds to stop the logger. Note: If Plot A: Time Accuracy you also launched the logger with a push button start, this symbol will not appear on the display for 30 seconds. Logger Components and Operation The battery indicator shows the approximate Battery Tray battery power remaining. Alarm/Stats Button Start/Stop Button The logger has been configured to stop logging when memory fills. The memory bar indicates the approximate space remaining in the logger to record data. When first launched, all five segments in the bar will be empty. In this example, the Mounting logger memory is almost full (only one segment in Loop the memory bar is empty). Mounting ... - Page 3 HOBO External Temp/RH Data Logger (UX100‐023A) Manual LCD Symbol Description This is an example of a temperature reading. Temperature units are determined by the settings in HOBOware. To switch between Celsius and Fahrenheit, change the Display Preferences in HOBOware before launching the logger. This is an example of an RH reading. The logger has been configured to start logging on a particular date/time. The display will count down in days, hours, minutes, and seconds until logging begins. In this example, 5 minutes and 38 seconds remain until logging will begin. The launch settings are being loaded onto the logger from HOBOware. Do not disconnect the USB cable during this process. An error occurred while loading the launch configurations onto the logger from HOBOware. Make sure the USB cable is connected to both the logger and the computer and try launching again. The logger has been stopped with HOBOware or because the memory is full. 3. Set up alarms (optional). Click the Alarms button if you want to configure an alarm to trip when the sensor reading Notes: is above or below a value you specify. See Setting up Alarms You can disable the LCD screen when logging. Select for details. “Turn LCD off” when setting up the logger as described in ...
-
Page 4: Setting Up Alarms
HOBO External Temp/RH Data Logger (UX100‐023A) Manual Push Button. Logging will end once you press the Start/Stop logging button for 3 seconds. Note that if you also choose Push Button to start logging, then you will not be able to stop logging until 30 seconds after logging begins. If you select the Push Button setting, then you also have the option to select “Allow button restart.” This allows you to stop and then restart logging during the deployment by pushing the Start/Stop button on the logger for 3 seconds. Important: When “Allow button restart” is selected and you use the Start/Stop button to stop and restart logging, logging will restart on the next even logging interval, not at the time the button was pushed. For example, a logger started logging at 7:00 AM with a logging interval set to 1 hour. If you press the Start/Stop button to stop the logger at 8:45 AM and then press the button again at 10:15 AM, logging will not begin immediately at 10:15. Instead, logging will begin again at 11:00 AM, which is the next even interval 3. Select the High Alarm checkbox if you want an alarm to time based on your 1‐hour logging interval. Therefore, trip when the sensor reading rises above the high alarm depending on the logging interval, the gap between the value. Type the reading next to the High Alarm checkbox time you press the button to resume logging and the time or drag the red upper slider in the Configure Alarms actual logging begins could be significant. The faster the window. logging interval, the less time will elapse before logging 4. Select the Low Alarm checkbox if you want an alarm to resumes. trip when the sensor reading falls below the low alarm value. Type the reading next to the Low Alarm checkbox Specific Stop Date. Logging will end at a date and time ... - Page 5 HOBO External Temp/RH Data Logger (UX100‐023A) Manual on the LCD screen. Note that the alarm limits are only checked when the logger’s LCD screen refreshes every 15 seconds. The actual values for the high and low alarm limits are set to the closest value supported by the logger. For example, the closest value to 85°F that the UX100 series logger can record is 84.990°F and the closest value to 32°F is 32.043°F. In addition, alarms can trip or clear when the sensor reading is within the logger specifications of 0.02°C resolution. This means the value that triggers the alarm may differ slightly than the value entered. For example, if the High Alarm is set to 75.999°F, the alarm can trip when the sensor reading is 75.994°F (which is within the 0.02°C resolution). When you read out the logger, high and low alarm levels will be displayed on the plot along with “Chan <#> Alarm Tripped” and “Chan <#> Alarm Cleared” events showing when the sensor alarm tripped and cleared. The “Chan <#> Alarm Cleared” event contains the value that was 5. Repeat steps 2 through 4 for the other sensor, if desired. furthest out of range for the sensor before the alarm cleared (see the Points table for the actual value). 6. Set the burst logging interval, which must be less than the logging interval. Select either a preset burst logging Burst Logging interval or select Custom and enter your own interval. Keep in mind that the more frequent the burst logging Burst logging is a logging mode that allows you to set up more rate, the greater the impact on battery life and the frequent logging when a specified condition is met. For shorter the logging duration. example, let’s say the logger is recording data at a 5‐minute logging interval and burst logging is configured to log every 10 ...
- Page 6 HOBO External Temp/RH Data Logger (UX100‐023A) Manual the logger has a 10‐minute logging interval and logged a data point at 9:05. Then, the high limit was surpassed and burst logging began at 9:06. Burst logging then continued until 9:12 when the sensor reading fell back below the high limit. Now back in normal mode, the next logging interval will be 10 minutes from the last burst logging point, or 9:22 in this case. If burst logging had not occurred, the next data point would have been at 9:15. A New Interval event will appear on the plot (if you select events for plotting in the Plot Setup window) each time 3. Set the sampling interval, which must be less than and a the logger enters or exits burst logging mode. factor of the logging interval. Choose either a preset sampling interval or select Custom and enter your own Statistics sampling interval. Keep in mind that the more frequent the sampling rate, the greater the impact on battery life. Statistics is a logging mode in which the logger calculates maximum, minimum, average, and standard deviation statistics 4. Click OK when done. This will return you to the Launch during logging, recording the results at each logging interval Logger window. Click the Edit button next to Logging based on samples taken at a rate you specify. This will result in Mode in the Launch Logger window to make additional up to four additional series per sensor that record the following changes. information at each logging interval: Once logging begins, click the Alarm/Stats button on the logger The maximum, or highest, sampled value, to cycle through the current maximum, minimum, average, and The minimum, or lowest, sampled value, standard deviation data on the LCD screen. You can plot the ...
-
Page 7: Battery Information
The logger can also be powered by the USB cable when the HOBOware provides the option of recording the current battery remaining battery voltage is too low for it to continue logging. voltage at each logging interval, which is disabled by default. Connect the logger to the computer, click the Readout button Recording battery life at each logging interval takes up memory on the toolbar, and save the data as prompted. Replace the and therefore reduces logging duration. It is recommended you battery before launching the logger again. only record battery voltage for diagnostic purposes. © 2013–2020 Onset Computer Corporation. All rights reserved. Onset, HOBO, and HOBOware are 1‐800‐LOGGERS (564‐4377) • 508‐759‐9500 trademarks or registered trademarks of Onset Computer Corporation. All other trademarks are the property www.onsetcomp.com/support/contact of their respective companies. 22934‐B ...
Need help?
Do you have a question about the UX100-023A and is the answer not in the manual?
Questions and answers