Sign In
Upload
Download
Table of Contents
Contents
Add to my manuals
Delete from my manuals
Share
URL of this page:
HTML Link:
Bookmark this page
Add
Manual will be automatically added to "My Manuals"
Print this page
×
Bookmark added
×
Added to my manuals
Manuals
Brands
R&S Manuals
Measuring Instruments
ZVA Series
Getting started
R&S ZVA Series Getting Started
Vector network analyzers
Hide thumbs
1
2
Table Of Contents
3
4
5
6
7
8
9
10
11
12
13
14
15
16
17
18
19
20
21
22
23
24
25
26
27
28
29
30
31
32
33
34
35
36
37
38
39
40
41
42
43
44
45
46
47
48
49
50
51
52
53
54
55
56
57
58
59
60
61
62
63
64
65
66
67
68
69
70
71
72
73
74
75
76
77
78
79
80
81
82
83
84
85
86
87
88
89
90
91
92
93
94
95
96
97
98
99
100
101
102
103
104
105
106
page
of
106
Go
/
106
Contents
Table of Contents
Bookmarks
Table of Contents
Table of Contents
1 Preparing the Analyzer for Use
Front Panel Tour
Display
Setup Keys
Navigation Keys
Data Entry Keys
Front Panel Connectors
Rotary Knob
Standby Key
Additional Hardware Options
Rear Panel Tour
Putting the Analyzer into Operation
Setting up the Analyzer
Unpacking and Checking the Analyzer
Bench Top Operation
EMI Suppression
Operation in a 19" Rack
Connecting the Analyzer to the AC Supply
Power on and off
Standby and Ready State
Replacing Fuses
Starting the Analyzer and Shutting down
Windows Operating System
Connecting External Accessories
Connecting to a LAN
Physical LAN Connection
TCP/IP Configutation
Test Setups with Two LAN Connections
Remote Desktop Connection
Firmware Update
Performing a Reflection Measurement
2 Getting Started
Instrument Setup for Reflection Measurements
Parameter and Sweep Range Selection
Instrument Calibration
Evaluation of Data
Saving and Printing Data
Performing a Transmission Measurement
Basic Tasks
Control Via Front Panel Keys
Data Entry
Scaling Diagrams
3 System Overview
Basic Concepts
Global Resources
Setups
Traces, Channels and Diagram Areas
Data Flow
Screen Elements
Navigation Tools of the Screen
Display Elements in the Diagram Area
Dialogs
Display Formats and Diagram Types
Measured Quantities
S-Parameters
Impedance Parameters
Calibration
Calibration Standards and Calibration Kits
Calibration Types
Automatic Calibration
Offset Parameters
Optional R&S ZVA Extensions
Power Calibration
Time Domain (R&S ZVAB-K2)
Arbitrary Generator and Receiver Frequencies (R&S ZVA-K4)
Arbitrary Gen. and Rec. Frequencies (R&S ZVA-K4)
Mixer Phase Measurement (R&S ZVA-K5)
True Differential Mode (R&S ZVA-K6)
Measurements on Pulsed Signals (R&S ZVA-K7)
Converter Control (R&S ZVA-K8)
Mixer Delay W/O lo Access (R&S ZVA-K9)
Long Distance Mixer Delay (R&S ZVA-K10)
Frequency Converting Noise Figure Measurement (R&S ZVA-K31)
Glossary: Frequently Used Terms
Internal Pulse Generators (R&S ZVA-K27)
Noise Figure Measurement (R&S ZVAB-K30)
Index
Advertisement
Quick Links
1
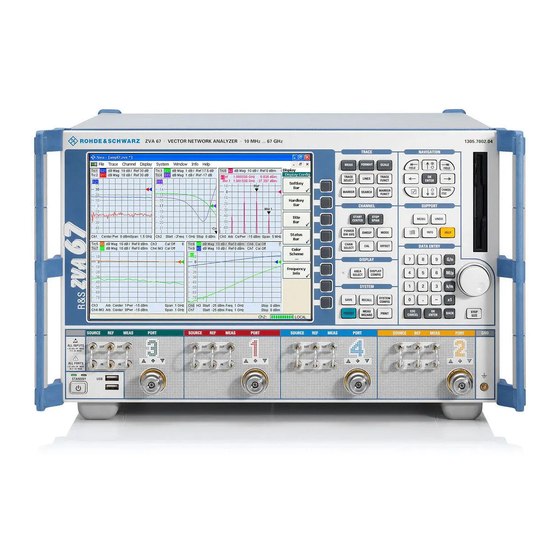
Front Panel Tour
2
S-Parameters
Download this manual
®
R&S
ZVA
Vector Network Analyzers
Getting Started
(;]:èÌ)
1145.1090.62 ─ 13
Table of
Contents
Previous
Page
Next
Page
1
2
3
4
5
Advertisement
Table of Contents
Need help?
Do you have a question about the ZVA Series and is the answer not in the manual?
Ask a question
Questions and answers
Related Manuals for R&S ZVA Series
Measuring Instruments R&S ZVA8 Service Manual
Vector network analyzers (606 pages)
Measuring Instruments R&S ZVA80 Quick Start Manual
Broadband measurements using the 1 mm external test sets (31 pages)
Measuring Instruments R&S ZVA Operating Manual
Vector network analyzer (1185 pages)
Measuring Instruments R&S ZVB Operating Manual
Vector network analyzer (1185 pages)
Measuring Instruments R&S ZVT Operating Manual
Vector network analyzer (1185 pages)
Measuring Instruments R&S ZVA110 Getting Started
Vector network analyzers (106 pages)
Measuring Instruments R&S ZVAX24 Quick Start Manual
Extension unit (30 pages)
Measuring Instruments R&S ZVAX-TRM User Manual
Extension unit (32 pages)
Measuring Instruments R&S ZNL Series Getting Started
Vector network analyzer (100 pages)
Measuring Instruments R&S ZNLE Series Getting Started
Vector network analyzer (81 pages)
Measuring Instruments R&S ZNA26 User Manual
Vector network analyzers (1605 pages)
Measuring Instruments R&S ZNA26 User Manual
Vector network analyzers (1709 pages)
Measuring Instruments R&S ZNC 3 User Manual
(795 pages)
Measuring Instruments R&S ZNH Getting Started
Handheld vector network analyzer (33 pages)
Measuring Instruments R&S ZNH User Manual
Handheld vector network analyzer (369 pages)
Measuring Instruments R&S ZNB Series User Manual
Vector network analyzers (1611 pages)
This manual is also suitable for:
Zva8
Zva24
Zva40
Zva50
Zva67
Zva80
...
Show all
Zva110
Zvb series
Zvb14
Zvb20
Zvb4
Zvb8
Table of Contents
Print
Rename the bookmark
Delete bookmark?
Delete from my manuals?
Login
Sign In
OR
Sign in with Facebook
Sign in with Google
Upload manual
Upload from disk
Upload from URL


Need help?
Do you have a question about the ZVA Series and is the answer not in the manual?
Questions and answers