Table of Contents
Advertisement
Advertisement
Table of Contents

Subscribe to Our Youtube Channel
Related Manuals for Horiba Scientific Quanta-phi F-3029


Summary of Contents for Horiba Scientific Quanta-phi F-3029
- Page 3 Quanta-φ rev. C (23 Apr 2010) Quanta-φ F-3029 Integrating Sphere Operation Manual rev. C http://www.HORIBA.com/scientific...
- Page 4 Quanta-φ rev. C (23 Apr 2010) Copyright © 2003–2010 by HORIBA Jobin Yvon Inc. All rights reserved. No part of this work may be reproduced, stored, in a retrieval sys- tem, or transmitted in any form by any means, including electronic or mechanical, pho- tocopying and recording, without prior written permission from HORIBA Jobin Yvon Inc.
-
Page 5: Table Of Contents
Quanta-φ rev. C (23 Apr 2010) Table of Contents 0: Introduction ....................0-1 About the Quanta-φ integrating sphere ....................0-1 Disclaimer ............................... 0-2 Safety summary ............................0-4 Risks of ultraviolet exposure ........................0-5 Additional risks of xenon lamps ......................0-7 1: Theory of Operation .................. - Page 6 Quanta-φ rev. C (23 Apr 2010)
-
Page 7: 0: Introduction
Quanta-φ rev. C (23 Apr 2010) Introduction 0 : Introduction About the Quanta-φ integrating sphere This manual explains the theoretical and practical issues of operating and maintaining ® the Quanta- integrating sphere. The Quanta- is used with the Fluorolog -3, Fluoro- ®... -
Page 8: Disclaimer
Quanta-φ rev. C (23 Apr 2010) Introduction Disclaimer By setting up or starting to use any HORIBA Jobin Yvon product, you are accepting the following terms: You are responsible for understanding the information contained in this document. You should not rely on this information as absolute or all-encompassing; there may be local issues (in your environment) not addressed in this document that you may need to ad- dress, and there may be issues or procedures discussed that may not apply to your situa- tion. - Page 9 Quanta-φ rev. C (23 Apr 2010) Introduction ble for any special, incidental, indirect or consequential damages of any kind, or any damages whatsoever resulting from loss of use, loss of data, or loss of profits, arising out of or in connection with our products or the use or possession thereof. HORIBA Jo- bin Yvon is also in no event liable for damages on any theory of liability arising out of, or in connection with, the use or performance of our hardware or software, regardless of whether you have been advised of the possibility of damage.
-
Page 10: Safety Summary
Quanta-φ rev. C (23 Apr 2010) Introduction Safety summary The following general safety precautions must be observed during all phases of opera- tion of this instrument. Failure to comply with these precautions or with specific warn- ings elsewhere in this manual violates safety standards of design, manufacture and in- tended use of instrument. -
Page 11: Risks Of Ultraviolet Exposure
Quanta-φ rev. C (23 Apr 2010) Introduction Risks of ultraviolet exposure Caution: This instrument is used in conjunction with ultra- violet light. Exposure to these radiations, even reflected or diffused, can result in serious, and sometimes irre- versible, eye and skin injuries. Overexposure to ultraviolet rays threatens human health by causing: ... - Page 12 Quanta-φ rev. C (23 Apr 2010) Introduction duced. This should not lessen the concern over lens damage however, because cata- racts are the direct result of lens damage. Burns to the eyes are usually more painful and serious than a burn to the skin. Make sure your eye protection is appropriate for this work.
-
Page 13: Additional Risks Of Xenon Lamps
Quanta-φ rev. C (23 Apr 2010) Introduction Additional risks of xenon lamps Warning: Xenon lamps are dangerous. Please read the following pre- Among the dangers associated with xenon lamps cautions. are: Burns caused by contact with a hot xenon lamp. ... - Page 14 Quanta-φ rev. C (23 Apr 2010) Introduction The skin and eyes absorb infrared radiation (IR) as heat. Workers normally notice ex- cessive exposure through heat sensation and pain. Infrared radiation in the IR-A that enters the human eye will reach (and can be focused upon) the sensitive cells of the re- tina.
-
Page 15: 1: Theory Of Operation
Quanta-φ rev. C (23 Apr 2010) Theory of Operation 1 : Theory of Operation Introduction An ideal integrating sphere is designed to integrate light for collection over all emission angles from the sample. No integrating sphere is ideal, and so there are various approx- imations required. -
Page 16: Time Decay Of Signal
Coating of an integrating sphere The interior reflective coating of an integrating sphere affects its overall performance. The interior of the HORIBA Scientific integrating sphere is made from a proprietary ® material known as Spectralon , which has a very wide, flat reflectance of over 95% from 250 nm to 2.5 μm (see graph below). -
Page 17: Photoluminescence Quantum Yield
Quanta-φ rev. C (23 Apr 2010) Theory of Operation Photoluminescence quantum yield An important use of the integrating sphere in conjunction with your spectrofluorometer is the determination of a sample’s photoluminescence quantum yield. The photolumi- nescence quantum yield for a particular molecular species is determined by the first- order rate processes that compete for the excitation energy. - Page 18 Quanta-φ rev. C (23 Apr 2010) Theory of Operation where L is the integrated excitation profile when the sample is diffusely illuminated by the integrating sphere’s surface; and L is the integrated excitation profile when the sample is directly excited by the incident beam. The quantum yield, υ, is, by definition, photons emitted to photons absorbed: ...
- Page 19 Quanta-φ rev. C (23 Apr 2010) Theory of Operation 2.27954 10 1.9856 10 (10) Next, the sample and blank’s fluorescence spectral region intensities were measured us- ing a 4-second integration time under otherwise the same instrument conditions as the and L .
- Page 20 Quanta-φ rev. C (23 Apr 2010) Theory of Operation Because the integration time constant used to collect E and E was 8 times longer than for L and L , we need to divide the difference between E and E by 8 to calculate the quantum yield, υ, below using the four parameters E , and L...
- Page 21 HORIBA Scientific recommends the following practical considerations to avoid self- absorption: Adjust the sample concentration so that, when plotting absorption (A) or optical density (OD) against concentration, a linear plot appears.
- Page 22 Quanta-φ rev. C (23 Apr 2010) Theory of Operation will be directly related to the measured values. For samples with high quantum yields (like rhodamine 101), however, or with large Stokes shifts between excita- tion and emission spectra (like quinine sulfate), re-absorbance effects are signifi- cantly smaller.
- Page 23 Similar to the fluorescein data above, self-absorption is also a problem with many solid samples and powders whose ODs cannot easily be determined. As with liquid samples, in solid and powder samples, when possible, HORIBA Scientific advises you to vary...
- Page 24 Quanta-φ rev. C (23 Apr 2010) Theory of Operation the main chromophore’s concentration systematically to evaluate the self-absorbance properties of the emission. In powder samples, for instance, pulverize and homogenize the chromophoric sample with a non-luminescent powder such as barium sulfate, in or- der to dilute the solid.
-
Page 25: Calculation And Evaluation Of Chromaticity
Quanta-φ rev. C (23 Apr 2010) Theory of Operation Calculation and evaluation of chromaticity Theory The Quanta-φ software automatically calculates and presents the numerical Green and graphical coordinate information apex – E for the spectral region (E ) deal- ing with the chromaticity observable indices CIE 1931 and CIE 1976. - Page 26 Quanta-φ rev. C (23 Apr 2010) Theory of Operation The resultant sample power spectrum is then used to calculate three sum-product values, namely, CIE_TX, CIE_TY and CIE_TZ, from the observable intensity spec- tra xBar, yBar and zBar, respectively. For the CIE 1931 index, the following two coordinates are calculated, The coordinates x and y are plotted graphically inside the CIE 1931 boundary area, which is defined numerically for the x coordinate at each wavelength value, λ, ...
- Page 27 Quanta-φ rev. C (23 Apr 2010) Theory of Operation The corresponding u′BA and v′BA values are plotted against each other to generate λ λ the closed, semielliptical two-dimensional area-boundary plot for CIE 1976 (blue, right) as shown in the sample plot for rhodamine 101 in anhydrous ethanol in the screenshot below.
-
Page 28: Flowchart Of Method For Data-Acquisition
Quanta-φ rev. C (23 Apr 2010) Theory of Operation Flowchart of method for data-acquisition 1-14... -
Page 29: Additional References
Quanta-φ rev. C (23 Apr 2010) Theory of Operation Additional references: ―An improved experimental determination of external photoluminescence quantum ef- ficiency‖, J.C. deMello, H.F. Wittmann, and R.H. Friend, Adv. Mater. 9, 230 (1997). ―Measurement of Solid-State Photoluminescence Quantum Yields of Films using a Fluorimeter‖, L.-O. - Page 30 Quanta-φ rev. C (23 Apr 2010) Theory of Operation 1-16...
-
Page 31: 2: Requirements & Unpacking
Quanta-φ rev. C (23 Apr 2010) Requirements & Unpacking 2 : Requirements & Unpacking Environmental requirements • Temperature 59–86°F (15–30°C) • Maximum temperature fluctuation ± 2°C • Ambient relative humidity < 75% • Low dust levels • No special ventilation Software requirements •... -
Page 32: Unpacking
For this reason, the original packing material should be retained as evidence of alleged mishandling or abuse. While HORIBA Scientific assumes no responsi- bility for damage occurring during transit, the company will make every effort to aid and advise. - Page 33 Carefully lift the integrating sphere from the car- ton, and rest it on the laboratory bench. Inspect for previously hidden damage. Notify the carrier and HORIBA Scientific if any is found. Check the packing list to verify that all compo- nents are present.
- Page 34 Quanta-φ rev. C (23 Apr 2010) Requirements & Unpacking...
-
Page 35: 3: Installation & Use
Quanta-φ rev. C (23 Apr 2010) Installation & Use 3 : Installation & Use Caution: Do not touch the surfaces of the Inte- grating Sphere’s sample-holder. This can de- grade its highly reflective surface. Wear clean protective gloves when handling the interior of the sphere. - Page 36 Quanta-φ rev. C (23 Apr 2010) Installation & Use Sample tray for solid samples. For liquid samples once the absorbance and excitation and emission properties are unders- tood, follow this procedure: Place the appropriate blank solvent in a firmly stoppered quartz cuvette with 12 mm ×...
- Page 37 Quanta-φ rev. C (23 Apr 2010) Installation & Use Lower the liquid sample-holder into the sphere gently. Pins in holder. Holes in top of sphere. As you seat the holder Purge ports in the sphere, align the holes around the sam- ple-holder port with the pins on the sam- IN points toward...
- Page 38 For solid samples, follow this procedure. Note: Only films with a maximum diameter of 12 mm can be mounted in the sample holder. For other sizes or shapes, con- tact HORIBA Scientific. Pull sample-drawer handle out.
- Page 39 Quanta-φ rev. C (23 Apr 2010) Installation & Use Pull solid-sample support itself out. With the Spectra- ® sample holder located safely outside and away from the sample- compartment drawer, add the solid sample into the sample cup. Drop the coverslip on top of the sample. To avoid possible contamination, be certain all traces of the sample material are removed from the outside of the...
- Page 40 Quanta-φ rev. C (23 Apr 2010) Installation & Use Place the solid- sample cover on the integrating sphere. Threaded screw Note: Match the threaded thumbscrew on the lid to the threaded hole on the sphere. Threaded hole Tighten the thumbscrew to fix the lid in place.
- Page 41 Quanta-φ rev. C (23 Apr 2010) Installation & Use Remove the protective cap from the exci- tation port. Connect a fiber-optic bundle to the integrating sphere emission port. Tighten the set-screw with an Allen key. Remove the protective cap from the emission port.
- Page 42 Quanta-φ rev. C (23 Apr 2010) Installation & Use Set up the F-3000 Fiber-Optic Adapter drawer. Note: Follow detailed instructions in the Fiber-Optic Adapter manual for insertion and alignment of the fiber-optic bundles. Remove the standard sample drawer from the instrument’s sample compartment.
- Page 43 Quanta-φ rev. C (23 Apr 2010) Installation & Use Tighten the screws to fix the drawer so- lidly to the sample compartment. The sample-compartment drawer should look like this when installed: Start FluorEssence™.
-
Page 44: Continue Here If Your Detector Is A Ccd
Quanta-φ rev. C (23 Apr 2010) Installation & Use Continue here if your detector is a CCD. Adjust the Rayleigh excitation peak for the blank (solvent or solid) to the desired count rate (sug- gested value ≈ 10 counts/s). Note: See the section later in this chapter if using a photomul- tiplier tube as the detector. - Page 45 Quanta-φ rev. C (23 Apr 2010) Installation & Use Set the excitation wavelength. In this example, for rhodamine 101 in ethanol, we Park the excitation monochromator at 545 nm, with a bandpass of 1 nm. Set the emission wavelength range to include both excitation light and the likely or expected range of sample luminescence.
- Page 46 Quanta-φ rev. C (23 Apr 2010) Installation & Use Enable the emission detector, the Correction checkbox, and the Dark Offset checkbox. Set the Integration Time to 0.1 s. Add >> the corrected signal (with c subscript) to the Formulas table. Give this file a Data Identifier.
- Page 47 Quanta-φ rev. C (23 Apr 2010) Installation & Use Click the OK button if this message appears. When the scan is finished, the Project Name window appears. Give the project a name, and click the OK button. The data appear in graphical format: Maximize the Rayleigh peak without saturating Double-click in the graph to open it.
- Page 48 Quanta-φ rev. C (23 Apr 2010) Installation & Use Here we have around 47 000 counts, which is close to ideal. Run the experiment. In our case, we will increase the Integration Time and Accumulations so that we have enough signal (~10 counts/s) for analysis.
- Page 49 Quanta-φ rev. C (23 Apr 2010) Installation & Use Change Accumulations to 20 Summed Scans, and Integration Time to 0.1 s. Click the Run button. The Intermediate Display appears. A Warning window may appear that the wavelength range includes val- ues outside of the correction-factor file’s range.
- Page 50 Quanta-φ rev. C (23 Apr 2010) Installation & Use Carefully remove the blank from the Integrating Sphere. Run the scan on the sample. Insert the sample cuvette into the liquid-sample holder, and replace the liquid-sample holder into the integrating sphere. (Or place the sample in the solid-sample holder, and insert the drawer into the sphere.) Click the Previous Experiment button to redo the scan:...
- Page 51 Quanta-φ rev. C (23 Apr 2010) Installation & Use Change the Data Identifier field to acknowledge that the sample is now in the sphere. Click the Run button to rerun Note: The blank’s Rayleigh peak will the scan with always be larger than the sample’s exactly the Rayleigh peak, because the sample same parame-...
- Page 52 Quanta-φ rev. C (23 Apr 2010) Installation & Use Rayleigh peak Luminescence Set up the analysis of the data. There are two methods of analyzing the data: 2-curve analysis and 4-curve analysis. In the 2-curve analysis, the Rayleigh line and luminescence band are included together in the sample’s and blank’s data.
- Page 53 Quanta-φ rev. C (23 Apr 2010) Installation & Use Select the correct sphere-correction file, and click the Open but- ton. The sphere- correction file name appears in the Sphere Cor- rection field: To run a 2-curve analysis, see the method below: Browse with the Browse button for the combined sample data file.
- Page 54 Quanta-φ rev. C (23 Apr 2010) Installation & Use Likewise, browse with the Browse button for the combined blank data file. Enter the Start Excitation, End Excitation, Start Emission, and End Emission values to find the correct Rayleigh-line range (yellow area in the preview) and luminescence range (blue area in the preview): Zoom in to view the Rayleigh scattering (yellow area) and luminescence (blue area), in order to refine the wavelength ranges.
- Page 55 Quanta-φ rev. C (23 Apr 2010) Installation & Use To run a 4-curve analysis, see the method below: Follow the 2-curve analysis, except choose the four different datasets (sample Ray- leigh, blank Rayleigh, sample emission, and blank emission), and enter them into the HJY_PLQY window’s fields, as shown below: In all cases continue here.
- Page 56 Quanta-φ rev. C (23 Apr 2010) Installation & Use Choose Save As..The Theme Save as... window ap- pears. Enter a Theme Name, and click the OK button. 3-22...
- Page 57 Quanta-φ rev. C (23 Apr 2010) Installation & Use When you have selected the desired ranges, click the OK button. Results appear in the spreadsheet. In the 4-curve method, for the sample and blank luminescence, we in- creased the integration time from 0.1 s to 1 s (a factor of 10), to account for weak emission in comparison to the strong Rayleigh scattering.
- Page 58 Quanta-φ rev. C (23 Apr 2010) Installation & Use To change the wavelength range for calculations, enter new values in the Start Wavelength and End Wavelength cells. The software automatically recalcu- lates values and replots. You can view the integrated areas L and L .
-
Page 59: Using A Photomultiplier Tube As The Detector
Quanta-φ rev. C (23 Apr 2010) Installation & Use Using a photomultiplier tube as the detec- Instead of a CCD detector, a photomultiplier tube (PMT) may be used as the detector. Data-acquisition is slightly different in this case. For a 2-curve analysis: Place the blank into the integrating sphere, and properly close the sphere. - Page 60 Quanta-φ rev. C (23 Apr 2010) Installation & Use Park the excitation monochromator, and set the Slit bandpass to 2.5 nm. Set the emission monochromator Start, End, and Inc, plus set the Slit bandpass to encompass the Rayleigh and luminescence regions. Click the Detectors icon to set the detector parameters: Enable the PMT detector checkbox (here it is T1) Set units to cps.
- Page 61 Quanta-φ rev. C (23 Apr 2010) Installation & Use Analyze the scan for the counts in the Rayleigh peak. If the peak is ~10 counts, this is acceptable. Rerun the scan if the peak is not ~10 counts. Click the Previous Experiment button Click the Detectors icon to see the detectors page.
- Page 62 Quanta-φ rev. C (23 Apr 2010) Installation & Use In the toolbar, click the Previous Experiment button to rerun the scan with the same pa- rameters. In the Experiment Setup window, change the Da- ta Identifier field to indicate a sample scan: Click the Run button to start the scan.
- Page 63 Quanta-φ rev. C (23 Apr 2010) Installation & Use Continue with the previous section, to set up and run the quantum-yield calculations. For a 4-curve analysis, Follow the 2-curve analysis method, but you may only adjust neutral-density attenua- tion and integration time to bring peak signals into the correct range. You may scan on- ly the luminescence region to obtain a higher signal-to-noise ratio.
- Page 64 Integrating Sphere v. 1.2 (3 Jul 2008) Index 3-30...
-
Page 65: 4: Maintenance
Caution: ® Never use Freon or any other organic solvent ® to clean the Spectralon surfaces. Always read the Ma- terial Safety Data Sheets before using dry nitrogen or other pressurized gases. Heavy soil Contact HORIBA Scientific for advice. - Page 66 Quanta-φ rev. C (23 Apr 2010) Maintenance...
-
Page 67: 5: Generating Correction Files
The CD-ROM’s number must match the number on the Integrat- ing Sphere for the calibration to be valid. If the numbers do not match, contact HORIBA Scientific. Below are HORIBA sphere-correction ranges created in the factory for common detec- tor-grating combinations:... -
Page 68: Flowchart For Generating Quanta-Φ Correction-Factor Files
Quanta-φ rev. C (23 Apr 2010) Troubleshooting Flowchart for generating Quanta-φ correc- tion-factor files Step 1. Calibrate both Excitation and Emission Monochromators Step 2. Place Calibrated Reflector in Sample Compartment at 45º between excitation and emission using F-1933 Solid Sample Holder Step 3. -
Page 69: Method For Generating Quanta-Φ Correction-Factor Files
Quanta-φ rev. C (23 Apr 2010) Troubleshooting Methods for generating Quanta-φ correc- tion-factor files Generating correction-factor files for the cuvette holder: Scan the reflectance spec- trum in the sample com- partment. On the standard sample- compartment drawer, attach the single-cell sample-holder. Place the uncalibrated reflector into the single-cell holder. - Page 70 Quanta-φ rev. C (23 Apr 2010) Troubleshooting Place standard sample- compartment drawer into the sample compartment. Attach the four screws to hold the drawer to the sample compartment. Place the sample-compartment cover onto the sample compartment. In FluorEssence™, choose an emission experiment, and click the Monos icon.
- Page 71 Quanta-φ rev. C (23 Apr 2010) Troubleshooting Click the Detectors icon. Choose the corrected detector signal (c subscript) and apply all instrument corrections (activate Dark Offset and Correction checkboxes). Use counts per seconds (cps) units to adjust the peak intensity to be below the saturating limit (< 10 cps).
- Page 72 Quanta-φ rev. C (23 Apr 2010) Troubleshooting Insert the uncalibrated reflector into the cuvette sample-holder. Be sure the square top and bottom of the reflector are seated properly into the square depressions in the sample holder. Caution: Do not touch the surfaces of the Integrating Sphere’s sample-holder or the reflector accessory.
- Page 73 Quanta-φ rev. C (23 Apr 2010) Troubleshooting Note: Note: A neutral-density The signal will filter affects the correc- be decreased by in- tion file for the sphere clusion of the sphere AND sample compart- and optics by 1–2 or- ment. ders of magnitude.
- Page 74 Quanta-φ rev. C (23 Apr 2010) Troubleshooting Remove the calibrated reflector from the cuvette holder. Calculate the sphere correction- factor from the ratio of the reflec- tance in the sphere to the sample compartment alone. In the toolbar, choose Analysis. A drop-down menu appears.
- Page 75 Quanta-φ rev. C (23 Apr 2010) Troubleshooting In the Sample field, browse for the sample data (the last data collected) using the Browse button Click the OK button when found. Similarly, find the sphere data using the Browse button in the Sphere field:...
- Page 76 Quanta-φ rev. C (23 Apr 2010) Troubleshooting Browse for the MCorrect file name using the Browse button The completed HJY_Sphere_Correction window looks something like this: 5-10...
- Page 77 Quanta-φ rev. C (23 Apr 2010) Troubleshooting Click the OK button when ready. The ASCIIEXP window opens: Enter a name for the final ratio file in the File name field, and click the Save button. The Import and Export window appears: Click the OK button.
- Page 78 Quanta-φ rev. C (23 Apr 2010) Troubleshooting Generating correction-factor files for the powder/film holder: Scan the reflectance spectrum in the sample compartment. Insert the powder reflector disk into the 1933 Solid-Sample Holder. Place the Sample-Holder on the sample drawer. Keep a 45°-angle between exci- tation and emission slits.
- Page 79 Quanta-φ rev. C (23 Apr 2010) Troubleshooting Place the sample-compartment cover onto the sample compartment. In FluorEssence™, choose an emission experiment, and click the Monos icon. Set the excitation monochromator to 0 nm (zero order) for white- light transmission, the emission scanning range to match the corrected region (see table on p.
- Page 80 Quanta-φ rev. C (23 Apr 2010) Troubleshooting Choose the corrected detector signal (c subscript) and apply all instrument corrections (activate Dark Offset and Correction checkboxes). Use counts per seconds (cps) units to adjust the peak intensity to be below the saturating limit (< 10 cps).
- Page 81 Quanta-φ rev. C (23 Apr 2010) Troubleshooting Pull solid-sample support itself out. Insert the uncalibrated powder reflector into the support. Slide sample holder back in. Push sample drawer in, so that the sample is raised into the integrating sphere. 5-15...
- Page 82 Quanta-φ rev. C (23 Apr 2010) Troubleshooting Place the solid- sample cover on the integrating sphere. Threaded screw Note: Match the threaded thumbscrew on the lid to the threaded hole on the sphere. Threaded hole Tighten the thumbscrew to fix the lid in place. Raise the excitation port to the IN position.
- Page 83 Quanta-φ rev. C (23 Apr 2010) Troubleshooting Remove the protective cap from the emission port. Connect a fiber-optic bundle to the integrating sphere emission (outward arrow) port. Tighten the set-screw with an Allen key. Calculate the sphere correction-factor from the ratio of the reflectance in the sphere to the sam- ple compartment alone.
-
Page 85: Troubleshooting
Quanta-φ rev. C (23 Apr 2010) Troubleshooting 6 : Troubleshooting The Quanta-φ accessory has been designed to operate reliably and predictably. Should a problem occur, examine the chart below. Symptom Possible Problem Proposed Solution(s) Light leak in or around integrating Verify that the bottom sample Spikes in emission drawer’s plug has lifted into the... - Page 86 Quanta-φ rev. C (23 Apr 2010) Troubleshooting Insufficient integration time Increase integration time. Quantum yield is un- Area-balance factor is not properly Correctly enter area-balance factor reasonably large or adjusted to account for changes in to account for combined (integra- integration time or neutral-density tion time ×...
- Page 87 Quanta-φ rev. C (23 Apr 2010) Troubleshooting Possible contamination of inner Internal contamination voids the sphere sphere warranty. The sphere inte- rior may need to be replaced be- ® cause the porous Spectralon very difficult to decontaminate. Excessive count rate (CPS) or inte- CCD count-rate for the blank exci- CCD signal >...
-
Page 88: Further Assistance
Quanta-φ rev. C (23 Apr 2010) Troubleshooting Further assistance... Read all software and accessory manuals before contacting the Service Department. Of- ten the manuals show the problem’s cause and a method of solution. Technical support is available for both hardware and software troubleshooting. Before contacting the ser- vice department, however, complete the following steps. - Page 89 Quanta-φ rev. C (23 Apr 2010) Troubleshooting The version of the software (both FluorEssence™ and Origin ® ) is listed here. Click the View Sys- tem Info button. The Installed Components window appears, displaying all the software required for FluorEssence™. Record the informa- tion by clicking the: •...
- Page 90 Quanta-φ rev. C (23 Apr 2010) Troubleshooting Open the Experiment Setup window: Click the Detectors icon Move the mouse over the detectors’ table in the Select area. The SpectrAcq firmware version appears in a small pop-up window. If the problem persists or is unlisted, call the Service Department at (732) 494-8660 × 160, or fax at (732) 549-5125.
-
Page 91: 7: Technical Specifications
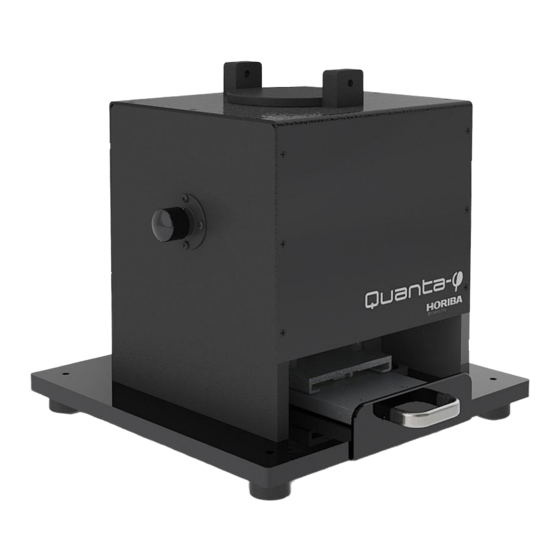
Quanta-φ rev. C (23 Apr 2010) Technical Specifications 7 : Technical Specifications Hardware Dimensions (including 10″ × 13″ × 12¼″ (width × length × height) mounting platform for sam- 25 cm × 33 cm × 31.1 cm (width × length × height) ple drawer) Weight 7.47 lbs. -
Page 92: Software
Quanta-φ rev. C (23 Apr 2010) Technical Specifications Transmission curve of fiber- optic bundles Software FluorEssence™ version 3.5 or higher with valid USB key ® Excel 2000 or later software... -
Page 93: 8: Index
Quanta-φ rev. C (23 Apr 2010) Index 8: Index Browse button ....3-18–20, 5-9, 5-10 Key to the entries: Times New Roman font ..subject or keyword Arial font ........ command, c subscript....... 3-12, 5-5, 5-14 menu choice, calibrated reflector ...... 4-1, 5-1, 5-8 or data-entry Cancel button ........... - Page 94 Quanta-φ rev. C (23 Apr 2010) Index diffuse surface ..........1-1 FM4-3000 ..........2-2 dimensions ..........7-1 Formulas list .......... 3-26 Formulas table........3-12 Förster resonance energy transfer ....1-3 FRET ............1-3 ............1-4, 1-6 ............1-4, 1-6 Emission 2 (T1) checkbox ..... 3-25 emission port ......
- Page 95 Quanta-φ rev. C (23 Apr 2010) Index Previous Experiment button .. 3-14, 3-16, 3- lamp scan ........... 6-4 ............1-4, 1-6 27–28 Print Info button ........6-5 light leak ............ 6-1 Project Name window ..3-13, 3-26–27, 5-7 liquid sample-holder ...... 2-2, 3-2–3 protective gloves........
- Page 96 Quanta-φ rev. C (23 Apr 2010) Index single-cell sample-holder ......5-3 toolkit............2-2 Slit ..........3-13, 3-26 transmittance ........... 3-29 software requirements ........ 2-1 troubleshooting .......... 6-1 Spectra button ........3-10 T-side ..........3-25, 5-3 SpectrAcq firmware version ....6-5–6 ®...
- Page 97 3880 Park Avenue, Edison, New Jersey 08820-3012, USA [Design Concept] The HORIBA Group application images are collaged in the overall design. Beginning from a nano size element, the scale of the story develops all the way to the Earth with a gentle flow of the water.
Need help?
Do you have a question about the Quanta-phi F-3029 and is the answer not in the manual?
Questions and answers