Rohde & Schwarz RTE1022 User Manual
Digital, rte series
Hide thumbs
Also See for RTE1022:
- User manual (2078 pages) ,
- Getting started (123 pages) ,
- Getting started (112 pages)
Table of Contents
Advertisement
Quick Links
Advertisement
Chapters
Table of Contents

Related Manuals for Rohde & Schwarz RTE1022


Summary of Contents for Rohde & Schwarz RTE1022
- Page 1 ® R&S Digital Oscilloscope User Manual (=J:P2) 1326.1032.02 ─ 11...
- Page 2 ® This manual describes the following R&S RTE models with firmware version 3.65: ● ® R&S RTE1022: 200 MHz, 2 channels (1326.2000K22 and 1317.2500K22) ● ® R&S RTE1024: 200 MHz, 4 channels (1326.2000K24 and 1317.2500K24) ● ® R&S RTE1032: 350 MHz, 2 channels (1326.2000K32 and 1317.2500K32) ●...
- Page 3 Basic Safety Instructions Always read through and comply with the following safety instructions! All plants and locations of the Rohde & Schwarz group of companies make every effort to keep the safety standards of our products up to date and to offer our customers the highest possible degree of safety. Our products and the auxiliary equipment they require are designed, built and tested in accordance with the safety standards that apply in each case.
- Page 4 Basic Safety Instructions Symbol Meaning Symbol Meaning Caution ! Hot surface Alternating current (AC) Protective conductor terminal Direct/alternating current (DC/AC) To identify any terminal which is intended for connection to an external conductor for protection against electric shock in case of a fault, or the terminal of a protective earth Earth (Ground) Class II Equipment...
- Page 5 Basic Safety Instructions Operating states and operating positions The product may be operated only under the operating conditions and in the positions specified by the manufacturer, without the product's ventilation being obstructed. If the manufacturer's specifications are not observed, this can result in electric shock, fire and/or serious personal injury or death. Applicable local or national safety regulations and rules for the prevention of accidents must be observed in all work performed.
- Page 6 Basic Safety Instructions 6. The product may be operated only from TN/TT supply networks fuse-protected with max. 16 A (higher fuse only after consulting with the Rohde & Schwarz group of companies). 7. Do not insert the plug into sockets that are dusty or dirty. Insert the plug firmly and all the way into the socket provided for this purpose.
- Page 7 Basic Safety Instructions 2. Before you move or transport the product, read and observe the section titled "Transport". 3. As with all industrially manufactured goods, the use of substances that induce an allergic reaction (allergens) such as nickel cannot be generally excluded. If you develop an allergic reaction (such as a skin rash, frequent sneezing, red eyes or respiratory difficulties) when using a Rohde &...
- Page 8 Basic Safety Instructions 2. Adjustments, replacement of parts, maintenance and repair may be performed only by electrical experts authorized by Rohde & Schwarz. Only original parts may be used for replacing parts relevant to safety (e.g. power switches, power transformers, fuses). A safety test must always be performed after parts relevant to safety have been replaced (visual inspection, protective conductor test, insulation resistance measurement, leakage current measurement, functional test).
- Page 9 Instrucciones de seguridad elementales 3. If you use the product in a vehicle, it is the sole responsibility of the driver to drive the vehicle safely and properly. The manufacturer assumes no responsibility for accidents or collisions. Never use the product in a moving vehicle if doing so could distract the driver of the vehicle.
- Page 10 Customer Support Technical support – where and when you need it For quick, expert help with any Rohde & Schwarz equipment, contact one of our Customer Support Centers. A team of highly qualified engineers provides telephone support and will work with you to find a solution to your query on any aspect of the operation, programming or applications of Rohde &...
-
Page 11: Table Of Contents
® Contents R&S Contents 1 Preface....................9 Key Features........................9 Documentation Overview................... 10 Options Described in this Document................ 11 Conventions Used in the Documentation..............12 2 Getting Started..................13 Preparing for Use......................13 Instrument Tour......................20 Trying Out the Instrument..................34 Operating the Instrument................... 65 3 Instrument Setup..................92 System Setup...................... - Page 12 ® Contents R&S Trigger Types......................193 Holdoff........................219 Noise Reject.......................220 Control / Action......................221 Sequence........................225 Extern......................... 226 Acquisition Info......................228 6 Waveform Analysis................229 Zoom.......................... 229 Reference Waveforms....................241 Mathematics......................246 History........................260 XY-diagram........................ 266 7 Measurements..................270 Cursor measurements....................270 Automatic Measurements..................
- Page 13 ® Contents R&S 11.1 Instrument Settings....................403 11.2 Waveforms and Results................... 410 11.3 Screenshots.......................429 11.4 Reports........................435 11.5 Autonaming....................... 437 11.6 File Selection Dialog....................439 12 Protocol Analysis................441 12.1 Basics of Protocol Analysis..................441 12.2 I²C (Option R&S RTE-K1)..................449 12.3 SPI Bus (Option R&S RTE-K1)................. 467 12.4 UART / RS232 (Option R&S RTE-K2)...............480 12.5...
- Page 14 ® Contents R&S 13.7 Dynamic On Resistance................... 823 13.8 Slew Rate........................826 13.9 Safe Operating Area (S.O.A.)................... 830 13.10 Turn On/ Off....................... 835 13.11 Switching Loss......................839 13.12 Power Efficiency....................... 844 13.13 Output Ripple......................847 13.14 Transient Response ....................853 13.15 Output Spectrum.......................857 14 Mixed Signal Option (MSO, R&S RTE-B1)........
- Page 15 ® Contents R&S 17.1 Conventions used in Remote Command Description........... 936 17.2 Finding the Appropriate Command.................937 17.3 Programming Examples................... 938 17.4 Frequently Used Parameters and Suffixes............. 951 17.5 Common Commands....................956 17.6 General Remote Settings..................961 17.7 Instrument Setup.......................964 17.8 Acquisition and Setup....................
- Page 16 ® Contents R&S A Menu Overview.................1766 File Menu........................1766 Horizontal Menu...................... 1767 Trigger Menu......................1767 Vertical Menu......................1767 Math Menu....................... 1768 Cursor Menu......................1768 Meas Menu.......................1769 Masks Menu......................1769 Search Menu......................1769 A.10 Analysis Menu......................1770 A.11 Display Menu......................1770 A.12 Tutorials Menu......................1771 B Remote Control - Basics..............1772 Messages ........................
-
Page 17: Preface
® Preface R&S Key Features 1 Preface 1.1 Key Features The R&S RTE Digital Oscilloscope provides fast signal acquisition and analysis. Out- standing key features are: ● 1 million waveforms per second waveform acquisition rate ● Bandwidth up to 2 GHz ●... -
Page 18: Documentation Overview
® Preface R&S Documentation Overview 1.2 Documentation Overview This section provides an overview of the R&S RTE user documentation. You find the documentation on the product website at: www.rohde-schwarz.com/manual/rte Getting started manual Introduces the R&S RTE and describes how to set up and start working with the instru- ment, and describes basic operations. -
Page 19: Options Described In This Document
® Preface R&S Options Described in this Document Release notes and open source acknowledgment The release notes list new features, improvements and known issues of the current firmware version, and describe the firmware installation. The open source acknowledg- ment document provides verbatim license texts of the used open source software. See www.rohde-schwarz.com/firmware/rte. -
Page 20: Conventions Used In The Documentation
® Preface R&S Conventions Used in the Documentation Type Designation Order No. for Order No. for 1326.2000.xx 1317.2500.xx instruments instruments ® USB 1.0/1.1/2.0/HSIC serial triggering and 1326.1626.02 1326.1610.02 R&S RTE-K60 decoding ® USB-PD serial triggering and decoding 1326.3158.02 1326.3141.02 R&S RTE-K63 ®... -
Page 21: Getting Started
® Getting Started R&S Preparing for Use 2 Getting Started Note: the following chapters are identical to those in the R&S RTE Getting Started manual. ● Preparing for Use....................13 ● Instrument Tour.......................20 ● Trying Out the Instrument..................34 ● Operating the Instrument.................. - Page 22 ® Getting Started R&S Preparing for Use Packing material Retain the original packing material. If the instrument needs to be transported or ship- ped later, you can use the material to protect the control elements and connectors. 2.1.2 Positioning the Instrument The instrument is designed for use under laboratory conditions.
- Page 23 ® Getting Started R&S Preparing for Use Risk of injury if feet are folded out The feet can fold in if they are not folded out completely or if the instrument is shifted. This can cause damage or injury. ● Fold the feet completely in or out to ensure stability of the instrument.
- Page 24 ® Getting Started R&S Preparing for Use 2.1.3 Starting the Instrument Risk of injury and instrument damage The instrument must be used in an appropriate manner to prevent electric shock, fire, personal injury, or damage. ● Do not open the instrument casing. ●...
- Page 25 ® Getting Started R&S Preparing for Use 2. Connect the power cable to the socket outlet. 3. Switch the main power switch at the rear of the instrument to position I. The power key on the front panel lights up. When you power up the instrument, be sure to comply with the warm-up phase speci- fied in the data sheet before you start measurements.
- Page 26 ® Getting Started R&S Preparing for Use Risk of losing data If you switch off the running instrument using the rear panel switch or by disconnecting the power cord, the instrument loses its current settings. Furthermore, program data can be lost. Press the POWER key first to shut down the application properly.
- Page 27 ® Getting Started R&S Preparing for Use When a USB device is disconnected from the R&S RTE, Windows immediately detects the change in hardware configuration and deactivates the corresponding driver. The properties of external USB devices are configured in the operating system, not in the R&S RTE software.
-
Page 28: Instrument Tour
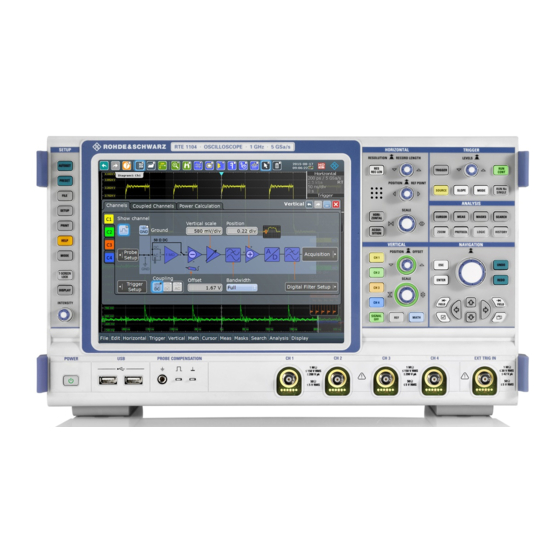
® Getting Started R&S Instrument Tour After connecting an additional monitor or projector to the instrument, configure it for usage. The relevant settings are Windows settings but you can configure the displays directly in the instrument setup. 1. Check the input type of the monitor or projector. Make sure to select the correct cable. - Page 29 ® Getting Started R&S Instrument Tour Figure 2-1: Front panel of R&S RTE1104 with 4 input channels 1 = Touchscreen 2 = SETUP controls 3 = HORIZONTAL controls 4 = TRIGGER controls 5 = ANALYSIS controls 6 = VERTICAL controls 7 = NAVIGATION controls 8 = POWER key 9 = USB 2.0 connectors...
- Page 30 ® Getting Started R&S Instrument Tour 2.2.1.1 SETUP Controls SETUP keys set the instrument to a defined state, change basic settings, and provide print and help functions. The intensity rotary knob adjusts the display contrast for sev- eral display elements. AUTOSET The instrument analyzes the enabled channel signals, and adjusts appropriate horizon- tal, vertical, and trigger settings to display stable waveforms.
- Page 31 ® Getting Started R&S Instrument Tour DISPLAY Opens and closes the "Display" dialog box to configure the appearance of the wave- forms, the diagram layout, color tables, and also the XY-diagram. INTENSITY Adjusts the intensity of the waveforms on the screen, or the background transparency of dialog boxes, or the transparency of result boxes.
- Page 32 ® Getting Started R&S Instrument Tour For record length, turn clockwise to increase the record length, and the resolution increases too - the time between to acquisition points gets shorter. POSITION / REF POINT The rotary knob changes the horizontal position of the waveform or the position of the reference point on the screen.
- Page 33 ® Getting Started R&S Instrument Tour The vertical rotary knobs are focused on the selected waveform and they are illumina- ted in the color of the selected waveform. Opens the "Reference" dialog box, where you can configure and display reference waveforms.
- Page 34 ® Getting Started R&S Instrument Tour TRIGGER Opens and closes the "Trigger" dialog box, where you can: ● Select a trigger type and configure it. ● Set general trigger parameters and control the acquisition run. ● Configure a sequence of subsequent trigger events. LEVELS The rotary knob sets the trigger level for all trigger types.
- Page 35 ® Getting Started R&S Instrument Tour CURSOR Displays vertical and horizontal cursors in the active diagram and displays the "Cursor Results" box. Cursors are markers which are placed at points of interest on a waveform. The instru- ment measures the cursor positions and delta values between parallel cursors. If you press the key while a cursor measurement is enabled, the "Cursors"...
- Page 36 ® Getting Started R&S Instrument Tour ● Configure the mask display SEARCH Opens and closes the "Search" dialog box, where you can: ● Configure trigger or measurement events to be searched for ● Limit the search by gating ● Configure the presentation of search results LOGIC Opens the dialog box for configuration of parallel buses and digital channels.
- Page 37 ® Getting Started R&S Instrument Tour ● To move zoom area, cursor line, or gate in diagrams: Turn to move the element that has the focus, and press to toggle the focus. UNDO Reverses the last setting actions step by step. Undo is not possible after load and recall actions, and after creating a reference waveform.
- Page 38 ® Getting Started R&S Instrument Tour 2.2.1.7 POWER Key The POWER key is located on the lower left corner of the front panel. It starts up and shuts down the instrument's software. The light of the key shows the instrument state: ●...
- Page 39 ® Getting Started R&S Instrument Tour Risk of injury and instrument damage The instrument is not rated for any measurement category. Make sure that the input voltage on channel inputs does not exceed 200 V peak, 150 V RMS at 1 MΩ input impedance and 5 V RMS at 50 Ω input impedance. Transient overvoltages must not exceed 200 V peak.
-
Page 40: Rear Panel
® Getting Started R&S Instrument Tour 2.2.2 Rear Panel Figure 2-2 shows the rear panel of the R&S RTE with its connectors. Figure 2-2: Rear panel view of R&S RTE 1 = AC power supply connector and main power switch 2 = USB connectors 3 = LAN connector 4 = DVI-D connector for external monitor... - Page 41 ® Getting Started R&S Instrument Tour When you power up the instrument, be sure to comply with the warm-up phase speci- fied in the data sheet before you start measurements. See also: Chapter 2.1.3, "Starting the Instrument", on page 16 Two USB type A connectors that comply with standard USB 3.0.
-
Page 42: Trying Out The Instrument
® Getting Started R&S Trying Out the Instrument RTO-B10 Optional GBIP connector coming with option R&S RTE-B10 GBIP interface. For detailed specifications, refer to the data sheet. 2.3 Trying Out the Instrument This chapter introduces the most important functions and settings of the R&S RTE step by step. - Page 43 ® Getting Started R&S Trying Out the Instrument Autoset finds appropriate horizontal and vertical scales and trigger conditions to present a stable square waveform. The trigger is set to edge trigger on rising edge with auto trigger mode. 4. If necessary, compensate the passive probe as described in Chapter 4.9.1, "Adjusting Passive Probes",...
-
Page 44: Acquiring Data
® Getting Started R&S Trying Out the Instrument Watch the waveform and the "Trigger" settings. 2.3.2 Acquiring Data You can acquire data using different arithmetic methods to get envelope or average waveforms. If you need to change only one setting during analysis, and you need to change it often, you can reduce the dialog box to a small box that only contains the required set- ting. -
Page 45: Changing The Waveform Scaling And Position
® Getting Started R&S Trying Out the Instrument 8. Close the dialog box by tapping 2.3.3 Changing the Waveform Scaling and Position As you can see on the y-axis of the display, the calibration signal has a vertical offset of about 550 mV. The value can differ. This value is also indicated in the signal icon for channel1 (2nd row). - Page 46 ® Getting Started R&S Trying Out the Instrument 3. To move the waveform back to the center of the screen, eliminate the offset in the vertical settings: a) Press the CH1 key again. b) Enter 0 V in the "Offset" field. The waveform is now displayed in the center of the display, with the x-axis crossing at 0 V.
- Page 47 ® Getting Started R&S Trying Out the Instrument 5. Tap the "Find level" icon on the toolbar. The instrument adjusts the trigger level, and a stable waveform is displayed. User Manual 1326.1032.02 ─ 11...
- Page 48 ® Getting Started R&S Trying Out the Instrument 6. To examine one pulse in the signal in more detail, turn the horizontal "Scale" rotary knob. The current scale factor per division is displayed in the upper left-hand corner of the display while you turn the knob. You can switch between a small and large step size in the scaling factor by tapping the step icon.
-
Page 49: Zooming Into The Display
® Getting Started R&S Trying Out the Instrument 7. To return to the original scaling, try the UNDO key in the NAVIGATION area: a) Press the UNDO key repeatedly until the original scaling is displayed. b) Press the REDO key to retrace the undone steps. Thus, you can toggle between the two displays using the undo and redo keys until you perform a dif- ferent action. - Page 50 ® Getting Started R&S Trying Out the Instrument of the zoom functions. The instrument has 4 zoom types, 2 of them you try out in this chapter. The usage of zooms is also shown in a short video that is available on the instrument: "Tutorials >...
- Page 51 ® Getting Started R&S Trying Out the Instrument 4. To remove the zoom window and make room on the display for other results, tap the "Delete" icon and then the zoom window. 2.3.4.2 Using the Fingertip Zoom 1. Touch the "Zoom" icon on the toolbar and drag it down until the "Zoom" toolbar menu opens.
-
Page 52: Displaying The Waveform History
® Getting Started R&S Trying Out the Instrument 4. Release the finger when the waveform segment of interest is visible in the zoom. 5. Tap "Keep" to convert the fingertip zoom into a standard zoom diagram. 2.3.5 Displaying the Waveform History During a continuous acquisition, the instrument stores the acquired data in the memory and shows the current acquisition on the display. -
Page 53: Showing Basic Measurement Results
® Getting Started R&S Trying Out the Instrument 5. In the ANALYSIS area, press the HISTORY key. The quick access "History" dialog box appears, and the history mode is enabled. 6. Tap "Play". The ten stored waveforms are displayed one after the other, but very fast. 7. - Page 54 ® Getting Started R&S Trying Out the Instrument 2.3.6.1 Performing a Cursor Measurement 1. Restore the default signal channel settings: Press the PRESET and AUTOSET keys. 2. Tap the "Cursor" icon on the toolbar. 3. Tap the diagram in which you want to set the cursors. Alternatively, draw a rectangle on the screen to position the cursor lines.
- Page 55 ® Getting Started R&S Trying Out the Instrument 6. To remove the result icon and make room on the display for other results, tap the red cross on the icon label. 2.3.6.2 Performing Automatic Amplitude Measurements You can start up to 8 automatic measurements to run in parallel. The "Automatic meas- urment"...
- Page 56 ® Getting Started R&S Trying Out the Instrument 7. Select "Rise time". 8. In the "Meas2" line, tap the measurement type button labeled "Low". 9. Select "Fall time". 10. Under "Statistics", tap "Enable". 11. Close the "Measurements" dialog box and check the results. 12.
- Page 57 ® Getting Started R&S Trying Out the Instrument 2.3.6.3 Performing and Configuring the Quick Measurement A set of up to eight different measurements on one source can be performed at once, simply by tapping the "Quick measurement" toolbar icon. The results are displayed in a result box.
- Page 58 ® Getting Started R&S Trying Out the Instrument Now the result box also shows the result of the time measurements. 9. Tap "Set as QuickMeas". The current configuration is set as default quick measurement and can be repeated until you save another configuration. 10.
- Page 59 ® Getting Started R&S Trying Out the Instrument 2.3.6.4 Displaying a Histogram Histograms are useful to analyze the occurrence of measurement values statistically. The usage of histograms is also shown in a short video that is available on the instru- ment: "Tutorials >...
-
Page 60: Performing A Basic Fft Analysis
® Getting Started R&S Trying Out the Instrument 4. Tap the histogram. The waveform count for the histogram is displayed. 5. To display further measurement results for the histogram, tap the icon in the result box. Alternatively, you can press the MEAS key on the front panel. 6. - Page 61 ® Getting Started R&S Trying Out the Instrument 3. To measure the spectrum on the math channel, tap the "Measurement" icon on the toolbar. 4. Tap the spectrum waveform. The spectrum measurement results are displayed in a result box. User Manual 1326.1032.02 ─ 11...
- Page 62 ® Getting Started R&S Trying Out the Instrument 5. Double-tap the spectrum waveform. The "FFT Setup" dialog box opens. 6. Set the "Center frequency" to 10 kHz. The instrument adjusts the frequency span automatically. Close the dialog box. User Manual 1326.1032.02 ─ 11...
-
Page 63: Performing Mathematical Calculations
® Getting Started R&S Trying Out the Instrument 7. If the spectrum analysis option R&S RTE-K18 is installed on your instrument, dou- ble-tap the spectrum waveform again. 8. Enable the spectrogram. Close the dialog box. 9. To remove the FFT results, tap the "Delete" icon and then the spectrum waveform. 10. -
Page 64: Performing A Search
® Getting Started R&S Trying Out the Instrument 5. Tap the "Operator" icon and select Rescale. 6. For "a", enter the vertical scaling factor, e.g. 4. 7. Under "b", enter the vertical position offset, e.g. 2. Look at the lower part of the dialog box and note that the instrument adjusts the "Vertical scale"... - Page 65 ® Getting Started R&S Trying Out the Instrument To determine the search conditions, we use the results of the measurement example described in Chapter 2.3.6.3, "Performing and Configuring the Quick Measurement", on page 49. 1. Press the SEARCH key on the front panel (ANALYSIS area). 2.
-
Page 66: Performing A Mask Test
® Getting Started R&S Trying Out the Instrument 8. In the results table, tap the row of the search result that you want to display in the search zoom diagram. 2.3.10 Performing a Mask Test In the following example, you perform a mask test to determine whether the signal exceeds a rectangular area. - Page 67 ® Getting Started R&S Trying Out the Instrument Tip: To create an exact rectangle, draw the diagonal of the rectangle on the screen. 4. To define the further mask test settings, press the MASKS key on the front panel (in the ANALYSIS area), and select the "Mask Definition" tab. 5.
- Page 68 ® Getting Started R&S Trying Out the Instrument 7. Tap the icon in the result box, and select the "Test Definition" tab. 8. Select channel 1 as the "Source". 9. Define the number of tolerable sample hits in the "Tolerance" field. A test has failed if the number of sample hits exceeds the limit of "Violation toler- ance"...
-
Page 69: Printing And Saving Screenshots
® Getting Started R&S Trying Out the Instrument 12. Press RUN CONT to start the next acquisition and watch the screen. 13. Close the "MaskTest" results box by tapping the red cross in the label. 2.3.11 Printing and Saving Screenshots You can print and save screenshots of the current display to document your results. - Page 70 ® Getting Started R&S Trying Out the Instrument 4. Tap the upper left button and select the printer. 5. Tap "Print". The result is a monochrome image. 6. Close the dialog box. To configure the PRINT key 1. Open the "File" menu and tap "Frontpanel Setup". 2.
-
Page 71: Saving Data
® Getting Started R&S Trying Out the Instrument To save screenshots 1. Press the PRINT key. 2. Change the horizontal scale. 3. Press the PRINT key. The files are saved to the following directory: C:\Users\Public\Public Documents\Rohde-Schwarz\RTx\ ScreenShots The default file name is Screenshot_<date>_<index>_<time>.png. 4. - Page 72 ® Getting Started R&S Trying Out the Instrument 9. Enter Waveform1 on the online keyboard 10. Tap "ENTER" to close the online keyboard. 11. Select the file type: "*.bin". 12. Tap "Save". The waveform data is saved to the files Waveform1.Wfm.bin and Waveform1.bin in the selected directory.
-
Page 73: Operating The Instrument
® Getting Started R&S Operating the Instrument Saving measurement results 1. Perform a measurement as described in Chapter 2.3.6.2, "Performing Automatic Amplitude Measurements", on page 47. 2. Tap in the result box. 3. Tap "Result box export" in the "Setup" tab. 4. - Page 74 ® Getting Started R&S Operating the Instrument Manual operation Use the touchscreen, keys and rotary knobs, or an optional mouse and/or keyboard. The principles of manual operation are explained in this section. Remote control Create programs to automatize repeating settings, tests, and measurements. The instrument is connected to a computer running the program.
- Page 75 ® Getting Started R&S Operating the Instrument These devices work conform to Windows standards. The navigation keys on the front panel correspond to the keys on the keyboard. The usage of the touchscreen and navigation keys is described in detail in the follow- ing sections.
- Page 76 ® Getting Started R&S Operating the Instrument 6 = Reference point (distance from trigger position to reference point = horizontal position) 7 = Zoom area 8 = Zoom diagram 9 = Histogram area 10 = Histogram 11 = Messages Diagram (1) A diagram shows one or more waveforms: channel, reference, and math waveforms together with histograms, masks etc.
- Page 77 ® Getting Started R&S Operating the Instrument Below, each waveform is represented by a signal icon. For each waveform that is shown in a diagram, a signal icon displays the signal label with its main vertical and acquisition settings. If you tap the "Minimize" icon on the signal label, the waveform switches from the diagram area to the signal icon: the icon shows the real-time preview of the waveform.
- Page 78 ® Getting Started R&S Operating the Instrument As for waveform diagrams, you can change the name of the zoom diagram. A zoom in a zoom and coupled zooms are also possible. All zooming possibilities are described in detail in the "User Manual", chapter "Zoom". Histogram and histogram area (9, 10) A histogram shows the frequency of occurrence of voltage or time values in a bar chart directly in the diagram.
- Page 79 ® Getting Started R&S Operating the Instrument Figure 2-6: Control elements on the touchscreen 1 = Toolbar 2 = Signal bar, see "Signal bar (3)" on page 68 3 = Menu bar 4 = Dialog box 5 = Tab in a dialog box 6 = Result box 7 = Input box Toolbar (1)
- Page 80 ® Getting Started R&S Operating the Instrument Result box (6) If you perform manual or automatic measurements, mask testing, or a search, the result box shows the results of the action. Similar to waveform diagrams, you can mini- mize the result box to a result icon on the signal bar, and display results in a separate diagram on the screen.
- Page 81 ® Getting Started R&S Operating the Instrument 2.4.4 Working with Waveforms The R&S RTE can create and display several types of waveforms: ● Channel waveforms: For each input channel, one channel waveform is shown. ● Reference waveforms: Four waveforms can be used as reference for comparison and analysis. ●...
- Page 82 ® Getting Started R&S Operating the Instrument diagram. The vertical POSITION / OFFSET and SCALE knobs, and the SIGNAL OFF key are illuminated with the color of the selected waveform. Figure 2-3, "Ch1" is the selected waveform: The frame of the diagram and the signal icon are highlighted.
- Page 83 ® Getting Started R&S Operating the Instrument 2. Drop the waveform in the target area. The waveform appears in an existing or in a new diagram, and it is selected for fur- ther actions. 3. To change the size of the new diagram, drag its edge to the required position. The diagram layout depends on the position where you drop the signal view, in relation to an existing diagram.
- Page 84 ® Getting Started R&S Operating the Instrument To switch off a waveform ► Do one of the following: ● Select the waveform, and then press the SIGNAL OFF key. ● To switch off a minimized waveform, tap the "Close" icon in the upper right cor- ner of the minimized signal view.
- Page 85 ® Getting Started R&S Operating the Instrument 3. Select "Auto-hide". 4. Define the hiding properties: ● "Hide bar after": the time after which the bar is hidden if no changes occur ● "Hiding transparency": Transparency of the hidden signal bar on a scale from 20% (low transparency) to 70% (high transparency) ●...
- Page 86 ® Getting Started R&S Operating the Instrument 2.4.6.1 Using the Toolbar Using the toolbar is easy and straightforward. Some of the toolbar functions are one-click actions. These actions are performed immediately when you tap the icon. Other toolbar functions are analyzing functions. These actions are interactive actions. To use analyzing functions (interactive actions) 1.
- Page 87 ® Getting Started R&S Operating the Instrument ● To hide all toolbar icons, tap "Hide All". 3. To hide the current date and time on the toolbar, disable "Show date and time". A detailed description of the toolbar functions is given in Chapter 2.4.6.3, "Toolbar Functions", on page 79.
- Page 88 ® Getting Started R&S Operating the Instrument One-click actions Interactive actions Run / Stop and Run Single Update Ref Waveform Save Waveform Spectrogram (option R&S RTE-K18) You can configure the content of the toolbar and hide the date/time display, see Chap- ter 2.4.6.2, "Configuring the Toolbar",...
- Page 89 ® Getting Started R&S Operating the Instrument Standard zoom ← Zoom Displays a magnified section of the diagram in an additional zoom diagram. It is a dis- play zoom, instrument settings are not changed. Touch and hold the zoom area to open the "Zoom" dialog box. Remote command: on page 1074 LAYout:ZOOM:ADD...
- Page 90 ® Getting Started R&S Operating the Instrument Histogram The histogram icon on the toolbar shows the last selected histogram type. A short tap on the icon activates the selected histogram. If you touch the icon and drag your finger down, a menu opens where you can select another histogram type: horizontal histogram, or vertical histogram.
- Page 91 ® Getting Started R&S Operating the Instrument Save Screenshot Saves a screenshot of the current display using the settings defined in "File" menu > "Print Setup". Create Report Creates a report of the current measurement settings and results using the settings defined in "File"...
- Page 92 ® Getting Started R&S Operating the Instrument 2.4.7 Displaying Results The results of automatic and cursor measurements, mask tests, and searches are dis- played immediately in a result box. There are three ways to display the results: ● In a floating result box in front of the diagrams, which you can move on the display ●...
- Page 93 ® Getting Started R&S Operating the Instrument To adjust the font size in result boxes 1. Press the SETUP key. 2. Select the "Screen" tab. 3. Set the "Result dialog font size". 2.4.8 Using Dialog Boxes All functionality is provided in dialog boxes as known from computer programs. You can control the instrument intuitively with the touchscreen.
-
Page 94: Entering Data
® Getting Started R&S Operating the Instrument 2. Tap the "Minimize" icon in the upper right corner of the dialog box. The dialog box turns into a small box that contains only the "Wfm Arithmetic" set- ting. 3. To restore the complete dialog box, tap the "Maximize"... - Page 95 ® Getting Started R&S Operating the Instrument For data input in dialog boxes, the touchscreen provides an on-screen keypad to enter numeric values and units. For text input, the on-screen keyboard with English key lay- out is used. To enter values with the on-screen keypad 1.
- Page 96 ® Getting Started R&S Operating the Instrument ± changes the sign of the value. – To enter data with the on-screen keyboard 1. Double-tap the entry field to open the on-screen keyboard. If available, you can also tap the keyboard icon on the right of the entry field. 2.
- Page 97 ® Getting Started R&S Operating the Instrument If no messages are available, the "Info" button is hidden. Important messages are indicated by a red "Info" button. These messages cannot be deleted, they remain until the problem is solved. 2.4.11 Getting Information and Help In many dialog boxes, graphics are included to explain the way a setting works.
- Page 98 ® Getting Started R&S Operating the Instrument 3. To open the corresponding help topic, tap the "Show Help" button in the lower right corner of the tooltip. The "Help" window opens and displays the comprehensive description and the cor- responding remote command. You can browse the help for further information. Note: The tooltip icon disables automatically when you tap a parameter.
- Page 99 ® Getting Started R&S Operating the Instrument To search topics for a text string 1. Switch to the "Search" tab. 2. Select the "Keyboard" icon besides the entry field. 3. Enter the string you want to find. If you enter several strings with blanks between, topics containing all words are found (same as AND operator).
-
Page 100: Instrument Setup
® Instrument Setup R&S System Setup 3 Instrument Setup You can adapt various instrument settings to your requirements, such as language, display appearance, and assign functions to some keys. The chapter describes also the handling of software options. The following setup procedures are described in other chapters of the documentation: ●... - Page 101 ® Instrument Setup R&S System Setup Firmware version......................93 Bios version........................93 Image version........................93 Desktop (minimize all)....................94 Computer name, IP Address, DHCP................94 System.......................... 94 Network......................... 94 Screensaver........................94 Display / Monitors: Display Settings................94 Time, date........................95 Log on as........................95 Language........................95 Select setup for firmware update..................
- Page 102 ® Instrument Setup R&S System Setup Desktop (minimize all) Minimizes all displayed application windows on the instrument, so that the desktop becomes visible on the screen to access the Windows functionality. This function is also available from the "File" menu. Computer name, IP Address, DHCP Indicates the currently defined computer name, the defined IP address and DHCP address enabling.
- Page 103 ® Instrument Setup R&S System Setup "Extend" The instrument display and the external display show different con- tent. "Projector The instrument's user interface is only shown on the external display, the instrument display is off. only" "Additional dis- Opens the Windows configuration for display settings. play settings"...
-
Page 104: Screen Setup
® Instrument Setup R&S Screen Setup Make sure that your device is connected to the Internet. If your corporate network uses a proxy server, enter the proxy settings in "Settings" menu > "Proxy Settings". Ask your administrator for correct proxy settings. A short instruction is available under "Help"... - Page 105 ® Instrument Setup R&S Screen Setup Note for "Dialog configuration", "Front panel setup" and "Navigation rotary knob" set- tings: These settings are user-specific, they are not reset by PRESET and *RST. You can reset them to default values using FILE > "Save/Recall > User defined preset > Factory defaults"...
-
Page 106: Frontpanel Setup
® Instrument Setup R&S Frontpanel Setup Font size Defines the font size of the text in dialog boxes. Dialog transparency Defines the transparency of the dialog box background. For high transparency values, you can see the waveform display in the background, and possibly check the effect of the changed setting. - Page 107 ® Instrument Setup R&S Frontpanel Setup ● Setup: Luminosity Settings..................99 ● Hardkeys: Function Assignment................99 ● Knobs........................100 3.3.1 Setup: Luminosity Settings Access: "File" menu > "Frontpanel Setup" > "Setup" LCD Intensity Changes the background luminosity of the touchscreen. LED Intensity Defines the luminosity of illuminated front panel keys and rotary knobs.
- Page 108 ® Instrument Setup R&S Frontpanel Setup Print Button The PRINT key on the left side of the display is a shortcut key that initiates an associ- ated action. You can assign one of the following actions to the PRINT key: ●...
-
Page 109: Display Configuration
® Instrument Setup R&S Display Configuration Horizontal The horizontalPOSITION / REF POINT knob can change the horizontal position or the reference point. Select the action that you want to perform. See also: "POSITION / REF POINT" on page 24. Rotary knob acceleration method Selects a method to accelerate the movement of the element on the screen compared to the actual movement of the rotary knob. - Page 110 ® Instrument Setup R&S Display Configuration Toolbar The toolbar contains icons that start frequently used functions. You can define which tools are displayed on the toolbar. Diagrams The basic diagram elements can be shown or hidden: grid, crosshair, label, and tab titles.
- Page 111 ® Instrument Setup R&S Display Configuration Enable persistence......................103 Infinite persistence...................... 103 Persistence time......................103 Reset...........................104 Intensity........................104 Style..........................104 Color..........................104 Set to default color...................... 104 Use color table......................105 Source.........................105 Assigned color table....................105 Enable persistence If enabled, each new data point in the diagram area remains on the screen for the duration that is defined using Persistence time, or as long as...
- Page 112 ® Instrument Setup R&S Display Configuration Remote command: on page 969 DISPlay:PERSistence:TIME Reset Resets the display, removing persistent all waveform points. Remote command: on page 970 DISPlay:PERSistence:RESet Intensity This value determines the strength of the waveform line in the diagram. Enter a per- centage between 0 (not visible) and 100% (strong).
- Page 113 ® Instrument Setup R&S Display Configuration Use color table If enabled, the selected waveform is displayed according to its assigned color table. If this option is disabled, the selected color is displayed, and the intensity of the specific signal color varies according to the cumulative occurrence of the values. Remote command: on page 971 DISPlay:COLor:SIGNal<m>:USE...
- Page 114 ® Instrument Setup R&S Display Configuration The editing table allows you to edit existing color tables or add new ones that can then be assigned to the waveforms. To assign a color table to a waveform, use the "Signal colors / Persistence" tab. See also: ●...
- Page 115 ® Instrument Setup R&S Display Configuration These settings are user-specific, they are not reset by PRESET and *RST. You can reset them to default values using FILE > "Save/Recall > User defined preset > Factory defaults" or using the SYSTem:PRESet command. Show grid........................
- Page 116 ® Instrument Setup R&S Display Configuration Show grid If selected, a grid is displayed in the diagram area. A grid helps you associate a spe- cific data point to its exact value on the x- or y-axis. Remote command: on page 974 DISPlay:DIAGram:GRID Show labels If selected, labels mark values on the x- and y-axes in specified intervals in the dia-...
- Page 117 ® Instrument Setup R&S Display Configuration If cleared, the tab titles are not shown except for titles in a tabbed diagram. In tabbed diagrams, the tab titles are required to change the tabs. Remote command: on page 974 DISPlay:DIAGram:TITLe Show evaluation gate(s) in zoom If enabled, the available histogram areas, masks, and measurement gates are shown in the zoom diagrams.
- Page 118 ® Instrument Setup R&S Display Configuration Position ← Signal bar The signal bar can be placed vertically at the right (default position), or at the left to ensure best visibility of the waveforms. Remote command: on page 978 DISPlay:SIGBar:POSition Auto-hide ← Signal bar If selected, the signal bar disappears automatically after some time, similar to the Win- dows task bar.
- Page 119 ® Instrument Setup R&S Display Configuration 3.4.2.4 Waveform Labels Access: DISPLAY > "Labels" tab Using labels, you can annotate the waveforms to name or explain each waveform. The text is shown in the same color as the assigned waveform. Each label has its individual position.
- Page 120 ® Instrument Setup R&S Display Configuration on page 982 DISPlay:SIGNal:LABel:VERTical:ABSolute:POSition on page 982 DISPlay:SIGNal:LABel:HORizontal:RELative:POSition on page 982 DISPlay:SIGNal:LABel:VERTical:RELative:POSition Show labels Enables or disables the label display. Position mode Defines the label position either relative to the diagram or with absolute values accord- ing to the units of the waveform.
-
Page 121: Adjusting The Display
® Instrument Setup R&S Display Configuration forms. If you need this function frequently, you can add the correspondent icon to the toolbar, see Chapter 2.4.6.2, "Configuring the Toolbar", on page 78. 3.4.3 Adjusting the Display To change the diagram name ►... - Page 122 ® Instrument Setup R&S Display Configuration 3. For each range of cumulative occurrence of the values, insert an entry in the color table: ● To insert an entry at the end of the color table, tap "Append". ● To insert an entry before an existing entry, tap the existing row. Then tap "Insert".
- Page 123 ® Instrument Setup R&S Display Configuration To assign the color table and enable its use 1. Open the "Signal Colors/ Persistence" tab of the "Display" dialog box. 2. Under "Color Table Assignment", select the tab for the waveform. 3. Enable "Use Color table". 4.
- Page 124 ® Instrument Setup R&S Display Configuration To configure auto-hide The signal bar can be hidden if the displayed information has not changed for a defined time, and is displayed again automatically when a setting in the signal bar changes. The signal bar does not hide entirely, it simply fades and becomes less visi- ble in the display.
- Page 125 ® Instrument Setup R&S Display Configuration ● To display all available toolbar icons, tap "Show All". ● To hide all toolbar icons, tap "Hide All". 3. To hide the current date and time on the toolbar, disable "Show date and time". A detailed description of the toolbar functions is given in Chapter 2.4.6.3, "Toolbar Functions",...
-
Page 126: Self-Alignment
® Instrument Setup R&S Self-Alignment 2. In the "Screen" tab, in the "Dialog box transparency" field, enter the transparency value for dialog boxes. For high transparency values, you can see the waveform display in the back- ground, and possibly check the effect of the changed setting. For lower transpar- ency values, readability in the dialog box improves. - Page 127 ® Instrument Setup R&S Self-Alignment Start Alignment Starts the self-alignment procedure for all channels. Remote command: on page 956 *CAL? Date / Time / Overall alignment state Show the date and the summary result of the self-alignment process: Passed or Failed. Detailed results are provided on the "Results"...
-
Page 128: Options
® Instrument Setup R&S Options Warm-up and prepare the instrument Make sure that the instrument has been running and warming up before you start the self-alignment. The minimum warm-up time is indicated in the data sheet. Remove the probes from the input connectors. 1. - Page 129 ® Instrument Setup R&S Options SW option list Shows the activated options. This information provided for administration and trouble- shooting purposes. If you need support for an option, provide this information to the service representative. The "State" of the option indicates whether the installed option is a normal or a beta- release version.
- Page 130 ® Instrument Setup R&S Options When you move a portable license, use this function to import the deactivation key that is generated by the "R&S License Manager". See also Chapter 3.6.4, "Moving a Porta- License", on page 123. 3.6.1.2 Deactivation Options Access: SETUP >...
- Page 131 ® Instrument Setup R&S Options If the option has a portable license, keep the license file or option key at a save place. You need the license to move it to another instrument. 1. Press the SETUP key and select the "SW options" tab. 2.
- Page 132 ® Instrument Setup R&S Options 2. On the source and target instruments: Select SETUP > "SW Options" tab > "Active options" subtab and note the device IDs of both instruments. 3. In the R&S License Manager: a) Open the R&S License Manager: https://extranet.rohde-schwarz.com/service. b) Select "Move Portable License".
- Page 133 ® Instrument Setup R&S Options User Manual 1326.1032.02 ─ 11...
-
Page 134: Acquisition And Waveform Setup
® Acquisition and Waveform Setup R&S Basics 4 Acquisition and Waveform Setup This chapter describes the horizontal and vertical settings as well as the acquisition and probe setup. 4.1 Basics This chapter provides background information on the essential settings in the vertical and horizontal systems, on acquisition setup and probing. - Page 135 ® Acquisition and Waveform Setup R&S Basics Figure 4-1: Input range and resolution of the ADC With R&S RTE, you can work with multiple diagrams, and each diagram obtains the full vertical resolution, no matter where the diagram is placed. Therefore, use a separate diagram for each waveform instead of the traditional setup that arranges the wave- forms side by side in one diagram.
- Page 136 ® Acquisition and Waveform Setup R&S Basics Figure 4-3: R&S RTE setup of multiple waveforms in separate diagrams: best resolution 4.1.1.3 Bandwidth For analog applications, the highest signal frequency determines the required oscillo- scope bandwidth. The oscilloscope bandwidth should be slightly higher than the maxi- mum frequency included in the analog test signal to measure the amplitude with very little measurement error.
- Page 137 ® Acquisition and Waveform Setup R&S Basics 4.1.2.1 Sampling and Processing The A/D converter samples the continuous signal under test at specific points in time and delivers digital values called ADC samples. The rate at which the converter is working is the ADC sample rate, a constant value specified in GHz: = 1 / T The digital ADC samples are processed according to the acquisition settings.
- Page 138 ® Acquisition and Waveform Setup R&S Basics Figure 4-4: Waveforms acquired with different sample rates To avoid aliasing, the sample rate must be set to a value 3 to 5 times the fastest fre- quency component of the signal. A higher sample rate increases signal fidelity, increa- ses the chance to capture glitches and other signal anomalies, and improves the zoom-in capabilities.
-
Page 139: Horizontal System
® Acquisition and Waveform Setup R&S Basics The determining point of an acquisition is the trigger. The instrument acquires continu- ously and keeps the sample points to fill the pre-trigger part of the waveform record. When the trigger occurs, the instrument continues acquisition until the post-trigger part of the waveform record is filled. - Page 140 ® Acquisition and Waveform Setup R&S Basics When you set up horizontal parameters, you can choose whether the record length or the resolution remains constant. ● With constant resolution, increasing the time scale also increases the record length, and vice versa. You can limit the record length to a maximum value. ●...
- Page 141 ® Acquisition and Waveform Setup R&S Basics An ideal probe fulfills the following requirements: ● Safe and reliable contacts ● Infinite bandwidth ● The probe should not load the signal source and thus impact the circuit operation. ● The connection should not introduce or suppress signal components (hum, noise, filter) and thus degrade or distort the transferred signal.
- Page 142 ® Acquisition and Waveform Setup R&S Basics system probe scope To measure the signal with low measurement error, the system bandwidth should be higher than the highest frequency component of the signal.
- Page 143 ® Acquisition and Waveform Setup R&S Basics RT-ZS single-ended active probes and RT-ZD differential active probes provide special features for easier use and precise measurements. These special features are not available on RT-ZSxxE probes. ● The micro button on the probe head remotely controls important functions on the instrument, like running and stopping the acquisition, autoset, AutoZero and setting the offset to mean value.
-
Page 144: Horizontal Settings
® Acquisition and Waveform Setup R&S Horizontal Settings ● Positive single-ended input voltage (V Voltage between the positive signal socket and the ground socket ● Negative single-ended input voltage (V Voltage between the negative signal socket and the ground socket ●... - Page 145 ® Acquisition and Waveform Setup R&S Horizontal Settings Time scale........................137 Acquisition time ......................137 Position........................138 Reference point......................138 Restrict horizontal position to acquisition range............138 Sample rate.........................138 Resolution........................138 Record length......................138 Resolution......................139 ZVC Record length......................139 Resolution / Record length (Resolution dependency)..........139 Auto adjustment (Resolution dependency)..............
- Page 146 ® Acquisition and Waveform Setup R&S Horizontal Settings Position Defines the time distance between the reference point and the trigger point (the zero point of the diagram). If you want to see a section of the waveform some time before or after the trigger, enter this time as horizontal position.
- Page 147 ® Acquisition and Waveform Setup R&S Horizontal Settings ZVC Resolution Available only, if a R&S RT-ZVC multi-channel high accuracy power probe probe is connected to the instrument. Displays the current resolution,the time between two waveform samples, of the R&S RT-ZVC multi-channel high accuracy power probe channel. Remote command: on page 1026 ACQuire:ZRESolution?
- Page 148 ® Acquisition and Waveform Setup R&S Horizontal Settings Roll mode In roll mode, the instrument shows the waveforms immediately, without waiting for the complete acquisition of the waveform record. If the time base is slow - at long time scale values - the roll mode saves waiting for the waveform display. The instrument displays newly acquired waveform points at the right edge of the display and moves the waveform to the left.
-
Page 149: Resolution Enhancement
® Acquisition and Waveform Setup R&S Horizontal Settings 4.2.2 Acquisition Access: ACQUISITION key Acquisition settings control how the waveform is built from the acquired samples. For background information, see Chapter 4.1.2, "Sampling and Acquisition", on page 128. The "Decimation" and "Arithmetic" settings are the same for all active channels. Resolution enhancement.................... -
Page 150: Interpolation
® Acquisition and Waveform Setup R&S Horizontal Settings "Interpolated If the "Sample rate" is higher than the "ADC sample rate", interpola- time" tion adds points between the ADC samples of the waveform by vari- ous mathematic methods, see Interpolation. Remote command: on page 989 ACQuire:MODE Interpolation... -
Page 151: Arithmetic
® Acquisition and Waveform Setup R&S Horizontal Settings "RMS" The waveform point is the root mean square of n sample values. Thus, the RMS value reflects the instantaneous power. This arith- metic mode is used to average a measured power waveform. Linear averaging of power signals causes an error dependent on the noise of the signal to be averaged. -
Page 152: Reset
® Acquisition and Waveform Setup R&S Horizontal Settings If ultra segmentation is enabled and configured to acquire the maximum number of acquisitions, the acquisition count is set to that maximum number and cannot be changed. See also: "Number of acquisitions" on page 145. - Page 153 ® Acquisition and Waveform Setup R&S Horizontal Settings To use the history functionality, enable "Show history" in the "Ultra Segmentation" tab. The history viewer settings are displayed directly in the "Ultra Segmentation" tab. See also: Chapter 6.4, "History", on page 260. Enable ultra segmentation Switches the ultra segmentation mode on and off.
-
Page 154: Vertical Settings
® Acquisition and Waveform Setup R&S Vertical Settings Replay time Defines the display speed of the ultra segmentation acquisition series. Display starts after the series has been captured completely. See also: "Replay time per acq." on page 263 Show history Enables the history mode and displays the history viewing functions in the "Ultra Seg- mentation"... - Page 155 ® Acquisition and Waveform Setup R&S Vertical Settings Coupling........................147 Offset...........................148 Bandwith........................148 Show channel Switches the channel signal on or off. The signal icon appears on the signal bar. The waveform of the last acquisition is displayed in the diagram. Remote command: on page 993 CHANnel<m>:STATe...
- Page 156 ® Acquisition and Waveform Setup R&S Vertical Settings "DC 1 MΩ" Connection with 1 MΩ termination, passes both DC and AC compo- nents of the signal. "AC" Connection with 1 MΩ termination through DC capacitor, removes DC and very low-frequency components. Remote command: on page 993 CHANnel<m>:COUPling...
- Page 157 ® Acquisition and Waveform Setup R&S Vertical Settings Channel coupling sets the vertical settings of the coupled channels to the values of the active channel. If you want to have the same vertical settings for two or more chan- nels , you can set them at once by coupling these channels. Channel coupling affects all vertical settings that are adjusted in the "Channels"...
-
Page 158: High Definition (Option R&S Rte-K17)
® Acquisition and Waveform Setup R&S High Definition (Option R&S RTE-K17) Remote command: on page 996 CHANnel<m>:IMPedance 4.4 High Definition (Option R&S RTE-K17) The high definition mode offers up to 16 bits of vertical resolution. Higher vertical reso- lution reduces quantization noise and acquires waveforms of higher accuracy with finer details of the signal to be seen. - Page 159 ® Acquisition and Waveform Setup R&S High Definition (Option R&S RTE-K17) Remote command: on page 1028 HDEFinition:STATe Bandwidth Sets the filter bandwidth for the high definition mode. The maximum filter bandwidth depends on the instrument bandwidth. Instrument bandwidth Maximum filter bandwidth 200 MHz 200 MHz 350 MHz...
- Page 160 ® Acquisition and Waveform Setup R&S High Definition (Option R&S RTE-K17) R&S RTE of the 1317.2500.Kxx series only: The minimum vertical scale is 500 μV/div instead of 1 mV in normal mode. Digital filter The digital filter settings are set automatically. You can change the high definition "Bandwidth"...
-
Page 161: Probes
® Acquisition and Waveform Setup R&S Probes To define additional export settings, tap "Advanced Settings" in the FILE > "Wave- forms" tab. See: ● "Raw (ADC direct)" on page 421 ● "Interleaved x/y" on page 420 ● "Byte order" on page 421 If you use remote control commands to transfer data to a controlling computer, set the data format to INT,16 to transfer the complete data words (see FORMat[:DATA]... -
Page 162: Shared Probe Settings
® Acquisition and Waveform Setup R&S Probes Access: "Vertical" menu > "Probe Setup" The functionality on the "Setup" tab changes according to the type of the attached probe. Probes with Rohde & Schwarz probe interface (probe box), and also many other passive voltage probes, are recognized by the instrument. - Page 163 ® Acquisition and Waveform Setup R&S Probes The shared probe settings are: Type, Name, Bandwidth....................155 Detect AutoZero, Use AutoZero..................155 External attenuation: Scale, Attenuation..............156 Type, Name, Bandwidth The fields show the characteristics of a recognized or predefined probe for information. If the instrument cannot recognize the probe, and the probe is not known, the "Type"...
-
Page 164: Settings For The R&S Probe Interface (Voltage Probes)
® Acquisition and Waveform Setup R&S Probes To include the measured offset in measurement results, enable "Use AutoZero". If a current probe is connected, the function demagnetizes the probe's sensor head and sets the waveform to zero position. See "Detect AutoZero" on page 171. - Page 165 ® Acquisition and Waveform Setup R&S Probes The settings for active voltage probes with Rohde & Schwarz probe interface are: Probe unit, Auto attenuation..................157 Micro button action......................157 ProbeMeter......................... 158 Probe unit, Auto attenuation If the probe is recognized by the R&S RTE, the instrument reads the attenuation unit and value from the probe an displays them.
- Page 166 ® Acquisition and Waveform Setup R&S Probes Select the action that you want to start from the probe: "Run Continuous" Is the default assignment. Starts or stops the acquisition (same as RUN CONT key). "Run single" Starts a defined number of acquisitions (same as RUN N× SINGLE key).
- Page 167 ® Acquisition and Waveform Setup R&S Probes Measures the voltage between the probe tip and the ground. ● ProbeMeter measurement results of differential and modular R&S probes You can select the voltage to be measured by the differential active probe: –...
-
Page 168: Setup For Passive Probes
® Acquisition and Waveform Setup R&S Probes on page 1004 TRPRobe:PMETer:RESults:SINGle? on page 1006 TRPRobe:PMETer:RESults:POSitive? on page 1005 TRPRobe:PMETer:RESults:NEGative? on page 1005 TRPRobe:PMETer:RESults:DIFFerential? on page 1005 TRPRobe:PMETer:RESults:COMMon? 4.5.3 Setup for Passive Probes Passive probes are the most widely used probes for oscilloscope measurements. Pas- sive probes require compensation. -
Page 169: Setup For Active Voltage Probes
® Acquisition and Waveform Setup R&S Probes Remote command: on page 1006 PROBe<m>:SETup:ATTenuation:MODE on page 1006 (trigger input) TRPRobe:SETup:ATTenuation:MODE Vertical unit, Attenuation, Gain If a predefined probe is connected and selected, the attenuation or gain values are shown. For unknown probes and passive probes in manual mode, you can set user-defined values for unit, gain and attenuation. - Page 170 ® Acquisition and Waveform Setup R&S Probes Figure 4-9: Probe setup for active single-ended probe R&S RT-ZS10 Figure 4-10: Probe setup for active differential probe R&S RT-ZD30 User Manual 1326.1032.02 ─ 11...
- Page 171 ® Acquisition and Waveform Setup R&S Probes Figure 4-11: Probe setup for power rail probe R&S RT-ZPR20 Specific settings for active single-ended and differential probes with Rohde & Schwarz probe interface are the following: Offset...........................163 offset........................163 Probe attenuator RT-ZA15..................164 Coupling........................ 164 Offset For differential probes, this offset is the differential offset.
-
Page 172: Setup For Modular Probes
® Acquisition and Waveform Setup R&S Probes Probe attenuator RT-ZA15 If you use the external attenuator R&S RT-ZA15 together with one of the differential active probes R&S RT-ZD10/20/30, enable RT-ZA15 to include the external attenua- tion in the measurements. Remote command: on page 1008 PROBe<m>:SETup:ZAXV on page 1008... - Page 173 ® Acquisition and Waveform Setup R&S Probes Specific settings for modular probes are the following: Probe Mode.........................165 DM Offset, CM Offset, P Offset, N Offset..............166 Termination Voltage....................166 Probe Mode Sets the measurement mode of modular probes. The modular probes of the R&S RT-ZM family have a multi-mode function. You can switch between single-ended, differential and common mode measurements without reconnecting or resoldering the probe.
- Page 174 ® Acquisition and Waveform Setup R&S Probes Remote command: on page 1009 PROBe<m>:SETup:PRMode on page 1009 TRPRobe:SETup:PRMode DM Offset, CM Offset, P Offset, N Offset Compensate offset voltages. Available offsets depend on the selected probe mode. The offset of the selected probe mode is used as channel offset and considered auto- matically for correction.
-
Page 175: Setup For Predefined Probes
® Acquisition and Waveform Setup R&S Probes "Mode" In "Auto" mode, the instrument uses the measured common mode voltage for termination. In "Manual" mode, you can enter the voltage to be used for termina- tion. Use the manual mode if you know the common mode voltage of the DUT. - Page 176 ® Acquisition and Waveform Setup R&S Probes Figure 4-12: Probe setup for transmission line probe R&S RT-ZZ80 Figure 4-13: Probe setup for R&S RT-ZD01 Specific settings for predefined probes are the following: Predefined probe......................169 Offset to mean......................169 Line impedance......................169 User Manual 1326.1032.02 ─ 11...
-
Page 177: Setup For Current Probes
® Acquisition and Waveform Setup R&S Probes Predefined probe List of probes that are known to the instrument. Select the used probe on the list. The corresponding "Vertical unit" and the "Attenuation" or "Gain" are shown. All other unrecognized probes that are not listed, are unknown probes. For these probes, set "Predefined probe"... - Page 178 ® Acquisition and Waveform Setup R&S Probes Figure 4-14: Probe setup for current probes R&S RT-ZC10 Current probes R&S RT-ZCxxB Current probes R&S RT-ZCxxB have a Rohde & Schwarz probe interface; they are powered and remotely controlled by the oscilloscope. When the probe is connected, demagnetization is performed automatically.
- Page 179 ® Acquisition and Waveform Setup R&S Probes For all current probes, attenuation or gain is shown in the "Setup" tab, and you can set the offset to mean: ● "Probe unit, Auto attenuation" on page 157 ● "Offset to mean" on page 169 Current probes R&S RT-ZCxxB are adjusted by the following functions: DeGauss........................
-
Page 180: Setup For Unknown Probes
® Acquisition and Waveform Setup R&S Probes Save to probe Saves the "Zero adjust" value in the probe box. If you connect the probe to another channel or to another R&S RTx oscilloscope, the value is read out again, and you can use the probe without further adjustment. -
Page 181: Calibration Results
® Acquisition and Waveform Setup R&S Probes Remote commands: ● on page 1014 PROBe<m>:ID:SWVersion? ● on page 1015 PROBe<m>:ID:PRDate? ● on page 1015 PROBe<m>:ID:PARTnumber? ● on page 1015 PROBe<m>:ID:SRNumber? ● on page 1016 PROBe<m>:SETup:CAPacitance? ● on page 1016 PROBe<m>:SETup:IMPedance? ● on page 1014 TRPRobe:ID:SWVersion? ●... -
Page 182: R&S Rt-Zvc Probe
® Acquisition and Waveform Setup R&S R&S RT-ZVC Probe 4.6 R&S RT-ZVC Probe With the R&S RTE and option R&S RTE-B1E, you can use the R&S RT-ZVC multi- channel high accuracy power probe. It has an integrated 2- or 4-channel amperemeter and 2- or 4-channel voltmeter. - Page 183 ® Acquisition and Waveform Setup R&S R&S RT-ZVC Probe 4.6.1 R&S RT-ZVC Overview 4.6.1.1 Setup Access: "Vertical" menu > "ZVC Multi-Channel Probe" > "Setup" tab Make sure that the tab of the correct probe is selected on the left side. State Enables the corresponding channel of the probe.
- Page 184 ® Acquisition and Waveform Setup R&S R&S RT-ZVC Probe Remote command: on page 1024 ZVC:Z<m>:V<n>:SCALe on page 1020 ZVC:Z<m>:I<n>:SCALe Offset The vertical center of the selected channel is shifted by the offset value and the signal is repositioned within the diagram area. Negative offset values move up the waveform, positive values move it down.
- Page 185 ® Acquisition and Waveform Setup R&S R&S RT-ZVC Probe Remote command: on page 1017 ZVC:BANDwidth 4.6.1.2 Probes Access: "Vertical" menu > "ZVC Multi-Channel Probe"> "Probes" tab Software version Displays the software version of the probe. Remote command: on page 1025 ZVC:Z<m>:ID:SWVersion? Name Displays the name of the probe.
- Page 186 ® Acquisition and Waveform Setup R&S R&S RT-ZVC Probe State Enables the corresponding channel of the probe. The number of available channels depend on the characteristics of your multi-channel power probe. Remote command: on page 1024 ZVC:Z<m>:V<n>[:STATe] on page 1022 ZVC:Z<m>:I<n>[:STATe] Measurement Impedance Sets the impedance of the probe channel for power calculations and measurements.
- Page 187 ® Acquisition and Waveform Setup R&S R&S RT-ZVC Probe Channel Selects the voltmeter channel to be configured. State Enables the corresponding voltage channel of the probe. The number of available channels depend on the characteristics of your multi-channel power probe. Remote command: on page 1024 ZVC:Z<m>:V<n>[:STATe]...
- Page 188 ® Acquisition and Waveform Setup R&S R&S RT-ZVC Probe Remote command: on page 1023 ZVC:Z<m>:V<n>:OVERload:RSTO 4.6.3 ZVC Current Setup Settings Access: "Vertical" menu > "ZVC Multi-Channel Probe" > "Setup" dialog > "Setup" of current channel See also: ● Vertical Scale ●...
- Page 189 ® Acquisition and Waveform Setup R&S R&S RT-ZVC Probe Position Moves the selected signal up or down in the diagram. The visual effect is the same as for Offset. While the offset sets a current, position is a graphical setting given in divi- sions.
-
Page 190: Digital Filter Setup
® Acquisition and Waveform Setup R&S Digital Filter Setup Remote command: on page 1020 ZVC:Z<m>:I<n>:SHUNt:MAXCurrent External shunt mode Shunt mode is set to "External shunt", includes the settings for the external shunt mode. Maximum voltage ← External shunt mode Selects the maximum voltage at the external shunt. Remote command: on page 1021 ZVC:Z<m>:I<n>:SHUNt:MAXVoltage... -
Page 191: Horizontal Accuracy
® Acquisition and Waveform Setup R&S Horizontal Accuracy Bandwidth Sets the limit frequency. This limit is applied to the trigger channel and to the acquisi- tion channels that are enabled for filtering. Remote command: on page 1027 TRIGger<m>:RFReject Acquisition RF reject Enables the DSP filter for the input channels. - Page 192 ® Acquisition and Waveform Setup R&S Horizontal Accuracy Reference Sets the reference clock that is to be used. "Internal" Uses the internal reference signal. "External" Uses an external reference signal. Remote command: on page 1030 SENSe[:ROSCillator]:SOURce External reference Sets the frequency of an external reference input signal: 10 MHz. Remote command: on page 1030 SENSe[:ROSCillator]:EXTernal:FREQuency...
-
Page 193: Setting Up The Waveform
® Acquisition and Waveform Setup R&S Setting Up the Waveform Show channel Switches the channel signal on or off. The signal icon appears on the signal bar. The waveform of the last acquisition is displayed in the diagram. Remote command: on page 993 CHANnel<m>:STATe Use skew offset... - Page 194 ® Acquisition and Waveform Setup R&S Setting Up the Waveform capacitance to the oscilloscope input capacitance to assure good amplitude accuracy from DC to upper bandwidth limit frequencies. A poorly compensated probe reduces the performance of the probe-oscilloscope system and introduces measurement errors resulting in distorted waveforms and inaccurate results.
- Page 195 ® Acquisition and Waveform Setup R&S Setting Up the Waveform 5. Select to set either the resolution or the record length and enter the required value. 6. Press the channel button corresponding to the input channel. It is illuminated with the color of the channel waveform.
- Page 196 ® Acquisition and Waveform Setup R&S Setting Up the Waveform To start and stop continuous acquisition 1. Check if the trigger mode is set to "Normal". The trigger mode is shown in the trig- ger label in the upper right edge of the screen. If not, press the trigger MODE key on the front panel to toggle the setting.
- Page 197 ® Acquisition and Waveform Setup R&S Setting Up the Waveform 3. If you want to sample the maximum number of acquisitions in a series, select "Acquire maximum". If you want to capture a defined number of acquisitions, disable "Acquire maxi- mum"...
-
Page 198: Triggers
® Triggers R&S Basics of Triggering 5 Triggers 5.1 Basics of Triggering Triggering means to capture the interesting part of the relevant waveforms. Choosing the right trigger type and configuring all trigger settings correctly allows you to detect various incidents in analog, digital, and protocol signals. Trigger A trigger occurs if the complete set of trigger conditions is fulfilled. -
Page 199: Setting Up The Trigger
® Triggers R&S Setting Up the Trigger Trigger sequence A complex trigger sequence joins two separate trigger type conditions with an optional delay time. This combination is called "A → B" trigger sequence. Similar setups are also known as multi-step trigger or A/B trigger. Trigger information Information on the most important trigger settings is shown in the trigger label on top of the signal bar. - Page 200 ® Triggers R&S Setting Up the Trigger 5.2.1 Configuring a Simple Trigger Prerequisites: ● Horizontal and vertical settings are set appropriately to the signals. ● The acquisition is running, the RUN CONT key lights green. For details on settings, see Chapter 5.3, "Trigger Types", on page 193.
-
Page 201: Trigger Types
® Triggers R&S Trigger Types 5.2.3 Using Holdoff For details on holdoff settings, see Chapter 5.4, "Holdoff", on page 219. 1. Press the TRIGGER key and select the "Holdoff" tab. Alternatively, tap the "Trigger" menu and then "Holdoff". 2. Select the "Holdoff mode". 3. -
Page 202: Basic Trigger Settings
® Triggers R&S Trigger Types ● Basic Trigger Settings................... 194 ● Edge........................196 ● Analog Edge......................197 ● Glitch........................198 ● Width........................199 ● Runt........................201 ● Window......................... 203 ● Timeout......................... 204 ● Interval........................205 ● Slew Rate......................206 ● Data2Clock......................208 ● State........................210 ● Pattern........................210 ●... - Page 203 ® Triggers R&S Trigger Types Source Selects the source of the trigger signal for the current trigger condition. The trigger source works even if it is not displayed in a diagram. It must be synchronized to the signal to be displayed and analyzed. The trigger source can be: ●...
-
Page 204: Edge
® Triggers R&S Trigger Types The following trigger types are available: ● Edge, see page 196 ● Glitch, see page 198 ● Width, see page 199 ● Runt, see page 201 ● Window, see page 203 ● Timeout, see page 204 ●... -
Page 205: Analog Edge
® Triggers R&S Trigger Types Slope Sets the edge type for the trigger condition. "Positive" Selects the rising edge, that is a positive voltage change. "Negative" Selects the falling edge, that is a negative voltage change. "Both" Selects the rising as well as the falling edge. This option is not availa- ble if the trigger source is the external trigger input. -
Page 206: Glitch
® Triggers R&S Trigger Types Filter If the selected trigger source is "Extern" (external trigger input), you can directly select a filter to reject high or low frequencies. For all other trigger sources, you can add a digital filter using the Digital Filter Setup. "Off"... -
Page 207: Width
® Triggers R&S Trigger Types Polarity Indicates the polarity of a pulse, that is the direction of the first pulse slope. "Positive" Selects positive going pulses. "Negative" Selects negative going pulses. "Either" Selects both positive and negative going pulses. Remote command: on page 1037 TRIGger<m>:GLITch:RANGe on page 1040... - Page 208 ® Triggers R&S Trigger Types The width trigger compares the pulse width (duration of a pulse) with a given time limit. It detects pulses with an exact pulse width, pulses shorter or longer than a given time, and pulses inside or outside the allowable time range. The pulse width is measured at the trigger level.
-
Page 209: Runt
® Triggers R&S Trigger Types Width For the ranges "Within" and "Outside", the width defines the center of a range which is defined by the limits ±Delta. For the ranges "Shorter" and "Longer", the width defines the maximum and minimum pulse width, respectively. - Page 210 ® Triggers R&S Trigger Types "Positive" Selects positive going pulses. "Negative" Selects negative going pulses. "Either" Selects both positive and negative going pulses. Remote command: on page 1037 TRIGger<m>:GLITch:RANGe on page 1040 TRIGger<m>:RUNT:POLarity Upper level Sets the upper voltage threshold. Remote command: on page 1040 TRIGger<m>:LEVel<n>:RUNT:UPPer...
-
Page 211: Window
® Triggers R&S Trigger Types 5.3.7 Window Access: TRIGGER > "Setup" tab > "Type = Window" The window trigger checks the signal run in relation to a "window". The window is formed by the upper and lower voltage levels. The trigger condition is fulfilled, if the waveform enters or leaves the window, or if the waveform stays inside or outside for a time longer or shorter than specified. -
Page 212: Timeout
® Triggers R&S Trigger Types Time condition Selects how the time limit of the window is defined. Time conditioning is available for the vertical conditions "Stay within" and "Stay outside". "Within" Triggers if the signal stays inside or outside the vertical window limits at least for the time Width - Delta and for Width + Delta at the most. -
Page 213: Interval
® Triggers R&S Trigger Types Trigger level Sets the voltage level for the trigger condition. You can also drag the trigger level marker on the display (TA or TB on the right edge of the display). The range of the trig- ger level is limited in a way so that always a hysteresis for stable trigger conditions is available. -
Page 214: Slew Rate
® Triggers R&S Trigger Types Trigger level Sets the voltage level for the trigger condition. You can also drag the trigger level marker on the display (TA or TB on the right edge of the display). The range of the trig- ger level is limited in a way so that always a hysteresis for stable trigger conditions is available. - Page 215 ® Triggers R&S Trigger Types Slope Sets the edge type for the trigger condition. "Positive" Selects the rising edge, that is a positive voltage change. "Negative" Selects the falling edge, that is a negative voltage change. "Both" Selects the rising as well as the falling edge. This option is not availa- ble if the trigger source is the external trigger input.
-
Page 216: Data2Clock
® Triggers R&S Trigger Types Remote command: on page 1047 TRIGger<m>:SLEW:RANGe Slew rate For the ranges "Within" and "Outside", the slew rate defines the center of a range which is defined by the limits "±Delta". For the ranges "Shorter" and "Longer", the slew rate defines the maximum and mini- mum slew rate limits, respectively. - Page 217 ® Triggers R&S Trigger Types Clock edge Sets the edge of the clock signal to define the time reference point for the setup and hold time: "Positive" Rising edge, a positive voltage change. "Negative" Falling edge, a negative voltage change. "Both"...
-
Page 218: State
® Triggers R&S Trigger Types 5.3.12 State The state trigger is a qualified edge trigger. It combines the edge trigger settings with trigger qualification. The individual settings are: ● "Slope" on page 197 ● "Pattern" on page 210 ● "Trigger Levels" on page 211 ●... - Page 219 ® Triggers R&S Trigger Types "Channel" Select the channels to be considered. For qualification, you can select all channel signals except for the trigger source. In Pattern trig- ger setup, the trigger source channel is selected by default, and you can select all other channel signals.
-
Page 220: Serial Pattern
® Triggers R&S Trigger Types You can set the trigger levels for all channels to the same value, see "Couple levels (Trigger level and hysteresis coupling)" on page 209. Additional settings: Timing "State timing" adds time limitation to the state pattern. You find this setting in the "Qual- ification"... -
Page 221: Tv/Video Trigger
® Triggers R&S Trigger Types Remote command: on page 1049 TRIGger<m>:DATatoclock:CSOurce[:VALue] on page 1056 TRIGger<m>:SPATtern:CSOurce[:VALue] Clock edge Together with the clock level, the clock edge sets the point in time when the state of the data signal is checked: "Positive" Rising edge, a positive voltage change. - Page 222 ® Triggers R&S Trigger Types The TV or video trigger is used to analyze analog baseband video signals. You can trigger on baseband video signals from standard definition and high definition stand- ards, and also on user defined signals. The instrument triggers on the line start - the horizontal sync pulse. You can trigger on all lines, or specify a line number.
- Page 223 ® Triggers R&S Trigger Types Figure 5-1: Trigger on all lines of a PAL signal with positive signal polarity, trigger level = 300 mV Standard Selects the TV standard or "Custom" for user-defined signals. HDTV standards are indicated by the number of active lines, the scanning system (p for progressive scanning, i for interlaced scanning) and the frame rate.
- Page 224 ® Triggers R&S Trigger Types "Odd fields / Triggers on the first video line of the odd or even field. These modes Even fields" are available for interlaced scanning (PAL, PAL-M, SECAM, NTSC, 1080i) and progressive segmented frame scanning (1080p/24sF). They can be used, for example, to analyze the components of a video signal.
- Page 225 ® Triggers R&S Trigger Types Remote command: on page 1059 TRIGger<m>:TV:POLarity Pulse type Sets the type of the sync pulse, either bi-level sync pulse (used in SDTV signals), or tri- level sync pulse (used in HDTV signals). Figure 5-3: Bi-level (left) and tri-level (right) sync pulses This setting is available for user-defined video signals if "Standard"...
-
Page 226: Line Trigger
® Triggers R&S Trigger Types Scan Sets the scanning system. This setting is available for user-defined video signals if "Standard" is set to "Custom". "Interlaced" Interlace scanning uses two fields to create a frame. One field con- tains all the odd lines (odd, first, or upper filed), the other contains all the even lines of the image (even, second, or lower field). -
Page 227: Holdoff
® Triggers R&S Holdoff 5.3.18 Triggering on Parallel Buses and Digital Channels Triggering on digital signals requires the Mixed Signal Option. The option is described Chapter 14, "Mixed Signal Option (MSO, R&S RTE-B1)", on page 861. For information on triggering, see Chapter 14.3.1, "Trigger Settings for Digital Signals and Parallel Buses",... -
Page 228: Noise Reject
® Triggers R&S Noise Reject "Auto" The holdoff time is calculated automatically based on the current hori- zontal scale. "Auto time scaling" defines the factor the horizontal scale is multipied with. "Auto time" shows the resulting holdoff time: Auto time = Auto time scaling * Horizontal scale. -
Page 229: Control / Action
® Triggers R&S Control / Action Hysteresis mode Selects how the hysteresis is set. "Auto" This is the recommended mode. The hysteresis is set by the instru- ment to reject the internal noise of the instrument. "Manual" The hysteresis is defined directly in absolute or relative values. Remote command: on page 1066 TRIGger<m>:LEVel<n>:NOISe[:STATe]... - Page 230 ® Triggers R&S Control / Action In addition to the settings in the dialog box, you need the RUN CONT and RUN N× SINGLE keys on the front panel to start and stop the acquisition and thus the trigger- ing. The action settings define what happens when a trigger occurs.
- Page 231 ® Triggers R&S Control / Action "Free Run" The instrument starts acquisition immediately and triggers after a very short time interval independet of the time base settings and faster than in "Auto" mode. Real triggers are ignored. Use this mode if the "Auto"...
- Page 232 ® Triggers R&S Control / Action Trigger out signal setup Defines the pulse that is provided to the TRIGGER OUTPUT connector on the rear panel. A trigger out pulse can be provided either when a trigger occurs, or when a mask test violaton occurs, or when a limit check violation in a measurement occurs.
-
Page 233: Sequence
® Triggers R&S Sequence Remote command: on page 1072 TRIGger<m>:EVENt:BEEP on page 1072 TRIGger<m>:EVENt:PRINt on page 1072 TRIGger<m>:EVENt:WFMSave 5.7 Sequence A trigger sequence consists of at least one trigger condition and additional conditions defining when the trigger occurs. The simple sequence "A only" only contains the A-trigger condition. The complex trigger sequence "A →... -
Page 234: Extern
® Triggers R&S Extern Delay Sets the time that the instrument waits after an A-trigger until it recognizes B-triggers. Remote command: on page 1069 TRIGger<m>:SEQuence:DELay B-event count Sets the number of B-trigger conditions to be fulfilled after an A-trigger. The last B-trig- ger causes the trigger event. - Page 235 ® Triggers R&S Extern Remote commands: ● on page 1073 TRIGger<m>:EXTern:OVERload ● on page 1015 TRPRobe:ID:PARTnumber? ● on page 999 TRPRobe:SETup:STATe? ● on page 999 TRPRobe:SETup:TYPE? ● on page 1012 TRPRobe:SETup:ATTenuation:DEFProbe ● on page 1007 TRPRobe:SETup:ATTenuation:MANual ● on page 1006 TRPRobe:SETup:ATTenuation:MODE ●...
-
Page 236: Acquisition Info
® Triggers R&S Acquisition Info ● on page 1014 TRPRobe:ID:SWVersion? ● on page 1016 TRPRobe:SETup:CAPacitance? ● on page 1016 TRPRobe:SETup:IMPedance? 5.9 Acquisition Info Access: "Trigger" menu > "Acquisition Info" Shows the current number of acquisitions that have been acquired. The count is shown for a running acquisition cycle and as well for the last stopped acquisition cycle. -
Page 237: Waveform Analysis
® Waveform Analysis R&S Zoom 6 Waveform Analysis This chapter describes general methods to check and analyze waveforms. These are: ● Zoom........................229 ● Reference Waveforms..................241 ● Mathematics......................246 ● History........................260 ● XY-diagram......................266 6.1 Zoom The zoom functions allow you to magnify a specific section of the diagram in order to view more details. - Page 238 ® Waveform Analysis R&S Zoom Figure 6-1: Numeric zoom using start and stop values – Specifying the x- and y-position of the centerpoint of the area plus a range for the x- and y-axes; the area defined by that centerpoint and the ranges is zoomed.
- Page 239 ® Waveform Analysis R&S Zoom 6.1.2 Zoom Settings The zoom area, i.e. the section to be enlarged, can be defined using two different methods: ● Using the zoom functions on the toolbar and draw the zoom area on the touch- screen ●...
- Page 240 ® Waveform Analysis R&S Zoom 6.1.2.2 Start and Stop Settings The "Start/Stop" tab allows you to specify start and stop values for the x- and y-axes. The acquired data within these ranges is zoomed. Selected diagram Indicates which of the waveform diagrams is selected for zooming. Zoom overlay Shows all zooms of a diagram in one zoom window.
- Page 241 ® Waveform Analysis R&S Zoom Remote command: on page 1081 LAYout:ZOOM:VERTical:RELative:STARt on page 1079 LAYout:ZOOM:VERTical:ABSolute:STARt Full height Uses the full diagram height for the zoom area. Only horizontal zoom settings can be changed. Position coupling Enables or disables the position coupling of coupled zooms. If position coupling is enabled and you move one zoom area, the other coupled zoom areas are moved, too, and keep their distance.
- Page 242 ® Waveform Analysis R&S Zoom Vertical Defines whether absolute or relative values are used to specify the y-axis values. Remote command: on page 1079 LAYout:ZOOM:VERTical:MODE on page 1221 SEARch:RESDiagram:VERT:MODE Position / Relative position (vertical) Defines the y-value of the centerpoint of the zoom area. Remote command: on page 1079 LAYout:ZOOM:VERTical:ABSolute:POSition...
- Page 243 ® Waveform Analysis R&S Zoom Position coupling Enables or disables the position coupling of coupled zooms. If position coupling is enabled and you move one zoom area, the other coupled zoom areas are moved, too, and keep their distance. Remote command: on page 1075 LAYout:ZOOM:POSCoupling Horizontal...
- Page 244 ® Waveform Analysis R&S Zoom To define the zoom area graphically on the touchscreen For graphical zooming, you use your finger on the screen. 1. On the toolbar, tap the "Standard Zoom" icon. 2. Touch the position that you want to define as one corner of the zoom area. Then drag your finger to the opposite corner of the zoom area.
- Page 245 ® Waveform Analysis R&S Zoom Figure 6-4: Zoom area indicated by edges Note: Tapping the zoom area toggles between area and edge adjustment. If the rectangle area is too small to select by tapping, press the CHECKMARK key in the navigation area to toggle between area adjustment and edge adjustment modes.
- Page 246 ® Waveform Analysis R&S Zoom To create a new zoom using the Zoom dialog box 1. There are two ways to create a new zoom: ● If you want to create a new, unconfigured zoom, tap the "Add" icon. ● If you want to create zoom based on an existing one, tap the "Copy"...
- Page 247 ® Waveform Analysis R&S Zoom 8. Under "Range", define the width of the zoom area. When you close the dialog box, the specified area is magnified in a new zoom dia- gram. The original diagram is displayed with the zoom area indicated as a rectan- gle.
- Page 248 ® Waveform Analysis R&S Zoom Figure 6-5: Multiple zoom diagrams. Left: separate zoom diagrams. Right: overlaid zoom To define coupled zoom areas You can define multiple zoom areas for one diagram that are coupled. If you change the size of one zoom area, the size of all coupled zoom areas is changed as well. Fur- thermore, you can couple also the position in order to move all coupled zooms at once.
-
Page 249: Reference Waveforms
® Waveform Analysis R&S Reference Waveforms If you move one of the coupled zoom areas in the diagram, all other coupled zooms are moved as well, and their distance is kept unchanged. To close the zoom diagram 1. Tap the "Delete" icon on the toolbar. 2. - Page 250 ® Waveform Analysis R&S Reference Waveforms To update a reference waveform using the toolbar icon If you often need to update a reference waveform, you can use the "Update Ref Wfm" toolbar icon. 1. Add the "Update Ref Wfm" icon to the toolbar, see Chapter 2.4.6.2, "Configuring Toolbar", on page 78.
- Page 251 ® Waveform Analysis R&S Reference Waveforms Note: Reference waveforms can be loaded only from BIN files. XML and CSV for- mats are meant for further processing in other applications. 5. To save the waveform to the currently selected file, tap "Save". By default, the pre- fix for reference waveform files is "RefCurve".
- Page 252 ® Waveform Analysis R&S Reference Waveforms 1/2/3/4........................244 Source ........................244 Update with selected source..................244 Show reference waveform..................244 Clear reference waveform...................244 Save to or load from file....................245 Ref 1/2/3/4 Each tab contains the settings for one of the four available reference waveforms. Source Selects the source waveform from the active waveforms of input channels, math sig- nals and other reference waveforms.
- Page 253 ® Waveform Analysis R&S Reference Waveforms Save to or load from file Enter the file name of the stored reference waveform and select the file format with the format button on the right. Double-tap the file name to open the file selection dialog box, see also Chapter 11.6, "File Selection Dialog",...
-
Page 254: Mathematics
® Waveform Analysis R&S Mathematics Note: As for all waveforms, a vertical offset of a reference waveform can be set using the vertical POSITION / REF POINT knob. This offset is independent from the refer- ence scaling offset, which is described here. If both offsets are set, their values are added up. -
Page 255: Displaying Math Waveforms
® Waveform Analysis R&S Mathematics ● Displaying Math Waveforms................. 247 ● Basic Editor......................247 ● Advanced Expressions..................250 ● Math Setup - General Settings................257 6.3.1 Displaying Math Waveforms Math waveforms can be displayed in addition to the channel and other waveforms. They also can be used for analysis, e.g. - Page 256 ® Waveform Analysis R&S Mathematics Remote command: ● on page 1088 CALCulate:MATH<m>[:EXPRession][:DEFine] 6.3.2.1 Settings in the Basic Editor Source 1 / 2.........................248 Operator........................248 Noise reject......................... 248 b..........................249 FIR: Type, Cut-Off, Characteristics................249 Envelope wfm selection....................249 Source 1 / 2 Defines the signal source to be evaluated by the math function.
- Page 257 ® Waveform Analysis R&S Mathematics To suppress noise effects during differentiation, it can be useful not to consider two directly neighboring points to calculate dx (x ). Instead, a number of samples in- between are skipped and a point a few samples further is used (e.g. x The "Basic"...
- Page 258 ® Waveform Analysis R&S Mathematics Remote command: on page 1089 CALCulate:MATH<m>:ENVSelection 6.3.2.2 Defining a Formula in the Basic Editor 1. In the "Math" menu, select "Math Setup". Alternatively, press the MATH key. 2. In the "Setup" tab, select the "Basic" tab. 3.
- Page 259 ® Waveform Analysis R&S Mathematics Remote command: ● on page 1088 CALCulate:MATH<m>[:EXPRession][:DEFine] The following tables describe the buttons of the formula editor and their usage. Table 6-1: Basics Icon Description Usage/Comment, FormulaEditor expression left bracket enclose operands comma separates operands right bracket enclose operands e / π...
- Page 260 ® Waveform Analysis R&S Mathematics Icon Description Usage/Comment, FormulaEditor expression exponentiation with base 10 Enter expression complete insert expression in Setup dialog and close the formula editor Clear clear expression in editor restart editing Delete remove selected part of expression Back Backspace remove last symbol, operator or operand to the...
- Page 261 ® Waveform Analysis R&S Mathematics Icon Description Usage/Comment, FormulaEditor expression d/dx derivation of x derivation(x,y) with x = waveform and y = number of skipped sam- ples (noise reject) ax+b scaling of x rescale(x,a,b) Table 6-5: Bit operations Icon Description Usage/Comment, FormulaEditor expression digitize convert to 0 or 1...
- Page 262 ® Waveform Analysis R&S Mathematics Table 6-8: Trigonometry ("More" keys) Icon Description Usage/Comment, FormulaEditor expression sinh hyperbolic sine sinh(x) cosh hyperbolic cosine cosh(x) tanh hyperbolic tangent tanh(x) Table 6-9: Correlation ("More" keys) Icon Description Usage/Comment, FormulaEdi- tor expression Cross correlation function of two waveforms correlation(x1, x2, biased) Measures the similarity of two waveforms as a function correlation(x1, x2, unbiased)
- Page 263 ® Waveform Analysis R&S Mathematics Equation 6-2: Unbiased correlation Mathematic background for auto correlation: Equation 6-3: Biased auto correlation Equation 6-4: Unbiased auto correlation The R&S RTE uses only the real part of the signal. Table 6-10: Filter and power ("More" keys) Icon Description Usage, comment, FormulaEditor expression...
- Page 264 ® Waveform Analysis R&S Mathematics Icon Description Usage, comment, FormulaEditor expression Characteristics of FIR filter gaussian / rectangle, see FIR filter Moving average Calculates a mean value of several adjacent sample points. The result is a smoothed waveform. The moving average uses the full data and can be used for non-peri- odic signals.
- Page 265 ® Waveform Analysis R&S Mathematics e) Insert a comma using the "," key. Insert the "b" value, i.e. the scaling offset, using the number keys. g) Insert the closing bracket using the ")" key. The resulting expression could be, for example: rescale(Ch1Wfm1,3,4) 6.3.4 Math Setup - General Settings You can define up to 4 different math waveforms.
- Page 266 ® Waveform Analysis R&S Mathematics Remote command: on page 1088 CALCulate:MATH<m>:STATe Vertical Scale Functions to set the vertical parameters of the math waveform. Note: If an FFT expression is defined, the vertical scaling for spectrum displays is available: "Vertical maximum" and "Vertical range" instead of "Vertical Scale" and "Ver- tical Offset".
- Page 267 ® Waveform Analysis R&S Mathematics "Envelope" The envelope curve of all acquired and calculated results is displayed "Average" The average of all acquired and calculated results is displayed "RMS" The root mean square of the math data is displayed. The result is the average power spectrum.
-
Page 268: History
® Waveform Analysis R&S History 6.4 History The history accesses the data of previous acquisitions and provides them for further analysis. 6.4.1 About History If a continuous acquisition runs, the captured data is stored in the sample memory and the current acquisition is processed and shown on the display. After the acquisition was stopped, the history accesses the captured samples that were stored, displays these samples as history waveforms, and makes them available for further analysis. - Page 269 ® Waveform Analysis R&S History Quick-access History dialog box When you press the HISTORY key on the front panel or tap "Display" menu > "Show history", the history mode is enabled and the quick-access "History" dialog box is dis- played. A running acquistion stops immediately. The small quick-access "History"...
- Page 270 ® Waveform Analysis R&S History Remote command: on page 1093 CHANnel<m>[:WAVeform<n>]:HISTory[:STATe] Current acq Accesses a particular acquisition in the memory to display it, or to save it. The newest acquisition always has the index "0". Older acquisition have a negative index. If a history replay is running, the field shows the number of the currently shown acquisi- tion.
- Page 271 ® Waveform Analysis R&S History Replay time per acq. Sets the display time for one acquisition. The shorter the time, the faster is the replay. The setting takes effect for history replay and the display of an Ultra Segmentation ser- ies, see Chapter 4.2.3, "Ultra Segmentation",...
- Page 272 ® Waveform Analysis R&S History Remote command: on page 1093 ACQuire:AVAilable? 6.4.3 Using History You can access the history waveforms in two ways: ● Display a particular acquisition. ● Replay all or a part of the saved waveforms to track the signal run. Furthermore, you can export history data to a file.
- Page 273 ® Waveform Analysis R&S History Alternatively, enter the number of the required acquisition in the "Current index" field. 4. Tap "Play" to start. To replay history waveforms If you want to see the complete acquisition series without any setup, simply tap "Play" in the quick-access "History"...
-
Page 274: Xy-Diagram
® Waveform Analysis R&S XY-diagram 7. If you want to write the timestamps into the data file, enable "Timestamps". 8. To save one waveform out of the history memory: a) Make sure that "Multiple Wfms" is disabled. b) Enter the number of the required acquisition in "Acq index". The newest acqui- sition in the memory always has the index "0". - Page 275 ® Waveform Analysis R&S XY-diagram Make sure to select the tab of the required XY-diagram. Enable If activated, the XY-waveform is active and shown in a diagram, or it is minimized in a signal icon. Remote command: on page 1097 WAVeform<m>:XYCurve:STATe X-source Defines the signal source that supplies the x-values of the XY-diagram.
- Page 276 ® Waveform Analysis R&S XY-diagram ● One of the waveforms of any channel ● A reference waveform ● The results of a mathematical function Remote command: on page 1098 WAVeform<m>:XYCurve:YSOurce Constant XY-ratio If enabled, the x- and y-axes maintain a constant ratio in the diagram. Remote command: on page 1097 WAVeform<m>:XYCurve:RATio...
- Page 277 ® Waveform Analysis R&S XY-diagram The diagram is converted into an XY-diagram. To set up an XY-diagram 1. On the "Display" menu, tap "XY-diagram". 2. Activate the "State" option. 3. In the "X-source" field, define the signal source that supplies the x-values of the XY-diagram.
-
Page 278: Measurements
® Measurements R&S Cursor measurements 7 Measurements Using the R&S RTE you can perform and display different measurements simultane- ously, based on the active signal or math waveforms. The color of the results in the result table corresponds with the source waveform color. The following measurement methods are available: ●... - Page 279 ® Measurements R&S Cursor measurements 7.1.1.1 Cursor Measurements on Time Based Waveforms The results of cursor measurements are displayed in a result box. For each measure- ment, a separate result box is displayed. The result box is displayed automatically when a cursor measurement is enabled. Similar to waveform diagrams, you can mini- mize the result box to a result icon on the signal bar, and display results in a separate diagram on the screen.
- Page 280 ® Measurements R&S Cursor measurements Label Description f1, f2 Frequency at the position of the vertical cursors V1, V2 Vertical values of the waveform at the position of the horizontal cursors in dB. If the cursor lines track the waveform, the measurement result is displayed. If tracking is disabled, you can change the values directly in the result box.
- Page 281 ® Measurements R&S Cursor measurements 7.1.2.1 Performing a Simple Cursor Measurement To display cursors using the toolbar 1. Select the waveform that you want to measure. 2. Tap the "Cursor" icon on the toolbar. 3. Tap the diagram where you want to set the cursors. Alternatively, you can draw a rectangle in the diagram to position the cursor lines.
- Page 282 ® Measurements R&S Cursor measurements ● Tap the icon in the result box. ● Press the CURSOR key. Otherwise, from the "Cursor" menu select "Setup". 2. Select the "Cursor Setup" tab. 3. Select the tab for the cursor set that you want to use. 4.
- Page 283 ® Measurements R&S Cursor measurements 10. Tap the "Enable" icon in the "Setup" tab to activate the cursor measurement. The cursors are displayed in the waveform diagrams of the measurement source and the "Cursor" result box is displayed. For details on cursor measurement results, see Chapter 7.1.1, "Cursors and Results of Cursor Measurements",...
- Page 284 ® Measurements R&S Cursor measurements Figure 7-2: Setup for cursor on 1 source Figure 7-3: Setup for cursor on 2 sources Cursor set (vertical tab) The settings for each cursor measurement (or cursor set) are configured on separate tabs. For each measurement, a horizontal pair of cursors, a vertical pair of cursors, or both can be displayed.
- Page 285 ® Measurements R&S Cursor measurements "Horizontal cursors" The horizontal cursors are positioned automatically along the waveform or can be positioned manually. "Vertical cursors" The vertical cursors are positioned manually. "Both horizontal and vertical cursors" The horizontal cursors are positioned automatically along the waveform or can be positioned manually.
- Page 286 ® Measurements R&S Cursor measurements Track waveform The horizontal cursors track the waveform, i.e. one cursor line indicates the actual ver- tical maximum, and the second cursor line indicates the minimum. If the waveform changes, e.g. during a running measurement, the cursors move along with it. If both horizontal and vertical cursors are displayed, the horizontal cursors are positioned to the crossing points of the vertical cursors with the waveform.
- Page 287 ® Measurements R&S Cursor measurements Show in all diagrams Shows the enabled cursor measurements in all active diagrams of the same (time/ spectrum) domain. 7.1.3.2 Cursor Labels The settings in this tab configure the display of the cursors. Cursor set (vertical tab) The settings for each cursor measurement (or cursor set) are configured on separate tabs.
- Page 288 ® Measurements R&S Cursor measurements Threshold Defines an absolute threshold as an additional condition for the peak search. Only peaks that exceed the threshold are detected. This setting is only available for spectrum waveforms. It is valid for cursor measure- ments, spectrum measurements and peak search.
- Page 289 ® Measurements R&S Cursor measurements If "Peak excursion" is 30 dB, the peaks 1 to 5 are found. If "Peak excursion" is 20 dB, also the peaks 6 to 10 are found. The cursor position is on peak 6. Remote command: on page 1107 CURSor<m>:PEXCursion on page 1128...
-
Page 290: Automatic Measurements
® Measurements R&S Automatic Measurements Remote command: on page 1106 CURSor<m>:MAXimum:LEFT 7.2 Automatic Measurements The R&S RTE can perform up to 8 automatic measurements and a quick measure- ment simultaneously. For each measurement, various measurement types are availa- ble to measure the characteristics of a source waveform. The measurement types are grouped in categories. -
Page 291: Measurement Setup In General
® Measurements R&S Automatic Measurements Statistics and long term measurements To evaluate time-dependent behavior of measurement results, you can use statistics, long term measurements, and tracks. See: Chapter 7.2.9, "Long Term Measurements and Statistics", on page 321. ● Measurement Setup in General................ - Page 292 ® Measurements R&S Automatic Measurements This section describes the settings that relate to all measurement types. Specific set- tings are described in the corresponding category chapter: ● Chapter 7.2.5.2, "Amplitude/Time Measurement Settings ", on page 303 ● Chapter 7.2.6.2, "Eye Diagram Measurement Settings", on page 310 ●...
- Page 293 ® Measurements R&S Automatic Measurements on page 1116 MEASurement<m>:RESult:EVTCount? on page 1116 MEASurement<m>:RESult:NPEak? on page 1116 MEASurement<m>:RESult:PPEak? on page 1116 MEASurement<m>:RESult:RMS? on page 1116 MEASurement<m>:RESult:STDDev? on page 1116 MEASurement<m>:RESult:WFMCount? on page 1116 MEASurement<m>:RESult[:ACTual]? on page 1115 MEASurement<m>:ARNames on page 1114 MEASurement<m>:ARES? Envelope This setting is only relevant for measurements on envelope waveforms, see...
- Page 294 ® Measurements R&S Automatic Measurements ● Using the "Measurement" icon on the toolbar: The icon starts the measurement with the lowest number. See: "To start a measurement using the toolbar icon" on page 286. ● Pressing the MEAS key on the front panel. If no measurement is running, the measurement with the lowest number is started.
-
Page 295: Measurement Results
® Measurements R&S Automatic Measurements 3. Select the measurement category, for example, "Amp/Time". 4. Select the "Measurement type". 5. Depending on the selected measurement type, further settings may be required. These settings are shown on the "Setup" tab. On the left of the tab, select the mea- surement to be configured. - Page 296 ® Measurements R&S Automatic Measurements The following additional results are available: ● Statistics You can enable stastical evaluation of the measurement results. Statistic informa- tion is provided in the result box for each measurement type. Stopping and restarting the acquisition does not reset statistics but only stops and continues them.
- Page 297 ® Measurements R&S Automatic Measurements 7.2.2.2 Result Display Settings The display settings for measurement results are set on the "Gate/Display" tab. Display settings are measurement-specific, each measurement can have its own settings. Gate settings are described in Chapter 7.2.3.1, "Gate Settings for Measurements", on page 290.
-
Page 298: Measurement Gates
® Measurements R&S Automatic Measurements 7.2.2.3 Configuring the Results Display The measurement results can be displayed in a result box, in a minimized result icon on the signal bar, or as table in a separate diagram area. For details, see Chap- ter 2.4.7, "Displaying Results",... - Page 299 ® Measurements R&S Automatic Measurements Use gate Considers the gating settings for the selected measurement and displays the gate. Remote command: on page 1147 MEASurement<m>:GATE[:STATe] Zoom coupling Zoom coupling is available if a zoom is defined. As long as "Zoom coupling" is enabled, the gate area is defined identically to the zoom area - if you change the zoom, the gate changes as well.
- Page 300 ® Measurements R&S Automatic Measurements Remote command: on page 1149 MEASurement<m>:GATE:CCOupling on page 1149 MEASurement<m>:GATE:CURSor Mode Defines whether the gate settings are configured using absolute or relative values. "Absolute" The gate is defined by absolute start and stop values. "Relative" The gate's start and stop values are defined by a percentage of the value range.
-
Page 301: Reference Levels
® Measurements R&S Automatic Measurements 3. To define the gate, use one of the following methods: ● Define the start and stop values of the gate area by entering either absolute or relative values. ● If a zoom area has already been defined for the waveform, couple the gate area to the zoom area by selecting the "Zoom coupling"... - Page 302 ® Measurements R&S Automatic Measurements measurements are based on hysteresis - the instrument returns results if the amplitude of the signal exceeds the hysteresis. Thus, measurement during the transient oscilla- tion is also possible. Reference levels and result lines can be displayed in the diagram. 7.2.4.1 Level Settings On the "Levels"...
- Page 303 ® Measurements R&S Automatic Measurements Figure 7-5: Manual reference level mode, relative level definition In manual reference level mode with relative level definition, you define the absolute values of high and low signal levels, and the reference levels as percentages of the signal amplitude.
- Page 304 ® Measurements R&S Automatic Measurements Source Defines the source for which the reference levels are defined. The source can be any signal input, math or reference waveform. Remote command: Source is defined by suffix <m> in "REFLevel" subsystem, see Chapter 17.12.11, "Ref- erence Levels", on page 1150...
- Page 305 ® Measurements R&S Automatic Measurements Sets the low signal level. The low signal level is set in manual reference level mode for absolute level definition. Remote command: on page 1153 REFLevel<m>:ABSolute:LOW Middle The middle level between high and low signal level. The value is adjusted automati- cally if you change the high or low signal levels.
- Page 306 ® Measurements R&S Automatic Measurements 2. Define the "Source", the waveform for which the reference is defined. The source can be any signal input, math or reference waveform. 3. Select automatic "Reference level mode". 4. By default, the lower reference level is defined at 10% of the signal amplitude, the middle reference level at 50% and the upper reference level at 90%.
-
Page 307: Amplitude/Time Measurements
® Measurements R&S Automatic Measurements 7.2.5 Amplitude/Time Measurements 7.2.5.1 Amplitude/Time Measurement Types The R&S RTE provides various voltage, time, area and counting measurements in the category "Amp/Time". Some measurements require reference levels to be set accord- ing to the measurement purpose. Reference levels are explained in Chapter 7.2.4, "Reference Levels",... -
Page 308: Time Measurements
® Measurements R&S Automatic Measurements Meas. type Symbol Description/Result RMS (root mean square, quadratic mean) of the waveform volt- age values Eval Eval σ σ (S-dev) Standard deviation of the waveform samples σ Eval ... - Page 309 ® Measurements R&S Automatic Measurements Table 7-2: Time measurement types Meas. type Symbol Description/Result Rise time Rise time of the left-most rising edge of the waveform. Rise time Rise is the time it takes the signal to rise from the low reference level to the high reference level.
- Page 310 ® Measurements R&S Automatic Measurements Meas. type Symbol Description/Result Pos. switching Settling time at rising edges: Time between crossing the lower PosSw reference level and the last return of the signal into the top toler- ance tube. Neg. switching Settling time at falling edges: Time between crossing the upper NegSw reference level and the last return of the signal into the bottom tolerance tube.
- Page 311 ® Measurements R&S Automatic Measurements Table 7-3: Area measurement types Meas. type Symbol Description/Result Area Area between the waveform and a reference level ("Area level", Eval Eval Eval : Evaluation time, time of a full waveform or limited by a Eval gate Cycle area...
- Page 312 ® Measurements R&S Automatic Measurements Pulses slope Sets the first slope of the pulses to be counted. The setting is available only for the "Pulse count" measurement. "Positive" Positive pulses are counted. "Negative" Negative pulses are counted. "Either" Both positive and negative pulses are counted. Remote command: on page 1121 MEASurement<m>:AMPTime:PSLope...
- Page 313 ® Measurements R&S Automatic Measurements "Slope" Sets the edge of each source, between which the delay is measured: positive, negative, or either of them. "Direction" Selects the direction for counting slopes for each source: from the beginning of the waveform, or from the end. Remote command: on page 1122 MEASurement<m>:AMPTime:DELay<n>:SLOPe...
- Page 314 ® Measurements R&S Automatic Measurements "Clock source" The "Clock source" is identical to the measurement "Source". It defines the waveform used as clock in the setup/hold measurement. "Data source" The "Data source" is identical to the "2nd Source" of the measure- ment.
- Page 315 ® Measurements R&S Automatic Measurements Trigger event Trigger level Trigger source Slope Reference level Measurement source Delay to trigger See also: Chapter 7.2.5.3, "Measuring the Delay to Trigger", on page 307 To configure the trigger conditions, use the trigger setup. To set up the slope, addi- tional settings appear in the measurements "Setup"...
-
Page 316: Eye Diagram Measurements
® Measurements R&S Automatic Measurements a) On the "Measurements Setup" tab, select "Delay to trigger" as main or addi- tional measurement. b) Select the source, that is the waveform with the delayed slope to be measured. c) Select the slope, and the reference level d) Check the trigger settings. - Page 317 ® Measurements R&S Automatic Measurements Eye top = Mean of the upper vertical histogram σtop = Standard deviation of the upper vertical histogram Eye base = Mean of the lower vertical histogram σbase = Standard deviation of the lower vertical histogram Tcrossing = First and second mean of the horizontal histogram σcrossing = Standard deviation of the horizontal histogram 7.2.6.1...
-
Page 318: Spectrum Measurements
® Measurements R&S Automatic Measurements Meas. type Description/Result Eye rise time Duration for signal to rise from 10% to 90% of the high signal level Eye fall time Duration for signal to fall from 90% to 10% of the high signal level Eye bit rate Frequency between two crossings Eye amplitude... - Page 319 ® Measurements R&S Automatic Measurements 7.2.7.1 Spectrum Measurement Types Table 7-6: Spectrum measurement types Meas. type Description, result Channel power Power integrated over the sample values defined by a center frequency and a bandwidth; based on a defined impedance; the result is given in Occupied bandwidth From the defined center frequency, symmetric sample value pairs to the left and right are integrated until a user-defined percentage of the total...
- Page 320 ® Measurements R&S Automatic Measurements For remote command parameters and suffix types see Table 17-6. 7.2.7.2 Spectrum Measurement Settings Access: "Meas" menu > "Setup" > "Spectrum" category Spectrum measurements are only available if a source in the frequency domain is selected, i.e.
- Page 321 ® Measurements R&S Automatic Measurements Threshold Defines an absolute threshold as an additional condition for the peak search. Only peaks that exceed the threshold are detected. This setting is only available for spectrum waveforms. It is valid for cursor measure- ments, spectrum measurements and peak search.
-
Page 322: Histograms And Histogram Measurements
® Measurements R&S Automatic Measurements Result labels For peak lists only: a description of each detected peak can be provided using labels in the spectrum diagram. "Enable" Displays a description for each detected peak in the spectrum dia- gram. "Label frame Defines the layout of the labels (frame, line, or none). - Page 323 ® Measurements R&S Automatic Measurements Table 7-7: Histogram measurement types Meas. type Description/Result Waveform count The number of acquisitions (waveforms) the histogram is based on Waveform samples The number of samples from the most recent acquisition included in the current histogram Histogram samples The number of samples from all acquisitions included in the current his- togram...
- Page 324 ® Measurements R&S Automatic Measurements Meas. type Description/Result Lower peak value The signal value at the maximum count value in the lower half of the histogram Maximum The highest signal value with a probability > 0 Minimum The lowest signal value with a probability > 0 Median The signal value for which half the samples lie above, the other half below in the histogram...
- Page 325 ® Measurements R&S Automatic Measurements Rough jitter evaluation using a histogram You can use a horizontal histogram to perform a rough jitter measurement. Define a histogram for a narrow amplitude range close to the trigger time. The "Max-Min" value indicates the peak jitter, while the "StdDev" value indicates the RMS jitter. In addition to histograms on channel, math and reference waveforms, histograms can be created based on statistic measurement results.
- Page 326 ® Measurements R&S Automatic Measurements Enable Enables or disables the histogram evaluation and display. The histogram settings are kept until the histogram is deleted. Source Defines the source of the histogram. Any analog channel waveform, math or reference waveform can be selected. Also measurements can serve as histogram source. In this case, the density distribution of the results of the main measurement is displayed.
- Page 327 ® Measurements R&S Automatic Measurements on page 1136 LAYout:HISTogram:VERTical:RELative:STARt on page 1136 LAYout:HISTogram:VERTical:RELative:STOP 7.2.8.3 Histogram Measurement Settings Access: "Meas" menu > "Setup" > "Hist" category You can perform measurements on histograms. Before, you have to define a histo- gram, see Chapter 7.2.8.4, "Creating a Histogram ", on page 320.
- Page 328 ® Measurements R&S Automatic Measurements 7.2.8.4 Creating a Histogram Histograms can be used to evaluate the sample value occurrences directly. They are a prerequisite for histogram measurements. The usage of histograms is also shown in a short video that is available on the instru- ment: "Tutorials >...
-
Page 329: Long Term Measurements And Statistics
® Measurements R&S Automatic Measurements 7.2.9 Long Term Measurements and Statistics The behavior of measurement results over time can be evaluated in different ways: ● Long Term Measurements ● Statistics ● Histograms on measurement results ● Track (requires option) 7.2.9.1 About Long Term Measurements and Statistics Long term measurements Long term measurements show the behavior of measurement results over a longer... - Page 330 ® Measurements R&S Automatic Measurements on page 1116 MEASurement<m>:RESult:NPEak? on page 1116 MEASurement<m>:RESult:PPEak? on page 1116 MEASurement<m>:RESult:RMS? on page 1116 MEASurement<m>:RESult:STDDev? on page 1116 MEASurement<m>:RESult:STARt? on page 1116 MEASurement<m>:RESult:STOP? on page 1116 MEASurement<m>:RESult:WFMCount? The peak and average values and the standard deviation of the long term points are also shown in the graph of the long term measurement.
- Page 331 ® Measurements R&S Automatic Measurements After a reset, new statistics are compiled beginning with the next acquired waveform. Histogram on measurement results Histograms are available not only for channel, math and reference waveforms, but also on measurement results. These histograms cannot be configured, and they are shown in a separate diagram.
- Page 332 ® Measurements R&S Automatic Measurements ME 1/2/3/4/5/6/7/8/Quick Meas For each of the eight measurements, and for the quick measurement, a subtab con- tains the configuration settings. A green dot on the tab indicates that the measurement is active. Enable (Long term) Enables long term measurement of the main measurement.
- Page 333 ® Measurements R&S Automatic Measurements Enable (Histogram) Displays a histogram of measurement results - the cumulative occurrence distribution of measurement results in a graphic. Enabling the histogram enables also the statis- tics. Remote command: on page 1141 MEASurement<m>:STATistics:HISTogram Number of bins Sets the number of bins - the number of vertical bars that build the histogram.
- Page 334 ® Measurements R&S Automatic Measurements on page 1145 MEASurement<m>:VERTical:SCALe on page 1144 MEASurement<m>:VERTical:OFFSet Multiple measurement Performs multiple measurements on the same source waveform and includes the results in evaluation. For example, it measures the rise time for all pulses in the wave- form, not only the first.
- Page 335 ® Measurements R&S Automatic Measurements Number of points Defines the total number of points to be displayed in the long term measurement dia- gram. Remote command: on page 1145 MEASurement<m>:LTMeas:COUNt Scale mode Defines when the points of a long term measurement are created. If statistics are enabled, each long term measurement point shows the statistical mean and standard deviation of the results measured during the defined period.
- Page 336 ® Measurements R&S Automatic Measurements Measurement time Defines the total duration of the long term measurement: Time/point * Number of points. This setting is only available if "Scale mode" is set to "Time". Remote command: on page 1145 MEASurement<m>:LTMeas:TIME Waveforms / point Defines the number of measured waveforms from which one point of the long term measurement is created.
-
Page 337: Quick Measurements
® Measurements R&S Quick Measurements b) Enable statistics. c) Let the measurement run and export the data when finished, see Chap- ter 11.2.5, "Long Term / Meas Histograms", on page 425. 7.2.9.5 Compiling Measurement Statistics Statistics can be compiled for all measurement types, and also for long-term measure- ments. - Page 338 ® Measurements R&S Quick Measurements 3. Tap the the diagram. The result box shows the results of the default quick measurement. 7.3.2 Quick Measurement Settings Access: "Meas" menu > "Setup" > "QuickMeas" tab In the "QuickMeas" tab, you can change the setup of the quick measurement and apply it to the "Quick Measurement"...
- Page 339 ® Measurements R&S Quick Measurements Activate Selects a further measurement type of the selected category to the QuickMeas config- uration. You can select up to 7 additional measurement types of the same category. The selected measurement types are displayed in an overview table. The main mea- surement is also listed in the overview table, but cannot be disabled here.
-
Page 340: Spectrum Analysis
® Spectrum Analysis R&S FFT Analysis 8 Spectrum Analysis The R&S RTE provides two ways of spectrum analysis: ● Basic FFT calculation, which is included in the firmware ● Spectrum analysis option R&S RTE-K18, which is hardware-supported and pro- vides a wide range of analysis possibilities, for example, spectrogram, cursor and automatic measurements. - Page 341 ® Spectrum Analysis R&S FFT Analysis The overlapping factor can be set freely. The higher the overlap factor, the more frames are used. This leads to more individual results and improves detection of transi- ent signal effects. However, it also extends the duration of the calculation. The size of the frame depends on the number of input signal values (record length), the overlap factor, and the FFT size (number of samples used for FFT calculation).
- Page 342 ® Spectrum Analysis R&S FFT Analysis Gate length Gate position Gate t[s] Center frequency f[Hz] Frequency span Restricting the result range You can restrict the results of the FFT analysis to a specified frequency range. The fre- quency range can be defined in two ways: ●...
- Page 343 ® Spectrum Analysis R&S FFT Analysis (im), the magnitude is displayed. For the "Advanced" mode FFT (φ) function, the phase is displayed. For magnitude display, you can select the scale and range of magnitudes to be dis- played. For linear scaling, the vertical value range of the input signal is used. For loga- rithmic scaling, the logarithmic power of the frequency is displayed.
- Page 344 ® Spectrum Analysis R&S FFT Analysis ● FFT -dφ*df (group delay): the negative derivative of the phase with respect to fre- quency; useful to measure phase distortion 8.1.2 Configuring Spectrum Waveforms During FFT analysis, a signal in the time domain is converted to a spectrum of frequen- cies.
- Page 345 ® Spectrum Analysis R&S FFT Analysis To configure the spectrum of FFT analysis By default, a suitable frequency range for the expected horizontal values according to the resolution bandwidth is selected, in respect to performance and precision. Span and RBW settings are coupled. If a more precise evaluation is required, for example for postprocessing in a different application, disable the coupling and change the fre- quency ranges and resolution bandwidth values as required.
- Page 346 ® Spectrum Analysis R&S FFT Analysis To restrict the input values (gating) By default, the FFT is calculated for the entire record length as defined for the data acquisition. However, you can restrict the time range for which the FFT is calculated, resulting in a restricted spectrum.
- Page 347 ® Spectrum Analysis R&S FFT Analysis 3. To eliminate phase shifts due to a limitation of the value range, enable the "Unwrap" function. 4. To suppress small phase values due to noise, enable the "Suppression" function and enter a "Threshold" value. To couple spectrum displays The settings for one or more spectrums can be coupled.
- Page 348 ® Spectrum Analysis R&S FFT Analysis Enable Math Signal..................... 340 Frequency axis (R&S RTE-K18 only)................340 Center frequency......................341 Frequency span......................341 Full span........................341 Start frequency......................341 Stop frequency......................341 Span/RBW Coupling....................341 Span/RBW Ratio......................341 Resolution BW......................342 Window type........................342 Use color table......................
- Page 349 ® Spectrum Analysis R&S FFT Analysis Center frequency Defines the position of the displayed frequency range, which is (Center - Span/2) to (Center + Span/2). The width of the range is defined using the "Frequency span" set- ting. Remote command: on page 1159 CALCulate:MATH<m>:FFT:CFRequency Frequency span...
- Page 350 ® Spectrum Analysis R&S FFT Analysis Remote command: on page 1160 CALCulate:MATH<m>:FFT:BANDwidth[:RESolution]:RATio Resolution BW Defines the resolution bandwidth. Note that the resolution bandwidth is correlated with the span, record length and acquisition time. If a constant record length is to be used, the RBW may be adapted if the required number of samples cannot be acquired.
- Page 351 ® Spectrum Analysis R&S FFT Analysis If this option is disabled, the preset color of the selected channel source is displayed, and the intensity of the specific signal color varies according to the cumulative occur- rence of the values. For spectrum diagrams, this setting corresponds to the common waveform display.
- Page 352 ® Spectrum Analysis R&S FFT Analysis Max FFTs / Acquisition Restricts the maximum number of FFTs to be calculated for each data acquisition. Due to the other parameter settings, the required number of FFTs may become very high, thus slowing performance. By restricting the number of FFTs, you can avoid perform- ance loss without changing the other parameters.
- Page 353 ® Spectrum Analysis R&S FFT Analysis Remote command: on page 1163 CALCulate:MATH<m>:FFT:FRAMe:OFACtor 8.1.3.3 FFT Gating Access: MATH > "FFT Gating" FFT gating allows you to restrict FFT analysis to a certain time base of the input signal. If no gate is used, you can define the record length as dependent on the RBW, or the RBW as dependent on the record length (which is defined by the acquisition time).
- Page 354 ® Spectrum Analysis R&S FFT Analysis └ (Relative) Start....................347 └ (Relative) Stop....................347 Record Length/RBW Coupling..................347 Required acquisition time....................347 Enable Math Signal If activated, a diagram for the defined math waveform is displayed on the touch screen. Remote command: on page 1088 CALCulate:MATH<m>:STATe Use Gate...
- Page 355 ® Spectrum Analysis R&S FFT Analysis (Relative) Start ← Gate Definition Defines the starting value for the gate. Remote command: on page 1165 CALCulate:MATH<m>:FFT:GATE:ABSolute:STARt on page 1165 CALCulate:MATH<m>:FFT:GATE:RELative:STARt on page 1148 MEASurement<m>:GATE:ABSolute:STARt on page 1148 MEASurement<m>:GATE:RELative:STARt on page 1215 SEARch:GATE:ABSolute:STARt on page 1216 SEARch:GATE:RELative:STARt (Relative) Stop ←...
- Page 356 ® Spectrum Analysis R&S FFT Analysis 8.1.3.4 FFT Y-Units Access: MATH > "FFT Y-Units" Enable Math Signal..................... 348 Magnitude unit......................348 Reference level......................349 Vertical scaling mode (Manual/Auto)................349 Vertical maximum......................349 Vertical range......................349 Range..........................349 Phase unit........................350 Unwrap........................350 Suppression........................ 350 Threshold........................
- Page 357 ® Spectrum Analysis R&S FFT Analysis "dB" Logarithmic scaling; related to reference level "dBμV, dBmV, dBV" Logarithmic scaling; related to voltage 1 μV, 1 mV, 1 V, respectively "dBps, dBns, dBμs, dBms, dBs" Logarithmic scaling; related to time 1 ps, 1 ns, 1 μs, 1 ms, 1 s, respec- tively "dBHz, dBkHz, dBMHz, dBGz"...
- Page 358 ® Spectrum Analysis R&S FFT Analysis Phase unit Defines the scaling unit for phase display. ● Radians ● Degrees Remote command: on page 1168 CALCulate:MATH<m>:FFT:PHASe:SCALe Unwrap If enabled, phase shifts due to a limitation of the value range are eliminated. Remote command: on page 1169 CALCulate:MATH<m>:FFT:PHASe:UNWRap...
-
Page 359: Spectrum Analysis (Option R&S Rte-K18)
® Spectrum Analysis R&S Spectrum Analysis (Option R&S RTE-K18) Remote command: on page 1088 CALCulate:MATH<m>:STATe Coupled Spectrum 1/2/3/4 Copies the current FFT settings of the selected math waveform (M1/M2/M3/M4) to the other selected math waveforms, and couples those waveforms. Thus, if any FFT set- ting for any of the coupled spectrums are changed, they are changed for all coupled spectrums. - Page 360 ® Spectrum Analysis R&S Spectrum Analysis (Option R&S RTE-K18) A spectrogram shows how the spectral density of a signal varies over time. The x-axis shows the frequency, the y-axis shows the time. A third dimension, the power level, is indicated by different colors. Thus you can see how the strength of the signal varies over time for different frequencies.
- Page 361 ® Spectrum Analysis R&S Spectrum Analysis (Option R&S RTE-K18) Figure 8-1: Peak list with labels for spectrum waveform For a description of the measurement settings see Chapter 7.2.7.2, "Spectrum Measurement Settings ", on page 312. ● The new THD measurements are an extension to the basic THD measurement that was already available.
- Page 362 ® Spectrum Analysis R&S Spectrum Analysis (Option R&S RTE-K18) Figure 8-2: Signal icons for the spectrogram time lines (example from the R&S RTO2000) 5. To view the spectrum for each time line in a separate diagram, drag the signal icon for one time line to the diagram area and drop it.
- Page 363 ® Spectrum Analysis R&S Spectrum Analysis (Option R&S RTE-K18) Enable......................... 355 Time line 1/2........................355 Show lines permanently....................355 Enable Enables the spectrogram display. If enabled, a new signal icon for the spectrogram is displayed in the signal bar ("SGx"). Remote command: on page 1172 CALCulate:MATH<m>:FFT:SPECtrogram:STATe Time line 1/2...
- Page 364 ® Spectrum Analysis R&S Spectrum Analysis (Option R&S RTE-K18) If disabled, only the small arrow icons are permanently visible. The line is only dis- played temporarily when you touch the arrow. User Manual 1326.1032.02 ─ 11...
-
Page 365: Mask Testing
® Mask Testing R&S About Mask Testing 9 Mask Testing 9.1 About Mask Testing Masks are used to determine whether the signal remains within specified limits, e.g. to uncover signal anomalies or test compliance and stability of digital signals. The limits are specified as "mask", which is laid over the input signal in the display. - Page 366 ® Mask Testing R&S About Mask Testing Acq. completed Number of tested acquisitions. Remote command: on page 1187 MTESt:RESult:COUNt:WAVeforms? Acq. remaining Remaining acquisitions until "Average count / Nx Single count" is reached. The value is useful if you test a specified number of acquisitions with action "Stop acquisition"...
-
Page 367: Mask Test Settings
® Mask Testing R&S Mask Test Settings Test result A test has failed if the number of sample hits or acquisition hits exceeds the limit of "Violation tolerance" hits. Remote command: on page 1187 MTESt:RESult[:RESult]? 9.2 Mask Test Settings 9.2.1 Test Definition Access: MASKS >... - Page 368 ® Mask Testing R&S Mask Test Settings Enable test Activates and deactivates the mask test. If the acquisition is running, the test starts immediately. Otherwise, the test starts when acquisition is started. The testing is stopped when acquisition is stopped, or if a stop action is configured with Stop acq..
- Page 369 ® Mask Testing R&S Mask Test Settings Remote command: on page 1174 MTESt:CONDition on page 1175 MTESt:TOLerance Save / load mask test Provides all functions to store and recall a mask test. The mask definition, defined actions and fail conditions are stored in an R&S RTE-specific xml file. "Load, Save"...
- Page 370 ® Mask Testing R&S Mask Test Settings Alternatively, you can set the corner points on the touch screen and adjust the values in the "Mask Definition" tab. To save the mask, select the "Test Definition" tab and save the mask test. Settings overview: Make sure that the correct "Mask Test"...
- Page 371 ® Mask Testing R&S Mask Test Settings ● Append a new segment at the end of the list. ● Remove the selected mask segment from the list. ● Select the region that builds the mask. – Inner region: the segment points form a closed geometrical shape, which is the mask segment.
- Page 372 ® Mask Testing R&S Mask Test Settings Factor X ← Rescale Stretches or compresses the selected mask segment in horizontal direction. The x-val- ues of all points of the selected mask segment are multiplied with this factor. Factors >1 stretch the mask segment, while factors between 0 and 1 compress it. Negative val- ues are possible and change the algebraic sign.
- Page 373 ® Mask Testing R&S Mask Test Settings Settings overview: Common settings: ● "Definition type" on page 360 ● "Source" on page 360 ● "Arithmetic" on page 143 Create mask Creates the upper and lower mask limit from the selected reference waveform. If the reference waveform was not defined before, it is created automatically from the mask test "Source"...
- Page 374 ® Mask Testing R&S Mask Test Settings Used reference Sets the reference waveform from which the mask is created. The reference waveform can be created before with "Reference Waveform Setup", or loaded from a file in the lower part of the dialog box. If the reference waveform was not defined before mask definition, it is created automatically from the mask test "Source"...
- Page 375 ® Mask Testing R&S Mask Test Settings Vertical stretch Sets the vertical scaling to stretch the mask in y-direction. The scaling axis is the hori- zontal line through the lowest value of the lower mask limit. Values > 100% stretch the mask, and values <...
- Page 376 ® Mask Testing R&S Mask Test Settings The settings in this tab define what happens when the mask test has failed or when it has passed successfully. Furthermore, you can reset all totals and results in the "Mask Test" result boxes. Most actions can be initiated either on failure or on success: ●...
- Page 377 ® Mask Testing R&S Mask Test Settings Remote command: on page 1184 MTESt:ONViolation:STOP Print Prints a screenshot including the mask test results to the printer defined in the "Print" dialog box (see Printer). Remote command: on page 1185 MTESt:ONViolation:PRINt Report Creates and saves a report using the settings defined in "File"...
- Page 378 ® Mask Testing R&S Mask Test Settings Show mask Switches the display of all mask segments on or off. Show labels Switches the display of the mask test name on or off. To change the name of the mask test, open the "Test Definition" tab, double-tap the mask test subtab and enter the new mask test name.
-
Page 379: Working With Masks
® Mask Testing R&S Working with Masks 9.3 Working with Masks This chapter explains step-by-step how mask tests are setup and preformed. For the explanation of the individual settings, see Chapter 9.2, "Mask Test Settings", on page 359. The usage of masks tests is also shown in a short video that is available on the instru- ment: "Tutorials >... - Page 380 ® Mask Testing R&S Working with Masks becomes the mask (upper region). If the line is in the lower half, the region below the line is taken (lower region). To create a mask numerically in the dialog box The settings mentioned here are described in detail in Chapter 9.2.2.1, "Mask Defini- tion: User Mask",...
- Page 381 ® Mask Testing R&S Working with Masks 3. Tap the corner points of the new mask segment on the touch screen. 4. To finish the segment and mask definition, double-tap the last point, or tap the "Select" icon on the toolbar. To delete a mask segment on the touch screen 1.
- Page 382 ® Mask Testing R&S Working with Masks 4. To add or delete a mask segment, tap the segment's row in the "Mask segments" table and tap the required button below: ● "Insert": to add a new segment before the selected segment. ●...
- Page 383 ® Mask Testing R&S Working with Masks To rescale and move a mask segment The settings mentioned here are described in detail in Chapter 9.2.2.1, "Mask Defini- tion: User Mask", on page 361. 1. Press the MASKS key on the front panel. 2.
- Page 384 ® Mask Testing R&S Working with Masks 9.3.3 Configuring the Mask and Hit Display The display of masks and mask violation is the same for all mask tests. The settings mentioned here are described in detail in Chapter 9.2.4, "Mask Display", on page 369.
- Page 385 ® Mask Testing R&S Working with Masks 9.3.4 Running a Mask Test Before you can start a mask test, make sure that the mask setup is complete: ● The mask is defined, see Chapter 9.3.1.1, "Creating User Masks", on page 371 Chapter 9.3.1.2, "Modifying User Masks", on page 372.
- Page 386 ® Mask Testing R&S Working with Masks Note: If you run the acquisition with RUN CONT, the state of the mask test is set to "Finished" when this number of acquisitions has been captured but the mask test- ing continues until the acquisition will be stopped. 9.3.5 Saving and Loading Masks Mask test definitions remain on the instrument until they are changed or deleted, or PRESET is performed.
- Page 387 ® Mask Testing R&S Working with Masks For details on history, see Chapter 6.4, "History", on page 260. User Manual 1326.1032.02 ─ 11...
-
Page 388: Search Functions
® Search Functions R&S Overview: Search Definition and Results 10 Search Functions Search functions allow you to detect and analyze specific events in the acquired data quickly and simply. You can search in various waveforms for several events at once. The search area can be limited by a gate. - Page 389 ® Search Functions R&S Overview: Search Definition and Results ● Result presentation For each search, you define how the search results are displayed: in a result table and/or in a search zoom window. ● Noise rejection Hysteresis for the selected source is defined for each search separately, in abso- lute or relative values.
-
Page 390: Search Setup
® Search Functions R&S Search Setup Navigating search results If a search zoom window has been opened, it shows the first result that was found. ► To display the zoom of a specific search result, tap the result line in the result table to set the zoom to this event. - Page 391 ® Search Functions R&S Search Setup 10.2.1 Search Criteria Access: SEARCH > "Setup" tab Enable If you enable a search and run an acquisition, the search is performed continuously on the acquired data until acquisition is stopped. If acquisition is stopped and you enable a search, the data of the last acquisition is searched.
- Page 392 ® Search Functions R&S Search Setup If the source is an FFT spectrum, you can perform a frequency marker search by using the cursor measurement and defining the peak excursion. See Chapter 7.1.3.3, "Peak Search ", on page 279. For some serial protocol options, search on a serial bus is available. For details, see the relevant chapters of the "Protocol Analysis"...
- Page 393 ® Search Functions R&S Search Setup ● Data2Clock......................391 ● State........................392 ● Pattern........................393 10.2.2.1 Edge The edge search works the same way as the edge trigger. Slope Sets the edge typ: rising edge ("Positive"), falling edge ("Negative"), or both. Remote command: on page 1193 SEARch:TRIGger:EDGE:SLOPe Trigger level...
- Page 394 ® Search Functions R&S Search Setup 10.2.2.2 Glitch The glitch search works the same way as the glitch trigger. To apply the trigger set- tings to search, tap Copy 'A Trigger'. The glitch search is not available if the search source is a digital channel. Polarity, Range, Width See trigger settings: ●...
- Page 395 ® Search Functions R&S Search Setup Polarity, Range, Width, ±Delta See trigger settings: ● "Polarity" on page 200 While the width trigger can only analyze positive or negative polarity, searching for a width is also possible for both polarities at the same time ("Either"). ●...
- Page 396 ® Search Functions R&S Search Setup Polarity, Range, Runt width, ±Delta Time limit for the runt, see trigger settings: ● "Polarity" on page 199 ● "Range" on page 202 ● "Runt width" on page 202 ● "±Delta" on page 202 Remote command: on page 1196 SEARch:TRIGger:RUNT:POLarity...
- Page 397 ® Search Functions R&S Search Setup Vertical condition Defines the run of the signal relative to the window, see "Vertical condition" on page 203. Remote command: on page 1203 SEARch:TRIGger:WINDow:RANGe Time condition, Width, ±Delta Set the time limit for the vertical condition, see ●...
- Page 398 ® Search Functions R&S Search Setup Trigger level Sets the voltage level for trigger search. The value is used for all search event types that require one trigger level. The search trigger level is search-specific, you can define different levels in different searches for the same event. Remote command: on page 1192 SEARch:TRIGger:LEVel[:VALue]...
- Page 399 ® Search Functions R&S Search Setup 10.2.2.8 Slew Rate The slew rate search settings are the same as the slew rate trigger settings. To apply the trigger settings to search, tap Copy 'A Trigger'. The slew rate search is not available if the search source is a digital channel. Polarity, Range, Slew rate, ±Delta ●...
- Page 400 ® Search Functions R&S Search Setup Clock source, Clock edge, Clock level Set the clock settings. Both "Clock level" and "Clock edge" define the starting point for calculation of the setup and hold time. Remote command: on page 1206 SEARch:TRIGger:DATatoclock:CSOurce on page 1205 SEARch:TRIGger:DATatoclock:CEDGe on page 1206...
- Page 401 ® Search Functions R&S Search Setup Clock source, Clock edge Define the clock settings. The clock signal is the waveform to be searched. Remote command: on page 1212 SEARch:TRIGger:STATe:CSOurce on page 1212 SEARch:TRIGger:STATe:CEDGe on page 1212 SEARch:TRIGger:STATe:CLEVel State pattern State settings are similar to the state trigger, but the logic combination of CH1 and CH3 is different.
- Page 402 ® Search Functions R&S Search Setup Pattern Pattern search settings are similar to the pattern trigger, but the logic combination of CH1 and CH3 is different. See also "Pattern" on page 210. . Remote command: on page 1207 SEARch:TRIGger:PATTern:A[:ENABle] on page 1208 SEARch:TRIGger:PATTern:A:LOGic on page 1209 SEARch:TRIGger:PATTern:AB:LOGic...
- Page 403 ® Search Functions R&S Search Setup 3. Tap the diagram with the waveform to be searched, or drag a rectangle on the dia- gram to define the search area. The default edge search is configured as "Search<x>" and performed. The "Search Results"...
-
Page 404: Search Gate
® Search Functions R&S Search Gate 10.3 Search Gate The gate defines the search area within the source waveform. You can use absolute or relative values to define the gate, or couple it to a previously defined zoom area. 10.3.1 Gate Settings The search gate settings are identical to those for gate areas for measurements or FFT analysis. - Page 405 ® Search Functions R&S Search Gate on page 1148 MEASurement<m>:GATE:RELative:STARt on page 1215 SEARch:GATE:ABSolute:STARt on page 1216 SEARch:GATE:RELative:STARt (Relative) Stop Defines the end value for the gate. Remote command: on page 1165 CALCulate:MATH<m>:FFT:GATE:ABSolute:STOP on page 1166 CALCulate:MATH<m>:FFT:GATE:RELative:STOP on page 1148 MEASurement<m>:GATE:ABSolute:STOP on page 1148 MEASurement<m>:GATE:RELative:STOP...
-
Page 406: Result Presentation
® Search Functions R&S Result Presentation 5. Optionally, tap "Show gate" to display the gate area in the diagram. 10.4 Result Presentation Search results are displayed in a table in the "Search Results" box. In addition, a zoom window for a selected search result can be displayed so that you can analyze the result in more detail. - Page 407 ® Search Functions R&S Result Presentation Sort ascending ← Result table By default, the results are listed in descending order, i.e. the largest value at the top. To change the sorting direction, enable "Sort ascending". Remote command: on page 1223 SEARch:RESult:SORT:ASCending Max result count Defines the maximum number of entries in the search result table.
- Page 408 ® Search Functions R&S Result Presentation on page 1221 SEARch:RESDiagram:VERT:ABSolute:SPAN on page 1222 SEARch:RESDiagram:VERT:RELative:SPAN Horizontal ← Search zoom window Defines whether absolute or relative values are used to specify the x-axis values. Remote command: on page 1076 LAYout:ZOOM:HORZ:MODE on page 1220 SEARch:RESDiagram:HORZ:MODE Position / Relative position (horizontal) ←...
-
Page 409: Noise Reject
® Search Functions R&S Noise Reject To display search zoom windows 1. In the "Search Results" box, select "Show search zoom windows". This stops a running search and a running acquisition. The zoom area is indicated in the diagram that displays the source waveform of the search. - Page 410 ® Search Functions R&S Noise Reject Hysteresis mode Defines whether values absolute or relative to the vertical scaling are used. Remote command: on page 1218 SEARch:TRIGger:LEVel:NOISe:MODE Relative / Absolute hysteresis Defines a range in absolute or relative values around the search level. If the signal jit- ters inside this range and crosses the level, no search event is detected.
-
Page 411: Data And File Management
® Data and File Management R&S Instrument Settings 11 Data and File Management This chapter describes how to manage instrument settings, and measurement results like waveform data, numeric results and screenshots. The FILE key provides functions for saving and restoring data on the instrument. A naming pattern is available and can be adjusted to simplify a clear data storage. - Page 412 ® Data and File Management R&S Instrument Settings To load a saveset quickly, you can use the "Load saveset" function on the toolbar. A graphical preview helps you to find the required settings file. If you often need to store the instrument settings, you can add the "Save settings" icon to the toolbar and use the icon to store the saveset file.
- Page 413 ® Data and File Management R&S Instrument Settings Remote command: on page 1230 MMEMory:SAV on page 1230 MMEMory:RCL Quick savesets A saveset stores the current measurement and instrument settings at the touch of a button, and reloads them in the same way. Three savesets are available for the most frequently used measurements.
- Page 414 ® Data and File Management R&S Instrument Settings A window opens and shows the screenshot of the first measurement configuration that is stored in the default Saveset directory. 2. Find the required saveset file: ● Tap the "Next" icon on the rigth or the "Previous" icon on the left to scroll the savesets of the directory.
- Page 415 ® Data and File Management R&S Instrument Settings 4. Tap the required "Recall" button in the "Quick savesets" area. The saved settings are loaded to the R&S RTE. To save settings to a saveset file Alternatively, you can add the "Save settings" icon to the toolbar and use the icon to store the saveset file to the folder and file specified in the "Settings"...
- Page 416 ® Data and File Management R&S Instrument Settings Save to or load from file The file name to load or to save the data to. By default, user preference file names have the prefix "UserPreferences_". For details, see the Save to or load from file function in the "Settings"...
- Page 417 ® Data and File Management R&S Instrument Settings Factory defaults Resets the instrument to the factory default settings, to the initial state. Factory settings comprise all instrument settings, including display, intensity and transparency settings. After laoading factory defaults, perform a self-aligment to synchronize the signal data ("File"...
-
Page 418: Waveforms And Results
® Data and File Management R&S Waveforms and Results To restore all settings to the factory defaults 1. Press the FILE key. 2. Select the "Save/Recall" tab. 3. Select the "User-defined Preset" tab. 4. Tap the "Factory defaults" button. All settings on the R&S RTE are reset to their factory-defined values. As long as no user-defined preset file is loaded and Enable user defined preset is disabled, the PRESET key also resets the instrument settings to factory defaults. - Page 419 ® Data and File Management R&S Waveforms and Results 11.2.1.1 Header Files The header files of XML and BIN waveform files are written in XML format. The header files of CSV waveform files are written in CSV format. You can open the header files and use their information for data analysis.
- Page 420 ® Data and File Management R&S Waveforms and Results Value Description InterleavedTraceCount Number of y-values saved at each sampling time. The value is usually 1. The value is 2, if min and max values are saved for each sample, for example, for envelope waveforms.
- Page 421 ® Data and File Management R&S Waveforms and Results Value Description *) If the waveform is a spectrum, the XStart and HardwareXStart values may be slightly smaller than the specified start frequency, or even get negative. The spectrum is centered on the center frequency, and the fre- quency range covered by one spectral bin is given by the SignalResolu- tion.
- Page 422 ® Data and File Management R&S Waveforms and Results Value Description History TimestampState State of the timestamps export. If on, the timestamps of each history waveform is written to the waveform data file. Math waveform BaseUnit Base unit of a mathematic waveform, for example, linear unit ViewUnit User-selected unit of a mathematic waveform, for example, logarithmic unit for a spectrum.
- Page 423 ® Data and File Management R&S Waveforms and Results Value Description UseInterSampleTriggerOffset ISO_TRG SC_POST SC_TRG 11.2.1.2 Waveform Data Files The waveform data files - indicated by *Wfm.* in the file name - contain the actual waveform data. Usually only Y-values - mostly voltage values - are written subse- quently.
- Page 424 ® Data and File Management R&S Waveforms and Results In CSV files, the data values for a given sampling time is written in one row. -1.96e-008 -0.0079051387 -0.0059288535 -0.1027668 -1.95e-008 -0.0098814229 -0.0079051387 -0.10474309 In XML format, an empty line marks the beginning of the next sample. <Data>-1.96e-008</Data>...
- Page 425 ® Data and File Management R&S Waveforms and Results No of values = InterleavedTraceCount * SignalHardwareRecordLength * No of expor- ted acquisitions If "Interleaved x/y"is enabled, one horizontal value is added per sample. The total num- ber of values in the file is: No of values = (1+ InterleavedTraceCount) * SignalHardwareRecordLength * No of exported acquisitions MSO option R&S RTE-B1:...
- Page 426 ® Data and File Management R&S Waveforms and Results Remote command: on page 1234 EXPort:WAVeform:SOURce Multi-channel export Enables or disables the export of multiple input channels. If enabled, you can export the data of selected input channels (Selected sources) into one file. If disabled, you can export one Source waveform.
- Page 427 ® Data and File Management R&S Waveforms and Results Data logging / Multiple Wfms The "Data logging / Multiple Wfms" setting enables the export of subsequent acquisi- tions of the selected waveforms. If "Export history" is disabled, the setting is named "Data logging", and it exports the data of a running Nx Single acquisition.
- Page 428 ® Data and File Management R&S Waveforms and Results To save one waveform from the history, enter the number of the required acquisition in "Acq index", and tap "Save". To save several subsequent history waveforms, enable "Multiple Wfms" and define the range of the waveforms to be saved using "Start acq"...
- Page 429 ® Data and File Management R&S Waveforms and Results Remote command: on page 1238 EXPort:WAVeform:INCXvalues Raw (ADC direct) Enables the export of data in the raw sample format of the ADC. The data format is integer 8 bit (signed 8-bit binary format). This format reduces the file size (1 Byte/ sample instead of 4 Bytes/sample in binary files) but decreases the precision of the values.
- Page 430 ® Data and File Management R&S Waveforms and Results The waveform histogram export saves data in two files. The *.Wfm.* file contains 256 or 512 absolute or relative histogram values. The other file is the header file. Contents of the header file: ●...
- Page 431 ® Data and File Management R&S Waveforms and Results Remote command: on page 1240 EXPort:HISTogram:SELect Incidence Sets the mode of exported histogram data: relative or absolute count of values. If rela- tive values are exported, the sum of all values is 1, and and the count of each value is set in relation to the sum.
- Page 432 ® Data and File Management R&S Waveforms and Results Result selection The table lists all result boxes and decode tables that are currently open, including minimized boxes and docked boxes. Select the results that you want to save to file. All results are written into one file.
- Page 433 ® Data and File Management R&S Waveforms and Results ".csv/.html" Selects the file format. ● CSV: comma-separated values. You can select the value delimiter with "CSV-Delimiter" to ensure that the file can be read by the analyzing software. The decimal separator is the point.
- Page 434 ® Data and File Management R&S Waveforms and Results Measurement histogram: The *.Wfm.* file contains 1000 absolute or relative histo- gram values. Data conversion of measurement histogram data: Using the header data, you can calculate the measurement value to which a histogram value belongs: MeasValue = (XStop - XStart) / 1000 * HistogramValueNumber + XStart Example: The 273rd histogram value is 0.491749.
- Page 435 ® Data and File Management R&S Waveforms and Results Incidence Sets the mode of exported histogram data: relative or absolute count of values. If rela- tive values are exported, the sum of all values is 1, and and the count of each value is set in relation to the sum.
- Page 436 ® Data and File Management R&S Waveforms and Results ● "To export waveform data of a running acquisition" on page 428 ● "To save the history data" on page 265 ● "To load a reference waveform" on page 243 "To save a reference waveform" on page 242 To save a waveform or a part of a waveform to a file 1.
-
Page 437: Screenshots
® Data and File Management R&S Screenshots 2. If you want to save only a section of each waveform, set the "Scope". 3. Enable "Data logging". 4. Enter the number of acquisitions to be acquired and saved in "Acq count". 5. - Page 438 ® Data and File Management R&S Screenshots Example: Reading meta information using the ExifTool Command: # exif C:\Screenshot_2016-07-14_0_110551.png Result: ExifTool Version Number : 10.20 File Name : Screenshot_2016-07-14_0_110551.png Directory : C:/ File Size : 37 kB File Modification Date/Time : 2016:07:14 11:05:51+02:00 File Access Date/Time : 2016:07:14 11:05:51+02:00 File Creation Date/Time...
- Page 439 ® Data and File Management R&S Screenshots Printer..........................431 Color..........................431 Orientation........................432 Print..........................432 Preview........................432 └ Zoom......................432 Update.........................432 White background....................... 432 Inverse color........................432 Show setup dialog.......................432 Edit..........................433 Save to file........................433 Printer Selects a configured printer to print screenshots and reports. You can use a local printer or a network printer.
- Page 440 ® Data and File Management R&S Screenshots "Black and Black and white output white" Color output "Color" Remote command: on page 1245 HCOPy:DEVice<m>:COLor Orientation Toggles the page orientation between "Landscape" and "Portrait." Remote command: on page 1245 HCOPy:PAGE:ORIentation<1..2> Print Prints the current image together with saved editing changes on the selected Printer. If the printer is configured to print to a file, "Print"...
- Page 441 ® Data and File Management R&S Screenshots Remote command: on page 1246 HCOPy:SSD Edit Opens the screenshot in the Paint application. Edit the image as necessary. You can store the file using "Save as" or print the file from Paint. Alternatively, save the file and close the Paint application to return to the "Print Setup"...
- Page 442 ® Data and File Management R&S Screenshots 6. If the current display is likely to have changed since you have opened the "Print Setup" dialog box (e.g. due to a running measurement), tap "Update image". The screenshot is updated. 7. To zoom into the screenshot, enable the "Zoom" option beneath the preview area. The image is enlarged and scrollbars are displayed to scroll through the image.
-
Page 443: Reports
® Data and File Management R&S Reports Printing on a black-and-white printer ● If you use the "White background" or "Inverse color" settings and save the image to a file, you get a grayscaled picture. The contrast of the resulting gray lines on the printout depends on waveform colors and the used printer. - Page 444 ® Data and File Management R&S Reports Printer "Printer" on page 431. Language Selects the language to be used in the report. Available languages are listed in the data sheet. Remote command: on page 1248 REPort:LANGuage Paper size Selects the paper size: A4 or US Letter. Remote command: on page 1248 REPort:PAPersize...
-
Page 445: Autonaming
® Data and File Management R&S Autonaming Logo By default, the Rohde & Schwarz logo is shown in the header of the report pages. You can switch the logo off, or select your logo to be shown. A preview of the selected log file is shown. - Page 446 ® Data and File Management R&S Autonaming Remote command: on page 1232 MMEMory:AUTonaming:PREFix Text input User-defined text to be inserted after the prefix. Remote command: on page 1232 MMEMory:AUTonaming:TEXT User text (enable) If enabled, inserts the specified user text after the prefix. Remote command: on page 1232 MMEMory:AUTonaming:USERtext...
-
Page 447: File Selection Dialog
® Data and File Management R&S File Selection Dialog To define the default file path 1. Press the FILE key. 2. Select the "Autonaming" tab. 3. Double-tap the "Default path for all file operations" field. The directory selection dialog box is opened. 4. - Page 448 ® Data and File Management R&S File Selection Dialog Path Tap the path elements to change the current folder. The default folder is defined in Default path for all file operations. You can save the data in a local folder on the instrument, to an external storage device (usually a USB flash drive), or to an folder on a connected network drive.
-
Page 449: Protocol Analysis
® Protocol Analysis R&S Basics of Protocol Analysis 12 Protocol Analysis Using the serial protocol options for the R&S RTE, you can analyze various serial pro- tocols. ● Basics of Protocol Analysis................... 441 ● I²C (Option R&S RTE-K1)..................449 ● SPI Bus (Option R&S RTE-K1)................ - Page 450 ® Protocol Analysis R&S Basics of Protocol Analysis 12.1.1 Configuration - General Settings For all protocols, configuration starts with the selection of the serial bus and the proto- col. The "Trigger Setup" button leads directly to the trigger configuration. Table 12-1: Configuration settings are protocol-specific. They are described in the related chapters: ARINC 429 Chapter 12.10.2, "ARINC 429 Configuration",...
- Page 451 ® Protocol Analysis R&S Basics of Protocol Analysis Remote command: on page 1251 BUS<m>[:STATe] 12.1.2 Display For all protocols, you can select to display the decoded signal as a table and to show the binary signal on the screen. Optionally, you can assign a label to the bus. For some protocols, the result table provides a button to show the details of the selected frame.
- Page 452 ® Protocol Analysis R&S Basics of Protocol Analysis FlexRay Chapter 12.7.4, "FlexRay Decode Results", on page 549 I²C Chapter 12.2.5, "I²C Decode Results ", on page 460 Chapter 12.6.5, "LIN Decode Results", on page 534 MDIO Chapter 12.14.5, "MDIO Decode Results", on page 700 MIL-1553...
- Page 453 ® Protocol Analysis R&S Basics of Protocol Analysis Result export Opens the "File" dialog box. Select the "Waveforms/Results" tab > "Numeric" subtab to save the decode results to file. Show details Enable "Show details" in the decode table to display a more detailed analysis of the selected frame.
- Page 454 ® Protocol Analysis R&S Basics of Protocol Analysis ● Standard lines are the lines that not qualify as comment or command lines. They build the core of the label list. Command lines Command lines define the version of the PTT file and the protocol name: ●...
- Page 455 ® Protocol Analysis R&S Basics of Protocol Analysis 7,01h,"Temperature, Pressure, and Volume" A double quote must also be enclosed in double quotes: 7,7Fh,"Highspeed ""Master"" 01" Following lines yield the same result: 7d,0x11,Pressure 7h,11h,Pressure 0x7,17d,Pressure 7,17,Pressure 12.1.3.2 Label List - General Settings In the "Label List"...
- Page 456 ® Protocol Analysis R&S Basics of Protocol Analysis Remote command: on page 1253 BUS<m>:NEWList Clear Deletes the label list from the instrument. Apply label list Activates the label list to be used for decoding. The "Label" appear in the "Decode results"...
-
Page 457: I²C (Option R&S Rte-K1)
® Protocol Analysis R&S I²C (Option R&S RTE-K1) ● Signed: Signed decimal format, available for audio protocols. The first bit repre- sents the sign. You can use the 2's complement or 1's complement format. ● Binary: 0, 1 and X (dont care) is allowed. ●... - Page 458 ® Protocol Analysis R&S I²C (Option R&S RTE-K1) The R&S RTE supports all operating speed modes: high-speed, fast mode plus, fast mode, and standard mode. Data transfer The format of a simple I²C message (frame) with 7 bit addressing consists of the fol- lowing parts: ●...
- Page 459 ® Protocol Analysis R&S I²C (Option R&S RTE-K1) Figure 12-3: 10-bit address, read access Trigger The R&S RTE can trigger on various parts of I²C messages. The data and clock lines must be connected to the input channels, triggering on math and reference waveforms is not possible.
- Page 460 ® Protocol Analysis R&S I²C (Option R&S RTE-K1) See also: Chapter 12.1.1, "Configuration - General Settings", on page 442. SDA, SCL Set the waveforms of the data line (SDA) and clock line (SCL). Usually, the source is one of the analog channels. Reference and math waveforms are available as source if the trigger source is one of the analog channels but not the serial bus.
- Page 461 ® Protocol Analysis R&S I²C (Option R&S RTE-K1) Executes the measurement of reference levels and sets the thresholds to the mid- dle reference level of the measured amplitude. ● "Technology" Selects the default threshold voltage for various signal technologies from a list. The value is set to "Manual"...
- Page 462 ® Protocol Analysis R&S I²C (Option R&S RTE-K1) 12.2.3 I²C Trigger 12.2.3.1 I²C Trigger Settings Access: TRIGGER > "Source = Serial Bus" > select "Serial bus" > "Protocol = I2C" Make sure that: ● The data source(s) of the serial bus are channel signals: PROTOCOL > "Configu- ration"...
- Page 463 ® Protocol Analysis R&S I²C (Option R&S RTE-K1) Remote command: on page 1250 BUS<m>:TYPE Trigger type Selects the trigger type for I²C analysis. "Start" Sets the trigger to the start of the message. The start condition is a falling edge on SDA while SCL is high. The trigger instant is the fall- ing edge of the SDA line.
- Page 464 ® Protocol Analysis R&S I²C (Option R&S RTE-K1) "Address and Sets the trigger to a combination of address and data condition. The data" address conditions are the same as for the "Address" trigger type, "Address setup" on page 456 and "Data setup"...
- Page 465 ® Protocol Analysis R&S I²C (Option R&S RTE-K1) For "7+1 bit", enter the seven address bits and also the R/W bit in the "Address" field. If the trigger type is "Address + data", you can set the address type "Any" to trigger on data only, regardless of the address.
- Page 466 ® Protocol Analysis R&S I²C (Option R&S RTE-K1) Position ← Data setup Operator for the data position within a frame. You can define an exact position, or a position range. Select "Any", if the position of the required pattern is not relevant. Remote command: on page 1263 TRIGger<m>:I2C:DPOPerator...
- Page 467 ® Protocol Analysis R&S I²C (Option R&S RTE-K1) If the "Protocol Configuration" dialog box is open, you can tap the "Trigger Setup" button. 2. Tap the "Source" button and select the "Serial bus" trigger source. 3. Select the serial bus that is set to I²C. 4.
- Page 468 ® Protocol Analysis R&S I²C (Option R&S RTE-K1) For general information on the "Label List" tab, see Chapter 12.1.3, "Label Lists", on page 445. Remote command: ● on page 1270 BUS<m>:I2C:FRAMe<n>:SYMBol? 12.2.5 I²C Decode Results When the configuration of the serial bus is complete, the signal can be decoded: 1.
- Page 469 ® Protocol Analysis R&S I²C (Option R&S RTE-K1) Figure 12-4: Decoded and binary I2C signal, and decode results green brackets [...] = start and end of frame blue frame header = write frame ok, with transfer direction and address value green frame header = read frame ok, with transfer direction and address value yellow = address...
- Page 470 ® Protocol Analysis R&S I²C (Option R&S RTE-K1) Figure 12-5: Decoded I2C signal with incomplete data, and decode results magenta frame = incomplete frame, missing bits in data words header dark orange frame = insufficient frame (end of acquisition before decoding has been completed), with header transfer direction and address value = insufficient data word (end of acquisition before end of word)
- Page 471 ® Protocol Analysis R&S I²C (Option R&S RTE-K1) Export of decode results You can export the decode results to a CSV or HTML file: 1. Press the FILE key on the left. 2. Select the "Waveforms/Results" tab > "Numeric" subtab. 3.
- Page 472 ® Protocol Analysis R&S I²C (Option R&S RTE-K1) Search criteria Enable the events to be searched for. Unlike triggering, where you can trigger only on one defined event, you can search for various different events in one search. "Start" Searches for the start of the message. The start condition is a falling edge on SDA while SCL is high.
- Page 473 ® Protocol Analysis R&S I²C (Option R&S RTE-K1) Remote command: on page 1276 SEARch:TRIGger:I2C:ACONdition on page 1277 SEARch:TRIGger:I2C:ADDRess on page 1277 SEARch:TRIGger:I2C:ADDTo on page 1276 SEARch:TRIGger:I2C:AMODe on page 1277 SEARch:TRIGger:I2C:ACCess Data setup: Condition, Position, Index min, Index max, Value min, Value max The data setup consists of the condition, position, and one or two index/value patterns.
- Page 474 ® Protocol Analysis R&S I²C (Option R&S RTE-K1) Remote command: on page 1277 SEARch:TRIGger:I2C:ADDO<m>:ENABle on page 1278 SEARch:TRIGger:I2C:ADDO<m>:ADRType on page 1278 SEARch:TRIGger:I2C:ADDO<m>[:VALue] on page 1279 SEARch:TRIGger:I2C:ADDO<m>:RWBit No ACK setup: Addr/W/R NACK The no ACK setup consists of the Addr/W/R NACK. The no ACK setup settings are the same as in the I2C trigger setup, see "No Ack con- ditions"...
-
Page 475: Spi Bus (Option R&S Rte-K1)
® Protocol Analysis R&S SPI Bus (Option R&S RTE-K1) ● on page 1286 SEARch:RESult:I2C:FRAMe<m>:DATA? ● on page 1284 SEARch:RESult:I2C:FRAMe<m>:ADDRess? ● on page 1283 SEARch:RESult:I2C:FRAMe<m>:AACCess? ● on page 1284 SEARch:RESult:I2C:FRAMe<m>:ACCess? ● on page 1284 SEARch:RESult:I2C:FRAMe<m>:ACOMplete? ● on page 1284 SEARch:RESult:I2C:FRAMe<m>:ADBStart? ● on page 1285 SEARch:RESult:I2C:FRAMe<m>:ADEVice? ●... - Page 476 ® Protocol Analysis R&S SPI Bus (Option R&S RTE-K1) ● Master data input, slave data output (MISO or SDO) When the master generates a clock and selects a slave device, data may be transfer- red in either or both directions simultaneously. Figure 12-6: Simple configuration of SPI bus The data bits of a message are grouped by following criteria: ●...
- Page 477 ® Protocol Analysis R&S SPI Bus (Option R&S RTE-K1) See also: Chapter 12.1.1, "Configuration - General Settings", on page 442. SCLK Defines the settings for the clock line. SCLK source ← SCLK Sets the input channel of the clock line. Analog channels, math waveforms, and refer- ence waveforms can be used for decoding.
- Page 478 ® Protocol Analysis R&S SPI Bus (Option R&S RTE-K1) Source ← SS, MISO, MOSI Sets the input channel of the selected line. Usually, the source is one of the analog channels. Reference and math waveforms are available as source if the trigger source is one of the analog channels but not the serial bus.
- Page 479 ® Protocol Analysis R&S SPI Bus (Option R&S RTE-K1) on page 1292 BUS<m>:SPI:TECHnology on page 1251 BUS<m>:SETReflevels Bit order Defines if the data of the messages starts with msb (most significant bit) or lsb (least significant bit). The display of the decoded signal considers this setting, results are dis- played in the specified order.
-
Page 480: Spi Trigger
® Protocol Analysis R&S SPI Bus (Option R&S RTE-K1) 5. Optionally, you can enter a "Bus label" in the "Display" tab. 6. Tap the "SCLK Source" button, and select the waveform of the clock line. 7. Set the polarity (clock mode) for SCLK. 8. - Page 481 ® Protocol Analysis R&S SPI Bus (Option R&S RTE-K1) Make sure that: ● The data source(s) of the serial bus are channel signals: PROTOCOL > "Configu- ration" tab. ● The trigger sequence is set to "A only": TRIGGER > "Sequence" tab. ●...
- Page 482 ® Protocol Analysis R&S SPI Bus (Option R&S RTE-K1) Condition ← MOSI and MISO data conditions Selects the operator for the "Data" pattern: "Equal" or "Not equal". Remote command: on page 1295 TRIGger<m>:SPI:FCONdition MOSI pattern, MISO pattern ← MOSI and MISO data conditions Specify the data patterns to be found on the MOSI and/or MISO line.
- Page 483 ® Protocol Analysis R&S SPI Bus (Option R&S RTE-K1) Remote command: on page 1294 TRIGger<m>:SPI:PALignment 12.3.3.2 Triggering on SPI Prerequisites: A bus is configured for the SPI signal to be analyzed. 1. Press the TRIGGER key. 2. Tap the "Source" button and select the "Serial" trigger source. 3.
- Page 484 ® Protocol Analysis R&S SPI Bus (Option R&S RTE-K1) Figure 12-7: Decoded and binary SPI signal with SCLK, MOSI, and SS line green brackets [...] = start and end of complete frame red brackets [...] = start and end of incomplete frame yellow = word = error...
- Page 485 ® Protocol Analysis R&S SPI Bus (Option R&S RTE-K1) Column Description MOSI values Value of the MOSI data words. The data format is selected below the table. MISO values Value of the MISO data words. The data format is selected below the table. Export of decode results You can export the decode results to a CSV or HTML file: 1.
- Page 486 ® Protocol Analysis R&S SPI Bus (Option R&S RTE-K1) Type Sets the event to be searched for. "Frame start Searches for the start of the frame when slave select signal SS (SS)" changes to the active state. This type is available if the slave select line is configured in the bus setup, and the frame condition is "SS".
- Page 487 ® Protocol Analysis R&S SPI Bus (Option R&S RTE-K1) Remote command: on page 1301 SEARch:TRIGger:SPI:FCONdition on page 1301 SEARch:TRIGger:SPI:MISopattern on page 1301 SEARch:TRIGger:SPI:MOSipattern on page 1302 SEARch:TRIGger:SPI:DPOPerator on page 1302 SEARch:TRIGger:SPI:DPOSition on page 1302 SEARch:TRIGger:SPI:DPTO on page 1303 SEARch:TRIGger:SPI:PALignment 12.3.5.2 SPI Search Results The search results are listed in the search result table and marked in the waveform by blue lines.
-
Page 488: Uart / Rs232 (Option R&S Rte-K2)
® Protocol Analysis R&S UART / RS232 (Option R&S RTE-K2) Remote commands are listed in Chapter 17.17.4.5, "SPI Search Results", on page 1303. 12.4 UART / RS232 (Option R&S RTE-K2) 12.4.1 The UART / RS232 Interface The Universal Asynchronous Receiver/Transmitter UART converts a word of data into serial data, and vice versa. - Page 489 ® Protocol Analysis R&S UART / RS232 (Option R&S RTE-K2) The UART protocol has no clock for synchronization. The receiver synchronizes by means of the start and stop bits, and the bit rate that must be known to the receiver. Trigger The R&S RTE can trigger on specified parts of UART serial signals: ●...
- Page 490 ® Protocol Analysis R&S UART / RS232 (Option R&S RTE-K2) Usually, the source is one of the analog channels. Reference and math waveforms are available as source if the trigger source is one of the analog channels but not the serial bus.
- Page 491 ® Protocol Analysis R&S UART / RS232 (Option R&S RTE-K2) Remote command: on page 1309 BUS<m>:UART:BITRate on page 1309 BUS<m>:UART:BAUDrate Data bits Sets the number of data bits of a word in a range from 5 to 8 bits. Remote command: on page 1311 BUS<m>:UART:SSIZe Bit order...
- Page 492 ® Protocol Analysis R&S UART / RS232 (Option R&S RTE-K2) "Timeout" Defines a timeout between a stop bit and the next start bit. Enter the minimum time that marks the end of a packet. A new packet starts with the first start bit after the timeout. Remote command: on page 1311 BUS<m>:UART:PACKets...
- Page 493 ® Protocol Analysis R&S UART / RS232 (Option R&S RTE-K2) Type Selects the trigger type for UART analysis. "Start bit" Triggers on a start bit. The start bit is the first low bit after a stop bit. "Packet start" Triggers on the begin of a data packet. The frame start is configured with "Packets"...
- Page 494 ® Protocol Analysis R&S UART / RS232 (Option R&S RTE-K2) The setting is available if packet detection is enabled in the protocol configuration. Remote command: on page 1313 TRIGger<m>:UART:DPOPerator Index min, Index max ← Data conditions Sets the number of words before the first word of interest. These offset words are ignored.
- Page 495 ® Protocol Analysis R&S UART / RS232 (Option R&S RTE-K2) Figure 12-10: Decoded and binary UART signal blue = start and stop bits if ok = start error, stop error, parity error orange = parity bit if ok yellow = word ok magenta = word contains error The "Decode results"...
-
Page 496: Can And Can Fd (Options R&S Rte-K3 And -K9)
® Protocol Analysis R&S CAN and CAN FD (Options R&S RTE-K3 and -K9) Column Description Stop Time of the word stop (stop bit) Tx value Value of the Tx word. The data format is selected below the table. Rx value Value of the Rx word. - Page 497 ® Protocol Analysis R&S CAN and CAN FD (Options R&S RTE-K3 and -K9) Figure 12-12: Configuration for CAN FD Figure 12-13: Configuration for CAN User Manual 1326.1032.02 ─ 11...
- Page 498 ® Protocol Analysis R&S CAN and CAN FD (Options R&S RTE-K3 and -K9) See also: Chapter 12.1.1, "Configuration - General Settings", on page 442. Data Sets the source of the selected data line. Usually, the source is one of the analog channels. Reference and math waveforms are available as source if the trigger source is one of the analog channels but not the serial bus.
- Page 499 ® Protocol Analysis R&S CAN and CAN FD (Options R&S RTE-K3 and -K9) There are three ways to set the threshold: ● "Threshold" Enter the value directly in the field. ● "Set to 50%" Executes the measurement of reference levels and sets the thresholds to the mid- dle reference level of the measured amplitude.
- Page 500 ® Protocol Analysis R&S CAN and CAN FD (Options R&S RTE-K3 and -K9) For CAN FD signals, you can define the sysnchronization settings separately for the arbitration phase and data phase. To specify the bit timing, enter either "Time seg1" and "Time seg2", or directly the "Sample point".
- Page 501 ® Protocol Analysis R&S CAN and CAN FD (Options R&S RTE-K3 and -K9) 12.5.2.1 Trigger Settings Access: TRIGGER > "Source = Serial Bus" > select "Serial bus" > "Protocol = CAN or CAN / CAN FD" Make sure that: ● The data source(s) of the serial bus are channel signals: PROTOCOL >...
- Page 502 ® Protocol Analysis R&S CAN and CAN FD (Options R&S RTE-K3 and -K9) "Frame type" Triggers on a specified frame type (data, remote, error, or overload). For data and remote frames, also the identifier format is considered. For details, see: ●...
- Page 503 ® Protocol Analysis R&S CAN and CAN FD (Options R&S RTE-K3 and -K9) "Remote" Remote frames are only available in the CAN protocol. The remote frame initiates the transmission of data by another node. The frame format is the same as of data frames but without the data field.
- Page 504 ® Protocol Analysis R&S CAN and CAN FD (Options R&S RTE-K3 and -K9) Figure 12-14: Identifier setup for CAN FD "Frame type" Data frames and remote frames contain an identifier. Select the frame type to be triggered on, or select "Any" if the frame type is not relevant.
- Page 505 ® Protocol Analysis R&S CAN and CAN FD (Options R&S RTE-K3 and -K9) Remote command: on page 1325 TRIGger<m>:CAN:FDATa:FDF on page 1325 TRIGger<m>:CAN:FDATa:BRS on page 1326 TRIGger<m>:CAN:FDATa:ESI Data setup: DLC, NDB, Transfer, Condition, Data min, Data max The data setup consists of the transfer direction, the number of bytes, the condition, and one or two data patterns.
- Page 506 ® Protocol Analysis R&S CAN and CAN FD (Options R&S RTE-K3 and -K9) "DLC, NDB" "DLC" sets the Data Length Code, which defines the number of data bytes to be found. "NDB" shows the number of data bytes that is set by the DLC. DLC and NDB are different in CAN FD for DLCs >...
- Page 507 ® Protocol Analysis R&S CAN and CAN FD (Options R&S RTE-K3 and -K9) "Data index Defines the number of the first data byte at which the data pattern (min)" may start. Sets the number of the last byte at which the required data pattern "Data index (max)"...
- Page 508 ® Protocol Analysis R&S CAN and CAN FD (Options R&S RTE-K3 and -K9) A stuff count error occurs if th received stuff count value does not match the value calculated from the own stuff bit count. Only relevant for CAN FD signals in ISO standard.
- Page 509 ® Protocol Analysis R&S CAN and CAN FD (Options R&S RTE-K3 and -K9) Figure 12-17: Trigger setup to trigger on the 2nd data byte with value = E7 Figure 12-18: Data type trigger on 2nd data byte with value = E7 User Manual 1326.1032.02 ─...
- Page 510 ® Protocol Analysis R&S CAN and CAN FD (Options R&S RTE-K3 and -K9) Example: Triggering on the seventh or later data byte The CAN FD frame has 12 or more data bytes, where the value of the seventh or later data byte should be 17.
- Page 511 ® Protocol Analysis R&S CAN and CAN FD (Options R&S RTE-K3 and -K9) Figure 12-20: Data type trigger on data byte with the 7th or later byte value = 17 Example: Triggering on a data byte at a given position The CAN FD frame has 12 or more data bytes.
- Page 512 ® Protocol Analysis R&S CAN and CAN FD (Options R&S RTE-K3 and -K9) Figure 12-21: Trigger setup to trigger on data byte with value = 17 at 11th data byte location The instrument skips the first 3 data bytes and starts comparing the data pattern with the 4th data byte.
- Page 513 ® Protocol Analysis R&S CAN and CAN FD (Options R&S RTE-K3 and -K9) 12.5.3 CAN / CAN FD Label List Label list files (symbolic data files) for CAN and CAN FD protocols are available in PTT and CSV file formats, similar to other serial protocols. In additition, the R&S RTE can read and apply DBC files to the decoded signal and provides settings for symbolic trig- gering and symbolic search.
- Page 514 ® Protocol Analysis R&S CAN and CAN FD (Options R&S RTE-K3 and -K9) The usage of DBC files is described in Chapter 12.5.6, "Symbolic Trigger, Decode and Search", on page 519. 12.5.3.2 PTT and CSV Files for CAN / CAN FD Label list files are protocol-specific.
- Page 515 ® Protocol Analysis R&S CAN and CAN FD (Options R&S RTE-K3 and -K9) 11,313h,Door_Left 11,314h,Door_Right 29,01A54321h,Throttle 29,13A00FA2h,LightState 29,0630ABCDh,Engine_Status 29,03B1C002h,Airbag_Status 29,01234ABCh,NM_Gateway # ---------------------------------------------------------------------------- For general information on the "Label List" tab, see Chapter 12.1.3, "Label Lists", on page 445. Remote command: ●...
- Page 516 ® Protocol Analysis R&S CAN and CAN FD (Options R&S RTE-K3 and -K9) The color-coding of the various protocol sections and errors simplifies the interpretation of the visual display. The decode information condenses or expands, depending on the horizontal scale. Various data formats are available to show the result values. The binary results of data bytes are displayed MSB first.
- Page 517 ® Protocol Analysis R&S CAN and CAN FD (Options R&S RTE-K3 and -K9) Figure 12-24: Decoded CAN FD signal with data type = CAN_L, arbitration rate = 1 Mbps and data rate = 2 Mbps You can also load and apply industry-standard DBC files. The symbolic names from the file are applied to the display of the decoded data, see Chapter 12.5.6.2, "Symbolic Decode...
- Page 518 ® Protocol Analysis R&S CAN and CAN FD (Options R&S RTE-K3 and -K9) Figure 12-25: Decoded CAN signal with applied DBC file and "Symbolic" data in the result table Table 12-6: Content of the "Decode results" table Column Description State Overall state of the frame.
- Page 519 ® Protocol Analysis R&S CAN and CAN FD (Options R&S RTE-K3 and -K9) Column Description CRC (hex) Value of the Cyclic Redundance Check (checksum), hexadecimal value Form error cause Reason of a form error if a form error occurred Export of decode results You can export the decode results to a CSV or HTML file: 1.
- Page 520 ® Protocol Analysis R&S CAN and CAN FD (Options R&S RTE-K3 and -K9) Search Criteria Sets one criterion or an AND-combination of criteria to be searched for. If more than one criterion is selected, all criteria must be fulfilled by a frame for it to be shown in the search results.
- Page 521 ® Protocol Analysis R&S CAN and CAN FD (Options R&S RTE-K3 and -K9) "Identifier + Data" Searches for a combination of identifier and data condition. The instrument triggers at the end of the last byte of the specified data pattern. The identifier conditions are the same as for the "Identifier"...
- Page 522 ® Protocol Analysis R&S CAN and CAN FD (Options R&S RTE-K3 and -K9) The frame types are the same as in the CAN trigger setup, see "Frame type" on page 494. Remote command: on page 1341 SEARch:TRIGger:CAN:FTYPe ID type Selects the length of the identifier. "11 bit"...
- Page 523 ® Protocol Analysis R&S CAN and CAN FD (Options R&S RTE-K3 and -K9) Remote command: on page 1341 SEARch:TRIGger:CAN:ICONdition on page 1342 SEARch:TRIGger:CAN:IMIN on page 1342 SEARch:TRIGger:CAN:IMAX FD bits For standard settings "CAN FD" and "Any", you can search for CAN FD-specific bits. For details, see "FD bits"...
- Page 524 ® Protocol Analysis R&S CAN and CAN FD (Options R&S RTE-K3 and -K9) Remote command: on page 1342 SEARch:TRIGger:CAN:DCONdition on page 1342 SEARch:TRIGger:CAN:DMIN on page 1343 SEARch:TRIGger:CAN:DMAX on page 1343 SEARch:TRIGger:CAN:DLCCondition on page 1343 SEARch:TRIGger:CAN:DLC on page 1344 SEARch:RESult:CAN:FRAMe<m>:NDBYtes? Data position The data position sets the location in the data field where the instrument looks for the specified data pattern.
- Page 525 ® Protocol Analysis R&S CAN and CAN FD (Options R&S RTE-K3 and -K9) The "Show search zoom windows" function allows you to analyze the search results in more detail. Search zoom and result table are synchronized; if you select a row in the result table, this result is shown in the search zoom.
- Page 526 ® Protocol Analysis R&S CAN and CAN FD (Options R&S RTE-K3 and -K9) 2. Set the search criteria: a) Select the standard: "CAN FD". b) Select the search type: "Identifier + Data". 3. In this example, the identifier does not matter. Set the "ID type = Any". 4.
- Page 527 ® Protocol Analysis R&S CAN and CAN FD (Options R&S RTE-K3 and -K9) Figure 12-29: Search result 12.5.6 Symbolic Trigger, Decode and Search The R&S RTE can read and apply industry-standard DBC files to the decoded signal and provides settings for symbolic triggering and symbolic search. For a description of DBC files, see Chapter 12.5.3.1, "DBC files for CAN / CAN FD",...
- Page 528 ® Protocol Analysis R&S CAN and CAN FD (Options R&S RTE-K3 and -K9) The "Frame type" is automatically set to "Data", and the "Identifier" is shown for infor- mation. Specific settings for the symbolic trigger are: Message........................520 Trigger on signal......................520 Signal..........................
- Page 529 ® Protocol Analysis R&S CAN and CAN FD (Options R&S RTE-K3 and -K9) Condition Sets the operator to set a specific data pattern or symbolic value ("Equal" or "Not equal") or a data range. Remote command: on page 1326 TRIGger<m>:CAN:DCONdition Value, Value min Defines the data pattern or selects a symbolic data value.
- Page 530 ® Protocol Analysis R&S CAN and CAN FD (Options R&S RTE-K3 and -K9) Figure 12-30: Result table and decoded CAN signal with applied DBC file and zoom on EngineData message Remote command: ● on page 1355 BUS<m>:CAN:FRAMe<n>:SDATa? 12.5.6.3 Symbolic Search Access: SEARCH >...
- Page 531 ® Protocol Analysis R&S CAN and CAN FD (Options R&S RTE-K3 and -K9) If symbolic search is active, the "Frame type" is automatically set to "Data", and the "Identifier" is shown for information. Symbolic Enables the symbolic search and disables all other search criteria. Remote command: on page 1356 SEARch:TRIGger:CAN:SSYMbolic...
- Page 532 ® Protocol Analysis R&S CAN and CAN FD (Options R&S RTE-K3 and -K9) Remote command: on page 1357 SEARch:TRIGger:CAN:SYMBolic:SIGValue Condition Sets the operator to set a specific data pattern or symbolic value ("Equal" or "Not equal") or a data range. This condition is also used to search for data, see "Data setup: DLC, NDB, Condition, Data min, Data max"...
-
Page 533: Lin (Option R&S Rte-K3)
® Protocol Analysis R&S LIN (Option R&S RTE-K3) Figure 12-31: Search results table and search zoom window. Search for signal "IdleRunning" with value "Running" (bit value = 0) The figure shows the result of a search for an "EngineData" message and the signal "IdleRunning = Running"... - Page 534 ® Protocol Analysis R&S LIN (Option R&S RTE-K3) 12.6.1 The LIN Protocol This chapter provides an overview of protocol characteristics, frame format, identifiers and trigger possibilities. For detailed information, order the LIN specification on http:// www.lin-subbus.org/ (free of charge). LIN characteristics Main characteristics of LIN are: ●...
- Page 535 ® Protocol Analysis R&S LIN (Option R&S RTE-K3) You can trigger on: ● Frame start (synchronization field) ● Specific slave identifier or identifier range ● Data pattern in the message ● Wake up signal ● Checksum error (error in data), parity error (error in identifier) 12.6.2 LIN Configuration Access: PROTOCOL >...
- Page 536 ® Protocol Analysis R&S LIN (Option R&S RTE-K3) Threshold Sets the threshold value for digitization of the signal. If the signal value on the line is higher than the threshold, the signal state is high. Otherwise, the signal state is consid- ered low if the signal value is below the threshold.
-
Page 537: Lin Trigger
® Protocol Analysis R&S LIN (Option R&S RTE-K3) 12.6.3 LIN Trigger Access: TRIGGER > "Source = Serial Bus" > select "Serial bus" > "Protocol = LIN" Make sure that: ● The data source(s) of the serial bus are channel signals: PROTOCOL > "Configu- ration"... - Page 538 ® Protocol Analysis R&S LIN (Option R&S RTE-K3) "Identifier + Sets the trigger to a combination of identifier and data condition. The Data" instrument triggers at the end of the last byte of the specified data pattern. The identifier conditions are the same as for the "Identifier" trigger type, see Identifier setup: Condition, Frame ID min, Frame ID max.
- Page 539 ® Protocol Analysis R&S LIN (Option R&S RTE-K3) Remote command: on page 1365 TRIGger<m>:LIN:IDOR<n>:ENABle on page 1365 TRIGger<m>:LIN:IDOR<n>[:VALue] Data setup: Data length, Transfer, Condition, Data min, Data max The data setup consists of the transfer direction, the number of bytes, the condition, and one or two data patterns.
- Page 540 ® Protocol Analysis R&S LIN (Option R&S RTE-K3) Remote command: on page 1364 TRIGger<m>:LIN:BORDer on page 1364 TRIGger<m>:LIN:DLECondition on page 1364 TRIGger<m>:LIN:DLENgth on page 1363 TRIGger<m>:LIN:DCONdition on page 1363 TRIGger<m>:LIN:DMIN on page 1363 TRIGger<m>:LIN:DMAX Error conditions Triggers if one or more of the following errors occur: ●...
- Page 541 ® Protocol Analysis R&S LIN (Option R&S RTE-K3) @PROTOCOL_NAME = lin # ---------------------------------------------------------------------------- # Labels for LIN protocol Column order: Identifier, Label # ---------------------------------------------------------------------------- # Labels for standard addresses 0x3F,Temperature 1Ch,Left brake 20h,Right brake # Following ID is provided as integer 33,Mirror 0x37,Indoor lights # Labels for reserved addresses...
- Page 542 ® Protocol Analysis R&S LIN (Option R&S RTE-K3) 12.6.5 LIN Decode Results When the configuration of the serial bus is complete, the signal can be decoded: 1. In the "Protocol" dialog > "Configuration" tab, enable "Decode". 2. In the "Protocol" dialog > "Display" tab, select additional result display settings: "Show decode table"...
- Page 543 ® Protocol Analysis R&S LIN (Option R&S RTE-K3) grey = data bytes purple = parity bit, or checksum ok = error in frame ID, or checksum, or parity bit Figure 12-34: Decoded frame with checksum error (frame No 1 in figure above) Table 12-7: Content of the "Decode results"...
- Page 544 ® Protocol Analysis R&S LIN (Option R&S RTE-K3) To search on decoded data, set the search "Source" to the serial bus that is configured for the protocol to be analyzed. See also Chapter 10, "Search Functions", on page 380. 12.6.6.1 LIN Search Setup Access: SEARCH >...
- Page 545 ® Protocol Analysis R&S LIN (Option R&S RTE-K3) "Wakeup Searches for wakeup frames. frame" Identifies various errors in the frame, see "Error conditions" "Error condi- tion" on page 532. Remote command: on page 1374 SEARch:TRIGger:LIN:SSOFrame on page 1374 SEARch:TRIGger:LIN:SFIDentifier on page 1374 SEARch:TRIGger:LIN:IDENtifieror on page 1375 SEARch:TRIGger:LIN:SIDData...
- Page 546 ® Protocol Analysis R&S LIN (Option R&S RTE-K3) Remote command: on page 1377 SEARch:TRIGger:LIN:DCONdition on page 1377 SEARch:TRIGger:LIN:DMIN on page 1378 SEARch:TRIGger:LIN:DMAX on page 1378 SEARch:TRIGger:LIN:DLECondition on page 1379 SEARch:TRIGger:LIN:DLENgth on page 1378 SEARch:TRIGger:LIN:BORDer Identifier OR setup: Monitor, Frame ID The identifier OR setup consists of the monitor and frame ID.
-
Page 547: Flexray (Option R&S Rte-K4)
® Protocol Analysis R&S FlexRay (Option R&S RTE-K4) on page 1380 SEARch:TRIGger:LIN:ERRPattern on page 1380 SEARch:TRIGger:LIN:CRCDatalen on page 1381 SEARch:TRIGger:LIN:STANdard 12.6.6.2 LIN Search Results The search results are listed in the search result table and marked in the waveform by blue lines. - Page 548 ® Protocol Analysis R&S FlexRay (Option R&S RTE-K4) 12.7.1 FlexRay Configuration Access: PROTOCOL > "Configuration" tab > "Protocol" = FlexRay Make sure that the tab of the correct serial bus is selected on the left side. See also: Chapter 12.1.1, "Configuration - General Settings", on page 442.
- Page 549 ® Protocol Analysis R&S FlexRay (Option R&S RTE-K4) Remote command: on page 1386 BUS<m>:FLXRay:SRCType Data Sets the input channel of the bus signal, or of the data line in case of a "Logic" source type. Usually, the source is one of the analog channels. Reference and math wave- forms are only available if the trigger source is one of the input channels but not the serial bus.
- Page 550 ® Protocol Analysis R&S FlexRay (Option R&S RTE-K4) Idle Idle Threshold high Bus plus 2.5 V Threshold low Threshold high Bus minus 2.5 V Threshold low Threshold high BP - BM Threshold low For measurements inside the FlexRay node (with "Source type" = "Logic"), each line requires its threshold level.
-
Page 551: Flexray Trigger
® Protocol Analysis R&S FlexRay (Option R&S RTE-K4) Remote command: on page 1389 BUS<m>:FLXRay:POLarity Bit rate Selects the number of transmitted bits per second from a list. Remote command: on page 1389 BUS<m>:FLXRay:BITRate Channel Selects the FlexRay channel on which the signal is measured, either cahnnel A or channel B. - Page 552 ® Protocol Analysis R&S FlexRay (Option R&S RTE-K4) Make sure that: ● The data source(s) of the serial bus are channel signals: PROTOCOL > "Configu- ration" tab. ● The trigger sequence is set to "A only": TRIGGER > "Sequence" tab. ●...
- Page 553 ® Protocol Analysis R&S FlexRay (Option R&S RTE-K4) "Null frame" Indicates a frame without usable data. "Sync frame" Indicates that the frame is used for synchronization of the FlexRay system. Only sync nodes can send this frame type. "Startup frame" Indicates a startup frame used for startup of the network. Only spe- cific start nodes can send this frame type.
- Page 554 ® Protocol Analysis R&S FlexRay (Option R&S RTE-K4) Remote command: on page 1394 TRIGger<m>:FLXRay:PCONdition on page 1395 TRIGger<m>:FLXRay:PMIN on page 1395 TRIGger<m>:FLXRay:PMAX Cycle count (min, max), Step The cycle count contains the number of the current FlexRay cycle. Indica- Payload Cycle Frame ID Header CRC...
- Page 555 ® Protocol Analysis R&S FlexRay (Option R&S RTE-K4) "Condition" Sets the operator to set a specific data pattern ("Equal" or "Not equal") or a data range. Select "Off", if the data pattern is not relevant for the trigger condition. "Data (min/ Enter the bytes in msb first bit order.
- Page 556 ® Protocol Analysis R&S FlexRay (Option R&S RTE-K4) 12.7.3 FlexRay Label List Label lists are protocol-specific. A FlexRay label file contains four values for each iden- tifier: ● "ID / Addr": number of the slot in which the frame is transmitted ●...
- Page 557 ® Protocol Analysis R&S FlexRay (Option R&S RTE-K4) For general information on the "Label List" tab, see Chapter 12.1.3, "Label Lists", on page 445. Remote command: ● on page 1401 BUS<m>:FLXRay:FRAMe<n>:SYMBol? 12.7.4 FlexRay Decode Results When the configuration of the serial bus is complete, the signal can be decoded: 1.
- Page 558 ® Protocol Analysis R&S FlexRay (Option R&S RTE-K4) Figure 12-35: FlexRay - decoded static slot Data is decoded and displayed in the order of its reception. The "Decode results" box shows the detailed decoded data for each frame as it is received. Enable "Show details"...
- Page 559 ® Protocol Analysis R&S FlexRay (Option R&S RTE-K4) Figure 12-36: FlexRay - decoded dynamic slot and results table Table 12-8: Content of the "Decode results" table Column Description State Overall state of the frame. "Insuffcient waveform length" indicates that the frame is not completely contained in the acquisition.
- Page 560 ® Protocol Analysis R&S FlexRay (Option R&S RTE-K4) Figure 12-37: FlexRay - decode results with applied label list Export of decode results You can export the decode results to a CSV or HTML file: 1. Press the FILE key on the left. 2.
- Page 561 ® Protocol Analysis R&S FlexRay (Option R&S RTE-K4) Before you can start the search, you have to configure the bus correctly and acquire decoded data. To search on decoded data, set the search source to "SerBus" for the configured pro- tocol.
- Page 562 ® Protocol Analysis R&S FlexRay (Option R&S RTE-K4) "Identifier+data" Searches for the decoded frame content, on header and payload data: ● Indicator bits, see "Indicator bits" on page 554 ● Frame identifier, see "Frame ID (min/max)" on page 555 ● Payload length, see "Payload length (min/max)"...
- Page 563 ® Protocol Analysis R&S FlexRay (Option R&S RTE-K4) on page 1414 SEARch:TRIGger:FLXRay:SYFRame on page 1414 SEARch:TRIGger:FLXRay:STFRame Frame ID (min/max) The frame ID contains the number of the slot in which the frame is transmitted. Each frame ID occurs only once during a FlexRay cycle. The setup conditions are the same as in the FlexRay trigger setup, see "Frame ID (min/max)"...
- Page 564 ® Protocol Analysis R&S FlexRay (Option R&S RTE-K4) Condition, Data (min, max) - Data setup Specifies the data bit pattern to be found in the payload segment. The starting point of the pattern is defined by "Position, Index (min, max) - Data setup" on page 555.
-
Page 565: Audio Signals (Option R&S Rte-K5)
® Protocol Analysis R&S Audio Signals (Option R&S RTE-K5) 12.7.5.2 FlexRay Search Results The search results are listed in the search result table and marked in the waveform by blue lines. The "Show search zoom windows" function allows you to analyze the search results in more detail. - Page 566 ® Protocol Analysis R&S Audio Signals (Option R&S RTE-K5) 12.8.1 Audio Protocols All audio protocols use 3 lines: ● The clock line generates the bit clock. ● The word select line (WS, also known as word clock) defines the frame start and the maximum length of the data word.
- Page 567 ® Protocol Analysis R&S Audio Signals (Option R&S RTE-K5) 12.8.1.3 Right Justified Data Format The right-justified data format is similar to the left-justified, but the last byte of the word in the frame is aligned with the trailing edge of the word select pulse. Thus the audio word is right-aligned within the frame.
- Page 568 ® Protocol Analysis R&S Audio Signals (Option R&S RTE-K5) Specific settings for I²S standard signals are: ● "Channel order" on page 563 ● "Word length" on page 563 ● "Bit order" on page 563 ● For left-justified data: "Channel offset" on page 563 ●...
- Page 569 ® Protocol Analysis R&S Audio Signals (Option R&S RTE-K5) Make sure that the tab of the correct serial bus is selected on the left side. Audio Variant Selects the protocol variant of the audio signal. The configuration possibilities exceed the definitions of the standards. "I2S Standard"...
- Page 570 ® Protocol Analysis R&S Audio Signals (Option R&S RTE-K5) For triggering on a serial bus, analog or digital channel sources are required. Remote command: on page 1422 BUS<m>:I2S:CLOCk:SOURce SCLK Polarity Sets th polarity of the clock signal, that is the edge at which the instrument samples the data on the data line.
- Page 571 ® Protocol Analysis R&S Audio Signals (Option R&S RTE-K5) Threshold setup Sets the threshold value for digitization of signals for each line. If the signal value on the line is higher than the threshold, the signal state is high. Otherwise, the signal state is considered low if the signal value is below the threshold.
- Page 572 ® Protocol Analysis R&S Audio Signals (Option R&S RTE-K5) #TDM CHs Sets the number of channels transmitted on the TDM audio line. Remote command: on page 1426 BUS<m>:I2S:CHANnel:TDMCount Frame offset Sets the number of bits between the frame start and the start of the first channel of a TDM audio line.
- Page 573 ® Protocol Analysis R&S Audio Signals (Option R&S RTE-K5) Make sure that: ● The data source(s) of the serial bus are channel signals: PROTOCOL > "Configu- ration" tab. ● The trigger sequence is set to "A only": TRIGGER > "Sequence" tab. ●...
- Page 574 ® Protocol Analysis R&S Audio Signals (Option R&S RTE-K5) "Word select" Triggers on the selected edge of the WS line, that is, on the begin- ning of the left or right channel (I²S, left- and right-justified). For TDM signals, it triggers on the selected edge of the FSYNC line - on the beginning of a TDM frame.
- Page 575 ® Protocol Analysis R&S Audio Signals (Option R&S RTE-K5) "Min data" Defines the data pattern. The data length is limited to the word length. Enter the pattern using the bit order defined in the signal configura- tion. X (don't care) is not allowed. Usually, audio words are signed numbers in 2's complement format.
- Page 576 ® Protocol Analysis R&S Audio Signals (Option R&S RTE-K5) 12.8.4 Audio Decode Results When the configuration of the serial bus is complete, the signal can be decoded: 1. In the "Protocol" dialog > "Configuration" tab, enable "Decode". 2. In the "Protocol" dialog > "Display" tab, select additional result display settings: "Show decode table"...
- Page 577 ® Protocol Analysis R&S Audio Signals (Option R&S RTE-K5) green = frame blue = left channel violet = right channel orange = frame/channel is not completely contained in the acquisition = error Table 12-9: Content of the "Decode results" table Column Description Frame Start...
- Page 578 ® Protocol Analysis R&S Audio Signals (Option R&S RTE-K5) Table 12-10: Content of the "Decode results" table Column Description Frame Start Time of the frame start Frame State Overall state of the frame. "Insuffcient waveform length" indicates that the frame is not completely contained in the acquisition.
- Page 579 ® Protocol Analysis R&S Audio Signals (Option R&S RTE-K5) Figure 12-42: Tracks of left and right channel of I²S standard signal The track is a special measurement waveform, so it can be used for further analysis like cursor measurements and zoom. The instrument uses the bus data format to interpret audio data ("Display"...
- Page 580 ® Protocol Analysis R&S Audio Signals (Option R&S RTE-K5) Figure 12-43: Track of all 8 channels of a TDM signal Displaying and Configuring a Track To get a first impression of the track, you can display it quickly. For further analysis, some configuration settings are available.
- Page 581 ® Protocol Analysis R&S Audio Signals (Option R&S RTE-K5) c) Adjust "Vertical scale" and "Vertical offset". Track Settings in Protocol Setup You can enable the track waveforms in the protocol display settings. As the track is based on measurement, you can use the "Measurement" dialog box alternatively, see "Track Enabling in Measurement Setup"...
- Page 582 ® Protocol Analysis R&S Audio Signals (Option R&S RTE-K5) on page 1434 BUS<m>:I2S:TRACk:TD6Ch on page 1435 BUS<m>:I2S:TRACk:TD7Ch on page 1435 BUS<m>:I2S:TRACk:TD8Ch Track and Trend Settings in Measurement Setup As track and trend are based on measurements, the main settings are available in the "Measurement"...
- Page 583 ® Protocol Analysis R&S Audio Signals (Option R&S RTE-K5) To set the vertical scale of the track waveform, use the measurement scale settings on "LongTerm/Track" tab, see "Meas scaling" on page 325. Enable (Track) Enables the track measurement and displays the track of the selected waveform. The track functionality requires at least one option: ●...
- Page 584 ® Protocol Analysis R&S Audio Signals (Option R&S RTE-K5) Figure 12-44: Trend (Diagram3) and track of an audio signal Displaying and Configuring the Trend If an audio bus is configured, the MEAS key and the "Measurement" icon can identify the bus and preconfigure the measurement. The following procedure describes the complete trend setup using the "Meas"...
- Page 585 ® Protocol Analysis R&S Audio Signals (Option R&S RTE-K5) 5. Select the "Long term/Track" tab. 6. Tap "Horizontal scaling". 7. Set the scale mode to "Measurements" and the number of "Measurements/point" to 8. Tap "Long term/Track". 9. Set the "Vertical scaling" to "Continuous auto scale". 10.
-
Page 586: Option R&S Rte-K6)
® Protocol Analysis R&S MIL-1553 (Option R&S RTE-K6) An empty trend diagram is displayed. 11. Start continuous acquisition. The trend fills up with measurement points from left to right. 12. If you want to change the vertical scaling of the trend curve, disable "Continuous auto scale"... - Page 587 ® Protocol Analysis R&S MIL-1553 (Option R&S RTE-K6) Command Word Figure 12-45: Structure of a command word The format of a command word consists of the following parts (see Figure 12-45): ● Sync: an invalid Manchester waveform. ● Remote Terminal (RT) Address: the unique address of the corresponding RT. ●...
- Page 588 ® Protocol Analysis R&S MIL-1553 (Option R&S RTE-K6) Status Word Figure 12-47: Structure of a status word The format of a status word consists of the following parts (see Figure 12-47): ● Sync: an invalid Manchester waveform. ● Remote Terminal (RT) Address: the unique address of the corresponding RT. ●...
- Page 589 ® Protocol Analysis R&S MIL-1553 (Option R&S RTE-K6) 12.9.2 MIL-STD-1553 Configuration 12.9.2.1 MIL-STD-1553 Configuration Settings Access: PROTOCOL > "Configuration" tab > "Protocol" = MIL-STD-1553 Make sure that the tab of the correct serial bus is selected on the left side. See also: Chapter 12.1.1, "Configuration - General Settings",...
- Page 590 ® Protocol Analysis R&S MIL-1553 (Option R&S RTE-K6) Thresholds Threshold values are used for digitization of the signal. Sets the threshold value for digitization of signals for each line. If the signal value on the line is higher than the threshold, the signal state is high (1 or true for the boolean logic).
- Page 591 ® Protocol Analysis R&S MIL-1553 (Option R&S RTE-K6) on page 1447 TRIGger<m>:MILStd:MAXResponse:BITS on page 1447 TRIGger<m>:MILStd:MAXResponse:SELect 12.9.2.2 Configuring MIL-STD-1553 For configuration assign the line to the input channel, set the threshold and the timing conditions. For details on configuration settings, see Chapter 12.9.2.1, "MIL-STD-1553 Configura- tion Settings",...
- Page 592 ® Protocol Analysis R&S MIL-1553 (Option R&S RTE-K6) Trigger Type Selects the trigger type for MIL-STD-1553 analysis. "Sync" Triggers on a sync impulse. "Word" Triggers on the selected word type. "Data Word" Triggers on a specified data word or data word range. "Command/ Status Word"...
- Page 593 ® Protocol Analysis R&S MIL-1553 (Option R&S RTE-K6) "Condition" Defines the operator to set a specific RTA ("Equal" or "Not equal") or an RTA range. "RTA Min/ Defines the bit pattern of the RTA. RTA" In binary format, use the following characters: 1; 0; or X (don't care). The bit pattern editor helps you to enter the pattern in any format, see Chapter 12.1.4, "Bit Pattern Editor",...
- Page 594 ® Protocol Analysis R&S MIL-1553 (Option R&S RTE-K6) Data Index The MIL-MIL-STD-1553 standard defines the length of a message to a series of up to 32 words. Data index sets the range within this series of the data words that is consid- ered for the analysis.
- Page 595 ® Protocol Analysis R&S MIL-1553 (Option R&S RTE-K6) Subaddress/ Mode The subaddress/mode setup consists of the condition and one or two subaddress/ mode patterns. "Condition" Defines the operator to set a specific subaddress/mode ("Equal" or "Not equal") or a subaddress range. "Subaddress Min / Subaddress/Mode"...
- Page 596 ® Protocol Analysis R&S MIL-1553 (Option R&S RTE-K6) Remote command: on page 1441 TRIGger<m>:MILStd:CMD:CCONdition on page 1442 TRIGger<m>:MILStd:CMD:CMAX on page 1442 TRIGger<m>:MILStd:CMD:CMIN T/R (Transmit/receive) Toggles the data direction of the selected command: 1 (transmit), 0 (receive), or X (either). Remote command: on page 1443 TRIGger<m>:MILStd:CMD:TR Status Flags...
- Page 597 ® Protocol Analysis R&S MIL-1553 (Option R&S RTE-K6) Remote command: on page 1447 TRIGger<m>:MILStd:ERRor:SYNC Manchester Coding Error ← Error Condition Triggers if there is an error in the Manchester coding of the signal. Remote command: on page 1446 TRIGger<m>:MILStd:ERRor:MANChester Parity Error ← Error Condition Checks the parity of every word and triggers if the parity is even.
- Page 598 ® Protocol Analysis R&S MIL-1553 (Option R&S RTE-K6) 1. Press the TRIGGER key. 2. Tap the "Source" button and select the "Serial" trigger source. 3. Select the serial bus that is set to MIL-STD-1553. 4. Select the "Trigger type". 5. For more complex trigger types, enter the data pattern conditions. For details, see Chapter 12.9.3.1, "Trigger Settings MIL-STD-1553",...
- Page 599 ® Protocol Analysis R&S MIL-1553 (Option R&S RTE-K6) 12.9.5 MIL-STD-1553 Decode Results When the configuration of the serial bus is complete, the signal can be decoded: 1. In the "Protocol" dialog > "Configuration" tab, enable "Decode". 2. In the "Protocol" dialog > "Display" tab, select additional result display settings: "Show decode table"...
- Page 600 ® Protocol Analysis R&S MIL-1553 (Option R&S RTE-K6) Column Description Info The hexadecimal value of the 9th to 1th bit of a command/status word Label Symbolic label name defined in the label list Data The values of the data bytes Export of decode results You can export the decode results to a CSV or HTML file: 1.
- Page 601 ® Protocol Analysis R&S MIL-1553 (Option R&S RTE-K6) Type The search criterion is defined by "Type". All trigger types are also available for search. Additional search parameters are provided under "Detailed Search Parameter Setup". "Sync" Searches for a sync impulse. "Word"...
- Page 602 ® Protocol Analysis R&S MIL-1553 (Option R&S RTE-K6) Remote command: on page 1454 SEARch:TRIGger:MILStd:TYPE Sync Type / Word Type Searches for a sync impulse/ word type. You can search for "Command/Status", "All" or "Data" sync pulses/ word types. Remote command: on page 1459 SEARch:TRIGger:MILStd:TPSPecifier Remote terminal address setup: Condition, RTA...
- Page 603 ® Protocol Analysis R&S MIL-1553 (Option R&S RTE-K6) Remote command: on page 1456 SEARch:TRIGger:MILStd:DATA:DCONdition on page 1456 SEARch:TRIGger:MILStd:DATA:DMIN on page 1457 SEARch:TRIGger:MILStd:DATA:DMAX Data index setup: Condition, Index min, Index max The data index setup consists of the condition and one or two index patterns. The data index setup settings are the same as in the MIL trigger setup, see "Data Index"...
- Page 604 ® Protocol Analysis R&S MIL-1553 (Option R&S RTE-K6) The subaddress/mode setup settings are the same as in the MIL trigger setup, see "Subaddress/ Mode" on page 587. Remote command: on page 1456 SEARch:TRIGger:MILStd:CMD:SCONdition on page 1456 SEARch:TRIGger:MILStd:CMD:SMIN on page 1457 SEARch:TRIGger:MILStd:CMD:SMAX Data word count / Mode code setup: Condition, Word count min, Word count The data word count/mode code setup consists of the condition and one or two pat-...
- Page 605 ® Protocol Analysis R&S MIL-1553 (Option R&S RTE-K6) Remote command: on page 1458 SEARch:TRIGger:MILStd:STATus:BCReceived on page 1458 SEARch:TRIGger:MILStd:STATus:BUSY on page 1459 SEARch:TRIGger:MILStd:STATus:DBCaccept on page 1459 SEARch:TRIGger:MILStd:STATus:INSTrument on page 1459 SEARch:TRIGger:MILStd:STATus:MERRor on page 1459 SEARch:TRIGger:MILStd:STATus:SREQuest on page 1459 SEARch:TRIGger:MILStd:STATus:SUBSystem on page 1459 SEARch:TRIGger:MILStd:STATus:TERMinal Error Condition Selects the error type to be searched for.
- Page 606 ® Protocol Analysis R&S MIL-1553 (Option R&S RTE-K6) For an introduction to search results, see: ● Chapter 10.1.2, "Search Results", on page 381 ● Chapter 10.4, "Result Presentation", on page 398 Figure 12-49: Results of a search for all data words (any RTA and any data pattern) Remote commands: ●...
-
Page 607: Arinc 429 (Option R&S Rte-K7)
® Protocol Analysis R&S ARINC 429 (Option R&S RTE-K7) 12.10 ARINC 429 (Option R&S RTE-K7) 12.10.1 ARINC 429 Basics The ARINC 429 is a specification that defines the characteristics of an avionic data bus used on commercial and transport aircraft. In an ARINC 429 system, a single transmitter/source is connected to 1-20 receivers/ sinks on one twisted wire pair. - Page 608 ® Protocol Analysis R&S ARINC 429 (Option R&S RTE-K7) 12.10.2 ARINC 429 Configuration 12.10.2.1 ARINC 429 Configuration Settings Access: PROTOCOL > "Configuration" tab > "Protocol" = ARINC 429 Make sure that the tab of the correct serial bus is selected on the left side. See also: Chapter 12.1.1, "Configuration - General Settings",...
- Page 609 ® Protocol Analysis R&S ARINC 429 (Option R&S RTE-K7) Remote command: on page 1464 BUS<m>:ARINc:POLarity Thresholds Sets the threshold value for digitization of the data signal. If the signal value on the line is higher than the threshold, the signal state is high (1 or true for the boolean logic). Otherwise, the signal state is considered low (0 or false) if the signal value is below the threshold.
- Page 610 ® Protocol Analysis R&S ARINC 429 (Option R&S RTE-K7) 12.10.2.2 Configuring ARINC 429 Signals For configuration assign the line to the input channel, set the threshold and the timing conditions. For details on configuration settings, see Chapter 12.10.2.1, "ARINC 429 Configuration Settings", on page 600.
- Page 611 ® Protocol Analysis R&S ARINC 429 (Option R&S RTE-K7) 12.10.3.2 ARINC 429 Trigger Settings Access: TRIGGER > "Source = Serial Bus" > select "Serial bus" > "Protocol = ARINC 429" Make sure that: ● The data source(s) of the serial bus are channel signals: PROTOCOL > "Configu- ration"...
- Page 612 ® Protocol Analysis R&S ARINC 429 (Option R&S RTE-K7) Remote command: on page 1466 TRIGger<m>:ARINc:TYPE Label + Data Label setup: Condition, Label Min, Label Max ← Label + Data The label setup consists of the condition and one or two label patterns. "Condition"...
- Page 613 ® Protocol Analysis R&S ARINC 429 (Option R&S RTE-K7) SDI / SSM ← Label + Data Sets the values for the source/destination identifier (SDI) and the sign/status matrix (SSM) bits. Remote command: on page 1469 TRIGger<m>:ARINc:SDI on page 1469 TRIGger<m>:ARINc:SSM Error Conditions Specifies the error conditions to be triggered on.
- Page 614 ® Protocol Analysis R&S ARINC 429 (Option R&S RTE-K7) 12.10.4 ARINC 429 Label List Label lists are protocol-specific. An ARINC 429 label file contains two values for each identifier: ● "Arinc Label": the Arinc 429 label value, that identifies the data type and the param- eters associated with it.
- Page 615 ® Protocol Analysis R&S ARINC 429 (Option R&S RTE-K7) 2. In the "Protocol" dialog > "Display" tab, select additional result display settings: "Show decode table" and "Show binary signals". For a description of the display set- tings, see also Chapter 12.1.2, "Display", on page 443 The instrument captures and decodes the signal according to the standard definition...
- Page 616 ® Protocol Analysis R&S ARINC 429 (Option R&S RTE-K7) Column Description Label Name The label name Data The value of the data bytes Export of decode results You can export the decode results to a CSV or HTML file: 1. Press the FILE key on the left. 2.
- Page 617 ® Protocol Analysis R&S ARINC 429 (Option R&S RTE-K7) Type The search criterion is defined by "Type". All trigger types are also available for search. Additional search parameters are provided under "Detailed Search Parameter Setup". Searches for the start word. "Word Start"...
- Page 618 ® Protocol Analysis R&S ARINC 429 (Option R&S RTE-K7) The label setup settings are the same as in the ARINC trigger setup, see "Label setup: Condition, Label Min, Label Max" on page 604. Remote command: on page 1473 SEARch:TRIGger:ARINc:LABel:CONDition on page 1473 SEARch:TRIGger:ARINc:LABel:MIN on page 1474 SEARch:TRIGger:ARINc:LABel:MAX...
- Page 619 ® Protocol Analysis R&S ARINC 429 (Option R&S RTE-K7) The error types are the same as in the ARINC trigger setup, see "Error Conditions" on page 605 Remote command: on page 1474 SEARch:TRIGger:ARINc:ERRor:CODing on page 1475 SEARch:TRIGger:ARINc:ERRor:PARity on page 1475 SEARch:TRIGger:ARINc:ERRor:TIMing 12.10.6.2 ARINC Search Results...
-
Page 620: Ethernet 10Base-T And 100Base-Tx (Option R&S Rte-K8)
® Protocol Analysis R&S Ethernet 10BASE-T and 100BASE-TX (Option R&S RTE-K8) Figure 12-52: Results of a general "Label +data" search with applied label list. All frames are found that contain any label, any data, and any SDI/SSM bits. Remote commands: ●... - Page 621 ® Protocol Analysis R&S Ethernet 10BASE-T and 100BASE-TX (Option R&S RTE-K8) R&S RTE-K8 is a firmware option that enables the R&S RTE to analyze Ethernet pro- tocol variants 10BASE-T and 100BASE-TX, by decoding the signal and searching within the decoded events. To trigger the signal, use the edge trigger on the source channel.
- Page 622 ® Protocol Analysis R&S Ethernet 10BASE-T and 100BASE-TX (Option R&S RTE-K8) Figure 12-53: Serial bus protocol configuration dialog For general information on how to configure protocol parameters, see also: Chap- ter 12.1.1, "Configuration - General Settings", on page 442. Ethernet Variant Defines the Ethernet protocol variant and transmission speed.
- Page 623 ® Protocol Analysis R&S Ethernet 10BASE-T and 100BASE-TX (Option R&S RTE-K8) "100BASE-TX" Selects the Ethernet protocol variant 100BASE-TX, which provides 100 Mbit/s use data rate. Due to 4b/5b encoding, the raw data rate on the line is 125 Mbit/s. This value is used by R&S RTE-K8 as the bit rate default for 100BASE-TX.
- Page 624 ® Protocol Analysis R&S Ethernet 10BASE-T and 100BASE-TX (Option R&S RTE-K8) The "Preset" levels depend on: – the Ethernet variant – the distance from the transmitter. "0 meters" represents "voltage at transmitter" and "100 meters" represents "voltage at the maximum cable length", according to the standard.
- Page 625 ® Protocol Analysis R&S Ethernet 10BASE-T and 100BASE-TX (Option R&S RTE-K8) Common display settings are explained in Chapter 12.1.2, "Display", on page 443. Decode layer Selects the decode layer. Decoding is performed in several steps, and the end results are presented in the decode table.
- Page 626 ® Protocol Analysis R&S Ethernet 10BASE-T and 100BASE-TX (Option R&S RTE-K8) 6. Tap "Ethernet Variant" and select the variant ("10BASE-T" or "100BASE-TX") you want to set up. Note: Note that no triggering on the serial bus is available. To trigger the signal, use the edge trigger on the source channel. 7.
- Page 627 ® Protocol Analysis R&S Ethernet 10BASE-T and 100BASE-TX (Option R&S RTE-K8) 00:21:90, GoliathS 00:21:91, D-Link 00:21:92, BaodingG 00:50:C2:5F:60:00/36, Cambridg 00:50:C2:5F:70:00/36, Metrolog 00:50:C2:5F:80:00/36, GrupoEpe 18:42:2F, AlcatelL 18:44:62, RiavaNet 18:46:17, SamsungE 18:8E:D5, TpVision 18:E7:F4, Apple 40:D8:55:1C:80:00/36, SensataT 40:D8:55:1C:90:00/36, Andy-L 40:D8:55:1C:A0:00/36, RigelEng 40:D8:55:1C:B0:00/36, MgSRL 40:D8:55:1C:D0:00/36, YxlonInt 40:D8:55:1C:E0:00/36, PeterHub 40:D8:55:1C:F0:00/36, OmnikNew...
- Page 628 ® Protocol Analysis R&S Ethernet 10BASE-T and 100BASE-TX (Option R&S RTE-K8) Figure 12-56: Ethernet 10BASE-T: decoded and binary signal, with decode results table and details green brackets [...] = start / end of frame blue frame = frame ok red frame = error frame grey = preamble / SFD / FrameCheck...
- Page 629 ® Protocol Analysis R&S Ethernet 10BASE-T and 100BASE-TX (Option R&S RTE-K8) Figure 12-57: Ethernet 10BASE-T: decoded and binary signal Figure 12-58: Ethernet 10BASE-T: decoded and binary signal (zoomed view) User Manual 1326.1032.02 ─ 11...
- Page 630 ® Protocol Analysis R&S Ethernet 10BASE-T and 100BASE-TX (Option R&S RTE-K8) The example in Figure 12-59 shows a zoomed view of binary signals and decode results in Ethernet 100BASE-TX. Figure 12-59: Ethernet 100BASE-TX: decoded and binary signal (zoomed view) green brackets [...] = start / end of frame blue frame = frame ok red frame...
- Page 631 ® Protocol Analysis R&S Ethernet 10BASE-T and 100BASE-TX (Option R&S RTE-K8) Column Description Type/Length The sub-protocol (e.g. HTML, video, etc.) determines what meaning this field has. Since the content of this data area is not decoded, the interpretation of this field is ambivalent.
- Page 632 ® Protocol Analysis R&S Ethernet 10BASE-T and 100BASE-TX (Option R&S RTE-K8) 12.11.5.1 Ethernet Search Setup Access: SEARCH > "Setup" tab > "Source" = Serial bus configured for Ethernet Search criteria Use the "Search criteria" dialog to define the event types to be searched. Available event types are "Frame"...
- Page 633 ® Protocol Analysis R&S Ethernet 10BASE-T and 100BASE-TX (Option R&S RTE-K8) Source address ← Frame To search for a source address, an address pattern or optionally an address range have to be specified. Remote command: on page 1488 SEARch:TRIGger:ETHernet:FRAMe:SCONdition on page 1488 SEARch:TRIGger:ETHernet:FRAMe:SMIN on page 1489 SEARch:TRIGger:ETHernet:FRAMe:SMAX...
- Page 634 ® Protocol Analysis R&S Ethernet 10BASE-T and 100BASE-TX (Option R&S RTE-K8) 12.11.5.2 Ethernet Search Results The search results are listed in the search result table and marked in the waveform by blue lines. The "Show search zoom windows" function allows you to analyze the search results in more detail.
- Page 635 ® Protocol Analysis R&S Ethernet 10BASE-T and 100BASE-TX (Option R&S RTE-K8) The search dialog for Ethernet protocol analysis is opened. 4. Specify search criteria according to Chapter 12.11.5.1, "Ethernet Search Setup", on page 624. 5. To acquire a waveform, press RUN N× SINGLE. The R&S RTE performs an Ethernet decode according to the thresholds and proto- col settings of the associated serial bus source (here in our example SB1).
-
Page 636: Sent (Option R&S Rte-K10)
® Protocol Analysis R&S SENT (Option R&S RTE-K10) 12.12 SENT (Option R&S RTE-K10) Single Ended Nibble Transmission (SENT) is a serial transmission interface protocol originally specified for the communication of sensors and control units in automotive electronics. SENT is a protocol standard governed by Society of Automotive Engineers (SAE J2716). - Page 637 ® Protocol Analysis R&S SENT (Option R&S RTE-K10) 12.12.1.1 SENT Transmission Concept A sensor converts the analog measured data to a digital signal, and thus transmits a series of pulses to the receiver. The receiver, e.g. an ECU processes the received sig- nal also digitally.
- Page 638 ® Protocol Analysis R&S SENT (Option R&S RTE-K10) Figure 12-60: Example of a SENT transmission sequence The format of a SENT transmission sequence consists of the following pulses: ● Synchronization/Calibration Pulse: – initial sequence of the receiver – the start condition is the falling edge of the last pulse (CRC or Pause) –...
- Page 639 ® Protocol Analysis R&S SENT (Option R&S RTE-K10) SENT Slow Channel Short Serial Messages For transmission of a slow channel message, 2 bits are included in a fast channel mes- sage, see the status nibble (Bit 2,3) in Figure 12-61. A short serial message needs 16 fast channel messages until it is completely transmit- ted.
- Page 640 ® Protocol Analysis R&S SENT (Option R&S RTE-K10) Trigger The R&S RTE can trigger on various parts of SENT pulses. The data line must be con- nected to an input channel, triggering on math and reference waveforms is not possi- ble.
- Page 641 ® Protocol Analysis R&S SENT (Option R&S RTE-K10) Data Sets the source of the data line. Usually, the source is one of the analog channels. Reference and math waveforms are available as source if the trigger source is one of the analog channels but not the serial bus.
- Page 642 ® Protocol Analysis R&S SENT (Option R&S RTE-K10) "Short" Short serial messages. "Enhanced" Enhanced serial messages. "None" No serial messages. Transmission sequences only. Remote command: on page 1499 BUS<m>:SENT:SFORmat CRC Version Selects the version the CRC check is based on. "Legacy"...
- Page 643 ® Protocol Analysis R&S SENT (Option R&S RTE-K10) Remote command: on page 1500 BUS<m>:SENT:PPFLength 12.12.3 SENT Trigger Access: TRIGGER > "Source = Serial Bus" > select "Serial bus" > "Protocol = SENT" Make sure that: ● The data source(s) of the serial bus are channel signals: PROTOCOL > "Configu- ration"...
- Page 644 ® Protocol Analysis R&S SENT (Option R&S RTE-K10) "Transmission Sequence" Triggering depends on the additionally selectable "Sequence" param- eter: ● "Sequence > Status": triggers at the end of the "Status" nibble. ● "Sequence > Status+Data": triggers at the end of the last data nibble.
- Page 645 ® Protocol Analysis R&S SENT (Option R&S RTE-K10) "Error condition" Triggers if certain errors occur. You can select the following error events for triggering: ● "Form Error" ● "Calibration Pulse Error" ● "Pulse Period Error" ● "CRC Error" ● "Irregular Frame Length Error" Description of error specific trigger conditions, see "Error conditions setup"...
- Page 646 ® Protocol Analysis R&S SENT (Option R&S RTE-K10) The available operators: ● Equal, Not equal ● Less than, Greater than ● Less or equal, Greater or equal ● In range, Out of range Remote command: on page 1502 TRIGger<m>:SENT:TDCN Nibbles ← Transmission Sequence setup Displays the number of data nibbles of the transmission sequence.
- Page 647 ® Protocol Analysis R&S SENT (Option R&S RTE-K10) ID Type ← Serial Message setup Selects the message ID format for the enhanced serial message type. You can select either 4 bit or 8 bit message ID. Remote command: on page 1503 TRIGger<m>:SENT:SIDType Identifier Condition ←...
- Page 648 ® Protocol Analysis R&S SENT (Option R&S RTE-K10) Data max ← Serial Message setup The second data pattern is required to specify a range with conditions "In range" and "Out of range". Remote command: on page 1505 TRIGger<m>:SENT:SDMX Error conditions setup Executes a trigger event if one or more of the following errors occur: ●...
- Page 649 ® Protocol Analysis R&S SENT (Option R&S RTE-K10) on page 1506 TRIGger<m>:SENT:CRCerror on page 1506 TRIGger<m>:SENT:IRFLength 12.12.4 SENT Label List SENT label lists provide a very useful way of translating the decoded data into user for- mat. The label lists are highly customizable. The format of supplying the label list description is through a .xml file and is explained with an example, see "Label List Structure for SENT Protocol"...
- Page 650 ® Protocol Analysis R&S SENT (Option R&S RTE-K10) <sb:VALUE-TYPE>ENUM</sb:VALUE-TYPE> <!-- Representation of the Bits [ENUM, UNSIGNED_INT, INT, FLOAT, DOUBLE], Default: UNSIGNED_INT The Signal Value is calculated according to the following: Translated_Value = Encoded_Value * FACTOR + OFFSET --> <sb:FACTOR>1.0</sb:FACTOR> <!-- Signal Factor (decimal value)--> <sb:OFFSET>0.0</sb:OFFSET>...
- Page 651 ® Protocol Analysis R&S SENT (Option R&S RTE-K10) Figure 12-64: SENT label list Figure 12-65: SENT decode results with label list translation Remote command: User Manual 1326.1032.02 ─ 11...
- Page 652 ® Protocol Analysis R&S SENT (Option R&S RTE-K10) on page 1512 BUS<m>:SENT:FRAMe<n>:SYMBol? 12.12.4.1 SENT Label List Translation Example The example shows the xml sequence for a label list translation in the SENT protocol: Figure 12-66: SENT label list translation <?xml version="1.0" encoding="UTF-8"?> <sb:LABEL-LIST-FILE>...
- Page 653 ® Protocol Analysis R&S SENT (Option R&S RTE-K10) <sb:DESCRIPTION></sb:DESCRIPTION> <sb:ID-VALUE>4</sb:ID-VALUE> <sb:ID-LENGTH>4</sb:ID-LENGTH> <sb:DATA-SIZE>16</sb:DATA-SIZE> </sb:FRAME> <sb:FRAME NAME="Configuration Code" STATE="OFF"> <sb:DESCRIPTION></sb:DESCRIPTION> <sb:ID-VALUE>04</sb:ID-VALUE> <sb:ID-LENGTH>8</sb:ID-LENGTH> <sb:DATA-SIZE>12</sb:DATA-SIZE> </sb:FRAME> <sb:FRAME NAME="Manufacturer Code" STATE="OFF"> <sb:DESCRIPTION></sb:DESCRIPTION> <sb:ID-VALUE>05</sb:ID-VALUE> <sb:ID-LENGTH>8</sb:ID-LENGTH> <sb:DATA-SIZE>12</sb:DATA-SIZE> </sb:FRAME> <sb:FRAME NAME="Sensor Type" STATE="ON"> <sb:DESCRIPTION>specifies the SENT Sensor Type</sb:DESCRIPTION> <sb:ID-VALUE>03</sb:ID-VALUE>...
- Page 654 ® Protocol Analysis R&S SENT (Option R&S RTE-K10) <sb:ENUM INDEX="21" LABEL="MAF (lin) / Pressure (hi-res)"/> <sb:ENUM INDEX="22" LABEL="MAF (non-lin) / Pressure (hi-res)"/> </sb:ENUM-VALUES> </sb:SIGNAL> </sb:SIGNALS> </sb:FRAME> <sb:FRAME NAME="SENT Standard Revision" STATE="ON"> <sb:SHORT-NAME>SENT Standard</sb:SHORT-NAME> <sb:DESCRIPTION>specifies the SENT Standard Revision Number</sb:DESCRIPTION> <sb:ID-VALUE>10</sb:ID-VALUE> <sb:ID-LENGTH>4</sb:ID-LENGTH>...
- Page 655 ® Protocol Analysis R&S SENT (Option R&S RTE-K10) <sb:ENUM-VALUES> <sb:ENUM INDEX="0" LABEL="No Error"/> <sb:ENUM INDEX="1" LABEL="Channel 1 out of range high"/> <sb:ENUM INDEX="2" LABEL="Channel 1 out of range low"/> <sb:ENUM INDEX="3" LABEL="Initialization Error (Channel 1)"/> <sb:ENUM INDEX="4" LABEL="Channel 2 out of range high"/> <sb:ENUM INDEX="5"...
- Page 656 ® Protocol Analysis R&S SENT (Option R&S RTE-K10) </sb:SIGNAL> </sb:SIGNALS> </sb:FRAME> <sb:FRAME NAME="Dual Throttle Position" STATE="OFF"> <sb:SHORT-NAME>DTP</sb:SHORT-NAME> <sb:DATA-SIZE>24</sb:DATA-SIZE> <sb:SIGNALS> <sb:SIGNAL ID="Channel_1"> <sb:SHORT-NAME>TPS1</sb:SHORT-NAME> <sb:DESCRIPTION>""</sb:DESCRIPTION> <sb:BIT-POSITION>23</sb:BIT-POSITION> <sb:BIT-LENGTH>12</sb:BIT-LENGTH> <sb:BYTE-ORDER>MSB</sb:BYTE-ORDER> <sb:VALUE-TYPE>UNSIGNED_INT</sb:VALUE-TYPE> <sb:FACTOR>1.0</sb:FACTOR> <sb:OFFSET>0.0</sb:OFFSET> <sb:MIN>0</sb:MIN> <sb:MAX>10000.0</sb:MAX> <sb:UNIT></sb:UNIT> </sb:SIGNAL> <sb:SIGNAL ID="Channel_2"> <sb:SHORT-NAME>TPS2</sb:SHORT-NAME> <sb:DESCRIPTION>""</sb:DESCRIPTION> <sb:BIT-POSITION>11</sb:BIT-POSITION> <sb:BIT-LENGTH>12</sb:BIT-LENGTH> <sb:BYTE-ORDER>LSB</sb:BYTE-ORDER> <sb:FACTOR>1.0</sb:FACTOR>...
- Page 657 ® Protocol Analysis R&S SENT (Option R&S RTE-K10) </sb:SIGNALS> </sb:FRAME> <sb:FRAME NAME="Mass Air Flow (16/8)" STATE="OFF"> <sb:SHORT-NAME>MAF/P</sb:SHORT-NAME> <sb:DATA-SIZE>24</sb:DATA-SIZE> <sb:SIGNALS> <sb:SIGNAL ID="Channel_1"> <sb:SHORT-NAME>MAF</sb:SHORT-NAME> <sb:DESCRIPTION>""</sb:DESCRIPTION> <sb:BIT-POSITION>23</sb:BIT-POSITION> <sb:BIT-LENGTH>16</sb:BIT-LENGTH> <sb:BYTE-ORDER>MSB</sb:BYTE-ORDER> <sb:FACTOR>1.0</sb:FACTOR> <sb:OFFSET>0.0</sb:OFFSET> <sb:MIN>0</sb:MIN> <sb:MAX>10000.0</sb:MAX> <sb:UNIT></sb:UNIT> </sb:SIGNAL> <sb:SIGNAL ID="Channel_2"> <sb:SHORT-NAME>Pressure</sb:SHORT-NAME> <sb:DESCRIPTION>""</sb:DESCRIPTION> <sb:BIT-POSITION>7</sb:BIT-POSITION> <sb:BIT-LENGTH>8</sb:BIT-LENGTH> <sb:BYTE-ORDER>LSB</sb:BYTE-ORDER> <sb:FACTOR>1.0</sb:FACTOR> <sb:OFFSET>0.0</sb:OFFSET>...
- Page 658 ® Protocol Analysis R&S SENT (Option R&S RTE-K10) <sb:DESCRIPTION>""</sb:DESCRIPTION> <sb:BIT-POSITION>9</sb:BIT-POSITION> <sb:BIT-LENGTH>10</sb:BIT-LENGTH> <sb:BYTE-ORDER>LSB</sb:BYTE-ORDER> <sb:FACTOR>1.0</sb:FACTOR> <sb:OFFSET>0.0</sb:OFFSET> <sb:MIN>0</sb:MIN> <sb:MAX>10000.0</sb:MAX> <sb:UNIT></sb:UNIT> </sb:SIGNAL> </sb:SIGNALS> </sb:FRAME> <sb:FRAME NAME="Single Secure Sensor" STATE="OFF"> <sb:SHORT-NAME>SSS</sb:SHORT-NAME> <sb:DATA-SIZE>24</sb:DATA-SIZE> <sb:SIGNALS> <sb:SIGNAL ID="Channel_1"> <sb:SHORT-NAME>Ch1</sb:SHORT-NAME> <sb:DESCRIPTION>""</sb:DESCRIPTION> <sb:BIT-POSITION>23</sb:BIT-POSITION> <sb:BIT-LENGTH>12</sb:BIT-LENGTH> <sb:BYTE-ORDER>MSB</sb:BYTE-ORDER> <sb:FACTOR>1.0</sb:FACTOR> <sb:OFFSET>0.0</sb:OFFSET> <sb:MIN>0</sb:MIN> <sb:MAX>10000.0</sb:MAX> <sb:UNIT></sb:UNIT> </sb:SIGNAL>...
- Page 659 ® Protocol Analysis R&S SENT (Option R&S RTE-K10) <sb:BIT-LENGTH>12</sb:BIT-LENGTH> <sb:BYTE-ORDER>MSB</sb:BYTE-ORDER> <sb:FACTOR>1.0</sb:FACTOR> <sb:OFFSET>0.0</sb:OFFSET> <sb:MIN>0</sb:MIN> <sb:MAX>10000.0</sb:MAX> <sb:UNIT></sb:UNIT> </sb:SIGNAL> <sb:SIGNAL ID="Channel_2"> <sb:SHORT-NAME>Pressure2</sb:SHORT-NAME> <sb:DESCRIPTION>""</sb:DESCRIPTION> <sb:BIT-POSITION>11</sb:BIT-POSITION> <sb:BIT-LENGTH>12</sb:BIT-LENGTH> <sb:BYTE-ORDER>LSB</sb:BYTE-ORDER> <sb:FACTOR>1.0</sb:FACTOR> <sb:OFFSET>0.0</sb:OFFSET> <sb:MIN>0</sb:MIN> <sb:MAX>10000.0</sb:MAX> <sb:UNIT></sb:UNIT> </sb:SIGNAL> </sb:SIGNALS> </sb:FRAME> <sb:FRAME NAME="Pressure and Temperature Sensor" STATE="OFF"> <sb:SHORT-NAME>P/T</sb:SHORT-NAME> <sb:DATA-SIZE>24</sb:DATA-SIZE> <sb:SIGNALS> <sb:SIGNAL ID="Channel_1">...
- Page 660 ® Protocol Analysis R&S SENT (Option R&S RTE-K10) </sb:SIGNALS> </sb:FRAME> <sb:FRAME NAME="Pressure and Secure Sensor" STATE="OFF"> <sb:SHORT-NAME>P/S</sb:SHORT-NAME> <sb:DATA-SIZE>24</sb:DATA-SIZE> <sb:SIGNALS> <sb:SIGNAL ID="Channel_1"> <sb:SHORT-NAME>Pressure</sb:SHORT-NAME> <sb:DESCRIPTION>""</sb:DESCRIPTION> <sb:BIT-POSITION>23</sb:BIT-POSITION> <sb:BIT-LENGTH>12</sb:BIT-LENGTH> <sb:BYTE-ORDER>MSB</sb:BYTE-ORDER> <sb:FACTOR>1.0</sb:FACTOR> <sb:OFFSET>0.0</sb:OFFSET> <sb:MIN>0</sb:MIN> <sb:MAX>10000.0</sb:MAX> <sb:UNIT></sb:UNIT> </sb:SIGNAL> <sb:SIGNAL ID="Channel_2"> <sb:SHORT-NAME>Counter</sb:SHORT-NAME> <sb:DESCRIPTION>""</sb:DESCRIPTION> <sb:BIT-POSITION>11</sb:BIT-POSITION> <sb:BIT-LENGTH>8</sb:BIT-LENGTH> <sb:BYTE-ORDER>MSB</sb:BYTE-ORDER> <sb:FACTOR>1.0</sb:FACTOR> <sb:OFFSET>0.0</sb:OFFSET>...
- Page 661 ® Protocol Analysis R&S SENT (Option R&S RTE-K10) Data is decoded and displayed in the order of its reception. The "Decode results" box shows the detailed decoded data for each frame as it is received. Figure 12-67: SENT decode results display Figure 12-68: SENT decode results of a short serial message User Manual 1326.1032.02 ─...
- Page 662 ® Protocol Analysis R&S SENT (Option R&S RTE-K10) Figure 12-69: SENT decode results of an enhanced serial message Table 12-15: Content of the decode result table Column Description State Overall state of the frame Start Time of frame start in relation to the trigger point Type Frame type Sync Duration...
- Page 663 ® Protocol Analysis R&S SENT (Option R&S RTE-K10) 3. Select the decode results to be exported, the file format, and the delimiter. 4. Tap "Save" or "Save as". Remote commands Remote commands to retrieve decode results are described in Chapter 17.17.13.3, "Decode Results", on page 1506.
- Page 664 ® Protocol Analysis R&S SENT (Option R&S RTE-K10) "Calibration Sync" Searches for the end of the "Calibration/Synchronization" sequence, i.e. the falling edge. This setting does not require any input parameters. "Transmission Seq" Searches for the end of the status nibble in a single transmission sequence, or the end of the combination of the status and data nib- ble(s).
- Page 665 ® Protocol Analysis R&S SENT (Option R&S RTE-K10) Figure 12-70: Search setting parameters of a transmission sequence Sequence ← Transmission Sequence setup Selects the condition for searching in a single transmission sequence. You can search for the end of the status nibble or the combination of the status and data nibble(s).
- Page 666 ® Protocol Analysis R&S SENT (Option R&S RTE-K10) Data max ← Transmission Sequence setup The second data pattern is required to specify a range with conditions "In range" and "Out of range". Remote command: on page 1517 SEARch:TRIGger:SENT:TDMX Serial Message setup Configures the search conditions for a serial message.
- Page 667 ® Protocol Analysis R&S SENT (Option R&S RTE-K10) Identifier min ← Serial Message setup Defines the bit pattern of the message identifier. In binary format, use the following characters: 1; 0; or X (any bit). The bit pattern editor helps you to enter the pattern in any format, see Chapter 12.1.4, "Bit Pattern Editor",...
- Page 668 ® Protocol Analysis R&S SENT (Option R&S RTE-K10) Performs the search on one or more of the following error events: ● "Transmission sequence errors" – "Calibration Pulse Error" Searches for calibration pulse errors. – "Pulse Period Error" Searches for pulse period errors in a transmission sequence. –...
- Page 669 ® Protocol Analysis R&S SENT (Option R&S RTE-K10) Figure 12-71: Search on the Status nibble in a SENT transmission signal The columns in the search result table are the same as in the decoding table, see Chapter 12.12.5, "SENT Decode Results", on page 652.
-
Page 670: Custom: Manchester / Nrz (Option R&S Rte-K50)
® Protocol Analysis R&S Custom: Manchester / NRZ (Option R&S RTE-K50) 12.13 Custom: Manchester / NRZ (Option R&S RTE-K50) R&S RTE-K50 is a firmware option that enables the R&S RTE to analyze customizable serial bus signals encoded by the following coding standards: ●... - Page 671 ® Protocol Analysis R&S Custom: Manchester / NRZ (Option R&S RTE-K50) Quaternary Symbols The software supports not just traditional binary symbols "0" and "1", but also arbitrary violation waveforms that use two additional symbols, yielding a total of four valid "qua- ternary bit"...
- Page 672 ® Protocol Analysis R&S Custom: Manchester / NRZ (Option R&S RTE-K50) 12.13.2 Custom: Manchester / NRZ Configuration If you need information on how to get started with configuring the custom serial bus setup, see Chapter 12.13.2.5, "Configuring Custom Manchester / NRZ Signals", on page 684.
- Page 673 ® Protocol Analysis R&S Custom: Manchester / NRZ (Option R&S RTE-K50) "Manchester" Selects the coding standard Manchester. Optional "Timing settings" are "Bit Rate" (default: disabled, 10 Mbit/s) and "Gap time" (default: disabled, 10 µs), as shown in Figure 12-72. Figure 12-73: Custom serial bus coding configuration Manchester "Manchester II"...
- Page 674 ® Protocol Analysis R&S Custom: Manchester / NRZ (Option R&S RTE-K50) "NRZ Clocked" Selects the coding standard NRZ Clocked. Optional "Timing settings" is "Gap time" (default: disabled, 10 µs), as shown in Figure 12-75. Figure 12-75: Custom serial bus coding configuration NRZ clocked "NRZ Selects the coding standard NRZ unclocked.
- Page 675 ® Protocol Analysis R&S Custom: Manchester / NRZ (Option R&S RTE-K50) Remote command: on page 1527 BUS<m>:CMSB:CODing Data Source Defines the input source for the custom serial bus data signal. The data source for Manchester and NRZ coding standards is selected separately, independent of each other.
- Page 676 ® Protocol Analysis R&S Custom: Manchester / NRZ (Option R&S RTE-K50) "Active high" The value "1" is represented by a voltage above the threshold. "Active low" The value "1" is represented by a voltage below the threshold. Remote command: on page 1533 BUS<m>:CMSB:NRZ:POLarity Data Idle Polarity (NRZ Unclocked) Defines the idle polarity of the custom serial bus data signal (only available for the cod-...
- Page 677 ® Protocol Analysis R&S Custom: Manchester / NRZ (Option R&S RTE-K50) "Second Edge" ● At "Idle" = "low": data are captured on the clock's falling edge (high-to-low transition) and propagated on a rising edge. ● At "Idle" = "high": data are captured on the clock's rising edge (low-to-high transition) and propagated on a falling edge.
- Page 678 ® Protocol Analysis R&S Custom: Manchester / NRZ (Option R&S RTE-K50) Enable Polarity (NRZ) Selects whether the transmitted enable signal is active when the voltage is below the Thresholds ("Enable low") or higher than it ("Enable high"). Remote command: on page 1533 BUS<m>:CMSB:NRZ:ENAPolarity Thresholds Sets the threshold value for the digitization of each signal line.
- Page 679 ® Protocol Analysis R&S Custom: Manchester / NRZ (Option R&S RTE-K50) ● "Preset" Either sets individual voltages by selecting "manual", ● or sets the voltages to one out of various pre-defined levels. When any non-predefined threshold is set, the "Preset" status auto- matically changes to "manual"...
- Page 680 ® Protocol Analysis R&S Custom: Manchester / NRZ (Option R&S RTE-K50) For more details on the bit rate, see Chapter 12.13.1.1, "Special Features of Manches- Coding", on page 662. Remote command: on page 1536 BUS<m>:CMSB:BITRate:VALue Enable Gap Time Enables the gap time settings (always enabled for the coding standard "NRZ Unclocked", and also for triggering on signals in any coding standard).
- Page 681 ® Protocol Analysis R&S Custom: Manchester / NRZ (Option R&S RTE-K50) Figure 12-77: Example of a custom "DALI" frame format description (frame 2 of 4) Figure 12-78: Example of a custom "MVB" frame format description (frame 1 of 2) User Manual 1326.1032.02 ─ 11...
- Page 682 ® Protocol Analysis R&S Custom: Manchester / NRZ (Option R&S RTE-K50) Figure 12-79: Example of a custom "ProfiBus Voltage" frame format description (frame 1 of 3) Figure 12-80: Example of a crc, parity and block frame conditions User Manual 1326.1032.02 ─ 11...
- Page 683 ® Protocol Analysis R&S Custom: Manchester / NRZ (Option R&S RTE-K50) Frames A frame format description (or frame description, for short) is represented by one "page" in this dialog. It can be created by clicking on "Add". If one or several frame descriptions already exist, the new frame description is then created at the end of the frame format description list (or frame list, for short).
- Page 684 ® Protocol Analysis R&S Custom: Manchester / NRZ (Option R&S RTE-K50) Cells A cell description (which is represented by one row in one frame description) can be created at any position of a frame description (see Frames) by clicking on "Insert". This brings up a new cell description in the active frame description, on top of the selected position.
- Page 685 ® Protocol Analysis R&S Custom: Manchester / NRZ (Option R&S RTE-K50) – if "Bit Count" is 4, the truncated condition is "=1000" for LSB and "=0001" for – if "Bit Count" is 8, the padded condition is "=00111000" for LSB and "=00011100"...
- Page 686 ® Protocol Analysis R&S Custom: Manchester / NRZ (Option R&S RTE-K50) "[ ] (array)" The array operator (represented by the "[" and "]" bracket signs) defines the number of permissible repetitions of the cell. Example: Fixed Length Array: [n] The length parameter "n" is a decimal number > 0, which determines that the cell will be repeated n times within the frame.
- Page 687 ® Protocol Analysis R&S Custom: Manchester / NRZ (Option R&S RTE-K50) "crc5usb(n-m)" The crc 5 bit operator performs a check for a 5\-bit CRC function using the polynomial as defined by the USB standard. n and m define the index range for the CRC check. For example, if the CRC shall check fields 1 to 4, the function shall be written "crc5usb(1-5)".
- Page 688 ® Protocol Analysis R&S Custom: Manchester / NRZ (Option R&S RTE-K50) Remote command: on page 1539 BUS<m>:CMSB:FRAMe<n>:CELL<o>:FORMat Bit Order This defines, in which order the bits of a cell's Condition value are evaluated: either the most significant bit (MSB) or the least significant bit (LSB) first. Since the bit order is taken into consideration for the interpretation of the condition, the user should specify MSB or LSB correctly.
- Page 689 ® Protocol Analysis R&S Custom: Manchester / NRZ (Option R&S RTE-K50) Note: To see more than the three selected results, bring up a full list of the states and values of all cells by activating "Show details" in the decode table dialog. For an exam- ple, see Figure 12-86.
- Page 690 ® Protocol Analysis R&S Custom: Manchester / NRZ (Option R&S RTE-K50) A suitable XML file as shown in Figure 12-81 is composed as follows: Header: <?xml version="1.0" encoding="utf-8"?> Root Element: <FrameDescription xmlns:xsi="http://www.w3.org/2001/XMLSchema-instance" Version="1" xsi:noNamespaceSchemaLocation=".\Schema\FrameDescription.xsd"> The root element contains the "Frame Description" attributes, including a link for the fileFrameDescription.xsd.
- Page 691 ® Protocol Analysis R&S Custom: Manchester / NRZ (Option R&S RTE-K50) – "1" – "2" – "3" 12.13.2.4 Custom: Manchester / NRZ Display Settings Access: PROTOCOL > "Configuration" tab > "Protocol = Custom" > "Display" tab To enhance the decode possibilities of the custom serial protocol, you can use an addi- tional setting in the "Display"...
- Page 692 ® Protocol Analysis R&S Custom: Manchester / NRZ (Option R&S RTE-K50) 12.13.2.5 Configuring Custom Manchester / NRZ Signals For configuration, assign the lines to the input channels, define the active states and the logical thresholds, and specify frame format descriptions. Serial bus setup 1.
- Page 693 ® Protocol Analysis R&S Custom: Manchester / NRZ (Option R&S RTE-K50) In this section, all trigger settings are described. Their availability on the instrument depends on the selected coding standard and trigger type. The user interface of the instrument displays only appropriate settings and guides you through the trigger setup. For a list of supported trigger conditions, refer to the data sheet.
- Page 694 ® Protocol Analysis R&S Custom: Manchester / NRZ (Option R&S RTE-K50) Figure 12-84: Custom serial bus dialog for setting the frame start trigger Pattern ← Type Specifies the pattern match conditions for a payload data check. The trigger is set to the first occurrence of a matching data bit pattern (which can be freely specified), start- ing after the minimum gap time, and after the detected start of the data frame.
- Page 695 ® Protocol Analysis R&S Custom: Manchester / NRZ (Option R&S RTE-K50) "Bit index" Sets the bit index (data position), or the start value of a bit index range. Default bit index value is 0, permitted values range from 0 to 65535.
- Page 696 ® Protocol Analysis R&S Custom: Manchester / NRZ (Option R&S RTE-K50) 3. Tap "Serial bus" and select the serial bus that is set to Custom serial bus, e.g.: The "Protocol" selection is then automatically set to "Custom". 4. Tap "Type" and select the trigger type to be used for custom serial bus protocol analysis.
- Page 697 ® Protocol Analysis R&S Custom: Manchester / NRZ (Option R&S RTE-K50) Examples The example in Figure 12-86 shows decoded and binary signals of a custom serial bus. The format information of DALI is being used to display as a result. Note that activating "Show details"...
- Page 698 ® Protocol Analysis R&S Custom: Manchester / NRZ (Option R&S RTE-K50) Column Description Stop Stop time of the frame Type Frame type as specified in the "Frame type" field of the "Frame Format" description dialog (see "Frames" on page 675) Result 1 cell content as specified in the Result Column...
-
Page 699: Mdio (Option R&S Rte-K55)
® Protocol Analysis R&S MDIO (Option R&S RTE-K55) The following commands are used to retrieve decode results in remote control. For an example on how to query the status of a frame, see Chapter 17.17.14.3, "Decode Results", on page 1543. Export of decode results You can export the decode results to a CSV or HTML file: 1. - Page 700 ® Protocol Analysis R&S MDIO (Option R&S RTE-K55) On logical level, MDIO is a fairly simple protocol with a fixed word length of 64 bits. The structure of MDIO frames is shown in the following tables: Table 12-18: MDIO frame structure according to Clause 22 Management Frame Fields Frame PHYAD...
- Page 701 ® Protocol Analysis R&S MDIO (Option R&S RTE-K55) While this design is simple, it doesn’t allow triggering on a data range or even inequal- ity. This explains the much simpler structure compared to other protocols. 12.14.2 MDIO Configuration If you need information on how to get started with configuring the MDIO setup, see Chapter 12.14.2.3, "Configuring MDIO Signals", on page 695.
- Page 702 ® Protocol Analysis R&S MDIO (Option R&S RTE-K55) "Data" Defines the source settings for the data signal. Typically, select any of the the analog channels "C1" – "C4" or digital channels "D0" – "D15", depending on your application, but not the same as for "Clock".
- Page 703 ® Protocol Analysis R&S MDIO (Option R&S RTE-K55) To enhance the decode possibilities of the MDIO protocol, you can use an additional setting in the "Display" tab: "Decode layer". Common display settings are explained in Chapter 12.1.2, "Display", on page 443. Decode layer Selects the decode layer.
- Page 704 ® Protocol Analysis R&S MDIO (Option R&S RTE-K55) 3. Tap "Protocol" and select the protocol: "MDIO". 4. Optionally, you can enter a "Bus label" in the "Display" tab. 5. Switch to the "Trigger Setup" dialog, tap "Source" and select "Serial bus". Note: For triggering on a serial bus, analog or digital input channels are required! 6.
- Page 705 ® Protocol Analysis R&S MDIO (Option R&S RTE-K55) Figure 12-89: MDIO trigger event settings dialog "Frame Start" Sets the trigger to the start of frame (SOF) field. The start of frame condition and the trigger instant is the end of the preamble. Trigger pattern: preamble (32 bits "1") There are no additional parameters to be specified.
- Page 706 ® Protocol Analysis R&S MDIO (Option R&S RTE-K55) "Data" Sets the trigger to the data field. For more information on the data condition, see MDIO in the Ethernet standard. The trigger instant is at the end of the frame after the last data bit, as indicated in the GUI. Note: All data triggers are always at the end of the frame, even if the specified pattern to trigger for is at a different position within the data word.
- Page 707 ® Protocol Analysis R&S MDIO (Option R&S RTE-K55) PHYAD/PRTAD ← MDIO Trigger Type Sets the physical address or port address (5 bits) of the frame pattern; available only in trigger type "Data". Remote command: on page 1554 TRIGger<m>:MDIO:PHYS REGAD/DEVAD ← MDIO Trigger Type Sets the register address or device address (5 bits) of the frame pattern;...
- Page 708 ® Protocol Analysis R&S MDIO (Option R&S RTE-K55) 12.14.4 MDIO Label List Label lists are protocol-specific. A label list file for MDIO contains physical addresses and their symbolic names. Example: MDIO label list CSV file @PROTOCOL_NAME = mdio 0x0B, KSZ9031MNX 0x0C, KSZ8051MNLU 0x0E, KSZ8721CL 0x0F, KSZ8721SL...
- Page 709 ® Protocol Analysis R&S MDIO (Option R&S RTE-K55) display, along with the binary decode results. In the lower part of the screen is a zoom into frame #2, which is a "Write" frame, containing PRE, ST, OP, PRTAD, DEVAD, TA and DATA fields.
- Page 710 ® Protocol Analysis R&S MDIO (Option R&S RTE-K55) Column Description Start of frame code, 2 bits ● "01" (Clause 22) ● "00" (Clause 45) Operation code (= Frame type), 2 bits ● "00" = Address frame (in Clause 45, only) ●...
- Page 711 ® Protocol Analysis R&S MDIO (Option R&S RTE-K55) Figure 12-91: The same signal trace and decode results table as in the previous figure, but only with "DATA" in binary format To configure the numerical format of the content in column "DATA/ADDRESS", either use the button "Data format"...
- Page 712 ® Protocol Analysis R&S MDIO (Option R&S RTE-K55) Figure 12-92: The data display settings can be configured in the Display tab of the Protocol dialog Export of decode results You can export the decode results to a CSV or HTML file: 1.
- Page 713 ® Protocol Analysis R&S MDIO (Option R&S RTE-K55) To search on decoded data, set the search source to "SerBus" for the configured pro- tocol. For general information on how to handle the search functionality, see Chapter 10, "Search Functions", on page 380. If you need information on how to get started with searching MDIO data, see Chap- ter 12.14.6.3, "Searching MDIO...
- Page 714 ® Protocol Analysis R&S MDIO (Option R&S RTE-K55) PHYAD/PRTAD Sets the physical address or port address (5 bits) of the frame pattern; available only in search criteria type "Data". Remote command: on page 1559 SEARch:TRIGger:MDIO:PHYS REGAD/DEVAD Sets the register address or device address (5 bits) of the frame pattern; available only in search criteria type "Data".
- Page 715 ® Protocol Analysis R&S MDIO (Option R&S RTE-K55) 12.14.6.3 Searching MDIO Data Prerequisite: A serial bus is configured for the MDIO signal to be decoded and ana- lyzed. The search for events is set up in the following way: 1. Press SEARCH or tap "Search" > "Setup" in the menu bar. 2.
-
Page 716: Usb (Option R&S Rte-K60)
® Protocol Analysis R&S USB (Option R&S RTE-K60) For information on how to configure the search results presentation and how to navigate the search results, see also "To display search zoom windows" on page 401 and "Navigating search results" on page 382. 12.15 USB (Option R&S RTE-K60) R&S RTE-K60 is a firmware option that enables the R&S RTE to analyse Universal Serial Bus (USB) protocols, by triggering and decoding them. - Page 717 ® Protocol Analysis R&S USB (Option R&S RTE-K60) USB characteristics Main characteristics of USB are: ● Four-wire design: USB requires a shielded cable containing four wires. Two of them, called D+ and D-, form a twisted pair (for low speed, they may not be twis- ted).
- Page 718 ® Protocol Analysis R&S USB (Option R&S RTE-K60) Bus State Protocol Levels Data "K" State Low speed D+ High, D- Low (differential "1") Full speed D+ Low, D- High (differential "0") In the example in Table 12-21, High speed can be assumed to be like Full speed. For a complete overview of bus states as well as for an electrical definition of High and Low speed, refer to chapter 7 of the USB specification.
- Page 719 ® Protocol Analysis R&S USB (Option R&S RTE-K60) = Differential envelope exceeds 150 mV, reception enabled with 4 symbol times = Clock recovery must lock in time to detect end of SYNC = End of SYNC detected, receiver begins data recovery After the SYNC (or SOP), USB data packets consist of (in this order): ●...
- Page 720 ® Protocol Analysis R&S USB (Option R&S RTE-K60) Table 12-22: Valid PIDs for different packet types Packet Name Meaning type value Token 0xE1 Starts data transfer towards a device 0x69 Starts data transfer towards the host 0xA5 Indicates start of frame SETUP 0x2D Starts a setup transfer and sends information on this to the device...
- Page 721 ® Protocol Analysis R&S USB (Option R&S RTE-K60) ● SPLIT packets have the following format: SYNC ADDR PORT CRC5 Trigger possibilities Signals on the input channels CH1 - CH4 of the R&S RTE can be triggered by the option R&S®RTx-K60. The following trigger types are available: ●...
- Page 722 ® Protocol Analysis R&S USB (Option R&S RTE-K60) Figure 12-97: Serial bus protocol configuration dialog For general information on how to configure protocol parameters, see also: Chap- ter 12.1.1, "Configuration - General Settings", on page 442. Protocol type Defines the USB protocol technology and transmission speed. "USB Low speed"...
- Page 723 ® Protocol Analysis R&S USB (Option R&S RTE-K60) "USB Full speed" Selects USB full speed protocol (12 Mbit/s). Figure 12-99: USB full speed protocol configuration Remote command: on page 1565 BUS<m>:USB:DPLus:SOURce on page 1566 BUS<m>:USB:DMINus:SOURce on page 1567 BUS<m>:USB:DPLus:THReshold on page 1567 BUS<m>:USB:DMINus:THReshold "USB High speed"...
- Page 724 ® Protocol Analysis R&S USB (Option R&S RTE-K60) "USB HSIC" Selects USB high speed inter-chip (HSIC) protocol. Figure 12-101: USB HSIC protocol configuration Remote command: on page 1566 BUS<m>:USB:DATA:SOURce on page 1566 BUS<m>:USB:STRobe:SOURce on page 1568 BUS<m>:USB:DATA:THReshold on page 1568 BUS<m>:USB:STRobe:THReshold Remote command: on page 1565...
- Page 725 ® Protocol Analysis R&S USB (Option R&S RTE-K60) Strobe Defines the source settings for the strobe signal (in USB HSIC protocol, only). Permit- ted selections are the analog channels "C1" – "C4". Remote command: on page 1566 BUS<m>:USB:STRobe:SOURce Thresholds Sets the threshold value for the digitization of each signal line. If the signal value on the line is higher than the threshold, the signal state is high.
-
Page 726: Usb Trigger
® Protocol Analysis R&S USB (Option R&S RTE-K60) 9. Depending on the protocol type, select the waveform for each of the available "D+", "D-", "Differential", "Data", and "Strobe" lines. 10. Set the logical thresholds: Either according to technology definition with "Preset", or to the middle reference levels with "Set to 50%", or enter a user-defined value directly in the "Threshold"... - Page 727 ® Protocol Analysis R&S USB (Option R&S RTE-K60) Make sure that: ● The data source(s) of the serial bus are channel signals: PROTOCOL > "Configu- ration" tab. ● The trigger sequence is set to "A only": TRIGGER > "Sequence" tab. ●...
- Page 728 ® Protocol Analysis R&S USB (Option R&S RTE-K60) Suspend ← Trigger type USB Sets the trigger to the Suspend field. Not available for USB High Speed and USB HSIC protocol types. For more information on the suspend condition, see the USB standard. The trigger instant will be declared after the defined 3 ms timeout.
- Page 729 ® Protocol Analysis R&S USB (Option R&S RTE-K60) Token Sets the trigger to one out of four different token types: ● "OUT" ● "IN" ● "SOF" ● "SETUP" If no additional conditions are set, the trigger instant is after the PID. If the PID error check is selected, and ●...
- Page 730 ® Protocol Analysis R&S USB (Option R&S RTE-K60) ● "MDATA" If no additional conditions are set, the trigger instant is after the PID. If the PID error check is selected, and ● if an error is found in the PID's complementary form, the trigger is set immediately after the 8 bit of the PID ●...
- Page 731 ® Protocol Analysis R&S USB (Option R&S RTE-K60) ● "PING" If no additional conditions are set, the trigger instant is after the PID. If the PID error check is selected, and ● if an error is found in the PID's complementary form, the trigger is set immediately after the 8 bit of the PID ●...
- Page 732 ® Protocol Analysis R&S USB (Option R&S RTE-K60) You can refine the trigger condition: ● "Address check" on page 724 ● "End Point check" on page 724 ● "PID error check" on page 724 Error condition Sets the trigger in case of one of the following eight different error condition types. ●...
- Page 733 ® Protocol Analysis R&S USB (Option R&S RTE-K60) "Min" Specifies an address, or sets the start value of an address range. "Max" Sets the the end value of an address range if "Condition" (TRIGger<m>:USB:ACONdition) is set to INRange or OORange. Remote command: on page 1580 TRIGger<m>:USB:WADD...
- Page 734 ® Protocol Analysis R&S USB (Option R&S RTE-K60) SC check Defines, whether a Start / Complete SPLIT transaction check is executed or not. Remote command: on page 1581 TRIGger<m>:USB:WSTC on page 1578 TRIGger<m>:USB:STCO Port check Defines, whether a port check that meets specific conditions is executed or not. "Condition"...
- Page 735 ® Protocol Analysis R&S USB (Option R&S RTE-K60) "Condition" Defining a specific endpoint type or an ET range requires to set the operator to one of the following: equal, not equal, less than, less than or equal, greater than, greater than or equal, in range, out of range. "Min"...
- Page 736 ® Protocol Analysis R&S USB (Option R&S RTE-K60) 1. In the "Protocol" dialog > "Configuration" tab, enable "Decode". 2. In the "Protocol" dialog > "Display" tab, select additional result display settings: "Show decode table" and "Show binary signals". For a description of the display set- tings, see also Chapter 12.1.2, "Display",...
- Page 737 ® Protocol Analysis R&S USB (Option R&S RTE-K60) blue = endpoint purple = CRC5/16 grey = payload data bytes The example in Figure 12-104 shows a simulated USB high speed message. A Token SETUP packet has been decoded, which contains a CRC5 error. The next event is a Token IN packet and an incomplete MDATA packet.
- Page 738 ® Protocol Analysis R&S USB (Option R&S RTE-K60) Figure 12-105: USB HSIC protocol: decoded and binary signal, and decode results green brackets [...] = start and end of packet blue packet = packet ok green packet = data packet ok red packet = error condition yellow...
- Page 739 ® Protocol Analysis R&S USB (Option R&S RTE-K60) Export of decode results You can export the decode results to a CSV or HTML file: 1. Press the FILE key on the left. 2. Select the "Waveforms/Results" tab > "Numeric" subtab. 3.
- Page 740 ® Protocol Analysis R&S USB (Option R&S RTE-K60) Individual search parameters (which do not depend on the USB protocol type and trig- ger settings), can be specified in the tabs below the "Search criteria" dialog. Remote command: on page 1596 SEARch:TRIGger:USB:SSOP on page 1598 SEARch:TRIGger:USB:STOKen...
- Page 741 ® Protocol Analysis R&S USB (Option R&S RTE-K60) You can refine the search condition: ● "Frame number check" on page 736 Remote command: on page 1599 SEARch:TRIGger:USB:TOKen Data Searches for data packets of the following types: DATA0, DATA1, DATA2, or MDATA, as well as "Any"...
- Page 742 ® Protocol Analysis R&S USB (Option R&S RTE-K60) Remote command: on page 1593 SEARch:TRIGger:USB:HAND Special PID Searches for four different special packet identifier types: "PREamble", "ERR", "SPLIT", or "PING", as well as "Any" special PID. For "Any", "PREamble", or "ERR", there are no additional parameters to be defined. For "SPLIT", additional search parameters are "Address check", "SC check", "Port check", "SEU check", and "ET check".
- Page 743 ® Protocol Analysis R&S USB (Option R&S RTE-K60) "PID Error" Searches for packet identifier errors. Remote command: on page 1594 SEARch:TRIGger:USB:PIDerror "CRC5 Error" Searches for any CRC5 error event. Remote command: on page 1589 SEARch:TRIGger:USB:CRC5error "CRC16 Error" Searches for any CRC16 error event. Remote command: on page 1589 SEARch:TRIGger:USB:CRC16error...
- Page 744 ® Protocol Analysis R&S USB (Option R&S RTE-K60) "Condition" Defining a specific endpoint or an endpoint range requires to set the operator to one of the following: equal, not equal, less than, less than or equal, greater than, greater than or equal, in range, out of range. "Min"...
- Page 745 ® Protocol Analysis R&S USB (Option R&S RTE-K60) on page 1590 SEARch:TRIGger:USB:DCONdition on page 1593 SEARch:TRIGger:USB:PATT SC check Searches for the selected Start (0) or Complete (1) SPLIT transaction endpoint, or X (don't care). Remote command: on page 1601 SEARch:TRIGger:USB:WSTC on page 1597 SEARch:TRIGger:USB:STCO Port check...
- Page 746 ® Protocol Analysis R&S USB (Option R&S RTE-K60) ET check Enables the search for an Endpoint Type (ET) that meets specific conditions. "Condition" Defining a specific endpoint type or an ET range requires to set the operator to one of the following: equal, not equal, less than, less than or equal, greater than, greater than or equal, in range, out of range.
- Page 747 ® Protocol Analysis R&S USB (Option R&S RTE-K60) 12.15.5.3 Searching USB Data Prerequisite: A serial bus is configured for the USB signal to be decoded and analyzed. The search for events is set up in the following way: 1. Press SEARCH or tap "Search" > "Setup" in the menu bar. 2.
-
Page 748: Usbpd (Option R&S Rte-K63)
® Protocol Analysis R&S USBPD (Option R&S RTE-K63) 6. To start searching the acquired waveform for specific events, tap "Enable" in the search setup dialog: The R&S RTE displays the "Search Results" box that lists the detected events. For information on how to configure the search results presentation and how to navigate the search results, see also "To display search zoom windows"... - Page 749 ® Protocol Analysis R&S USBPD (Option R&S RTE-K63) ● Control messages: 16-bit messages used to control the messages between the port partners or transfer messages with no extra data. A control message consists of a message header and a CRC. ●...
- Page 750 ® Protocol Analysis R&S USBPD (Option R&S RTE-K63) SCPI Description Message type XSRC Sources capabilities message Extended XSRS Security response Extended XSRQ Security request Extended XSTA Status Extended More information on the USBPD protocol, including all specifications down to the field contents, is available in the "Universal Serial Bus Power Delivery Specification"...
- Page 751 ® Protocol Analysis R&S USBPD (Option R&S RTE-K63) See also: Chapter 12.1.1, "Configuration - General Settings", on page 442. Data Defines the source settings for the data signal. Usually, the source is one of the analog channels. Reference and math waveforms are available as source if the trigger source is one of the analog channels but not the serial bus.
- Page 752 ® Protocol Analysis R&S USBPD (Option R&S RTE-K63) 12.16.2.2 Display Settings Access: PROTOCOL > "Configuration" tab > "Protocol = USBPD " > "Display" tab To enhance the decode possibilities of the USBPD protocol, you can use an additional setting in the "Display" tab: "Decode layer". Common display settings are explained in Chapter 12.1.2, "Display",...
- Page 753 ® Protocol Analysis R&S USBPD (Option R&S RTE-K63) 1. Press the PROTOCOL key on the front panel. 2. At the left-hand side, select the vertical tab of the bus you want to set up. 3. Select the "Configuration" tab. 4. Tap the "Protocol" button and select the protocol: "USBPD". 5.
- Page 754 ® Protocol Analysis R&S USBPD (Option R&S RTE-K63) Make sure that: ● The data source(s) of the serial bus are channel signals: PROTOCOL > "Configu- ration" tab. ● The trigger sequence is set to "A only": TRIGGER > "Sequence" tab. ●...
- Page 755 ® Protocol Analysis R&S USBPD (Option R&S RTE-K63) "Condition" Defining specific data or a data range requires to set the operator to one of the following conditions: equal, not equal, less than, less than or equal, greater than, greater than or equal, in range, out of range. "Min"...
- Page 756 ® Protocol Analysis R&S USBPD (Option R&S RTE-K63) 3. Tap "Serial bus" and select the serial bus that is set to USBPD, e.g.: The "Protocol" selection is then automatically set to "USBPD". 4. Tap "Trigger Type" and select the trigger type to be used for USBPD protocol analysis.
- Page 757 ® Protocol Analysis R&S USBPD (Option R&S RTE-K63) Figure 12-106: USBPD protocol: decoded and binary signal Green brackets [...] = Start and end of frame Dark green field = Header Light blue fields = CRC checksum Orange fields = Data bits The example in Figure 12-107 shows the same simulated USBPD message as in...
- Page 758 ® Protocol Analysis R&S USBPD (Option R&S RTE-K63) Figure 12-107: USBPD protocol: decoded and binary signal, and decode results Table 12-25: Content of the "Decode results" table Column Description State Overall state of the frame Start Time of frame start Stop Time of frame stop Frame Type...
- Page 759 ® Protocol Analysis R&S USBPD (Option R&S RTE-K63) Export of decode results You can export the decode results to a CSV or HTML file: 1. Press the FILE key on the left. 2. Select the "Waveforms/Results" tab > "Numeric" subtab. 3.
- Page 760 ® Protocol Analysis R&S USBPD (Option R&S RTE-K63) 12.16.5.1 USBPD Search Setup Access: SEARCH > "Setup" tab > "Source" = Serial bus configured for USBPD Search criteria Use the "Search criteria" dialog to define the frame type in which data is to be searched.
- Page 761 ® Protocol Analysis R&S USBPD (Option R&S RTE-K63) To get search results, "Enable" the search in the "Control" section of the "Search Setup" dialog. You can minimize, shift or close the search dialog to better see the "Search Results" table. If the "Show decode detail"...
- Page 762 ® Protocol Analysis R&S USBPD (Option R&S RTE-K63) ● on page 1623 SEARch:RESult:USBPd:FRAMe<m>:DATA? ● on page 1626 SEARch:RESult:USBPd:FRAMe<m>:TYPE? ● on page 1625 SEARch:RESult:USBPd:FRAMe<m>:INFO? ● on page 1625 SEARch:RESult:USBPd:FRAMe<m>:STATe? ● on page 1625 SEARch:RESult:USBPd:FRAMe<m>:STARt? ● on page 1626 SEARch:RESult:USBPd:FRAMe<m>:STOP? ● on page 1624 SEARch:RESult:USBPd:FRAMe<m>:FLD<n>:TYPE? ●...
-
Page 763: Spacewire (Option R&S Rte-K65)
® Protocol Analysis R&S SpaceWire (Option R&S RTE-K65) 4. Specify search criteria according to Chapter 12.16.5.1, "USBPD Search Setup", on page 752. 5. To acquire a waveform, press RUN N× SINGLE. The R&S RTE performs a USBPD decode according to the thresholds and protocol settings of the associated serial bus source (here in our example SB1). - Page 764 ® Protocol Analysis R&S SpaceWire (Option R&S RTE-K65) 12.17.1 SpaceWire Basic The SpaceWire links are a Point-toPoint (P2P) connections between a node and another node or a rooter. The link is full-duplex bidirectional serial data link. The SpaceWire has two type of characters: ●...
- Page 765 ® Protocol Analysis R&S SpaceWire (Option R&S RTE-K65) 12.17.2 SpaceWire Configuration 12.17.2.1 SpaceWire Configuration Settings Access: PROTOCOL > "Configuration" tab > "Protocol = SpaceWire" Make sure that the tab of the correct serial bus is selected on the left side. See also: Chapter 12.1.1, "Configuration - General Settings",...
- Page 766 ® Protocol Analysis R&S SpaceWire (Option R&S RTE-K65) Threshold Sets the threshold value for the strobe/data signal. Remote command: on page 1629 BUS<m>:SWIRe:STRBe:THReshold on page 1628 BUS<m>:SWIRe:DATA:THReshold Hysteresis Sets a value for the hysteresis of the strobe/data signal. Remote command: on page 1628 BUS<m>:SWIRe:STRBe:HYSTeresis on page 1627...
- Page 767 ® Protocol Analysis R&S SpaceWire (Option R&S RTE-K65) Remote command: on page 1251 BUS<m>:SETReflevels Coupling Enables coupling, i.e. the same threshold and hysteresis value is used for the strobe and data signal. Remote command: on page 1629 BUS<m>:SWIRe:COUPling 12.17.2.2 Display Settings Access: PROTOCOL >...
- Page 768 ® Protocol Analysis R&S SpaceWire (Option R&S RTE-K65) 12.17.2.3 Configuring the SpaceWire Signals For configuration, assign the lines to the input channels and define the logical thresh- olds and the hysteresis. 1. Press the PROTOCOL key on the front panel. 2.
- Page 769 ® Protocol Analysis R&S SpaceWire (Option R&S RTE-K65) Make sure that: ● The data source(s) of the serial bus are channel signals: PROTOCOL > "Configu- ration" tab. ● The trigger sequence is set to "A only": TRIGGER > "Sequence" tab. ●...
- Page 770 ® Protocol Analysis R&S SpaceWire (Option R&S RTE-K65) "Data pattern" Sets the trigger to a defined data pattern or pattern range. "NULL frame" Sets the trigger to a null frame, a frame without usable data. "Time Code" Sets the trigger to a time-code control code. You can define the data pattern of the time code to be triggered on.
- Page 771 ® Protocol Analysis R&S SpaceWire (Option R&S RTE-K65) "Data Max" The second data pattern is required to specify a range with conditions "In range" and "Out of range". Remote command: on page 1632 TRIGger<m>:SWIRe:TIME:CONDition on page 1633 TRIGger<m>:SWIRe:TIME:MAX on page 1633 TRIGger<m>:SWIRe:TIME:MIN Data(Data Pattern) Sets the specified data type for the data pattern to be triggered on.
- Page 772 ® Protocol Analysis R&S SpaceWire (Option R&S RTE-K65) 3. Tap "Serial bus" and select the serial bus that is set to SpaceWire, e.g.: The "Protocol" selection is then automatically set to "SpaceWire". 4. Select the "Trigger Type" to be used for SpaceWire protocol analysis. 5.
- Page 773 ® Protocol Analysis R&S SpaceWire (Option R&S RTE-K65) Figure 12-112: Decoded SpaceWire signal with ambiguous bits The example in Figure 12-113 shows a decoded signal with existing parity errors. The errors are marked with red on the honeycomb and reflected in the results table. Figure 12-113: Decoded SpaceWire signal with a parity error Table 12-27: Content of the decode result table Column...
- Page 774 ® Protocol Analysis R&S SpaceWire (Option R&S RTE-K65) Column Description Type Frame type Data Data value Export of decode results You can export the decode results to a CSV or HTML file: 1. Press the FILE key on the left. 2.
- Page 775 ® Protocol Analysis R&S SpaceWire (Option R&S RTE-K65) Type Sets the search type for the SpaceWire analysis. "Control frame" Searches for the selected control type frame. "Data pattern" Searches for a defined data pattern or pattern range. "NULL frame" Searches for a null frame, a frame without usable data. User Manual 1326.1032.02 ─...
- Page 776 ® Protocol Analysis R&S SpaceWire (Option R&S RTE-K65) "Time Code" Searches for a time-code control code. You can define the data pat- tern of the time code to be searched for. "ERRORs" Searches for an enabled error type. Remote command: on page 1639 SEARch:TRIGger:SWIRe:TYPE Trigger Control Type...
- Page 777 ® Protocol Analysis R&S SpaceWire (Option R&S RTE-K65) "Data Min/ Defines the bit pattern of the data pattern. Data" In binary format, use the following characters: 1; 0; or X (don't care). The bit pattern editor helps you to enter the pattern in any format, see Chapter 12.1.4, "Bit Pattern Editor", on page 448.
-
Page 778: Cxpi (Option R&S Rte-K76)
® Protocol Analysis R&S CXPI (Option R&S RTE-K76) The search for events is set up in the following way: 1. Press SEARCH or tap "Search" > "Setup" in the menu bar. 2. If the dialog box does not contain a search entry, tap the icon to create one, as described in "To create a user-defined search"... - Page 779 ® Protocol Analysis R&S CXPI (Option R&S RTE-K76) The event trigger method can be used when the focus is placed on the responsive- ness of the slave node communication. The polling method puts the focus on the communication periodicity. ● Maximum baud rate of 20kbit/s ●...
- Page 780 ® Protocol Analysis R&S CXPI (Option R&S RTE-K76) – extension DLC: 1 byte that is added to the frame information for long frames. It indicates the length of the data byte field of a long frame. ● Data byte: the length of the data byte field depends on the frame type. It contains the actual information of the frame.
- Page 781 ® Protocol Analysis R&S CXPI (Option R&S RTE-K76) Usually, the source is one of the analog channels. Reference and math waveforms are available as source if the trigger source is one of the analog channels but not the serial bus. Alternatively, digital channels can be used if MSO option R&S RTE-B1 is installed.
- Page 782 ® Protocol Analysis R&S CXPI (Option R&S RTE-K76) Bit rate/ Average bit rate If enabled, sets the number of transmitted bits per second. If disabled, the bit rate is measured and the average bit rate in the acquisition window is displayed. Remote command: on page 1642 BUS<m>:CXPI:BITRate:ENABle...
- Page 783 ® Protocol Analysis R&S CXPI (Option R&S RTE-K76) "Binary" "Bits" 12.18.2.3 Configuring the CXPI Signals For configuration, assign the lines to the input channels and define the logical thresh- olds and the hysteresis. 1. Press the PROTOCOL key on the front panel. 2.
- Page 784 ® Protocol Analysis R&S CXPI (Option R&S RTE-K76) Make sure that: ● The data source(s) of the serial bus are channel signals: PROTOCOL > "Configu- ration" tab. ● The trigger sequence is set to "A only": TRIGGER > "Sequence" tab. ●...
- Page 785 ® Protocol Analysis R&S CXPI (Option R&S RTE-K76) "NM" on page 783. ● Set a CT value expected in the frame. See: "CT" on page 783. ● Set a DLC pattern or DLC pattern range to trigger only on frames that fulfill these conditions.
- Page 786 ® Protocol Analysis R&S CXPI (Option R&S RTE-K76) Sleep ← Trigger type Triggers on a sleep frame. You can refine the trigger condition: ● Set an NM value expected in the frame. "NM" on page 783. ● Set a CT value expected in the frame. See: "CT"...
- Page 787 ® Protocol Analysis R&S CXPI (Option R&S RTE-K76) ● Set an index or index range to trigger only on frames that fulfill these conditions. See: "Index" on page 782. Long Poll ← Trigger type Triggers on a long poll frame. You can refine the trigger condition: ●...
- Page 788 ® Protocol Analysis R&S CXPI (Option R&S RTE-K76) See:"Frame ID" on page 781. PTYPE ← Trigger type Triggers on a Protected TYPE (PTYPE) field, a special PID field with a frame ID of 00 (hex) and a parity of 1. It is used only in the polling method. PTYPE + PID ←...
- Page 789 ® Protocol Analysis R&S CXPI (Option R&S RTE-K76) ● "DLC Error" Data length code error occurs when the value of the DLC field is different from the data byte field value.In case of a DLC error it is still possible to build a frame, but there are too many/too few data words.
- Page 790 ® Protocol Analysis R&S CXPI (Option R&S RTE-K76) "DLC max" The second DLC pattern is required to specify a range with conditions "In range" and "Out of range". Remote command: on page 1648 TRIGger<m>:CXPI:DLC:CONDition on page 1649 TRIGger<m>:CXPI:DLC:MAX on page 1649 TRIGger<m>:CXPI:DLC:MIN DLC Extend Sets the extension data length code, which indicates the length of the data byte of a...
- Page 791 ® Protocol Analysis R&S CXPI (Option R&S RTE-K76) "Index max" The second data index is required to specify a range with conditions "In range" and "Out of range". Remote command: on page 1646 TRIGger<m>:CXPI:DATA:ICONdition on page 1647 TRIGger<m>:CXPI:DATA:IMAX on page 1647 TRIGger<m>:CXPI:DATA:IMIN Sets the value of the network management (NM) field, 2 bits indicating if the frame is in wakeup or sleep mode.
- Page 792 ® Protocol Analysis R&S CXPI (Option R&S RTE-K76) 12.18.4 Search on Decoded CXPI Data Using the search functionality, you can find various events in the decoded data, the same events which you also can trigger on. Before you can start the search, you have to configure the bus correctly and acquire decoded data.
- Page 793 ® Protocol Analysis R&S CXPI (Option R&S RTE-K76) "Normal Poll" Searches for a normal poll frame. You can refine the search condition, see: ● "Frame ID" on page 785 ● "NM" on page 787 ● "CT" on page 787 ● "DLC"...
- Page 794 ® Protocol Analysis R&S CXPI (Option R&S RTE-K76) Remote command: on page 1663 SEARch:TRIGger:CXPI:FID:CONDition on page 1664 SEARch:TRIGger:CXPI:FID:MAX on page 1664 SEARch:TRIGger:CXPI:FID:MIN Searches for a DLC pattern or a DLC range. The setup consists of the condition and one or two DLC patterns. The DLC setup settings are the same as in the CXPI trigger setup, see "DLC"...
- Page 795 ® Protocol Analysis R&S CXPI (Option R&S RTE-K76) Searches for the value of the network management (NM), 2 bits indicating if the frame is in wakeup or sleep mode. Remote command: on page 1652 TRIGger<m>:CXPI:NM Searches for the value of the counter (CT), 2 bits indicating the continuity of the frame. Remote command: on page 1658 SEARch:TRIGger:CXPI:CT...
- Page 796 ® Protocol Analysis R&S CXPI (Option R&S RTE-K76) ● on page 1668 SEARch:RESult:CXPI:FRAMe<m>:WORD<n>:TYPE? ● on page 1669 SEARch:RESult:CXPI:FRAMe<m>:WORD<n>:VALue? ● on page 1668 SEARch:RESult:CXPI:FRAMe<m>:WORD<n>:STATus? 12.18.4.3 Searching CXPI Data Prerequisites: A CXPI bus is configured, see Chapter 12.18.2, "CXPI Configuration", on page 772, and "Decode" is enabled. 1.
- Page 797 ® Protocol Analysis R&S CXPI (Option R&S RTE-K76) Figure 12-117: Decoded CXPI signal, normal polling frame green brackets [...] = start and end of frame green frame header = frame state is ok red frame header = error in frame green = Frame type/ frame ID green...
- Page 798 ® Protocol Analysis R&S CXPI (Option R&S RTE-K76) Figure 12-118: Decoded CXPI signal result tables, normal polling frame with CRC error Table 12-28: Content of the "Decode results" table Column Description State Overall state of the frame Start Time of frame start Stop Time of frame stop Type...
- Page 799 ® Protocol Analysis R&S CXPI (Option R&S RTE-K76) Table 12-29: Content of the "Decode results details" table Column Description Type Type (name) of field Numeric value The numeric value of the field Status Status of the field: OK or error Export of decode results You can export the decode results to a CSV or HTML file: 1.
-
Page 800: Power Analysis (Option R&S Rte-K31)
® Power Analysis (Option R&S RTE-K31) R&S Power Measurement Selection 13 Power Analysis (Option R&S RTE-K31) With the R&S RTE and option R&S RTE-K31 you can perform power analysis mea- surements. The following power measurements are available: ● Power Quality ●... - Page 801 ® Power Analysis (Option R&S RTE-K31) R&S Power Measurement Selection The tab has several areas: ● "General Settings": general settings, that can be used by all measurements, like deskewing. ● "Input": measurements for performing input line analysis. They are used to mea- sure the characteristics of the input power as well as the effects the power supply exudes to the input line.
- Page 802 ® Power Analysis (Option R&S RTE-K31) R&S Power Measurement Selection 5. Select the correct channels for the "Current Source" and the "Voltage Source". 6. Tap "Next". 7. Check and complete the probe setup in the "Probes" tab. Current probes and high-voltage differential probes cannot be automatically detec- ted by the instrument.
- Page 803 ® Power Analysis (Option R&S RTE-K31) R&S Power Measurement Selection Type, Name, Bandwidth The fields show the characteristics of a recognized or predefined probe for information. If the instrument cannot recognize the probe, and the probe is not known, the "Type" is "None", and the other fields are empty.
- Page 804 ® Power Analysis (Option R&S RTE-K31) R&S Power Measurement Selection Current channel skew Shows the skew settings of the channel connected to the current probe. Skew settings are defined in the "Horizontal > Skew" dialog box. See also: Chapter 4.8.2, "Skew", on page 184 Overwrite present skew setup...
- Page 805 ® Power Analysis (Option R&S RTE-K31) R&S Power Measurement Selection Remote command: on page 1712 POWer:DESKew:UDPReset Auto Deskew Starts an auto deskew. Make sure that the probes are configured correctly before you start the deskewing. Remote command: on page 1712 POWer:DESKew:EXECute 13.1.1.2 Access: "Analysis"...
- Page 806 ® Power Analysis (Option R&S RTE-K31) R&S Power Measurement Selection Temperature Enter the temperature. Remote command: on page 1714 POWer:REPort:TEMPerature Description Enter a description. Remote command: on page 1714 POWer:REPort:DESCription 13.1.1.3 Report Access "Analysis">"Power" > "Report". Test Results After executing a measurement, you can press "Add to report" and save the results. In this tab you can manage all saved measurement results.
- Page 807 ® Power Analysis (Option R&S RTE-K31) R&S Power Measurement Selection "DUT" Shows the name of the DUT, see Chapter 13.1.1.2, "DUT", on page 797. "Date" Shows the date of the measurement. "Time" Shows at what time, the measurement result was added to report. "Comment"...
- Page 808 ® Power Analysis (Option R&S RTE-K31) R&S Power Measurement Selection Report Path Enter the file name to load or to save the report to, and select the file format with the format button on the right. "Load" Loads the most recently created report with the Windows default viewer application for the pdf/rtf file format.
- Page 809 ® Power Analysis (Option R&S RTE-K31) R&S Power Measurement Selection "US Letter" Selects US Letter. Remote command: on page 1715 POWer:REPort:PAPersize Font Sets the font for the report Font Family ← Font Selects the font family. "Arial" Selects the font Arial. "Helvetica"...
- Page 810 ® Power Analysis (Option R&S RTE-K31) R&S Power Measurement Selection Title Page Adds a Title page to the report. The contents can be set up in the "DUT" dialog, see Chapter 13.1.1.2, "DUT", on page 797. Remote command: on page 1713 POWer:REPort:CONTent:TITLe Measurement Setup Adds a graphic of the measurement setup.
-
Page 811: Overview Of Power Measurement Setup
® Power Analysis (Option R&S RTE-K31) R&S Overview of Power Measurement Setup Horizontal Setup Adds the horizontal setup settings. Remote command: on page 1713 POWer:REPort:CONTent:HSETup Measured signals Adds a diagram of the measured signal. Remote command: on page 1713 POWer:REPort:CONTent:MSIGnal Results Adds the result box. - Page 812 ® Power Analysis (Option R&S RTE-K31) R&S Overview of Power Measurement Setup Depending on the selected power measurement, one or two voltage sources and cur- rent sources are required. Current Source Sets the channel for the current source. Remote command: on page 1711 POWer:SOURce:CURRent<1..2>...
- Page 813 ® Power Analysis (Option R&S RTE-K31) R&S Overview of Power Measurement Setup 13.2.3 Details Tab In the "Details" tab you find information on the measurement resources used by the selected power measurement. The following resources may be used: ● Measurements ●...
-
Page 814: Power Quality
® Power Analysis (Option R&S RTE-K31) R&S Power Quality The instrument enables the required resources when the power measurement is star- ted. 13.3 Power Quality In an electric circuit power is a measure for the rate of flow of energy at a certain point of the circuit. - Page 815 ® Power Analysis (Option R&S RTE-K31) R&S Power Quality The used resources are listed in the "Details" tab. See also: Chapter 13.2.3, "Details Tab", on page 805. Voltage and current results The voltage and current results are defined as follows: Result Description Square root of the mean of the square of the current...
- Page 816 ® Power Analysis (Option R&S RTE-K31) R&S Power Quality ∙ I Real power, P P = V Energy of the system that can INSTANTENEOUS INSTANTENEOUS be used to do work. (averaged over N cycles) φ Reactive power, Q Q = |S| sin Power flow that is temporally (Volt‑Ampere stored in a system because of...
- Page 817 ® Power Analysis (Option R&S RTE-K31) R&S Power Quality 6. Select the correct channels of the "Current Source" and the "Voltage Source". 7. Select the "Settings" tab. 8. Set the "Input frequency" according to your signal. 9. Select an "Optimize Scaling" option. 10.
- Page 818 ® Power Analysis (Option R&S RTE-K31) R&S Power Quality Input frequency Selects the input frequency of the source signal. Remote command: on page 1719 POWer:QUALity:FREQ Custom frequency Sets the user-defined frequency if the "Input frequency" is set to "Custom". Remote command: on page 1719 POWer:QUALity:FCUS Optimize scaling...
-
Page 819: Inrush Current
® Power Analysis (Option R&S RTE-K31) R&S Inrush Current 13.4 Inrush Current The "Inrush Current" analysis measures the peak of the input current that is drawn by the device, when the device is first turned on. Required probes: ● Current probe 13.4.1 Inrush Current Results The results of "Inrush Current"... - Page 820 ® Power Analysis (Option R&S RTE-K31) R&S Inrush Current 4. Select the correct channel for the "Current Source". 5. Select "Vertical" > "Probe Setup" > "Channel" and set your probe parameters. 6. Connect the probes to the DUT as shown in the "Channels" tab: 7.
- Page 821 ® Power Analysis (Option R&S RTE-K31) R&S Inrush Current Maximum current Sets the maximum expected current for the vertical scale. Set the value according to your signal in order to avoid saturation. Remote command: on page 1721 POWer:INRush:MAXCurrent Trigger current value (T) Sets the current value for the trigger.
-
Page 822: Current Harmonic
® Power Analysis (Option R&S RTE-K31) R&S Current Harmonic Start time ← Gate Configuration Sets the start measuring time for the selected gate. Remote command: on page 1721 POWer:INRush:GATE<m>:STARt Stop time ← Gate Configuration Sets the stop measuring time for the selected gate. Remote command: on page 1721 POWer:INRush:GATE<m>:STOP... - Page 823 ® Power Analysis (Option R&S RTE-K31) R&S Current Harmonic To measure and display the current harmonic, the instrument uses the following mea- surements and waveforms: ● "P6" Meas 6 to measure the power waveform ● "P7" Meas 7 to measure the spectrum voltage ●...
- Page 824 ® Power Analysis (Option R&S RTE-K31) R&S Current Harmonic Result Table Bar Chart Match Description Standard limit Shown by a white bar The maxim allowed value according to the selected standard "Y max" "Y max" Sets the upper limit for the display of the Y scale.
- Page 825 ® Power Analysis (Option R&S RTE-K31) R&S Current Harmonic 6. Select the correct channels for the "Current Source" and the "Voltage Source". 7. Select the "Settings" tab. 8. Set the "Standard in use" 9. Set the "Frequency" according to your signal. 10.
- Page 826 ® Power Analysis (Option R&S RTE-K31) R&S Current Harmonic Standard in use Select the standard in use. For a list of the available standards, see Table 13-1. Table 13-1: Current Harmonic pre-compliance standards Standard Application EN 61000-3-2 Class A Balanced 3-phase equipment, household appliances (excluding equipment identified as class D), tools (excluding portable tools), dimmers for incandescent lamps, audio equipment...
-
Page 827: Modulation Analysis
® Power Analysis (Option R&S RTE-K31) R&S Modulation Analysis Revised Current Available only for "Standard" > "RTCA DO-160". Selects how the results are evaluated. Available are the following settings: ● Evaluation with current source only ● Evaluation with voltage source and revised current law –... - Page 828 ® Power Analysis (Option R&S RTE-K31) R&S Modulation Analysis ● (Optional for "Type > Continuous" measurement) Two histograms display the den- sity distribution of the measurement results in dependance of the frequency and the positive duty cycle. ● The result box displays the numeric measurement results. To measure and display the power quality, the instrument uses the following measure- ments and waveforms: ●...
- Page 829 ® Power Analysis (Option R&S RTE-K31) R&S Modulation Analysis 13.6.2 Configuring Modulation Analysis For details of the configuration settings, see Chapter 13.6.3, "Modulation Analysis Set- tings", on page 821. 1. Select "Analysis" > "Power". 2. Under "Switching / Control Loop" select "Modulation Analysis". 3.
- Page 830 ® Power Analysis (Option R&S RTE-K31) R&S Modulation Analysis Source Selects the source for the measurement. Remote command: on page 1726 POWer:MODulation:SOURce Type Selects the type of signal flow for the measurement "Continuous" The measurement is running continuously. "Turn on" The measurement runs once when the DUT is turned on.
-
Page 831: Dynamic On Resistance
® Power Analysis (Option R&S RTE-K31) R&S Dynamic On Resistance Report comment In this field you can write a comment that will be displayed in the measurement report, for example, a measurement description. Execute Starts the "Modulation Analysis" measurement. Remote command: on page 1725 POWer:MODulation:EXECute 13.7 Dynamic On Resistance... - Page 832 ® Power Analysis (Option R&S RTE-K31) R&S Dynamic On Resistance The dynamic on resistance displayed as the result is defined as: The points "t " , "t ", "t " and "t " are defined by the cursor lines displayed in the result diagram of the measurement.
- Page 833 ® Power Analysis (Option R&S RTE-K31) R&S Dynamic On Resistance 8. If "Average" is selected, enter the "Average count", that is the number of wave- forms used for average calculation. 9. Set the reset condition for the average calculation: ● If "Time"...
-
Page 834: Slew Rate
® Power Analysis (Option R&S RTE-K31) R&S Slew Rate Remote command: on page 1727 POWer:DONRes:AVG Auto reset mode / Reset mode Defines when the envelope and average evaluation restarts. "None" No restart, the number of acquisitions considered by the waveform arithmetics is not limited. - Page 835 ® Power Analysis (Option R&S RTE-K31) R&S Slew Rate Required probes: ● Differential voltage probe ● Current probe 13.8.1 Slew Rate Results The results of "Slew Rate" measurements are provided in two ways: ● The diagram shows the graphical presentation of: –...
- Page 836 ® Power Analysis (Option R&S RTE-K31) R&S Slew Rate 1. Select "Analysis" > "Power". 2. Under "Switching / Control Loop" dialog select "Slew Rate". 3. Connect the differential voltage probe and the current probe to the oscilloscope. 4. Deskew the probes as described in Chapter 13.1.1.1, "Auto Deskew", on page 793.
- Page 837 ® Power Analysis (Option R&S RTE-K31) R&S Slew Rate In the "Settings" tab you configure the slew rate measurement parameters and display settings. Source Selects dV/dt or dI/dt as the source of the measurement. Remote command: on page 1728 POWer:SLEWrate:SOURce Average Enables the "Average"...
-
Page 838: Safe Operating Area (S.o.a.)
® Power Analysis (Option R&S RTE-K31) R&S Safe Operating Area (S.O.A.) Reset Forces the immediate restart of the envelope and average calculation for all wave- forms. Remote command: on page 992 ACQuire:ARESet:IMMediate Optimize scaling Selects the scaling for the display of the results. "Autoscale the signals"... - Page 839 ® Power Analysis (Option R&S RTE-K31) R&S Safe Operating Area (S.O.A.) ● A logarithmic or linear XY diagram of the calculated voltage (x-axis) and current (y- axis) waveforms. This curve is a graphical representation of the power handling capability of the device under various conditions. ●...
- Page 840 ® Power Analysis (Option R&S RTE-K31) R&S Safe Operating Area (S.O.A.) Result Description State Shows if the test has been completed. The state is set to "Finished" when "Nx Single count" acquisi- tions are tested and the number of "Acq. remaining" is 0.
- Page 841 ® Power Analysis (Option R&S RTE-K31) R&S Safe Operating Area (S.O.A.) 6. Select the correct channels of the "Current Source" and the "Voltage Source". 7. Select the "Settings" tab. 8. Select the state of the "Enable mask test". 9. Select the "Scale". 10.
- Page 842 ® Power Analysis (Option R&S RTE-K31) R&S Safe Operating Area (S.O.A.) Enable mask test Enables a mask test. Remote command: on page 1732 POWer:SOA:MASK Scale Selects the scale for the result diagram. Remote command: on page 1732 POWer:SOA:SCALe SOA point definition In this table you can set voltage-current points to define a mask for the safe point opearing area.
-
Page 843: Turn On/ Off
® Power Analysis (Option R&S RTE-K31) R&S Turn On/ Off Remote command: on page 1732 POWer:SOA:LINear:POINt<m>:VOLTage Ampere ← SOA point definition Sets the current value of the SOA point. Remote command: on page 1731 POWer:SOA:LINear:POINt<m>:CURRent Report comment In this field you can write a comment that will be displayed in the measurement report, for example, a measurement description. - Page 844 ® Power Analysis (Option R&S RTE-K31) R&S Turn On/ Off The used resources are listed in the "Details" tab. See also: Chapter 13.2.3, "Details Tab", on page 805. The"Turn on time" is measured as the time between the trigger point ("Trigger level on" value is reached) and the time the given percentage of the "Steady state level"...
- Page 845 ® Power Analysis (Option R&S RTE-K31) R&S Turn On/ Off 8. Tap "Execute". 9. Turn on/off the DUT. On the screen you can see the measurement. Additionally, the result box displays the turn on or the turn off time. For details, see Chapter 13.10.1, "Turn On/ Off Results", on page 835.
- Page 846 ® Power Analysis (Option R&S RTE-K31) R&S Turn On/ Off Figure 13-3: Settings turn off time Input Type To acces this setting select the "Channels" tab. Selects the AC or DC input type. Remote command: on page 1734 POWer:ONOFf:INPut Measurement Type Selects the"Turn on"...
-
Page 847: Switching Loss
® Power Analysis (Option R&S RTE-K31) R&S Switching Loss Steady state level- Turn off ← Turn off Sets the percentage of the steady state level of the DC output that has to be reached. Remote command: on page 1733 POWer:ONOFf:DSOFf Trigger level ←... - Page 848 ® Power Analysis (Option R&S RTE-K31) R&S Switching Loss ● The result box displays the numeric measurement results for the enabled measure- ment parameters in dependance of the energy and the power. To switch the dis- play, tap "Energy" or "Power" accordingly. For a detailed description, see Table 13-2.
- Page 849 ® Power Analysis (Option R&S RTE-K31) R&S Switching Loss Table 13-4: Switching loss phases Phase Definition Points Description Turn on The area between "t " and "t " The time after switching the device, during which the current rises until it reaches the saturation current level.
- Page 850 ® Power Analysis (Option R&S RTE-K31) R&S Switching Loss 13.11.2 Configuring Switching Loss For details of the configuration settings, see Chapter 13.11.3, "Switching Loss Set- tings", on page 842. 1. Select "Analysis" > "Power". 2. Under "Power Path", select "Switching Loss". 3.
- Page 851 ® Power Analysis (Option R&S RTE-K31) R&S Switching Loss Measure In this area you can select the parameters that are included in the analysis after exe- cuting the measurement. Switching frequency ← Measure Enables the measurements of the switching frequency. If disabled you can enter the value of the switching frequency.
-
Page 852: Power Efficiency
® Power Analysis (Option R&S RTE-K31) R&S Power Efficiency Total Enables the measurements of the total period Remote command: on page 1736 POWer:SWITching:TOTal Optimize scaling Selects the scaling for the display of the results. "Autoscale the signals" Automatically selects the most appropriate scale for the display of the results. - Page 853 ® Power Analysis (Option R&S RTE-K31) R&S Power Efficiency – the power input waveform – the power output waveform ● The result box displays the numeric measurement results of the "Input power", "Output power" and the "Efficiency". For a detailed description, see Table 13-2.
- Page 854 ® Power Analysis (Option R&S RTE-K31) R&S Power Efficiency 6. Select the correct channels for the "Current Source" and the "Voltage Source" of the input and the output. 7. Select the "Settings" tab. 8. Select an "Optimize Scaling" option. 9. Tap "Execute". On the screen you can see the measurement waveforms of the input power and the output power.
-
Page 855: Output Ripple
® Power Analysis (Option R&S RTE-K31) R&S Output Ripple Optimize scaling Selects the scaling for the display of the results. "Autoscale the signals" Automatically selects the most appropriate scale for the display of the results. "Keep present settings" The present display settings are not changed. Remote command: on page 1738 POWer:EFFiciency:AUTO... - Page 856 ® Power Analysis (Option R&S RTE-K31) R&S Output Ripple To measure and display the output ripple, the instrument uses the following measure- ments and waveforms: ● "P7" Meas 7 to measure the current ● "P8" Meas 8 to measure the voltage The used resources are listed in the "Details"...
- Page 857 ® Power Analysis (Option R&S RTE-K31) R&S Output Ripple Meas. type Symbol Description/Result Pos. duty cycle Positive duty cycle: Width of a positive pulse in relation to the PosCyc period in %. The measurement requires at least one complete period of a triggered signal. Multiple measurement is possible. PosPulse ...
- Page 858 ® Power Analysis (Option R&S RTE-K31) R&S Output Ripple ● on page 1743 POWer:RIPPle:RESult:NDCYcle:EVTCount? ● on page 1743 POWer:RIPPle:RESult:NDCYcle:NPEak? ● on page 1743 POWer:RIPPle:RESult:NDCYcle:PPEak? ● on page 1743 POWer:RIPPle:RESult:NDCYcle:RMS? ● on page 1743 POWer:RIPPle:RESult:NDCYcle:STDDev? ● on page 1743 POWer:RIPPle:RESult:NDCYcle:WFMCount? ● on page 1743 POWer:RIPPle:RESult:NDCYcle[:ACTual]? ●...
- Page 859 ® Power Analysis (Option R&S RTE-K31) R&S Output Ripple ● on page 1745 POWer:RIPPle:RESult:STDDev[:ACTual]? ● on page 1741 POWer:RIPPle:REPort:ADD 13.13.2 Configuring Output Ripple For details of the configuration settings, see Chapter 13.13.3, "Output Ripple Settings", on page 852. 1. Select "Analysis" > "Power". 2.
- Page 860 ® Power Analysis (Option R&S RTE-K31) R&S Output Ripple 13.13.3 Output Ripple Settings In the "Channels" tab, you set the current source and the voltage source, see also: Chapter 13.2.1, "Channels Tab", on page 803 and POWer:RIPPle:CURRent on page 1741) In the "Settings"...
-
Page 861: Transient Response
® Power Analysis (Option R&S RTE-K31) R&S Transient Response Execute Starts the "Output Ripple" measurement. Remote command: on page 1741 POWer:RIPPle:EXECute 13.14 Transient Response The "Transient Response" analysis measures the response of a system to a change from equilibrium. This response is described by different properties like the rise time, the overshoot, the settling time, the peak time and the delay time. - Page 862 ® Power Analysis (Option R&S RTE-K31) R&S Transient Response Figure 13-5: Graphical presentation of the transient response properties Table 13-6: Transient response Result Description Rise time The time needed for the signal to change from 10% to 90% of the specified signal high.
- Page 863 ® Power Analysis (Option R&S RTE-K31) R&S Transient Response 6. Select the correct channels for the "Current Source" and the "Voltage Source". 7. Select the "Settings" tab. 8. Set the "Trigger" settings according to your signal. 9. Set the "Tube tolerance", "Signal high" and "Signal low" according to your require- ments.
- Page 864 ® Power Analysis (Option R&S RTE-K31) R&S Transient Response Trigger Sets the properties of the trigger. Source ← Trigger Sets the source channel of the trigger. Remote command: on page 1748 POWer:TRANsient:TRGChannel Edge Trigger Slope ← Trigger Sets the edge type for the trigger event. "Positive"...
-
Page 865: Output Spectrum
® Power Analysis (Option R&S RTE-K31) R&S Output Spectrum Remote command: on page 1747 POWer:TRANsient:SIGHigh Signal low Sets the expected signal low voltage value. Remote command: on page 1748 POWer:TRANsient:SIGLow Horizontal Configures the horizontal scale of the result diagram. SMPS switching frequency ← Horizontal Sets the SMPS switching frequency. - Page 866 ® Power Analysis (Option R&S RTE-K31) R&S Output Spectrum Required probes: ● Voltage probe 13.15.1 Output Spectrum Results After executing the "Output Spectrum" measurement the following windows are dis- played: The results of "Power Quality" measurements are provided in two ways: ●...
- Page 867 ® Power Analysis (Option R&S RTE-K31) R&S Output Spectrum 13.15.2 Configuring Output Spectrum For details of the configuration settings, see Chapter 13.15.3, "Output Spectrum Set- tings", on page 859. 1. Select "Analysis">"Power". 2. Under "Output", select "Spectrum". 3. Select the "Channels" tab. 4.
- Page 868 ® Power Analysis (Option R&S RTE-K31) R&S Output Spectrum Horizontal Configures the horizontal scale of the result diagram. SMPS switching frequency ← Horizontal Sets the SMPS switching frequency. Set the value according to your DUT. Remote command: on page 1749 POWer:SPECtrum:FREQuency Derived scale ←...
-
Page 869: Mixed Signal Option (Mso, R&S Rte-B1)
® Mixed Signal Option (MSO, R&S RTE-B1) R&S Digital channels and parallel buses 14 Mixed Signal Option (MSO, R&S RTE-B1) The Mixed Signal Option R&S RTE-B1 adds logic analyzer functions to the classical oscilloscope functions. Using the MSO option, you can analyze and debug embedded systems with mixed-signal designs that use analog signals and correlated digital sig- nals simultaneously. - Page 870 ® Mixed Signal Option (MSO, R&S RTE-B1) R&S Digital channels and parallel buses You can display each bus and use it as trigger source, as well. For each active parallel bus, the corresponding signal icon appears on the signal bar and indicates the assigned digital channels.
- Page 871 ® Mixed Signal Option (MSO, R&S RTE-B1) R&S Digital channels and parallel buses If you have configured several parallel buses and you want to modify the configuration or display settings, make sure that the tab of the correct bus is selected on the left side, and disable the bus before you change the settings.
- Page 872 ® Mixed Signal Option (MSO, R&S RTE-B1) R&S Digital channels and parallel buses Show dig. signals If enabled, the selected digital channels are shown in the diagram. Each channel is dis- played as a logic signal. Remote command: on page 1676 BUS<m>:PARallel:DISPlay:SHDI Show bus If enabled, the resulting bus signal and bus values are displayed in the diagram.
- Page 873 ® Mixed Signal Option (MSO, R&S RTE-B1) R&S Digital channels and parallel buses See also: "Bus representation" on page 864 Clocked bus setup If a bus is a clocked bus, one of the digital channels serves as clock of the bus. For an unclocked bus, the logical state of the bus is determined for each sample.
- Page 874 ® Mixed Signal Option (MSO, R&S RTE-B1) R&S Digital channels and parallel buses Signal selection In the table, you select and configure the digital channels that are used in the selected bus. "State" Enables a digital channel, and assigns it to the bus. "Label"...
- Page 875 ® Mixed Signal Option (MSO, R&S RTE-B1) R&S Digital channels and parallel buses You can also set different thresholds for the individual channel groups: Disable "Cou- pling" and set the threshold value for each group. As long as the buses are disabled, you can set different thresholds for each bus.
- Page 876 ® Mixed Signal Option (MSO, R&S RTE-B1) R&S Digital channels and parallel buses Dig. resolution Shows the current digital resolution of the digital channels. The maximum digital record length is always 200 MSa per digital channel. This number is independent of addition- ally installed memory.
- Page 877 ® Mixed Signal Option (MSO, R&S RTE-B1) R&S Digital channels and parallel buses 1. Connect the digital probe cable to any of the MSO connectors on the rear panel of the instrument as shown on the Documentation Card delivered with the digital probe.
-
Page 878: Display
® Mixed Signal Option (MSO, R&S RTE-B1) R&S Display 1. On the "Analysis" menu, tap "Parallel buses". 2. To set the thresholds, use one of the following ways: ● Use the same value for all digital channels and all parallel buses: Enable "Cou- pling"... - Page 879 ® Mixed Signal Option (MSO, R&S RTE-B1) R&S Display The trigger point is always visible on the display, it cannot be moved outside ("Restrict horizontal position to acquisition range" is enabled automatically). If digital channels are active, the trigger point is always visible on the display, it cannot be moved outside.
-
Page 880: Trigger
® Mixed Signal Option (MSO, R&S RTE-B1) R&S Trigger 5. If the bus signal is displayed as quasi-analog waveform, you can doble-tap the waveform to open the "Parallel buses" dialog box. 6. To switch off the display of the digital channels, disable "Show signals". 14.3 Trigger For digital trigger sources are all trigger types useful that require only one trigger level as trigger condition. - Page 881 ® Mixed Signal Option (MSO, R&S RTE-B1) R&S Trigger 14.3.1.1 Basic Trigger Settings The basic trigger settings for MSO are the trigger source and the trigger type. They are selected in the upper part of the "Trigger" dialog box. Make sure that the trigger sequence is set to "A only". Additionally, you can define trigger holdoff conditions.
- Page 882 ® Mixed Signal Option (MSO, R&S RTE-B1) R&S Trigger Depending on the selected trigger source, different trigger settings are available. The trigger level is already set - in MSO the logical threshold is used as trigger level. Figure 14-1: Edge trigger settings for trigger source = logical combination of digital channels (Logic) Slope Defines the edge - the state transition - of the signal.
- Page 883 ® Mixed Signal Option (MSO, R&S RTE-B1) R&S Trigger Range Selects how the range of a pulse width is defined: "Within" Triggers on pulses inside a given time range. The time limit is defined ± Delta. by Width "Outside" Triggers on pulses shorter or longer than a given time range. The time limit definition is the same as for "Within"...
- Page 884 ® Mixed Signal Option (MSO, R&S RTE-B1) R&S Trigger 14.3.1.4 Timeout The timeout trigger event checks if the trigger source signal stays above or below the threshold voltage for a specified time lapse. In other words, the event occurs if the state condition remains unchanged for the specified time.
- Page 885 ® Mixed Signal Option (MSO, R&S RTE-B1) R&S Trigger 14.3.1.5 Data2Clock The Data2Clock trigger event occurs when the state of the trigger source signal changes inside a given time before the clock edge (setup time) or after the clock edge (hold time).
- Page 886 ® Mixed Signal Option (MSO, R&S RTE-B1) R&S Trigger Hold time Sets the minimum time after the clock edge while data should be stable and not change its state. The hold time can be negative. In this case, the hold time ends before the clock edge, and the setup interval ends when the hold interval starts.
- Page 887 ® Mixed Signal Option (MSO, R&S RTE-B1) R&S Trigger Logical expression Defines a logic combination of several digital channels as trigger condition if "Logic" is set for "Source". The "Qualification Editor" supports the entry of the expression. Remote command: on page 1681 TRIGger<m>:PARallel:TIMeout:EXPRession[:DEFine] on page 1681 TRIGger<m>:PARallel:STATe:EXPRession[:DEFine]...
- Page 888 ® Mixed Signal Option (MSO, R&S RTE-B1) R&S Trigger "Off" No timing condition, only the logical pattern condition is relevant. "Timeout" Defines a minimum time qualification to avoid triggering on unstable or transitional conditions. Even in best-designed systems, there are slight delays between the signal when digital signals change states.
- Page 889 ® Mixed Signal Option (MSO, R&S RTE-B1) R&S Trigger "Longer" Triggers when the pattern comes false after the given "Width" has expired.. Remote command: on page 1686 TRIGger<m>:PARallel:PATTern:WIDTh:RANGe Width ← Width settings For the ranges "Shorter" and "Longer", the width defines the maximum and minimum time limit, respectively.
- Page 890 ® Mixed Signal Option (MSO, R&S RTE-B1) R&S Trigger Remote command: on page 1688 TRIGger<m>:PARallel:SPATtern:CSOurce:EDGE Clock source Selects the digital channel of the clock signal. Remote command: on page 1681 TRIGger<m>:PARallel:DATatoclock:CSOurce[:VALue] on page 1681 TRIGger<m>:PARallel:STATe:CSOurce:VALue on page 1681 TRIGger<m>:PARallel:SPATtern:CSOurce[:VALue] Logical expression Defines a logic combination of several digital channels as trigger condition if "Logic"...
-
Page 891: Measurements On Digital Channels
® Mixed Signal Option (MSO, R&S RTE-B1) R&S Data export 4. Under "Trigger type dependent settings", configure the trigger. 5. For trigger source "Logic", enter the logical expression of the digital channel combi- nation. Tap and hold the "Logical expression" field until the "Qualification Editor" opens. - Page 892 ® Mixed Signal Option (MSO, R&S RTE-B1) R&S Data export The data format of the stored values is defined with "Analysis" > "Parallel Bus Configu- ration" > "Data format". If the data is written to XML or CSV files, the selected format is used.
-
Page 893: Mathematics
® Mixed Signal Option (MSO, R&S RTE-B1) R&S Search 14.6 Mathematics A parallel bus that is displayed as quasi-analog waveform can be analyzed with FFT. To configure the FFT, use the "Advanced" mode and the formula editor. 14.7 Search It is also possible to search on digital channels for specified events. Search conditions use the same parameters as the trigger event definition. -
Page 894: Waveform Generator (Option R&S Rte-B6)
® Waveform Generator (Option R&S RTE-B6) R&S Setup of the Waveform Generator 15 Waveform Generator (Option R&S RTE-B6) The R&S RTE includes an integrated waveform generator which can generate input signals and patterns during testing. You can setup and output two waveform generators and a pattern generator. It is pos- sible to couple and synchronize the settings of the different generators and enable them on a trigger signal. - Page 895 ® Waveform Generator (Option R&S RTE-B6) R&S Setup of the Waveform Generator Make sure that the tab of the correct waveform generator is selected on the left side. The settings of the waveform generators are not affected by an instrument preset. Press "Preset Gen1/2"...
- Page 896 ® Waveform Generator (Option R&S RTE-B6) R&S Setup of the Waveform Generator ● Chapter 15.1.4, "Sweep", on page 898 ● Chapter 15.1.5, "Arbitrary", on page 899 Remote command: on page 1691 WGENerator<m>:SOURce Copy settings from Gen1/Gen2 Copies all settings from Gen1/Gen2 and applies them to Gen2/Gen1. Remote command: on page 1690 WGENerator<m>:ACOPy...
- Page 897 ® Waveform Generator (Option R&S RTE-B6) R&S Setup of the Waveform Generator "Sine" Generates a sine wave. You can set its Frequency and Period. "Square" Generates a square wave. You can set its Frequency, Period Duty cycle. "Ramp" Generates a ramp signal. You can set its Frequency, Period Symmetry.
- Page 898 ® Waveform Generator (Option R&S RTE-B6) R&S Setup of the Waveform Generator "Pulse" Generates a pulse signal. You can set the Frequency, Period Pulse width. "Cardinal sine" Generates a cardinal sine wave. You can set the Frequency Period. "Cardiac" Generates a cardiac signal. You can set the Frequency and Period.
- Page 899 ® Waveform Generator (Option R&S RTE-B6) R&S Setup of the Waveform Generator "Lorentz" Generates a Lorentz signal . You can set the Frequency and Period. "Exp. rise" Generates an exponential rise signal. You can set the Frequency Period. "Exp. fall" Generates an exponential fall signal.
- Page 900 ® Waveform Generator (Option R&S RTE-B6) R&S Setup of the Waveform Generator "Function type" Min frequency Max frequency "Cardiac" 0.001 Hz 1 MHz "Gauss" 0.001 Hz 25 MHz "Lorentz" 0.001 Hz 10 MHz "Exp.rise" 0.001 Hz 10 MHz "Ep. fall" 0.001 Hz 10 MHz The values of the "Frequency"...
- Page 901 ® Waveform Generator (Option R&S RTE-B6) R&S Setup of the Waveform Generator 15.1.3.1 General Settings Consists of settings for selecting the modulation type. Modulation type Selects the modulation type, which defines how the carrier signal is modified. "AM" Amplitude modulation. See: Chapter 15.1.3.2, "AM Modulation",...
- Page 902 ® Waveform Generator (Option R&S RTE-B6) R&S Setup of the Waveform Generator Remote command: on page 1695 WGENerator<m>:MODulation:CARRier:PERiod 15.1.3.2 AM Modulation For amplitude modulation (AM), the amplitude of the carrier signal is varied according to the modulation signal. Modulation signal Selects the type of the modulation signal for the AM modulation types.
- Page 903 ® Waveform Generator (Option R&S RTE-B6) R&S Setup of the Waveform Generator Remote command: on page 1695 WGENerator<m>:MODulation:AM:SYMMetry Duty cycle Sets the duty cycle for a square waveform. The duty cycle expresses for what percent- age fraction of the period, the waveform is active, i.e. the signal state is high. Remote command: on page 1694 WGENerator<m>:MODulation:AM:DCYCle...
- Page 904 ® Waveform Generator (Option R&S RTE-B6) R&S Setup of the Waveform Generator Remote command: on page 1698 WGENerator<m>:MODulation:PWM:DEPTh Symmetry Sets the symmetry for the ramp modulation waveform, the percentage of time that the waveform is rising. Remote command: on page 1699 WGENerator<m>:MODulation:PWM:SYMMetry Duty cycle Sets the duty cycle for a square waveform.
- Page 905 ® Waveform Generator (Option R&S RTE-B6) R&S Setup of the Waveform Generator Remote command: on page 1696 WGENerator<m>:MODulation:FM:FREQuency Symmetry Sets the symmetry for the ramp modulation waveform, the percentage of time that the waveform is rising. Remote command: on page 1696 WGENerator<m>:MODulation:FM:SYMMetry Freq deviation Sets the frequency deviation, the maximum difference between and FM modulated sig-...
- Page 906 ® Waveform Generator (Option R&S RTE-B6) R&S Setup of the Waveform Generator Frequency 1 Sets the frequency of the first signal in FSK modulated signal. Remote command: on page 1697 WGENerator<m>:MODulation:FSK:FONE Frequency 2 Sets the frequency of the second signal in FSK modulated signal. Remote command: on page 1697 WGENerator<m>:MODulation:FSK:FTWO...
- Page 907 ® Waveform Generator (Option R&S RTE-B6) R&S Setup of the Waveform Generator Stop freuqency Sets the stop frequency of the sweep signal. Remote command: on page 1700 WGENerator<m>:SWEep[:FEND] Sweep time Sets the duration of the sweep. Remote command: on page 1700 WGENerator<m>:SWEep:TIME 15.1.5 Arbitrary The arbitrary waveform generator allows you to output a user-defined waveform for...
- Page 908 ® Waveform Generator (Option R&S RTE-B6) R&S Setup of the Waveform Generator A sample rate of 1Mbps is used to calculate the waveform. You can change the "Sample rate" in the user interface. The voltage values are then played with this sample rate.
- Page 909 ® Waveform Generator (Option R&S RTE-B6) R&S Setup of the Waveform Generator 15.1.5.1 General Settings Arb wfm source Selects the arbitrary waveform source. You can load an existing file or load the current oscilloscope waveform. Remote command: on page 1703 WGENerator<m>:ARBGen[:SOURce] Running mode Selects the duration for which the signal of the arbitrary generator will be output after...
- Page 910 ® Waveform Generator (Option R&S RTE-B6) R&S Setup of the Waveform Generator 15.1.5.2 Saved Waveform Load arbitrary waveform Opens a file selection dialog box and loads the selected file. Supported are .bin and .csv extension files. Remote command: on page 1701 WGENerator<m>:ARBGen:NAME on page 1702 WGENerator<m>:ARBGen:OPEN...
- Page 911 ® Waveform Generator (Option R&S RTE-B6) R&S Setup of the Waveform Generator 15.1.5.3 Scope Waveform Signal source Selects the oscilloscope source, from which the arbitrary signal is loaded. Remote command: on page 1703 WGENerator<m>:ARBGen:SELect Load Loads the waveform from the selected "Signal source". Remote command: on page 1700 WGENerator<m>:ARBGen:COPY...
- Page 912 ® Waveform Generator (Option R&S RTE-B6) R&S Setup of the Waveform Generator Remote command: on page 1705 WGENerator<m>:VOLTage:LOW Inversion Inverts the waveform at the offset level. Remote command: on page 1705 WGENerator<m>:VOLTage:INVersion User Load Select the user load, the load of the DUT at its connection. You can select either a "50Ω"...
-
Page 913: Setup Of The Pattern Generator
® Waveform Generator (Option R&S RTE-B6) R&S Setup of the Pattern Generator 15.2 Setup of the Pattern Generator The pattern generator outputs parallel patterns. User Manual 1326.1032.02 ─ 11... - Page 914 ® Waveform Generator (Option R&S RTE-B6) R&S Setup of the Pattern Generator Using pattern generator accessories The pattern generator with connected Patt Gen Cable and Patt Gen Board (1329.7054.02) is considered as a test probe, EN 61326-2-1, clause 5.2.4.101, note 1. Therefore normal operation may display increased emissions above the limits as speci- fied in EN 55011 and/or reduced interference resistance as required in EN 61326-1, table 1, basic requirements.
- Page 915 ® Waveform Generator (Option R&S RTE-B6) R&S Setup of the Pattern Generator The settings of the pattern generator are not affected by an instrument preset. Press "Preset Patt Gen" to preset the settings of the pattern generator. Content and format of the pattern generator files The pattern generator supports .bin or .csv file formats.
- Page 916 ® Waveform Generator (Option R&S RTE-B6) R&S Setup of the Pattern Generator Content and format of the R&S pattern generator *.bin files For the content of the fields, refer to "Content and format of the R&S *.csv files" on page 907. The file stream should contain the following information in the given order: ●...
-
Page 917: Coupling And Sync Settings
® Waveform Generator (Option R&S RTE-B6) R&S Coupling and Sync Settings Remote command: on page 1691 WGENerator<m>:PRESet on page 1708 PGENerator:PRESet 15.3 Coupling and Sync Settings Access: GEN 1/GEN 2 > "Coupling & Sync" tab. In the R&S RTE, you can couple certain settings of the available waveform generators. If one of the available coupling options is enabled for one of the generators, then you cannot change the coupled parameters at the "Setup"... -
Page 918: Configuring The Waveform Generator
® Waveform Generator (Option R&S RTE-B6) R&S Configuring the Waveform Generator "Couple all frequency parameters" All frequency parameters of the generators are coupled: ● For "Operation Mode" > "Function Gen.": "Frequency" and "Period" ● For "Operation Mode" > "Modulation": "Carrier frequency", "Car- rier period", "Modulation freq", "Freq deviation", "Frequency 1", "Frequency 2"... - Page 919 ® Waveform Generator (Option R&S RTE-B6) R&S Configuring the Waveform Generator 15.4.1 Configuring a Function Waveform 1. Press the GEN 1 key on the front panel. 2. Select the "Setup" tab. 3. Under "Operation mode", enable the "Function Gen." button. 4.
- Page 920 ® Waveform Generator (Option R&S RTE-B6) R&S Configuring the Waveform Generator 7. Depending on the selected "Modulation signal", configure the settings of the wave- form like "Modulation freq" and "Modulation depth". 8. If necessary, change the "Output" settings or add "Noise" to the waveform. 9.
- Page 921 ® Waveform Generator (Option R&S RTE-B6) R&S Configuring the Waveform Generator 5. If necessary, change the "Output" settings or add "Noise" to the waveform. 6. Press the "Enable" button, to output the waveform at the output connector of the waveform generator. 15.4.4 Configuring an Arbitrary Waveform Generating an arbitrary waveform from a saved file 1.
-
Page 922: Dc Offset Alignment
® Waveform Generator (Option R&S RTE-B6) R&S DC Offset Alignment 3. Select the "Setup" tab. 4. Select the "Run mode". 5. Press "Open" and set the path to your saved pattern file. 6. Set the "Bit rate" and "High level". 7. -
Page 923: Network And Remote Operation
® Network and Remote Operation R&S Operating System 16 Network and Remote Operation This chapter describes the usage of the embedded operating system on the instru- ment, the setup of network connections, and the interfaces and protocols used for remote control. It also explains how to start a remote control session. Firmware update Your instrument is delivered with the latest firmware version. -
Page 924: Virus Protection
® Network and Remote Operation R&S Operating System Changes in the system setup are only required if the network configuration does not comply with the default settings (see Chapter 16.2.1, "Connecting the Instrument to the Network", on page 918). 16.1.1 Virus Protection Take appropriate steps to protect your instruments from infection. -
Page 925: Setting Up A Network (Lan) Connection
® Network and Remote Operation R&S Setting Up a Network (LAN) Connection To configure the auto-logon for admistrator Starting situation: the auto-logon is configured for a standard user. 1. Press the SETUP key and select the "System" tab. 2. Set "Logon as" to "None". 3. - Page 926 ® Network and Remote Operation R&S Setting Up a Network (LAN) Connection appropriate rights and adapted the Windows firewall configuration, you can use the interface, for example: ● To transfer data between a controlling device and the test device, e.g. to run a remote control program.
- Page 927 ® Network and Remote Operation R&S Setting Up a Network (LAN) Connection ► To establish a non-dedicated network connection, connect a commercial RJ-45 cable to one of the LAN ports. To establish a dedicated connection, connect a (crossover) RJ-45 cable between the instrument and a single PC.
- Page 928 ® Network and Remote Operation R&S Setting Up a Network (LAN) Connection 16.2.3 Using Computer Names In a LAN that uses a DNS server (Domain Name System server), each PC or instru- ment connected in the LAN can be accessed via an unambiguous computer name instead of the IP address.
-
Page 929: Web Interface (Lxi)
® Network and Remote Operation R&S Web Interface (LXI) 16.3 Web Interface (LXI) If the R&S RTE is connected to a computer via LAN, you can operate the instrument from a computer. No additional tools are required, you need only a web browser. The R&S RTE supports the LXI core features. - Page 930 ® Network and Remote Operation R&S Web Interface (LXI) Parameter Value TCP/IP mode DHCP + auto IP address Dynamic DNS Enabled ICMP ping Enabled Password for LAN configuration LxiWebIfc The LAN settings are configured using the instrument's LXI web browser, see . LXI Info Displays the current LXI information from the R&S RTE.
- Page 931 ® Network and Remote Operation R&S Web Interface (LXI) The instrument home page displays the device information required by the LXI stan- dard including the VISA resource string in read-only format. ► To update the "Host Name", press the "Device Indicator" button. The "Device Indi- cator"...
- Page 932 ® Network and Remote Operation R&S Web Interface (LXI) ● "Ping Client" provides the ping utility to verify the connection between the instru- ment and other devices. IP Configuration The "LAN Configuration > IP configuration" web page displays all mandatory LAN parameters and allows their modification.
- Page 933 ® Network and Remote Operation R&S Web Interface (LXI) ● "VXI-11" is the protocol that is used to detect the instrument in the LAN. According to the standard, LXI devices must use VXI-11 to provide a detection mechanism; other additional detection mechanisms are permitted. Ping Client Ping is a utility that verifies the connection between the LXI-compliant instrument and another device.
- Page 934 ® Network and Remote Operation R&S Web Interface (LXI) In the upper left corner of the emulated display, you see two arrows: ● The up/down arrow hides or shows the front panel. ● The left/right arrow hides or shows the menu. 16.3.2.3 Device Screenshot If you click "Device Screenshot", a screenshot of the current instrument display is...
-
Page 935: Remote Desktop Connection
® Network and Remote Operation R&S Remote Desktop Connection Download Saves the screenshot to the download directory of the computer. By default, JPG for- mat is saved. To save the screenshot in PNG format, select "Save as", select "All files" as type, and enter the filename with extension .png. - Page 936 ® Network and Remote Operation R&S Remote Desktop Connection Note: Remote Desktop access and firewall settings. When you enable or disable the Windows Remote Desktop option (in the "System Properties"), the associated firewall settings are adapted automatically. 4. If necessary, click "Select Remote Users" and select users who are to be given access to the R&S RTE via Remote Desktop.
-
Page 937: Remote Control Interfaces And Protocols
® Network and Remote Operation R&S Remote Control Interfaces and Protocols – To use printers connected to the remote PC while accessing them from the instrument, activate the "Printers" options. Do not change the remaining settings. ● On the "Display" tab: –... - Page 938 ® Network and Remote Operation R&S Remote Control Interfaces and Protocols SCPI (Standard Commands for Programmable Instruments) SCPI commands - messages - are used for remote control. Commands that are not taken from the SCPI standard follow the SCPI syntax rules. The instrument supports the SCPI version 1999.
- Page 939 ® Network and Remote Operation R&S Remote Control Interfaces and Protocols ● hislip0 indicates the HiSLIP protocol ● inst0 is the default LAN device name. VISA supports several devices running on the instrument. On R&S RTE, only one device is configured, so the LAN device name can be omitted.
-
Page 940: Remote Settings
® Network and Remote Operation R&S Remote Settings ● Supports simultaneous access of multiple users by providing versatile locking mechanisms ● Usable for IPv6 or IPv4 networks Using VXI-11, each operation is blocked until a VXI-11 device handshake returns. However, using HiSLIP, data is sent to the device using the "fire and forget" method with immediate return. - Page 941 ® Network and Remote Operation R&S Remote Settings Address Indicates the GPIB address of the instrument if an optional GPIB bus card is installed. The address can be edited here. Be aware that changing the address has major effects on the communication to the remote computer. See also: Chapter 16.5.3, "GPIB Interface (IEC/IEEE Bus Interface)",...
-
Page 942: Starting And Stopping Remote Control
® Network and Remote Operation R&S Starting and Stopping Remote Control "INT8" Signed integer data with length 8 bit. "INT16" Signed integer data with length 16 bit. The Byte order can be set using . For details on the formats, refer to the description of the remote com- mand. - Page 943 ® Network and Remote Operation R&S Starting and Stopping Remote Control 16.7.2 Using the display during remote control You can observe the screen while a remote control script is executed. This is helpful for program test purposes but tends to slow down the measurement. Therefore it is recommended that you switch off the display in real measurement applications where a tested program script is to be executed repeatedly.
-
Page 944: Remote Control Commands
® Remote Control Commands R&S Conventions used in Remote Command Description 17 Remote Control Commands This chapter describes all remote commands available for R&S RTE and provides examples and information how to use the commands. Further information on remote control: ●... -
Page 945: Finding The Appropriate Command
® Remote Control Commands R&S Finding the Appropriate Command If not specified otherwise, a parameter can be used to set a value and it is the result of a query. Parameters required only for setting are indicated as Setting parameters. Parameters required only to refine a query are indicated as Query parameters. -
Page 946: Programming Examples
® Remote Control Commands R&S Programming Examples 17.3 Programming Examples 17.3.1 Display........................938 17.3.1.1 Creating Zoom Diagrams.................... 938 17.3.2 Automatic Measurements................... 939 17.3.2.1 Performing Amplitude/Time Measurements..............939 17.3.2.2 Setting Reference Levels.................... 939 17.3.2.3 Waveform Histograms....................940 17.3.2.4 Long Term Measurements..................941 17.3.3 Mask Testing.......................942 17.3.3.1 Creating a user mask.................... - Page 947 ® Remote Control Commands R&S Programming Examples // Set horizontal zoom mode to relative LAYout:ZOOM:HORZ:REL:SPAN 'Diagram1', 'MyZoom1', 10 // Set horizontal zoom span in percent LAYout:ZOOM:HORZ:REL:POS 'Diagram1', 'MyZoom1', 15 // Set horizontal zoom position in percent LAYout:ZOOM:REM 'Diagram1', 'MyZoom1' // Remove zoom diagram 17.3.2 Automatic Measurements 17.3.2.1 Performing Amplitude/Time Measurements...
- Page 948 ® Remote Control Commands R&S Programming Examples REFLevel2:LDETection MANual REFLevel2:LMODe ABS REFLevel2:ABSolute:HIGH 0.12 REFLevel2:ABSolute:TDIStance 0.03 REFLevel2:ABSolute:Low -0.12 REFLevel2:ABSolute:BDIStance 0.04 REFLevel2:ABSolute:MLEVel? <-- 0 17.3.2.3 Waveform Histograms Creating and Reading Histograms The example creates a histogram, activates two measurements (mean and standard deviation measurements of Histogram1), and queries the results of both measure- ments.
- Page 949 ® Remote Control Commands R&S Programming Examples Transferring Histogram Data The example transfers the absolute values of Histogram1 to a controlling computer in ASCII format. Command description in Chapter 17.16.5, "Waveform Histogram Export to File", on page 1240. EXP:HIST:SEL 'Histogram1' EXP:HIST:INC ABS FRM ASC EXP:HIST:DATA?
- Page 950 ® Remote Control Commands R&S Programming Examples 17.3.3 Mask Testing 17.3.3.1 Creating a user mask Creates a new user mask "MyMask" with one inner segment, and turns the mask test Command description in: Chapter 17.14, "Mask Testing", on page 1173. MTEST:ADD 'MyMask' MTEST:SEGM:ADD 'MyMask' MTEST:SEGM:POIN:ADD 'MyMask', 0...
- Page 951 ® Remote Control Commands R&S Programming Examples 17.3.5 Data Management ● Saving a Screenshot to File.................. 943 ● Exporting Waveform Data to File................943 ● Exporting Measurement Results to File..............947 17.3.5.1 Saving a Screenshot to File Saves three display images in png format to the files Print.png, Print_001.png, and Print_002.png in the directory C:\Temp.
- Page 952 ® Remote Control Commands R&S Programming Examples EXPort:WAVeform:SOURce C1W1 EXPort:WAVeform:SCOPe WFM EXPort:WAVeform:NAME 'C:\Data\DataExportWfm_analog.xml' EXPort:WAVeform:RAW OFF EXPort:WAVeform:INCXvalues OFF EXPort:WAVeform:DLOGging OFF MMEM:DEL 'C:\Data\DataExportWfm_analog.*' EXPort:WAVeform:SAVE MMEM:DATA? 'C:\Data\DataExportWfm_analog.xml' MMEM:DATA? 'C:\Data\DataExportWfm_analog.wfm.xml' Exporting Raw Data of a Single Waveform to BIN File Saves the data of a single analog waveform in integer 8 bit format (raw data) to a BIN file.
- Page 953 ® Remote Control Commands R&S Programming Examples RUNSingle;*OPC? \\Asynchronous command EXPort:WAVeform:NAME 'C:\Data\DataExportWfm_analog.bin' EXPort:WAVeform:RAW ON EXPort:WAVeform:INCXvalues OFF EXPort:WAVeform:DLOGging OFF MMEM:DEL 'C:\Data\DataExportWfm_analog.*' EXPort:WAVeform:SAVE MMEM:DATA? 'C:\Data\DataExportWfm_analog.bin' MMEM:DATA? 'C:\Data\DataExportWfm_analog.wfm.bin' Exporting Interleaved x/y Data of a Single Waveform to CSV File Saves the x- and y- values of a single analog waveform to a CSV file. Data logging is off.
- Page 954 ® Remote Control Commands R&S Programming Examples Exporting Multiple Running Acquisitions of a Single Waveform to XML File Saves the data of 5 subsequent acquisitions of a single analog waveform to an XML file. Data logging is on. STOP;*OPC? EXPort:WAVeform:FASTexport ON CHANnel1:WAVeform1:STATe 1 EXPort:WAVeform:SOURce C1W1 EXPort:WAVeform:SCOPe WFM...
- Page 955 ® Remote Control Commands R&S Programming Examples EXPort:WAVeform:RAW OFF EXPort:WAVeform:INCXvalues OFF EXPort:WAVeform:DLOGging ON MMEM:DEL 'C:\Data\DataExportWfm_analog.*' ACQuire:COUNt 5 \\Acquire 5 waveforms RUNSingle;*OPC? \\Asynchronous command CHANnel1:WAV1:HISTory:STATe ON CHANnel1:WAV1:HISTory:STARt -4 CHANnel1:WAV1:HISTory:STOP 0 CHANnel1:WAV1:HISTory:REPLay OFF CHANnel1:WAV1:HISTory:PLAY;*OPC? \\Asynchronous command MMEM:DATA? 'C:\Data\DataExportWfm_analog.xml' MMEM:DATA? 'C:\Data\DataExportWfm_analog.wfm.xml' 17.3.5.3 Exporting Measurement Results to File See: ●...
- Page 956 ® Remote Control Commands R&S Programming Examples BUS:NEWList 'C:\Protocols\SENT_Labels.xml' BUS:SYMBols ON RUNSingle;*OPC? //asynchronous command //**************************************************** // Display all results BUS:SENT:RDSL ALL //**************************************************** // Display the fast channel transmission sequence BUS:SENT:RDSL TRSQ //**************************************************** // Display the short serial message of slow channel BUS:SENT:RDSL SMSG Triggering on SENT Bus //Set trigger source to serial bus...
- Page 957 ® Remote Control Commands R&S Programming Examples SEARch:TRIGger:SENT:SHORt 'Search1', ON SEARch:RESult:SENT:FCOunt? 'Search1' SEARch:RESult:SENT:FRAMe1:STAT? 'Search1' SEARch:RESult:SENT:FRAMe1:IDValue? 'Search1' SEARch:RESult:SENT:FRAMe1:NIBB1:VALue? 'Search1' SEARch:RESult:SENT:FRAMe1:NIBB2:VALue? 'Search1' SEARch:RESult:SENT:FRAMe1:CSValue? 'Search1' SEARch:TRIGger:SENT:SHORt 'Search1', OFF //**************************************************** // Search Enhanced serial message SEARch:TRIGger:SENT:ENHanced 'Search1', ON SEARch:RESult:SENT:FCOunt? 'Search1' SEARch:RESult:SENT:FRAMe1:STAT? 'Search1' SEARch:RESult:SENT:FRAMe1:IDValue? 'Search1' SEARch:RESult:SENT:FRAMe1:NIBB1:VALue? 'Search1' SEARch:RESult:SENT:FRAMe1:NIBB2:VALue? 'Search1' SEARch:RESult:SENT:FRAMe1:CSValue? 'Search1'...
- Page 958 ® Remote Control Commands R&S Programming Examples //Select current and voltage sources :POWer:SOURce:VOLTage1 CHANnel1 :POWer:SOURce:CURRent1 CHANnel2 //Configure voltage probe on CH1 manually //Not necessary if you use an active R&S voltage probe that is recognized by the instrument :PROBe1:SETup:ATTenuation:MODE Manual :PROBe:SETup:ATTenuation:DEFProbe ZD01a100 //selected high voltage differential probe 1:100 //Configure current probe on CH2 manually...
-
Page 959: Frequently Used Parameters And Suffixes
® Remote Control Commands R&S Frequently Used Parameters and Suffixes Make sure to configure and deskew the probes before the measurement, see Chap- ter 17.3.7.1, "Auto Deskew", on page 949. //Activate power *RST; *OPC? :POWer:ENABle //Expected smps frequency :POW:TRANsient:FREQ 12500000 :POWer:TRANsient:AUToscale AUTO :POWer:TRANsient:SIGHigh 0.1 :POWer:TRANsient:SIGLow... - Page 960 ® Remote Control Commands R&S Frequently Used Parameters and Suffixes 17.4.1 Waveform Suffix The numeric waveform suffix is used in some commands, for example, to indicate the source waveform number from which the reference level is taken, and to assign color tables to waveforms.
- Page 961 ® Remote Control Commands R&S Frequently Used Parameters and Suffixes Waveform number Description 56...59 Digital buses: MSO1, MSO2, MSO3, MSO4 (option R&S RTE-B1) not used 61...68 Track waveforms: TRK1, TRK2, TRK3, TRK4, TRK5, TRK6, TRK7, TRK8 Available for audio signals and jitter analysis (options R&S RTE-K5/K12) 69...71 not used 72...75...
- Page 962 ® Remote Control Commands R&S Frequently Used Parameters and Suffixes Waveform Description XY1 | XY2 | XY3 | XY4 XY-waveforms MRESult1 | MRESult2 | MRESult3 | MRESult4 | Measurement results MRESult5 | MRESult6 | MRESult7 | MRESult8 SBUS1 | SBUS2 | SBUS3 | SBUS4 Serial buses D0 | D1 | D2 | D3 | D4 | D5 | D6 | D7 | D8 | D9 | D10 Digital channels (option R&S RTE-B1)
- Page 963 ® Remote Control Commands R&S Frequently Used Parameters and Suffixes 17.4.5 Event Parameter The event parameter is used with commands defining an action for mask testing, limit checks and margin checks. Event Description NOACtion The action is not initiated. SUCCess The action is initiated if the operation finished successfully: ●...
-
Page 964: Common Commands
® Remote Control Commands R&S Common Commands you enter the complete bit pattern. If you enter a shorter pattern, the instrument fills up the pattern with X bits to the right of the defined pattern. Example: You want to trigger on an 11 bit CAN address and enter the bit pattern '11100011' (8 bits only). - Page 965 ® Remote Control Commands R&S Common Commands Return values: <State> 0: no error 1: alignment failed 2: not aligned, e.g. init 3: device needs longer warmup time before selfalignment can start 4: input signal connected during selfalignment Usage: Query only *CLS Clear status Sets the status byte (STB), the standard event register (ESR) and the EVENt part of...
- Page 966 ® Remote Control Commands R&S Common Commands Usage: Query only *IST? Individual status query Returns the contents of the IST flag in decimal form. The IST flag is the status bit which is sent during a parallel poll. Return values: <ISTflag>...
- Page 967 ® Remote Control Commands R&S Common Commands Sets parallel poll enable register to the indicated value. The query returns the contents of the parallel poll enable register in decimal form. Parameters: <Value> Range: 0 to 255 *PSC <Action> Power on status clear Determines whether the contents of the ENABle registers are preserved or reset when the instrument is switched on.
- Page 968 ® Remote Control Commands R&S Common Commands *SRE <Contents> Service request enable Sets the service request enable register to the indicated value. This command deter- mines under which conditions a service request is triggered. Parameters: <Contents> Contents of the service request enable register in decimal form. Bit 6 (MSS mask bit) is always 0.
-
Page 969: General Remote Settings
® Remote Control Commands R&S General Remote Settings Prevents servicing of the subsequent commands until all preceding commands have been executed and all signals have settled (see also command synchronization and *OPC). Usage: Event 17.6 General Remote Settings This chapter describes commands that have effect on many other remote commands in different applications of the instrument. - Page 970 ® Remote Control Commands R&S General Remote Settings Parameters: <Format>,[<Length>] ASCii | REAL,32 | INT,8 | INT,16 ASCii Data values are returned in ASCII format as a list of comma sep- arated values in floating point format. The length can be omitted. It is 0 which means that the instrument selects the number of digits to be returned.
- Page 971 ® Remote Control Commands R&S General Remote Settings Parameters: <ByteOrder> LSBFirst | MSBFirst LSB first: little endian, least significant byte first MSB first: big endian, most significant byte first *RST: LSBFirst FORMat:BPATtern <BitPatternFormat> Sets the number format for all remote bit pattern queries. Parameters: <BitPatternFormat>...
-
Page 972: Instrument Setup
® Remote Control Commands R&S Instrument Setup Parameters: <Address> Range: 0 to 30 Increment: 1 *RST: GPIB:TERMinator <Terminator> Specifies the symbol that is used as a terminator in GPIB communication. Parameters: <Terminator> LFEoi | EOI *RST: SYSTem:DISPlay:MESSage:STATe <DispMessSt> Enables and disables the display of an additonal text in remote control. To define the text, use SYSTem:DISPlay:MESSage[:TEXT]. - Page 973 ® Remote Control Commands R&S Instrument Setup 17.7.1 System Setup SYSTem:EXIT Starts the shutdown of the firmware. Usage: Event SYSTem:PRESet Resets the instrument to the factory default settings, to the initial state. Factory settings comprise all instrument settings, including display, intensity and transparency settings. After loading factory defaults, perform a self-aligment to synchronize the signal data.
- Page 974 ® Remote Control Commands R&S Instrument Setup SYSTem:DEVice:ID? Returns the instrument ID - that is the material number and the serial number Return values: <ID> String containing the material number and the serial number Example: 1316.1000K24-001122-jT Usage: Query only DIAGnostic:SERVice:FWVersion? Returns the firmware version that is currently installed on the instrument.
- Page 975 ® Remote Control Commands R&S Instrument Setup Return values: <ChannelCount> Range: 0 to 4 Increment: 1 *RST: Usage: Query only Firmware/Software: V 2.00 SYSTem:VERSion? Queries the SCPI version number to which the instrument complies. The instrument complies to the final SCPI version 1999.0. Usage: Query only SCPI confirmed...
- Page 976 ® Remote Control Commands R&S Instrument Setup SYSTem:ERRor[:NEXT]? Queries the error/event queue for the oldest item and removes it from the queue. The response consists of an error number and a short description of the error. Positive error numbers are instrument-dependent. Negative error numbers are reserved by the SCPI standard.
- Page 977 ® Remote Control Commands R&S Instrument Setup 17.7.2 Display Settings ● Signal Colors / Persistence................... 969 ● Color Tables......................971 ● Diagram Layout.....................973 ● Waveform Labels....................979 17.7.2.1 Signal Colors / Persistence ..................969 DISPlay:PERSistence[:STATe] ..................969 DISPlay:PERSistence:INFinite .................... 969 DISPlay:PERSistence:TIME ..................970 DISPlay:PERSistence:RESet ......................
- Page 978 ® Remote Control Commands R&S Instrument Setup DISPlay:PERSistence:RESet Resets the display, removing persistent values. Usage: Event DISPlay:INTensity <Intensity> This value determines the strength of the waveform line in the diagram. Enter a per- centage between 0 (not visible) and 100% (very strong). The exact mapping of the cumulative value occurences according to the assigned color table is guaranteed only if the intensity is set to 50% (default).
- Page 979 ® Remote Control Commands R&S Instrument Setup Parameters: <Color> Decimal value of the ARGB color. Use the color dialog box on the instrument to get the hex value of the color, and convert the hex value to a decimal value. 0 is fully transparent black.
- Page 980 ® Remote Control Commands R&S Instrument Setup DISPlay:COLor:PALette:ADD <Name> Adds a new color table with the specified name. Setting parameters: <Name> color table Usage: Setting only DISPlay:COLor:PALette:REMove <Name> Removes the specified color table. Setting parameters: <Name> color table Usage: Setting only DISPlay:COLor:PALette:COUNt? Queries the number of configured color maps.
- Page 981 ® Remote Control Commands R&S Instrument Setup DISPlay:COLor:PALette:POINt[:VALue] <ColorTableName>, <Index>,<Position>, <Color> DISPlay:COLor:PALette:POINt[:VALue]? <ColorTableName>, <Index> Inserts a new entry or queries the specified entry in the specified color table. Parameters: <Position> Cumulative occurance value Range: 0 to 100 Increment: 1 *RST: Default unit: % <Color>...
- Page 982 ® Remote Control Commands R&S Instrument Setup ....................977 LAYout:SIGNal:ASSign ....................977 LAYout:SIGNal:UNASsign ....................978 DISPlay:SIGBar:POSition ..................978 DISPlay:SIGBar:HIDE[:AUTO] ....................978 DISPlay:SIGBar:HIDE:TIME ..................978 DISPlay:SIGBar:HIDE:HEAD ................978 DISPlay:SIGBar:HIDE:TRANsparency ..................979 DISPlay:SIGBar:COLor:BORDer ................... 979 DISPlay:SIGBar:COLor:FILL DISPlay:DIAGram:GRID <Show> If enabled, a grid is displayed in the diagram area. Parameters: <Show>...
- Page 983 ® Remote Control Commands R&S Instrument Setup DISPlay:DIAGram:YFIXed <YGridFixed> If enabled, the horizontal grid lines remain in their position when the position of the curve is changed. Only the values at the grid lines are adapted. This reflects the behavior of traditional oscilloscopes. Parameters: <YGridFixed>...
- Page 984 ® Remote Control Commands R&S Instrument Setup <ParentType> HORizontal | VERTical | TAB Position of the new diagram in relation to the existing one. HORizontal Besides the existing diagram VERTical Above or below the existing diagram In a new tab in the existing diagram <InsertBefore>...
- Page 985 ® Remote Control Commands R&S Instrument Setup LAYout:SHOW <DiagramName> Selects the specified diagram. Setting parameters: <DiagramName> String with the name of the diagram Usage: Setting only LAYout:SIGNal:ASSign <DiagramName>, <Source> Shows the specified waveform in the selected diagram. Setting parameters: <DiagramName> String with the diagram name <Source>...
- Page 986 ® Remote Control Commands R&S Instrument Setup DISPlay:SIGBar:POSition <Position> The signal bar can be placed vertically at the right (default position) or at the left, or horizontally at the top, bottom or center of the diagram to ensure best visibility of the waveforms.
- Page 987 ® Remote Control Commands R&S Instrument Setup DISPlay:SIGBar:COLor:BORDer <BorderColor> Defines the color of the signal bar border. See also: "To change the colors" on page 77. Parameters: <BorderColor> ARGB color value Range: 0 to 4294967295 Increment: 1 DISPlay:SIGBar:COLor:FILL <FillColor> Define the fill color of the signal bar. See also: "To change the colors"...
- Page 988 ® Remote Control Commands R&S Instrument Setup <Source> C1W1 | C2W1 | C3W1 | C4W1 | M1 | M2 | M3 | M4 | R1 | R2 | R3 | R4 | XY1 | XY2 | XY3 | XY4 | MRESult1 | MRESult2 | MRESult3 | MRESult4 | MRESult5 | MRESult6 | MRESult7 | MRESult8 | QUICk | QUICK | SBUS1 | SBUS2 | SBUS3 | SBUS4 | D0 | D1 | D2 | D3 | D4 | D5 | D6 | D7 | D8 | D9 | D10 |...
- Page 989 ® Remote Control Commands R&S Instrument Setup <Source> All waveforms that can be displayed, see DISPlay:SIGNal: LABel:ADD Example: DISPlay:SIGNal:LABel:REMove 'Label1', C1W1 Usage: Setting only DISPlay:SIGNal:LABel:TEXT <LabelID>, <Source>, <LabelText> DISPlay:SIGNal:LABel:TEXT? <LabelID>, <Source> Modifies or queries the text of the specified label. Parameters: <LabelText>...
- Page 990 ® Remote Control Commands R&S Instrument Setup DISPlay:SIGNal:LABel:HORizontal:ABSolute:POSition <LabelID>, <Source>, <Position> DISPlay:SIGNal:LABel:HORizontal:ABSolute:POSition? <LabelID>, <Source> DISPlay:SIGNal:LABel:VERTical:ABSolute:POSition <LabelID>, <Source>, <Position> DISPlay:SIGNal:LABel:VERTical:ABSolute:POSition? <LabelID>, <Source> Modifies or queries the absolute horizontal and vertical positiions of the specified label is set to ABS. DISPlay:SIGNal:LABel:POSMode Parameters: <Position>...
-
Page 991: Acquisition And Setup
® Remote Control Commands R&S Acquisition and Setup Example: DISPlay:SIGNal:LABel:HORizontal:RELative: POSition 'Label1', C1W1, 30 DISPlay:SIGNal:LABel:VERTical:RELative:POSition 'Label1', C1W1, 70 Move the label to new relative position: horizontal at 30 % and vertical at 70 % of the screen. 17.8 Acquisition and Setup ●... - Page 992 ® Remote Control Commands R&S Acquisition and Setup STOP Stops the running acquistion. Usage: Event Asynchronous command 17.8.2 Time Base ......................984 TIMebase:SCALe ......................984 TIMebase:RANGe ..................... 985 TIMebase:DIVisions? ..................985 TIMebase:HORizontal:POSition .....................985 TIMebase:REFerence ..................985 TRIGger<m>:OFFSet:LIMited ........................986 AUToscale ....................986 ACQuire:POINts:AUTO ....................986 ACQuire:POINts:AADJust .....................987 ACQuire:POINts:MAXimum...
- Page 993 ® Remote Control Commands R&S Acquisition and Setup Parameters: <AcquisitionTime> Range: 250E-12 to 100E+3 (RTO) | 50E+3 (RTE) Increment: 1E-12 *RST: Default unit: s TIMebase:DIVisions? Queries the number of horizontal divisions on the screen. The number cannot be changed. Return values: <HorizDivCnt>...
- Page 994 ® Remote Control Commands R&S Acquisition and Setup Suffix: <m> 1..3 The numeric suffix is irrelevant. Parameters: <State> ON | OFF *RST: AUToscale Performs an autoset process: analyzes the enabled channel signals, and obtains appropriate horizontal, vertical, and trigger settings to display stable waveforms. Usage: Event Asynchronous command...
- Page 995 ® Remote Control Commands R&S Acquisition and Setup ACQuire:POINts:MAXimum <ReclgthLim> Sets a limit for the record length to prevent very large records. This value only takes effect if a constant resolution is selected with ACQuire:POINts:AUTO. If you increase the time scale, the resolution remains constant and the record length increases until the limit is reached.
- Page 996 ® Remote Control Commands R&S Acquisition and Setup Parameters: <RealSampleRate> Range: 2 to 20E+12 Increment: 1 *RST: 20E+3 Default unit: Sa/s Firmware/Software: FW 3.40 ACQuire:RESolution <Resolution> Indicates the time between two waveform points in the record. Parameters: <Resolution> A fine resolution with low values produces a more precise wave- form record.
- Page 997 ® Remote Control Commands R&S Acquisition and Setup Return values: <State> ON | OFF *RST: Usage: Query only TIMebase:ROLL:MTIMe <MinHorizGn> The roll mode is enabled automatically if the acquisition time exceeds the given value, and if is set to AUTO. TIMebase:ROLL:ENABle Parameters: <MinHorizGn>...
- Page 998 ® Remote Control Commands R&S Acquisition and Setup See also: "Interpolation" on page 142. Parameters: <IntpolMd> LINear | SINX | SMHD LINear Linear interpolation between two adjacent sample points SINX Interpolation by means of a sin(x)/x curve. SMHD Sample/Hold causes a histogram-like interpolation. *RST: SINX CHANnel<m>[:WAVeform<n>][:STATe] <State>...
- Page 999 ® Remote Control Commands R&S Acquisition and Setup Parameters: <DecimationMode> SAMPle | PDETect | HRESolution | RMS SAMPle One of n samples in a sample interval of the ADC is recorded as waveform point. PDETect Peak Detect: the minimum and the maximum of n samples in a sample interval are recorded as waveform points.
- Page 1000 ® Remote Control Commands R&S Acquisition and Setup Parameters: <MaxAcqCnt> Range: 1 to 16777215 Increment: 10 *RST: ACQuire:ARESet:IMMediate Forces the immediate restart of the envelope and average calculation for all wave- forms. Usage: Event Firmware/Software: V 1.36 17.8.4 Ultra Segmentation ..................
Need help?
Do you have a question about the RTE1022 and is the answer not in the manual?
Questions and answers