
Related Manuals for Implen NanoPhotometer


Summary of Contents for Implen NanoPhotometer
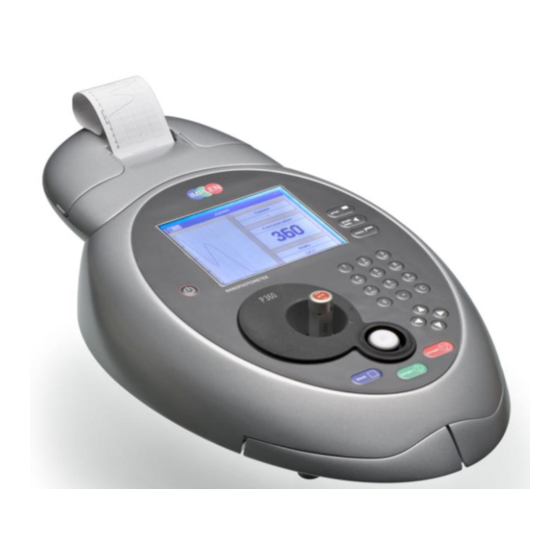
- Page 1 NanoPhotometer P-Class ® User Manual P 300 / P 330 / P 360 Version 2.1 P 360 P 330 P 300 telephone: + 49-89-726 3718 0 Fax. + 49-89-726 3718 54 Email: info@implen.de www.implen.de...
- Page 2 Implen GmbH Schatzbogen 52 D-81829 Germany Declaration of conformity for the NanoPhotometer P-Class (P300/P330/P360) ® This is to certify that the Implen NanoPhotometer P-Class conforms to the requirements of the following Directives: ® 2014/35/EU Low Voltage directive (LVD)
-
Page 3: Table Of Contents
Unpacking, Positioning and Installation ..................... 5 INTRODUCTION .................................. 6 Your spectrophotometer ........................6 Sample handling tips .......................... 6 ® Keypad and display for NanoPhotometer P 300 ................7 ® Keypad and display for NanoPhotometer P 330 /P 360 ..............8 Menu/Options ............................ - Page 4 NanoPhotometer P-Class User Manual ® Trouble shooting ..........................64 ACCESSORIES .................................. 64 SPECIFICATION AND WARRANTY ..........................65 SOLVENT COMPATIBILITY ............................... 66 APPENDIX ..................................67 12.1 Nucleic acid quantification ....................... 67 12.2 Nucleic acid fluorescent dye incorporation ..................67 12.3 Protein quantification ........................69 12.4 Protein fluorescent dye incorporation ....................
-
Page 5: Essential Safety Notes
NanoPhotometer P-Class User Manual ® 1. ESSENTIAL SAFETY NOTES There are a number of warning labels and symbols on your instrument. These are there to inform you where potential danger exists or particular caution is required. Before commencing installation, please take time to familiarise yourself with these symbols and their meaning. -
Page 6: Introduction
USB flash drive. The software enables the user to “print through” the PC directly to the printer that is connected to it. Data may be stored as Excel spreadsheet (report and/or table format), EMF graphics file, a comma delimited (csv) data file, a tab delimited (txt) data file or in native NanoPhotometer P-Class Software format ®... -
Page 7: Keypad And Display For Nanophotometer
View options for that application mode. Some of these are common to all View Options applications and described on page 8. Menu unique to an application are described in the relevant section of the NanoPhotometer P-Class User Manual. ® Use these to enter parameters and to write text descriptions where appropriate, or required. -
Page 8: Keypad And Display For Nanophotometer
View menu for that application mode. Some of these are common to all View Menu applications and described on page 8. Menu unique to an application are described in the relevant section of the NanoPhotometer P-Class User Manual. ® Use these to enter parameters and to write text descriptions where appropriate, or required. -
Page 9: Menu/Options
NanoPhotometer P-Class User Manual ® Menu/Options (select using key pad numbers) Options for P 300: After each measurement the following Options are possible: 1) Return to parameter screen. 2) Print the results via selected method. 3) Toggle graph on/off. Graph shows a wavescan plot across the... -
Page 10: The Nanophotometer P-Class Submicroliter Cell
P-Class Submicroliter Cell into the cell ® holder with the cell windows facing the light beam. We recommend facing the Implen logo to the front. The light beam is directed from RIGHT to LEFT as indicated with small arrows. Insert the NanoPhotometer P-Class Submicroliter Cell always in the same ®... -
Page 11: Software Instructions
The NanoVolume Applications and Cuvette Applications are very similar concerning the analysis of dsDNA, ssDNA, RNA, Oligonucleotides, protein UV and protein dye analysis. This section describes the specific features which have to be considered using the NanoPhotometer P-Class Submicroliter Cell. For general information please follow the detailed ®... - Page 12 NanoPhotometer P-Class User Manual ® Important Information: If the absorbance value of the sample is not in the linear range the following “Warning messages” will appear and “Instruction” will be displayed in the top left corner of the result screen.
-
Page 13: Nanovolume Applications And Cuvette Applications
P-Class User Manual ® 4. NANOVOLUME APPLICATIONS AND CUVETTE APPLICATIONS The NanoPhotometer P-Class offers a complete solution for NanoVolume and standard volume applications. With the ® NanoPhotometer P-Class Submicroliter Cell the required sample volume ranges from 0.3 µl to a maximal sample ®... - Page 14 NanoPhotometer P-Class User Manual ® different ratios due to variations in wavelength accuracy. But each instrument will give consistent results within itself. Concentration also affects 260/280 readings. If a solution is too dilute, the readings will be at the instrument’s detection limit, and results may vary as there is less distinction of the 260 peak and the 280 slope from the background absorbance.
-
Page 15: Analysis Of Dsdna, Ssdna And Rna
NanoPhotometer P-Class User Manual ® 4.1.2 Analysis of dsDNA, ssDNA and RNA The procedure is as follows: Parameter Screen Parameter Screen NanoVolume Applications Step 1 Press 1 for NanoVolume OR 2 for Cuvette folder Step 2 Press 1 to select Nucleic Acids folder... -
Page 16: Analysis Of Oligonucleotides
NanoPhotometer P-Class User Manual ® 4.1.3 Analysis of Oligonucleotides The procedure is as follows: Parameter Screen Parameter Screen NanoVolume Applications Step 1 Press 1 for NanoVolume OR 2 for Cuvette folder. Step 2 Press 1 to select Nucleic Acids folder. -
Page 17: Dye Incorporation For Dsdna, Ssdna, Rna And Oligonucleotides
NanoPhotometer P-Class User Manual ® 4.1.4 Dye incorporation for dsDNA, ssDNA, RNA and Oligonucleotides The dye incorporation methods are similar to the dsDNA, ssDNA, RNA and Oligonucleotide methods. This section describes the specific features concerning the dye incorporation. For general information please follow the detailed instructions under Analysis of dsDNA, ssDNA and RNA and Oligonucleotides. - Page 18 NanoPhotometer P-Class User Manual ® Results Screen Results Screen Step 9 Apply/insert the reference sample. Press Blank Key. This will be used for all subsequent samples until changed. Step 10 Apply/insert sample and press Sample . This measures at the selected wavelengths and displays the results. The...
-
Page 19: Protein Determination
= (Abs. 280 – Abs. 320) * A280 factor * lid factor * dilution factor prot. This equation can be applied to other proteins if the corresponding factors are known (please note that the factor used by the NanoPhotometer P-Class is the reciprocal value of the extinction coefficient (l/g*cm) from a protein). ®... -
Page 20: Protein Uv Method
NanoPhotometer P-Class User Manual ® 4.2.2 Protein UV Method The procedure is as follows: Parameter Screen Parameter Screen NanoVolume Applications Step 1 Press 1 for NanoVolume OR 2 for Cuvette folder. Step 2 Press 2 to select Protein folder. Step 3 Press 1 to select Protein UV mode. - Page 21 NanoPhotometer P-Class User Manual ® Results Screen Results Screen Step 10 Apply/insert the reference sample. Press Blank Key. This will be used for all subsequent samples until changed. Step 11 Apply/insert sample and press Sample . This measures at both 260 and 280 nm wavelengths and displays the result.
-
Page 22: Protein Uv Dye Method
NanoPhotometer P-Class User Manual ® 4.2.3 Protein UV Dye Method The procedure is as follows: Parameter Screen Parameter Screen NanoVolume Applications Step 1 Press 1 for NanoVolume OR 2 for Cuvette folder. Step 2 Press 2 to select Protein folder. - Page 23 NanoPhotometer P-Class User Manual ® Results Screen Results Screen Step 14 Apply/insert the reference sample. Press Blank Key. This will be used for all subsequent samples until changed. Step 15 Apply/insert sample and press Sample . This measures at 260nm, 280nm, 320nm and the dye specific wavelength and displays the result.
-
Page 24: Bca Assay
NanoPhotometer P-Class User Manual ® 7.3.4 BCA Assay The colorimetric BCA assay is not recommended with the Submicroliter Cell. Please use Cuvette Applications. The procedure is as follows: Parameter Screen Parameter Screen Step 1 Press 2 to select Cuvette folder. - Page 25 NanoPhotometer P-Class User Manual ® Calibration Screen (replicates off) Calibration Screen (replicates off) Step 13 This shows the calibration values and allows standards to be measured. Insert the reference sample. Press Blank key. This will be used for all subsequent samples until changed.
- Page 26 NanoPhotometer P-Class User Manual ® Calibration Screen (manual entry) Calibration Screen (manual entry) Shows previously entered calibration values and allows values to be entered via the keypad. Step 22 The highlighted box can be edited in order to enter an absorbance value corresponding to a given concentration value using the keypad numbers.
-
Page 27: Bradford Assay
NanoPhotometer P-Class User Manual ® 7.3.5 Bradford Assay The colorimetric Bradford assay is not recommended with the Submicroliter Cell. Please use Cuvette Applications. The procedure is as follows: Parameter Screen Parameter Screen Step 1 Press 2 to select Cuvette folder. - Page 28 NanoPhotometer P-Class User Manual ® Calibration Screen (replicates off) Calibration Screen (replicates off) Step 13 This shows the calibration values and allows standards to be measured. Insert the reference sample. Press Blank key. This will be used for all subsequent samples until changed.
- Page 29 NanoPhotometer P-Class User Manual ® Calibration Screen (manual entry) Calibration Screen (manual entry) Shows previously entered calibration values and allows values to be entered via the keypad. Step 22 The highlighted box can be edited in order to enter an absorbance value corresponding to a given concentration value using the keypad numbers.
-
Page 30: Lowry Assay
NanoPhotometer P-Class User Manual ® 7.3.6 Lowry Assay The colorimetric Lowry assay is not recommended with the Submicroliter Cell. Please use Cuvette Applications. The procedure is as follows: Parameter Screen Parameter Screen Step 1 Press 2 to select Cuvette folder. - Page 31 NanoPhotometer P-Class User Manual ® Calibration Screen (replicates off) Calibration Screen (replicates off) Step 13 This shows the calibration values and allows standards to be measured. Insert the reference sample. Press Blank key. This will be used for all subsequent samples until changed.
- Page 32 NanoPhotometer P-Class User Manual ® Calibration Screen (manual entry) Calibration Screen (manual entry) Shows previously entered calibration values and allows values to be entered via the keypad. Step 22 The highlighted box can be edited in order to enter an...
-
Page 33: Biuret Assay
NanoPhotometer P-Class User Manual ® 7.3.7 Biuret Assay The colorimetric Biuret assay is not recommended with the Submicroliter Cell. Please use Cuvette Applications. The procedure is as follows: Parameter Screen Parameter Screen Step 1 Press 2 to select Cuvette folder. - Page 34 NanoPhotometer P-Class User Manual ® Calibration Screen (replicates off) Calibration Screen (replicates off) Step 13 This shows the calibration values and allows standards to be measured. Insert the reference sample. Press Blank key. This will be used for all subsequent samples until changed.
- Page 35 NanoPhotometer P-Class User Manual ® Calibration Screen (manual entry) Calibration Screen (manual entry) Shows previously entered calibration values and allows values to be entered via the keypad. Step 22 The highlighted box can be edited in order to enter an...
-
Page 36: Bacterial Cell Culture Measurement (Od600)
P-Class is coming with a correction factor of 1 as default. To compare OD ® values between different spectrophotometer, you have to determine the constant deviation between the Absorbance values for the same sample within those instruments and use this factor within the setting “correction factor” of your NanoPhotometer P-Class Software. ® ... -
Page 37: Analysis Of Bacterial Growth
NanoPhotometer P-Class User Manual ® 4.3.2 Analysis of Bacterial Growth The procedure is as follows: Parameter Screen Parameter Screen Step 1 Press 2 to select Cuvette Applications. Step 2 Press 3 to select OD 600. Step 3 Select the Wavelength. Default value is 600 nm. Range is 200 nm to 950 nm. -
Page 38: Functions
NanoPhotometer P-Class User Manual ® 5. FUNCTIONS Survey of the available Functions: Key pad number Description Absorbance or %T (transmission) at a single user defined wavelength. Colorimetric assay at a single wavelength based on a simple Factor entered or calculated from a single standard. -
Page 39: Single Wavelength - Abs And %T
NanoPhotometer P-Class User Manual ® Single Wavelength – Abs and %T This makes simple absorbance (A) and % transmission (%T) measurements on samples, measuring the amount of light that has passed through a sample relative to a reference (this can be air). - Page 40 NanoPhotometer P-Class User Manual ® NanoPhotometer P 300 ® Options (select using key pad numbers) Options (select using key pad numbers) 1) Return to parameters screen. 2) Print result via selected method. 3) Toggle between Absorbance and %T mode. 4) Print graph – greyed out if no data are available.
-
Page 41: Concentration
NanoPhotometer P-Class User Manual ® Concentration This makes simple concentration measurements on samples, by measuring the amount of light that has passed through a sample relative to a reference (this can be air). Concentration is obtained by multiplying the measured absorbance at a specific wavelength by a factor. - Page 42 NanoPhotometer P-Class User Manual ® Results Screen (if using standard mode) Results Screen (if using standard mode) Step 11 Insert the reference sample. Press Blank key. This will be used for all subsequent samples until changed. Step 12 Press Sample to display the Run Standard screen.
-
Page 43: Wavescan
NanoPhotometer P-Class User Manual ® Wavescan An absorption spectrum can be obtained from your instrument, enabling simple identification of peak height and position. The procedure is as follows: Parameter Screen Parameter Screen Step 1 Press 3 to select Functions. Step 2 Press 3 to select Wavescan. - Page 44 NanoPhotometer P-Class User Manual ® Menu (select using key pad numbers) Menu (select using key pad numbers) 1) Return to parameters screen. 2) Transfer the results via selected Output Options / Printer settings. 3) Toggle between Absorbance and %T mode.
- Page 45 NanoPhotometer P-Class User Manual ® Add Peak (Shortcut button 5) Add Peak (Shortcut button 5) Adds a user defined peak at the current cursor position. The entry is then displayed in inverse colouring to discriminate between user defined peaks and auto-detect peaks. When the cursor is positioned over the user defined peak a legend “User Defined...
-
Page 46: Kinetics
NanoPhotometer P-Class User Manual ® Kinetics Simple kinetics studies, where the change in absorbance needs to be followed as a function of time at a fixed wavelength, can be readily performed. Reagent test kits are routinely used for the enzymatic determination of compounds in food, beverage and clinical laboratories by measuring NAD / NADH conversion at 340 nm. - Page 47 NanoPhotometer P-Class User Manual ® Results Screen Results Screen Step 12 Insert the reference sample and press Blank key. Step 13 Insert the sample and press Sample to start the run. Time (min) is displayed at the bottom of the screen, and absorbance data are plotted on the graph as testing proceeds.
-
Page 48: Standard Curve
NanoPhotometer P-Class User Manual ® Standard Curve The construction of a multi-point calibration curve from standards of known concentration to quantify unknown samples is a fundamental use of a spectrophotometer; this instrument has the advantage of being able to store this curve as a method, using up to 9 standards. - Page 49 NanoPhotometer P-Class User Manual ® Standard Screen Standards screen Step 10 Enter the concentration values by using the keypad numbers and the up and down arrows to move between the different standard boxes. Range 0.001 to 9,999. Step 11 Press Next to enter the Calibration screen.
- Page 50 NanoPhotometer P-Class User Manual ® Calibration (Manual entry) Calibration (Manual entry) Step 24 Shows previously entered calibration values and allows values to be entered via the keypad. Step 25 The highlighted box can be edited in order to enter an absorbance value corresponding to a given concentration value using the keypad numbers.
-
Page 51: Multiple Wavelength
NanoPhotometer P-Class User Manual ® Multiple Wavelength This makes up to 5 absorbance measurements on the same sample. The procedure is as follows: Parameter Screen Parameter Screen Step 1 Press 3 to select Functions. Step 2 Press 6 to select Multi Wavelength Step 3 Select the number of Wavelengths. - Page 52 NanoPhotometer P-Class User Manual ® NanoPhotometer P 300 ® Options (select using key pad numbers) Options (select using key pad numbers) 1) Return to parameters screen. 2) Print result via selected method. 3) Toggle graph on/off. Displays the calibration graph, cursors give values for last measured sample.
-
Page 53: Absorbance Ratio
NanoPhotometer P-Class User Manual ® Absorbance Ratio This makes simple absorbance ratio measurements on samples, measuring the amount of light that has passed through a sample relative to a blank (this can be air) at two wavelengths. The procedure is as follows:... - Page 54 NanoPhotometer P-Class User Manual ® Results Screen Results Screen Step 14 Insert the reference sample. Press Blank key. This will be used for all subsequent samples until changed. Step 15 Insert sample and press Sample Step 16 Repeat for all samples. The absorbance at the selected...
-
Page 55: User Methods
SD Memory Card Individual or all methods can be copied on the SD Memory Card and can be restored back into the same instrument at a later date. For further details, please refer to the NanoPhotometer P-Class Accessory manual. ®... -
Page 56: Utilities
NanoPhotometer P-Class User Manual ® Delete Method 1. Select the method to be deleted using the key pad numbers. 2. Select Menu/Options and press 1 Delete Method. 3. Press OK to delete the method OR Cancel to return to User Methods folder. -
Page 57: Date And Time
Utilities folder OR press Cancel to return to the Utilities folder without storing the settings. Output Options / Printer 7.3.1 NanoPhotometer P 300 ® The NanoPhotometer P 300 offers a selection of data-output accessories. Please proceed to Folder 5 Utilities, press 3 ®... -
Page 58: Nanophotometer P 330 /P 360
2 for Data Transfer to transfer the data to the PC. All further measurements are transferred and saved automatically. Direct Data-output to USB flash drive: If a USB flash drive is connected to the USB flash drive port (right side of the NanoPhotometer ) all measured data are ®... -
Page 59: Loading / Changing The Printer Paper
P-Class User Manual ® Direct Data-output to PC: Connection between NanoPhotometer P-Class and PC is possible with a USB cable connection: ® Select how the data are send. Options are Computer (USB) or None. Press OK to store the settings and return to the Utilities folder OR press Cancel return to the Utilities folder without storing the settings. -
Page 60: Preferences
NanoPhotometer P-Class User Manual ® Preferences Sets user preferences. The procedure is as follows: Step 1 Select Games function. This determines whether the games folder is displayed or not; Options are yes or no. Step 2 Define the Screen layout (Theme) of folders. Options are either a grid format or a list. -
Page 61: Maintenance
For facilities that are working according to national as well as international guidelines and standards – such as Good Laboratory Practice (GLP), Good Manufacturing Practice (GMP) or ISO9000-9004 - the proper performance of a spectrophotometer has to be tested and proved on regular individually set intervals. Implen provides certified NanoPhotometer P-Class secondary standards as an optional accessory. -
Page 62: Cleaning And General Care Of The Instrument
A mild liquid detergent may be used to remove stubborn marks. NanoPhotometer P-Class design edition (glossy anthracite): ® All painted surfaces of the NanoPhotometer P-Class can be cleaned with a soft damp cloth and approved cleaning or ® disinfectant solutions. -
Page 63: Error Messages
If possible try another power supply. Please contact the Implen Support Team (support@implen.de, Phone +49-89-7263718 20) if none of the mentioned solution helps to solve the problem or if another error message should appear on the NanoPhotometer P-Class ®... -
Page 64: Trouble Shooting
Thermal printer automatic roller stops. Please contact the Implen support team! Please contact the Implen Support Team (support@implen.de, Phone +49-89-7263718 20) if none of the mentioned solution helps to solve the problem or if another symptom should occur. 9. ACCESSORIES... -
Page 65: Specification And Warranty
IMPLEN guarantees that the product supplied has been thoroughly tested to ensure that it meets its published specification. The warranty included in the conditions of supply is valid for 12 month for the NanoPhotometer ® P 300 / P 330 and 24 months for the NanoPhotometer P 360 only if the product has been used according to the ®... -
Page 66: Solvent Compatibility
User Manual ® 11. SOLVENT COMPATIBILITY Most solvents typically used in life science laboratories are compatible with the NanoPhotometer® P-Class submicroliter cell surface and the lid surfaces. The following solvents are compatible for use on the submicroliter cell at room temperature:... -
Page 67: Appendix
NanoPhotometer P-Class User Manual ® 12.APPENDIX 12.1 Nucleic acid quantification For determination nucleic acid concentration in solution the absorbance at wavelength 260 nm is used. The function describing the concentration to absorbance relation is a modification of the Lambert-Beer equation. - Page 68 Abs. absorbance at absorption maximum of the dye (AU) max, dye ε dye-dependent extinction coefficient (M * cm The following dye types and parameters are pre-programmed in the NanoPhotometer P-Class. ® Dye-dependent extinction Absorption maximum Dye Dye-dependent correction Dye Type ε...
-
Page 69: Protein Quantification
NanoPhotometer P-Class User Manual ® 12.3 Protein quantification For determination of protein concentration in solution the absorbance at wavelength 280 nm is used. The function describing the concentration to absorbance relation is a modification of the Lambert-Beer equation. = Abs. 280 * A280 factor * lid factor * dilution factor prot. - Page 70 * cm prot dye-dependent correction factor at 280 nm (to be delivered from dye-supplier) ε dye-dependent molar extinction coefficient (M * cm The following dye types and parameters are pre-programmed in the NanoPhotometer P-Class. ® Dye-dependent extinction Absorption maximum Dye–dependent correction Dye Type ε...
Need help?
Do you have a question about the NanoPhotometer and is the answer not in the manual?
Questions and answers