
Related Manuals for LeCroy LC Series


Summary of Contents for LeCroy LC Series
- Page 1 Operator’s Manual LeCroy LC Series Color Digital Oscilloscopes Revision K — December 1999...
- Page 2 Tel: (41) 22 719 21 11, Fax: (41) 22 782 39 15 Internet: www.lecroy.com Copyright © January 1999, LeCroy. All rights reserved. Information in this publication supersedes all earlier versions. Specifications subject to change. LeCroy, ProBus and SMART Trigger are registered trademarks of LeCroy Corporation. Centronics is a registered trademark of Data Computer Corp.
- Page 3 ............. 1–1 ....................2–1 ..................2–4 ....... 3–1 ..................4–1 ................4–2 ........... 4–3 ..........4–5 ................4–8 ................. 5–1 ....................5–3 ............5–5 ..........6–1 ............7–1 ................7–5 ..................7–6 L C X X X -O M -E R e v K IS S U E D : D e ce m b e r 1 9 9 9...
- Page 4 ............8–1 ................. 8–2 ..................8–3 ................... 8–9 ..............8–34 ..............8–35 ..............9–1 ....10–1 ..........10–2 ..........10–5 ..........10–6 ........ 10–18 .......... 11–1 ......11–2 ..............11–5 ............. 11–7 ............... 11–20 ......... 12–1 ..................12–2 .................12–4 ................12–5 ..............12–7 ................12–19 ...................12–23 IS S U E D : D e ce m b e r 1 9 9 9 L C X X X -O M -E R e v K...
- Page 5 ................13–1 ................. 13–4 ....14–1 ......14–6 ..............14–15 ........15–1 ....... 16–1 L C X X X -O M -E R e v K IS S U E D : D e ce m b e r 1 9 9 9...
- Page 6 B L A N K P A G E IS S U E D : D e ce m b e r 1 9 9 9 L C X X X -O M -E R e v K...
- Page 7 LeCroy shall not be liable for any special, incidental, or consequential damages, whether in contract or otherwise. The client will be responsible for the transportation and insurance charges for the return of products to the service facility.
- Page 8 H elp on installation, calibration, and the use of LeC roy equipm ent is available from the LeC roy C ustom er S ervice C enter in your country (telephone num bers are given at the back of this m anual). LeC roy provides a variety of custom er support services under M aintenance A greem ents.
- Page 9 C ontact the nearest LeC roy S ervice C enter or office to find out w here to return the product. A ll returned products should be identified by m odel and serial num ber. Y ou should describe the defect or failure, and provide your nam e and contact num ber.
-
Page 10: Blank Page
BLAN K PAG E IS S U E D : D e ce m b e r 1 9 9 9 L C X X X -O M -E R e v K... - Page 11 Each of the four channels of a LeCroy LC Color Digital Storage Oscilloscope (DSO) has one or more 8-bit Analog-to-Digital Converters (ADCs). Combine channels by interleaving ADCs to substantially increase instrument’s acquisition memory and sampling rate. T he central processing unit (C P U ), a P ow erP C ® m icroprocessor, perform s the oscilloscope’s com putations and controls its...
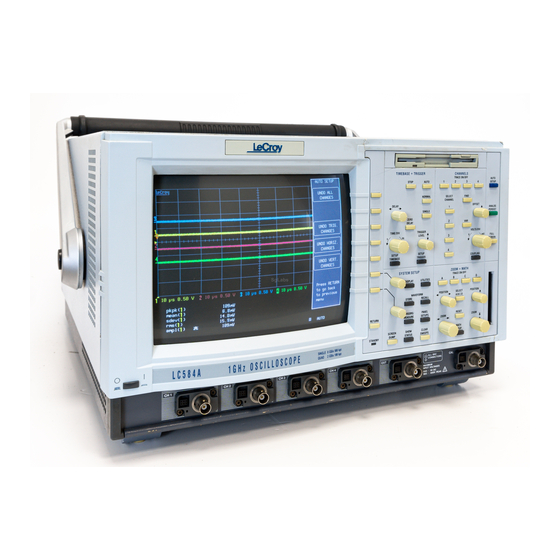
- Page 12 R epetitive signals can be acquired and stored at a R andom Interleaved S am pling (R IS ) rate of 10 G S /s for all m odels except LC564, LC584, LC684 S , w hose R IS rate is 25 G S /s. ERIES M oreover, this...
- Page 13 T he A nalog P ersistence ™ function offers display attributes of an analog instrum ent w ith all the advantages of digital technology. T he F ull S creen function expands w aveform grids to fill the entire screen. S ee C hapter 11. A hard copy of the screen can be easily produced at any tim e by pressing the front-panel screen-dum p button (see C hapter 12).
- Page 14 O p tio n a l S to ra g e D e v ic e s S a m p le P e a k F a s t 8 - B it A D C (s ) & H o ld D e te c t M e m o r y F lo p p y D is k...
- Page 15 O p tio n a l S to ra g e D e v ic e s S a m p le F a s t 8 - B it A D C m e m o r y & H o ld F lo p p y D is k In te rfa c e S a m p le...
- Page 16 B LA N K P A G E IS S U E D : D e ce m b e r 1 9 9 9 L C X X X -O M -E R e v K...
- Page 17 Ensure that the operating environment is maintained within the following parameters for safe operation of the oscilloscope within specifications: T em perature ......5 to 40 °C (41 to 104 °F) H um idity........≤80% R H (non-condensing) Altitude ........≤2000 m (6560 ft) O peration .........
- Page 18 The oscilloscope has not been designed to make direct measurements on the human body. Users who connect a LeCroy oscilloscope directly to a person do so at their own risk. The oscilloscope operates from a 115 V (90 to 132 V) or 230 V (180 to 250 V) AC (~) power source at 45 to 66 Hz.
- Page 19 voltage selection required because instrum ent autom atically adapts to the line voltage that is present. T he power supply of the oscilloscope is protected against short- circuit and overload by m eans of two fuses (T 6.3 A, 250 V) located above the m ains plug.
- Page 20 BLAN K PAG E IS S U E D : D e ce m b e r 1 9 9 9 L C X X X -O M -E R e v K...
- Page 21 LC684 ONLY L C X X X -O M -E R e v K IS S U E D : D e ce m b e r 1 9 9 9...
- Page 22 The front-panel controls are divided into four main groups of buttons and knobs: SYSTEM SETUP • CHANNELS • TIMEBASE + TRIGGER • ZOOM + MATH • Other buttons access special features. D ark gray m enu entry buttons (also present in other groups of controls) provide access to the m ain on-screen m enus and the instrum ent’s acquisition, processing, and display m odes.
- Page 23 On-screen menus — the panels along the right-hand side of the screen — are used to select specific scope actions and settings. All other on-screen text is for information only. The menus are broadly grouped according to function. The name of each menu group is shown at the top of the column of menus.
- Page 24 T he activated selection is highlighted in the m enu. P ress the corresponding m enu button and the field w ill advance to highlight and select the next item on the m enu. H ow ever, if there is only one item on a m enu, pressing its button w ill have no effect.
- Page 25 Besides the menu buttons and knobs described on the previous pages, the SYSTEM SETUP controls include the menu entry buttons and others for copying displays, reporting instrument status, restarting multiple- acquisition operations. is used to go back to the preceding displayed m enu group. O r it returns the display to a higher-level, or prim ary m enu.
- Page 26 g iv e s y o u a c c e s s to the “C U R S O R S ” setup m enus, w hich are used to m ak e precise cursor m easurem ents on traces, and the “M E A S U R E ”...
- Page 27 Press the blue AUTO SETUP button to automatically scale the timebase, trigger level, offset, and volts/div to provide a stable display of repetitive signals. This button operates only on active channels. If no channels are switched on, and no signals are detected, AUTO SETUP will operate on all channels, switching all of them on.
- Page 28 The grid area of the screen and the fields surrounding it provide a variety of useful information, and specific commands and functions. IS S U E D : D e ce m b e r 1 9 9 9 L C X X X -O M -E R e v K...
- Page 29 Real-Time Clock: P ow ered by a battery-back ed real-tim e clock , this field displays the current date and tim e. Displayed Trace Label: T his field indicates each channel or channel displayed, the tim e/div and volts/div settings, and cursor readings w here appropriate.
- Page 30 Trace and Ground Level: T his is the trace num ber and ground- level m ark er. Time and Frequency: T his area displays the tim e and frequency relative to cursors below the grid. F or exam ple, w hen the ( not show n ) absolute tim e cursor (the cross-hair) is activated by selecting it from the “M E A S U R E ”...
- Page 31 These controls let you select displayed traces adjust vertical sensitivity and offset. Press these buttons to display or switch off the corresponding channel trace. W hen a channel is switched on, O FFSET VO LT S/D IV controls are assigned to this, the active channel.
- Page 32 T he form at of the vertical sensitivity in the Acquisition Sum m ary field (bottom left of screen) shows whether the VO LT S/D IV knob is operating in continuous or stepping m ode. T his m enu entry button accesses the “C oupling” m enus (see next section).
- Page 33 Press to select a coupling level that adapts the oscilloscope’s input impedance to the impedance of the device under test. This button also accesses the menus that let you select the coupling and grounding of each input channel ECL or TTL gain, offset, and coupling that have been preset for the channel shown bandwidth limit for all channels probe attenuation of each input channel...
- Page 34 “BW L” if the G lobal BW L is deactivated. See C hapter 12, “Special M odes.” T his function sets the probe attenuation for the input channel. (S ee the follow ing section for probe details.) In the AC position signals are coupled capacitively, thus blocking the input signal’s DC component and limiting signal frequencies below 10 Hz.
- Page 35 3. Attach the lead’s alligator clip to the CAL BNC’s ground (outer ring) and touch the tip to its inner conductor. LeCroy PP005 passive Alternatively, if you are using the 11-cm ground lead, probe...
- Page 36 P roB us offers im portant advantages over standard B N C and probe-ring connections. Illustrated at right: a LeCroy For exam ple, the system ensures current probe with ProBus correct input coupling by auto- connection. sensing probe type,...
- Page 37 channel, it appears as “BW L” if the G lobal BW L is deactivated. See C hapter 12, “Special M odes.” W hen a F E T probe is used, “P robe sensed… ” appears autom atically. W hen other P roB us probes are used, this is redefined.
- Page 38 B LA N K P A G E IS S U E D : D e ce m b e r 1 9 9 9 L C X X X -O M -E R e v K...
- Page 39 These controls let you adjust time/division, trigger level and delay; and to access the “TIMEBASE” and “TRIGGER” menu groups. See Chapter 7 for descriptions of the Timebase Modes that are affected by these controls. See Chapter 8 for trigger details. T his button halts...
- Page 40 P ress this button to place the instrum ent in A uto M ode: the scope autom atically displays the signal if no trigger quick ly occurs. • If a trigger does occur w ithin this tim e, the oscilloscope behaves as in N orm al M ode.
- Page 41 P ress this button to place the instrum ent in S ingle-S hot M ode, w here it w aits for a single trigger to occur, then displays the signal and stops acquiring. If no trigger occurs, you can press the button again to see the signal w ithout a trigger.
- Page 42 T his m enu entry button calls up the “T IM E B A S E ” m enus (described in the next chapter). T his m enu entry button calls up “T R IG G E R S E T U P ” m enus (described in C hapter 8).
- Page 43 Depending on the timebase, you may choose from three sampling modes: Single-Shot, RIS (Random Interleaved Sampling), or Roll mode. Furthermore, for timebases suitable for Single-Shot or Roll mode, the acquisition memory can be subdivided into user- defined segments to give Sequence mode. S ingle-S hot is the digital storage oscilloscope’s basic acquisition m ethod.
- Page 44 W ith slow tim ebases, sam ple rate decreases and very short events such as glitches can be m issed if they occur betw een sam ples. T o avoid this special circuitry called P eak D etect can capture the signal envelope to a resolution of 2.5 ns. T his does not, how ever, destroy underlying sim ultaneously captured data on w hich advanced processing can still be perform ed.
- Page 45 O n average, 104 trigger events are needed to com plete an R IS acquisition. B ut som etim es m any m ore are needed. T hese segm ents are interleaved to provide a w aveform that covers a tim e interval that is a m ultiple of the m axim um single-shot sam pling rate.
- Page 46 T rigger tim e stam ps are given for each of the segm ents, using the “T ext & T im es S tatus” m enu (see C hapter 16). E ach individual segm ent can be zoom ed or used as input to m ath functions (see C hapter 10).
- Page 47 For fast timebases, interleaving of the oscilloscope’s ADCs by the combining of channels greatly boosts both sample rate and memory length. D epending on your scope m odel, a pair of channels can be com bined on channel 2 or 3, with channels 1 and 4 disabled or available only for triggering (see N ote).
- Page 48 Press to choose Single-Shot, RIS. or Sequence modes to combine channels and increase sample rate and record length on most models; or use Peak Detect and the external clock, where available. “T IM EBASE” indicates the num ber of points acquired, sam ple rate, and total tim e span.
- Page 49 U se this feature to select the m axim um num ber of sam ples to be acquired, using the associated m enu knob. See Appendix A for m odel m axim um s. Use this feature to select one of the two principal m odes of acquisition: Single Shot displays data collected during successive single-shot acquisitions from the input channels.
- Page 50 T hese m enus appear w hen an external clock m ode (E C L, O V , T T L) is chosen from “S am ple C lock ”. T his m enu is inactive w hen the external sam ple clock is being used.
- Page 51 T his m enu is inactive w hen A N external sam ple clock is being used. Single-Shot is selected by default. T his feature selects the External clock m ode. “External” specifies that the D C to 500 M H z external clock, which is connected to the instrum ent through the rear panel, is to be used as the sam ple clock.
- Page 52 T his is used for S equence m ode. T his m enu is inactive w hen S equence m ode is being used. Single-Shot is selected by default. (OPTIONAL ON LC564 AND LC584 SERIES) U se this feature to select Internal or external (ECL, OV, TTL) clock m odes (see page 7–8 or 7–9).
- Page 53 In S equence m ode, pressing each of the T IM E B A S E + T R IG G E R buttons m entioned here has particular effects on the acquisition. • W hen you press , the oscilloscope fills the chosen num ber of segm ents and then stops the acquisition.
- Page 54 B LA N K P A G E IS S U E D : D e ce m b e r 1 9 9 9 L C X X X -O M -E R e v K...
-
Page 55: Trigger Setup
Your oscilloscope offers many distinctive and useful techniques for triggering on, and capturing, data. These range from simple edge trigger to the advanced, multiple- input SMART Trigger®. T hree triggering m odes are availab le: A U T O , N O R M A L, a nd S IN G L E . - Page 56 A variety of triggers for specific applications can be chosen from the two main trigger groups, Edge and SMART Trigger. In the Edge group of m enus, trigger conditions are defined by the vertical trigger level, coupling, and slope. E dge triggers use relatively sim ple selection criteria to characterize a signal.
- Page 57 Selecting “Edge” and its menus (Fig. 8–2) causes the scope to trigger whenever the selected signal source meets the trigger conditions. The trigger source is defined by the trigger level, coupling, slope or hold-off. Certain of these basic conditions applicable for SMART Trigger are also selected in “Edge”...
- Page 58 T h e tr ig g e r s o u r c e m a y b e o n e o f th e f o llo w in g : T he acquisitio n chan ne l sign a l (C H 1, C H 2, C H 3 or C H 4) conditio ned for th e o vera ll vo ltage ga in, co up lin g, a nd band w id th.
- Page 59 T his is the p articu lar type of signa l cou plin g at the in put of the trigger c ircuit. A s w ith the trigg er le ve l, the co uplin g can be ind epe nde ntly se lecte d for each source. T hus, cha ng ing the trigger so urce can ch ang e th e coup ling.
- Page 60 T h is is th e m in im u m tim e b e tw e e n trig g e rs (F ig . 8 – 3 ). A trig g e r is g e n e ra te d w h e n th e tr ig g e r c o n d itio n is m e t a fte r th e s e le c te d h o ld -o ff d e la y fro m th e la s t trig g e r.
- Page 61 H old-off by events is initialized and started on each trigger (F ig . 8 – 4 ). A trigger is generated w hen the trigger condition is m et after the selected num ber of events from the last trigger. An event is defined as the num ber of tim es the trigger condition is m et after the last trigger.
- Page 62 T he W indow T rigg er (F ig . 8 – 5 ) a llo w s th e d e fin itio n o f a w in d o w re g io n w h o s e b o u n d a r ie s e x te n d a b o v e a n d b e lo w th e s e le c te d trig g e r le v e l.
- Page 63 SMART Trigger types allow additional qualifications before a trigger is generated. Depending on the oscilloscope model, it may include triggers adapted for glitches, intervals, abnormal signals, TV signals, state- or edge-qualified events, dropouts, patterns, “runts,” and slew rate. G enerally, a glitch is a pulse that is m uch faster than the observed waveform .
- Page 64 D igital electronics circuits norm ally use an internal clock. For testing purposes a glitch can be defined as any pulse of w idth sm aller than the clock period or half-period. G litch Trigger has a broad range of applications in digital and analog electronic developm ent, AT E, E M I, telecom m unications, and m agnetic m edia studies.
- Page 65 S electin g “G litch” an d setting w idth co nd itions can also ena ble the exclusion of events th at fall in or o ut of a se lecte d ran ge of w idth. T his is an exclusion trigg er (F ig. 8–8). O nly p ulses o utside (less-than-or-eq ual-to or gre ater-th an-or-eq ua l-to) th is rang e w ill generate a trig ger e ve nt.
- Page 66 W hereas G litch T rigger p erform s over the w idth of a p ulse, Inte rva l T rigg er (F ig . 8 – 9 ) p erform s over the w idth of an interval. A n interva l correspon ds to a th e sig na l duration (th e p eriod) separating tw o co nsecutive edg es of the sam e polarity: positive to pos itive edg e;...
- Page 67 For this Interval T rigger, generated on a tim e interval sm aller than the one selected, a m axim um interval between two like edges of the sam e slope — positive, for exam ple — is chosen (F ig . 8 – 1 0 ). T he trigger is generated on the second (positive) edge if it occurs within the selected interval.
- Page 68 F or this Interval T rigg er, gen erated on a n interva l larger than the one se lecte d, a m inim um interval betw een tw o ed ges of the sam e slope is selected (F ig. 8 –11). T he trigg er is g enera ted on the secon d e dge if it occurs after the selected interva l.
- Page 69 This Interval T rigger is g enerated w he ne ver a n interva l be tw ee n tw o e dges of th e sam e slope falls w ithin a se lecte d rang e (F ig . 8 –...
- Page 70 This Interval Trigger is generated whenever an interval between two edges of the same slope falls outside a selected range (Fig. 8–13). The trigger is generated on the second edge if it occurs after the selected interval range. The timing for the interval is initialized and restarted whenever the selected edge occurs.
- Page 71 P attern T rigger (F ig . 8 – 1 4 ) e nab les trigg erin g on a log ical com bination of the five inp uts C H 1 , C H 2, C H 3, C H 4 a nd E X T . T his com bination, ca lled a pa ttern, is defined as the lo gica l A N D of trigger states.
- Page 72 P attern T rigger can be used in dig ita l desig n for the testing of com plex lo gic inp uts or d ata tra nsm ission buses. T hreshold H igh CH 1 H igh T hreshold CH 2 Pattern 1H*2L Generated Trigger (Pattern Entering)
- Page 73 O nce the pattern is defined, one of tw o transitions can be used to generate the trigger. W hen the pattern begins, called entering the pattern, a trigger can be generated. A lternatively, a trigger can be generated w hen the pattern ends, called exiting the pattern. W ith pattern triggering, as in single source, either of these qualifications can be selected: H old-off for 10 ns up to 20 s (2 ns–...
- Page 74 In th e case of Q ua lified T riggers (F ig. 8–16), a signa l’s tra nsition abo ve or be lo w a g iven le ve l — its valid ation — s erves as an enab ling (q ua lifying) con ditio n for a second sig nal tha t is the source of the trigger.
- Page 75 Q ualified T riggers offer the cho ice of ge nerating a trigger w he n a selected pattern is present or a bsent. A s w ith P attern T rigger, the p attern is d efined as a log ical A N D com bination of trigger states tha t are hig h or lo w : high w he n a trigg er source is greater than the se lecte d trigger le ve l;...
- Page 76 Trigger Source: Positive Slope Qualifier: Pattern Present Trigger can occur W ait W ait Generated Trigger Figure 8–17. State-Qualified by Wait: Trigger after timeout. The broken upward-pointing arrows indicate potential triggers, while the bold arrows show where the actual triggers occurs. A s the abo ve figure illustrates, a trigg er is ge nerated on a risin g edge w he ne ver the p attern is asserte d (pattern present) a nd the w ait tim eout h as expire d.
- Page 77 Like its State-Q ualified equivalent, Edge-Q ualified w ith W ait (Fig. 8–18) is conditioned by either T im e or Events: Time determines a delay from the start of the desired pattern. After the delay (timeout) and before the end of the pattern, a trigger can occur.
- Page 78 intended to be used exclusively in Sequence Mode to speed up the trigger rate. With Qualified First, a single valid trigger is sufficient to acquire a full sequence. Other than in Sequence Mode, Qualified First is identical to the Qualified Triggers. Qual First E d g e, S ta te q u a lifie r T rig g e r o n...
-
Page 79: Qualified First Trigger
(Edge-)Qualified Trigger Qualifier Trigger S egm ent 1 S egm ent 2 S egm ent N Qualified First Trigger Qualifier Trigger S egm ent 2 S egm ent N S egm ent 1 Figure 20. Comparing Qualified (top) and Qualified First (bottom) Triggers. Whereas the (Edge-) Qualified Trigger requires that each of the segments be “qualified”... - Page 80 A special k ind of E dg e-Q ualified T rigg er, T V T rigger (F ig. 8–21) allo w s stab le trigg erin g o n stan dard or user-define d com posite video s ign als, o n a sp ecific line of a num erically odd or e ven field.
- Page 81 Because most TV systems have more than two fields, the enhanced field-counting capability (FIELDLOCK) allows the oscilloscope to trigger consistently on a chosen line within a field of the signal. The field-numbering system is relative, in that the oscilloscope cannot distinguish between fields 1, 3, 5, or 7 (or 2, 4, 6, or 8) in an absolute way.
- Page 82 D ropout T rigger (F ig. 8– 22 ) pro vides trigg erin g w h ene ver the signa l d isapp ears for a set p erio d of tim e. T he trigger is generated at the end of the tim e-out period follo w ing the “last” trigger-source transition , as sho w n in the figure on the n ext pag e ( F ig.
-
Page 83: Trigger Source
Trigger Source Trigger can occur W ait W ait T im e-out T im e-out Generated Trigger Figure 8–23. Dropout Trigger: occurs when the time-out has expired. The bold upward-pointing arrows show where the trigger occurs. This Dropout Trigger example shows a wait time-out of 25 ns. - Page 84 T he R unt T rigger ( F ig. 8 –24 ) is program m ed to occur w h en a pulse crosses a first thresho ld line an d fa ils to cross a second threshold lin e b efore re-crossin g th e first (F ig. 8 –25). Y o u can select b oth thresho lds w ith in a rang e of 60 0 p s to 20 s .
- Page 85 U pper T hreshold Level Trigger Source Low er T hreshold Level Generated Trigger (Positive Slope) Generated Trigger (Negative Slope) Figure 8–25. Runt Trigger: triggers when a pulse crosses the first threshold but not the second before re-crossing the first — marked by the bold, upward-pointing arrows. This example sows a positive edge (“Neg”...
- Page 86 S le w R ate T rigger (F ig. 8 –26) activates a trigger w hen the risin g or falling edg e of a p ulse crosses tw o thresho ld leve ls: an up per and a low er level (F ig. 8–2 7). T he pu lse e dge m ust cross the thresholds faster or slo w er tha n a se lecte d p erio d of tim e.
- Page 87 Trigger Source U pper T hreshold Level Low er T hreshold Level Generated Trigger Figure 8–27. Slew Rate Trigger: occurs when a rising or falling edge crosses two thresholds (dV) outside a selected time range (dT), marked by the bold, upward-pointing arrow. This Slew Rate example is the same as the Edge Trigger symbol, but shows lower (0.556 V) and upper (188 m) threshold levels, and a time range ( ≥...
- Page 88 Press to access selection of: Trigger source, Coupling for each source, Slope (positive or negative), and Hold-off by time or events. U se this to select Edge (for an explanation of Edge T rigger, refer to page 8–3). T his selects the trigg er source. T his selects the trigg er coup ling for the current source.
- Page 89 Press to access the various SMART Trigger types: Glitch (see pa ge 8-36) Exclusion (see p age 8-36) Interval (see p age 8–3 8) TV (see page 8– 39) State- and Edge-Qualified (see pa ges 8–4 0, 8–4 1) Dropout (see pag e 8 –42) Pattern (see pa ge 8-43) Qual First (see pag e 8-4 4) Runt —...
- Page 90 U se this to select Glitch (for an explanation of G litch T rigger, refer to page 8– 9 ). Exclusion Trigger is also set using these m enus — refer to page 8–11. U se this to select the trigger source. U se this to select the trigger coupling.
- Page 91 W hen Pattern is selected from “trigger on” in G litch m ode (and also in Interval m ode — see next page), the instrum ent triggers on the logic AN D of up to five sources. U se this to select Glitch (for an explanation of G litch T rigger, refer to page 8–9).
- Page 92 U se this to select Interval ( for an explanation of Interval Trigger, refer to page 8–12 ). U se this to select the trigger source. W hen Pattern is selected, the instrum ent triggers on the logic A N D of up to five sources, and displays m enus as in G litch-Pattern m ode (see previous page).
- Page 93 U se this to select TV ( for an explanation of TV Trigger, refer to page 8–26 ). U se this to select the trigger source. U se this to define the field num ber: odd or even. U se this to select Standard or Custom T V decoding. W hen Standard is chosen, this selects “625/50/2:1”...
- Page 94 U se this to select Qualified (for an explanation of State-Q ualified Trigger, refer to page 8–21). U se this to select State. U se this to select the trigger source. O ther conditions for this source, such as slope and hold-off, m ay be set up using Edge T rigger (see page 8–34).
- Page 95 U se this to select the Qualified trigger type (for an explanation of Edge-Q ualified T rigger, refer to page 8–23). U se this to select Edge. U se this to select the trigger source. O ther conditions for this source, such as slope and hold-off, m ay be set up using Edge T rigger (see page 8–34).
- Page 96 U se this to select Dropout (for an explanation of D ropout T rigger, refer to page 8–42). U se this to select the trigger source . U se this to define w hether the m easurem ent starts on a Positive or Negative slope of the trigger signal.
- Page 97 U se this to select Pattern (for an explanation of Pattern T rigger, refer to page 8–17). U se this to select Entering for the instrum ent to trigger when the pattern starts being true , and Exiting for triggering w hen it stops being true .
- Page 98 U se this to select Qual First (for an explanation of Q ualified First Trigger, refer to page 8–24). U se this to select Edge or State. U se this to select the trigger source. O ther conditions for this source, such as slope and hold-off, m ay be set up using Edge T rigger (see page 8–34).
- Page 99 4 , AND LC684 T o select Runt (for an explanation of R unt T rigger, refer to page 8–30). U se this to select the trigger source. U se this to select the trigger coupling. H F coupling is not available. U se this to select and set the three defining conditions for the R unt Trigger: W hen Level is selected (not shown at left), these m enus appear:...
- Page 100 4 , AND LC684 U se this to select Slew Rate (for an explanation of Slew R ate Trigger, refer to page 8–32). U se this to select the trigger source. U se this to select the trigger coupling. U se this to select and set the three defining conditions for the S lew R ate T rigger: W hen dV is selected (not show n at left), the following m enus appear: U se this to select the level of the upper threshold.
- Page 101 A wide range of Zoom and Mathematical processing functions (detailed in the next chapter) can be performed on acquired waveforms with the controls described here. Four processed traces are available for norm al zoom ing or for waveform m athem atics. Any one of traces A, B, C or D can be set up to zoom another of these, or another trace...
- Page 102 POSITION T he k nob repositions zoom ed traces horizontally . If the source of the expanded w aveform is displayed, an intensified region corresponding to the area of expansion is show n. W hereas the vertically repositions the active trace. k nob horizontall y expands or contracts the active T he trace.
- Page 103 You can zoom several traces from a single waveform to obtain precise timing measurements. F or instance, on a w aveform com posed of tw o pulses separated by a long delay, T race A could be m ade a zoom of the first pulse, and T race B a zoom of the second.
- Page 104 A wide range of standard or optional mathematical and waveform processing functions is available on LC Series Descriptions of the Setup oscilloscopes. Not all functions are described here. Those menu’s zoom, math, and such as Histogram, Trend, and Correlate are described in waveform processing their dedicated Operator’s Manuals, if these functions are...
- Page 105 T he w eight of ‘old’ w aveform s in the continuous average tends to zero (follow ing an exponential rule) at a rate that decreases as the w eight increases. S um m ed A veraging is the repeated addition (w ith equal w eight) of successive source w aveform records.
- Page 106 W hen the selected m axim um num ber of sw eeps is reached, the accum ulation stops. Y ou can interrupt the sam e process by changing the trigger m ode from N orm al to S topped or by turning off the function trace.
- Page 107 You can apply waveform mathematics to any channel or reference memory. Furthermore, any trace of A, B, C, or D can be set up as a math function, allowing several computations to be made in sequence. F or exam ple: T race A could be set up as the difference betw een C hannels 1 and 2, T race B as the average of A , and T race C the integral of B .
- Page 108 Press to configure any of the four traces and to execute any zoom or math function using the “ZOOM + MATH” menus. Any trace and function can be chained to another trace and function (not all functions shown m ay be available on your oscilloscope). Trace A, for exam ple, could be m ade an average of CH 1, Trace B an FFT of A, and Trace C a zoom of B.
- Page 109 T his appears w hen “R ED EFIN E A” (for exam ple) is selected from the “ZO O M + M AT H ” m enus. T his is for toggling between No (Zoom only) and Yes (M ath functions) setups.
- Page 110 T his appears when “ZO O M and Auto-Scroll” is selected from the ZO O M + M AT H m enu group. M U LT I-ZO O M unifies the control of all zoom traces, while AU T O -SC R O LL m oves the zoom trace (or traces) across the referenced trace.
- Page 111 — allows addition, subtraction, m ultiplication and division, as well as choice of the two operands and the operator. T he exam ple on this page shows a setup of trace A as the sum of C hannels 1 and 2. Select Yes to enable the choice of a m ath function.
- Page 112 T his feature offers Sum m ed (Linear) or C ontinuous (Exponential) Averaging. Shown here is an exam ple setup of trace A as a Sum m ed Average (over 1000 sweeps) of C hannel 1. (See also page 10–2.) Select Yes to enable the choice of a m ath function.
- Page 113 T his lets you select low-pass digital filters that increase the resolution of the displayed signal at the expense of its bandwidth. (See Appendix B for a detailed explanation . ) T hese digital filters w ork very m uch lik e analog bandw idth-lim it filters.
- Page 114 T his is used for acquiring a trace envelope over m any acquisitions (see also page 10–3). Select Yes to enable the choice of a m ath function. U se this subm enu to select Extrema. U se this subm enu to select either Envelope, Floor, or Roof. Floor shows only the lower, and R oof only the upper part of the envelope.
- Page 115 T his is used to display the Fast Fourier T ransform (FFT ) of a signal and to view it in the frequency dom ain. (See the final section of this chapter, and Appendix C , for when and how to use FFT . ) Select Yes to enable the choice of a m ath function.
- Page 116 T his is used for displaying the FFT power averaging of an FFT source trace. Power averaging is useful for characterizing broadband noise or periodic signals without a stable trigger signal. T otal power — signal and noise — is m easured at each frequency. T he source trace m ust be an FFT function.
- Page 117 T his gives you access to a variety of M ath display functions. Select Yes to enable the choice of a m ath function. U se this subm enu to select Functions. U se this subm enu to select a function type from : Absolute value Log 10 (base 10) Derivative...
- Page 118 T his deskew feature allows a signal on one channel to be resam pled, and adjusted in tim e relative to a signal on another channel. It is valuable wherever there is the need to com pensate for different lengths of cables, probes or other factors causing tim ing m ism atches.
- Page 119 T his is used for selecting a waveform and adjusting a (the m ultiplication factor) and b (the additive constant) in the form ula: ( a ∗ waveform ) + b , where both constants can have values ranging between −10 Select Yes to enable the choice of a m ath function.
- Page 120 The FFT (Fast Fourier Transform) converts a time domain waveform into frequency domain spectra similar to those of an RF spectrum analyzer display. But unlike the analyzer, which has controls for span and resolution bandwidth, FFT span is determined by sampling rate, while resolution bandwidth is inversely proportional to record length.
-
Page 121: Frequency Span
S im ilarly, if the source w aveform is a zoom trace, the frequency resolution is the reciprocal of the displayed w aveform ’s duration. T he frequency span of the F F T is called the N yquist frequency and is related to the sam pling frequency of the tim e dom ain w aveform . - Page 122 T he constant K in the illustration includes the decim ation factor described above, as w ell as autom atic display scaling factors. T his scaling is required to ensure that the F F T ’s horizontal display scale falls into a 1,2, or 5 factor. In essence, the oscilloscope autom atically adjusts the span (and hence the F F T transform size) to account for the user-entered “m ax points for m ath”...
- Page 123 T o achieve a desired F F T span, first m ak e sure that the sam pling rate is m ore than tw ice the span desired. C ontrol the sam pling rate using the T IM E /D IV k nob and set the acquisition m em ory length w ith the “T IM E B A S E ”...
- Page 124 T he exam ple illustrated below show s how the oscilloscope m aintains the display factor. A sam pling rate of 25 M S /s w ould result in a full scale range of 12.5 M H z or 1.25 M H z/div. T o m aintain a display scale factor of 1, 2, or 5, it decim ates the acquired w aveform...
- Page 125 The large display reveals the complete picture with advanced color management. Colors are used to give on- screen objects added depth and distinctness, and to clarify their relationships. T he display is intelligent as w ell as pow erful. C olor and intensity are m anaged autom atically in real tim e by a hardw are-supported system that has the added advantage of very low softw are- overhead.
- Page 126 The Advanced Color Management System ensures that both the objects and the relationships between them are always clearly visible — even when the objects overlap. Objects include: Waveforms, including envelopes and intensified regions Grids Parameter Measurements Cursors Status Information C olor m anagem ent of the background plays an im portant role in bringing out the links and differences between displayed objects.
- Page 127 C oupling m enus are trace-colored, and M ath Setup m enu sources have their own color as well. Selection of the Opaque presentation of overlapping waveform s places one on top of another in norm al, non-transparent layers. You can also select the order in which traces appear (see below).
- Page 128 White Dark Cyan Ocean Spray Fuchsia Cyan Cream Ice Blue Raspberry Yellow Sand Pastel Blue Neon Pink Green Amber Pale Blue Pale Pink Magenta Olive Sky Blue Pink Blue Light Green Royal Blue Vermilion Jade Deep Blue Orange Light Gray Lime Green Navy Cerise...
- Page 129 Analog Persistence provides an analog view of signals while maintaining digital data manipulation flexibility. P ress or use the D IS P LA Y S E T U P “P ersistence” m enu (see page 11–14) to activate the oscilloscope’s persistence functions.
- Page 130 In addition, A nalog P ersistence provides user-definable, post- acquisition saturation control of the m aps, allow ing detail to be easily draw n out of the display. W hen Analog Persistence is selected, each channel and its associated persistence data m ap are assigned a single color (whereas the related C olor G raded persistence function renders the m aps in different colors in the red–to–violet spectrum ).
- Page 131 Press to access the DISPLAY SETUP menus (see page 11–13 ) and to select from “Standard” or “XY” mode and grids Persistence Dot Join “Single” (1), “Dual” (2), “Quad” (4), or “Octal” (8) grids Display and grid intensities “More Display Setup” menus Standard display (m enus on page 11–13) allows presentation of source waveform s versus tim e (or versus frequency for FFT s).
- Page 132 G rid styles, exam ples of w hich are show n on the follow ing pages, offer a variety of w ays to view one or m ore traces in either S tandard or X Y display. A s m any as eight traces and grids can be displayed in S tandard m ode using the “O ctal”...
- Page 133 Standard Display — Dual, Quad Grid L C X X X -O M -E R e v K IS S U E D : D e ce m b e r 1 9 9 9...
- Page 134 Parameter Display — Quad Grid — Full-Screen Mode: trace information normally contained in the trace labels is arranged beneath the grid in Full Screen P ressing expands the grid display to fill the entire screen. P ressing this button again returns the grid to its norm al size.
- Page 135 XY Display grids — XY (left), and XY + Dual (below L C X X X -O M -E R e v K IS S U E D : D e ce m b e r 1 9 9 9...
- Page 136 You can display as m any as eight traces at the sam e tim e w ith their respective trace labels and any com bination of m ath, zoom , and m em ories. W hen “O ctal” is selected from the “S tandard” “G rids” m enu (see next page), eight separate grids are m ade available.
- Page 137 W ith Standard selected, these m enus becom e accessible: T his is for activating Persistence (see next m enu). Its functioning is coupled to the AN ALO G PER SIST button. T his is used to select D ot Join O N — connecting the sam ple points with a line segm ent —...
- Page 138 W ith both Standard and “Persistence” On selected in the first m enu, these m enus appear: T his is for activating Persistence. W hen On, this can be cleared and reset by pressing the C LEAR SW EEPS button or by changing any acquisition condition or waveform processing condition.
-
Page 139: Display Setup
T hese m enus appear when Persistence Setup is selected from D ISPLAY SET U P. Select On to show the last acquired trace. T his is for selecting the persistence duration, in seconds. T he num ber of sweeps accum ulated (up to one m illion) is displayed below the grid. - Page 140 W hen XY is selected in the first m enu, these other m enus appear. T his is for activating Persistence. T his is for accessing X Y SET U P (see next page). T his is for accessing the M O R E D ISPLAY m enus. U se this to select the grid style.
- Page 141 W hen the corresponding m enu button for X Y SET U P is pressed and when “Persistence” is OFF, these m enus appear: U se this to select Analog or Color Graded persistence for a single sw eep . T his is for selecting the percentage of saturation.
- Page 142 W hen XY is selected in the first m enu and Persistence is activated, these m enus appear: U se this to turn Persistence On. T his is for accessing X Y SET U P using Persistence (see next page). T his is for accessing the M O R E D ISPLAY m enus.
- Page 143 T hese m enus appear when you press the corresponding m enu button for “X Y–Persist Setup.” T his is for selecting the persistence duration, in seconds. T he num ber of sweeps accum ulated — up to one m illion — is displayed below the grid.
- Page 144 Press the button alongside the “More Display Setup” menu to gain direct access to these menus. T his is for accessing the Screen Saver controls. W hen enabled, the built-in screen saver will blank the screen 10 m inutes after the last use of a front panel control.
- Page 145 T his is used to turn On the M easure G ate function, w hich highlights the gated param eter region by m ak ing the trace in the region outside the param eter a neutral color. T his is used to show the data (sam ple) points in Normal or Bold view.
- Page 146 T his enables colors to be assigned to displayed objects, and color schem es to be custom ized. T his is for copying one of the six preset color schem es (1 through 6) to a user color schem e (U1 through U4), or one user color schem e to another.
- Page 147 Press to access the primary menus for: Hardcopy settings Time and date settings for the real-time clock GPIB and RS-232-C settings Mass storage utilities (including copy and format and delete files) Special modes of operation (including offset behavior, sequence time-out, cursor units, autocalibration and Remote Control Assistant) Signal function at the CAL BNC connector (magnitude, frequency, shape, trigger out, pass/fail use)
- Page 148 W hen you select “H ardcopy Setup” from U T ILIT IES these m enus appear: U se this to select the output device. T his m enu shows the options installed in the instrum ent. T he device can be a port (G PIB, R S232, or C entronics) to which a printer is connected, a storage unit such as a floppy drive or portable hard disk drive (H D D ), or the internal printer.
- Page 149 U se this to select the device to w hich the instrum ent is to output data: in this case, the optional Int. Printer. T his m enu show s the options installed in the instrum ent. T he device can be a port (G P IB , R S 232, or C entronics) to w hich a printer is connected, a storage unit such as floppy drive or portable hard disk drive (H D D ), or the internal printe r.
- Page 150 W hen you select “T im e D ate Setup” from U T ILIT IES these m enus appear: T his is for changing to D aylight Savings T im e. T his is for changing back to Standard T im e. U se this to activate the changes m ade with the “H our M in Sec”...
- Page 151 When you select “GPIB/RS232 Setup” from UTILITIES, you can use the RS-232-C port on the rear panel for remote operation of the oscilloscope, and for direct interfacing to a hard-copy device to output displayed waveforms and other screen data. See the illustration on the next page for RS-232 printer cabling, and “Data to PC”...
- Page 152 W hen “G P IB /R S 232 S etup” is selected from U T ILIT IE S these m enus appear: T his is for selecting the port for rem ote control. 7–bit 8–bit U se this select m ode R S -232 com m unication.
- Page 153 When you select “Mass Storage Utilities” from UTILITIES, the “MASS STORAGE” menu group appears (see page 12– 10). This menu gives access to the mass storage file system controls. The system supports storage and retrieval of data files to and from memory cards, floppy disks, and removable hard disk drive (HDD) media.
-
Page 154: Default Name
As in M S-D O S, the file nam e can take up to eight characters followed by an extension of three characters. A file is treated as: a panel setup if its extension is PN L a waveform if its extension is a three-digit num ber a waveform tem plate if its extension is T PL a hardcopy if its extension is T IF, BM P, or PR T an H PG L plot file if its extension is PLT... - Page 155 T he default notation for waveform files is Stt.nnn for m anually stored files and Att.nnn for autom atically stored files, the characters S and A representing the two storage m ethods, respectively. W hen autom atically generating a file nam e, the system uses the assigned nam e plus a three-digit sequence num ber.
- Page 156 T he SR AM m em ory card contains a battery for preserving data. W hen this needs replacing, the m essage “BAD BAT T ER Y” appears. T he battery should be changed while the m em ory card is still in the oscilloscope to prevent loss of inform ation.
- Page 157 T hese m enus appear when “Floppy D isk U T ILIT IES” is selected from M ASS ST O R AG E and a floppy has been newly inserted, or there is no floppy in the drive U se this to read the floppy disk and display directory contents. L C X X X -O M -E R e v K IS S U E D : D e ce m b e r 1 9 9 9...
- Page 158 O nce the floppy disk has been read, these m enus appear. T hey display inform ation about the installed storage m edia: last “form at” date and tim e m em ory size and available free space date, tim e, and size inform ation of the selected file on the disk U se this to access a secondary m enu for form atting storage m edia or for copying the m achine tem plate to it.
- Page 159 T hese m enus appear when “T EM PLAT E AN D FO R M AT T IN G ” is selected from FLO PPY U T IL. U se this to form at the floppy in D O S form at with an interleave factor of two, which optim izes throughput to and from the scope.
- Page 160 T hese m enus appear when “M ASS ST O R AG E,” “H ard D isk U T ILIT IES,” and “T EM PLAT E AN D FO R M AT T IN G ” are selected. U se this to quickly (15 seconds) clear the portable hard disk drive. U se this for a com plete form atting of the H D D , which is recom m ended if the disk is non-readable.
- Page 161 T hese m enus appear when “M ASS ST O R AG E,” “M ass Storage Preferences,” are selected and used for: selecting the working directory deleting a directory accessing the “File N am e Preferences” m enu accessing the “Add N ew D irectory” m enu T his is used for selecting the m edium .
- Page 162 T his m enu group appears when “File N am e Preferences” is selected from the preceding m enu, and is used for defining custom nam es for waveform , setup, or hardcopy files. U se this to select the character for m odification. T his is for restoring the file type selected in the “File T ype”...
- Page 163 T his is used to define a new directory with a custom nam e. T his is for creating a new directory. T his is for validating the new directory. U se this to m ove back one space and erase the previous character. T his is for m oving forward to create a space for the insertion of a character.
- Page 164 T hese m enus, which appear when “M ASS ST O R AG E” “File T ransfers” is selected, are used to copy files from one m edium to another. (DEPENDING ON OPTIONS INSTALLED) U se this to select the source (copy from ) and destination (copy to). T his is for selecting the type of file for copying.
- Page 165 When you select “Special Modes” from UTILITIES, these menus become available (not all selections may be available). accesses: T his is for specifying the tim e-out in Sequence m ode, by m eans of the associated m enu knob to change the value. accesses: T his is for specifying the offset behavior of a gain (VO LT S/D IV) change.
- Page 166 U sed for m onitoring rem ote com m ands received through the G P IB and R S -232 rem ote control ports, the R em ote C ontrol A ssistant helps debug com m unications betw een the oscilloscope and the P C .
- Page 167 T his lets you custom ize the operation of front panel controls. W hen this is On, all front panel buttons when pressed and held in will cursor sequentially through all the choices in their respective m enus. W hen On, an audible beep w ill sound w hen you press any front panel button.
- Page 168 T hese m enus allow updating of the oscilloscope with new software. Shown here is the full screen warning m essage displayed when “FLASH U PD AT E” has been selected from “SPEC IAL M O D ES.” T he second m enu is called “U pdate Flash”...
- Page 169 When you select “CAL BNC Setup” from UTILITIES, you can choose the type of signal output at the CAL BNC connector. You can also choose the frequency, amplitude, and pulse shape of the calibration signal. In addition, the C AL BN C connector can be used to provide a pulse: as an action for PASS/FAIL testing at the occurrence of each accepted trigger event (T rigger O ut) when the scope is ready to accept a trigger event (T rigger R dy)
-
Page 170: Blank Page
BLAN K PAG E IS S U E D : D e ce m b e r 1 9 9 9 L C X X X -O M -E R e v K... - Page 171 Press WAVEFORM to store waveforms to internal memory (M1, M2, M3, or M4) in LeCroy’s binary format. You can also store waveforms in binary or ASCII format on floppy disk, memory card, or removable hard disk (HDD) where available. W hen Binary and Flpy (or one of the optional m edia is selected), the m enus show n on this page appear.
- Page 172 T his is for choosing the data form at, as described on the previous page. W hen ASCII is selected, the prim ary “Setup ASC II Form at” m enu appears im m ediately beneath this m enu, giving access to the secondary “ASC II SET U P”...
- Page 173 T his secondary m enu, accessed through SET U P ASC II FO R M AT , offers a choice of ASC II form ats. (For details on each form at, see Appendix E). L C X X X -O M -E R e v K IS S U E D : D e ce m b e r 1 9 9 9...
- Page 174 Press WAVEFORM to recall a waveform from internal memory, floppy, or the optional memory card or removable hard disk (HDD). U se this to select the storage m edium from which to recall, internal Memories in this case. U se this to execute recall based on the selections m ade in the “from M em ory”...
- Page 175 T his selects the device or m edium on which the file is stored: HDD, Card, or Flpy. U se this to execute recall based on the selections m ade in the “File” and “to” m enus (see below). T his selects the file in which the waveform is stored, using the associated m enu knob.
- Page 176 BLAN K PAG E IS S U E D : D e ce m b e r 1 9 9 9 L C X X X -O M -E R e v K...
- Page 177 The cursors are basic and important tools for measuring signal values. In S tandard D isplay M ode, Amplitude (voltage) cursors, represented by dashed lines spanning the w idth of the screen, m ove up and dow n the grid pixel by pixel . Time cursors, represented by arrow s or cross-hair m ark ers that m ove along the w aveform (see sym bols at left), can be placed at a desired tim e to read the am plitude of a signal at that tim e, and...
- Page 178 In X Y D isplay, Absolute Am plitude cursors appear as horizontal and vertical bars that can be m oved up and down and side-to-side across the screen. R elative Am plitude cursors are pairs of bars that m ove in the sam e way.
- Page 179 Press to access menus that let you customize special functions. The contents of the Custom Menu will vary according to the options installed in the oscilloscope. Press the C U R SO R /M EASU R ES button; the following options will be displayed: R efer to “M easure –...
- Page 180 (continued) Press the CUSTOM button to access these custom applications: T his w izard steps you through jitter tim ing and m easurem ent setups. R efer to the Jitter and T im ing A nalysis (JT A ) M anual. R e fer to the M ask T ester O perator’s M anual .
- Page 181 Press — to access the “M EASU R E” Setup m enus. U se this to select Cursors. T his is for selecting Time (tim e or frequency cursors) or Amplitude (voltage or am plitude cursors). U se this to toggle between Relative and Absolute. T he first displays two cursors (R eference and D ifference) and indicates either the voltage, or tim e and voltage, between the two.
- Page 182 The instrument can determine certain signal properties automatically, using signal parameters. Standard parameters are listed and described in Appendix D of this manual. For com m on m easurem ents on a lone signal, param eters can be m easured in either of two standard classes or m odes, in the am plitude or tim e dom ain.
- Page 183 The parameter has been determined for several periods (up to 100), and the average of those values has been taken. The parameter has been determined over an integral number of periods. The parameter has been calculated on a histogram. Insufficient data to determine the parameter. Amplitude histogram is flat within statistical fluctuations;...
- Page 184 For a single trace, this m ode m easures: peak-to-peak (am plitude between m axim um and m inim um sam ple values) m ean of all sam ple values standard deviation root m ean square of all sam ple values am plitude of the signal Use this to select Parameters.
- Page 185 For a single trace, this m ode m easures: period width (at 50% am plitude) rise tim e (10–90% of am plitude) fall tim e (90–10% of am plitude) delay (from trigger to first 50% am plitude point) U se this to select Parameters. T his is for selecting the Standard Time m ode.
- Page 186 In this m ode, up to five param eters can be displayed for various traces. T his is for selecting Parameters. T his is for selecting the Custom m ode. T his is for turning On display of the param eter’s average, lowest, highest, and standard deviation, as well as the num ber of sweeps included in the statistics.
- Page 187 T his is for m odifying param eters. U se this to select up to five different param eters for m odification. U se this to specify the category of param eter. W hen All is selected, the “m easure” m enu (see below) will feature all param eters. H owever, when a particular category is selected, only those param eters in the category are shown.
- Page 188 Param eters can be custom ized to m eet specific needs. U se this to select up to five different param eters for m odification. U se this to specify the category or type of param eter. Δ T his calls up the Δt@lv custom ization m enu (see next page). Set at Δt@lv.
- Page 189 This is for customizing the measure parameter (Δt@lv in this case). See Appendix D for descriptions of all standard parameters. T his is for selecting whether the levels should be absolute, or a percentage of the peak-to-peak signal value. U se this to set the hysteresis division. A voltage band is extended equidistantly above and below the selected level.
- Page 190 This is for customizing the measure parameter (Δc2d+ in this case). See Appendix D for descriptions of all standard parameters. U se this to set the hysteresis division. A voltage band is extended equidistantly above and below the selected level. In order for the signal to be considered valid, and not as noise, the signal m ust exceed or cross the upper or lower lim its of this band by half the hysteresis division setting.
- Page 191 Parameters can also be used in performing Pass/Fail tests. These tests require a combination of measurements within chosen limits, and invoke an action when the test either passes or fails, depending on which has been specified. Signals can also be Pass/Fail tested against a tolerance mask.
- Page 192 U se this to select Parameters. U se this to select Pass or Fail. T his is for turning testing Off or On. T urn testing off only to observe the param eter variations. U se this to access the secondary “C H AN G E T EST ” m enu (see next page).
- Page 193 U se this to select up to five different param eters for m odification. (See “Action” selection on page 14–22). U se this to select Param or, if no test is required, --- (No Test). T o select “Param”. U se this to delete all tests previously selected. T his is for selecting the new param eter to be m easured on this line.
- Page 194 U se this to select up to five different param eters for m odification. (See “Action” selection on page 14–22). U se this to Select Param or --- (No Test) if no test is required on the selected line (“M ask” selection, page 14–19). U se this to select Limit (“Param ”...
- Page 195 U se this to select up to five different param eters for m odification. (See “Action” selection on page 14–22). T his is for selecting Mask or --- (No Test) if no test is required on the selected line (see “Param ” on page 14–17). U se this to access the secondary m enu for m odifying m ask settings.
- Page 196 U se this to select W’form. T his is for selecting D=M4 if the m ask is to be autom atically displayed on the screen. O therwise select M1, M2, M3, or M4. U sing “R EC ALL W ’FO R M ” (see previous chapter), m em ories M 1– M 4 can be recalled to traces A to D for display.
- Page 197 U se this to select the device. T his is for selecting D=M4 to autom atically display the m ask on- screen, or M1, M2, M3, or M4. T his is for generating an inverted m ask. U se this to recall the m ask. U se this to select the appropriate m ask, by m eans of the associated knob.
- Page 198 D epending on the test result certain actions can be taken: T his is for selecting Action. U se this to delete all previously selected actions. U se this to determ ine if the action will be taken on PASS or FAIL result.
- Page 199 Press to access the menus used for saving or recalling configurations — panel setups — to or from non- volatile memory, floppy disk, memory card, or portable hard disk (HDD), depending on options installed. U se this to save a panel setup or recall one already saved. W hen you select Save (as show n here) the “T O S E T U P ”...
- Page 200 U se this to save or recall a panel setup. W hen you select Save (as show n on the previous page) the “T O S E T U P ” m enus appear. W hen you select Recall (as show n here) the “F R O M S E T U P ”...
- Page 201 T his is for selecting the device from w hich to recall a setup: floppy, m em ory card, or portable hard disk (H D D ), depending on the options installed. U se this to perform the recall of the setup selected in the “F ile” m enu (see below ).
- Page 202 B LA N K P A G E IS S U E D : D e ce m b e r 1 9 9 9 L C X X X -O M -E R e v K...
- Page 203 Press to open the “STATUS” menu and access full- screen summaries of the oscilloscope’s system status or other functional status. T his screen show s vertical sensitivity, probe attenuation, offset, and coupling for each channel, as w ell as tim ebase and trigger status sum m aries.
- Page 204 T his screen show s the serial num ber of the scope, firm w are version, and the softw are and hardw are options installed. T he “S oftw are O ptions” m enu accesses the “A D D O P T IO N K E Y ” m enu, w hich lets you activate new softw are by inputting a code.
- Page 205 T his show s user text in the w aveform descriptor* and trigger tim ing inform ation. W hen “T ext & T im es” is selected the “for” and “S elect” m enus show n here also appear, allow ing a trace or m em ory to be selected and a segm ent range to be specified for inform ation.
- Page 206 T his screen provides detailed status inform ation on channels, m em ories, zoom and m ath, or displayed traces. T hese are specified using the bottom m enu, which appears when “W aveform ” is selected from the top m enu. IS S U E D : D e ce m b e r 1 9 9 9 L C X X X -O M -E R e v K...
- Page 207 T his screen shows how m uch m em ory is being used and how m uch rem ains free. M em ory allocation: m em ories M 1–M 4 can be selected and then cleared using the “C LEAR IN AC T IVE” m enu. T he dedicated persistence data...
-
Page 208: Blank Page
BLAN K PAG E IS S U E D : D e ce m b e r 1 9 9 9 L C X X X -O M -E R e v K... - Page 209 LC574 Series: 2 m s @ 4 G S /s in single-shot m ode specification applies to LC564 Series: 62.5 µs @ 4 G S /s all LeCroy color DSOs. LC584 Series: 2 m s @ 8 G S /s Where the series is...
-
Page 210: Offset Range
Offset Range LC334 Series: 2.00 to 9.99 m V /div: ±120 m V 10.0 to 199 m V /div: ±1.2 V 0.2 to 5.0 V /div: ±24 V LC374, LC534, LC574, LC564, LC584 Series: 2.00 to 4.99 m V /div: ±400 m V 5.00 to 99 m V /div: ±1 V 0.1 to 0.99 V /div: ±10 V 1.0 to 10 V /div: ±100 V (1 M Ω... - Page 211 EMORY PER HANNEL OINTS HANNELS AMPLE CTIVE MODEL ON/OFF) ETECT HANNELS … ERIES Any Channel (Peak Detect OFF) LC334 LC534 Series 500 MS/s 100 k 500 k LC374 Series 1 GS/s 100 k – – LC574 Series 1 GS/s 100 k 500 k Any Channel (Peak Detect ON) LC334...
- Page 212 EMORY PER HANNEL OINTS HANNELS AMPLE MODEL CTIVE HANNELS … ERIES Any Channel LC564 Series 2 GS/s 100 k – – – LC584 Series 2 GS/s 100 k 500 k Paired Channels LC564 Series 4 GS/s 250 k – – –...
- Page 213 HANNELS EMORY PER HANNEL OINTS CTIVE AMPLE HANNELS ODEL Any Channel LC684 Series 2 GS/s 100 k 500 k Paired Channels LC684 Series 4 GS/s 250 k CH2 & CH3 All Channels Combined LC684 Series 8 GS/s 500 k 16 M (by PP096 Adapter) L X X X -O M -E R e v K...
-
Page 214: Input Impedance
Scale Factors: T here is a wide range of probe attenuation factors available. DC Accuracy: ±1% typical; guaranteed ≤ ±2% full scale (eight divisions) at 0 V offset LC564, LC584 Series: ±(1% full scale + 1% offset value) at gain ≥10 m V /div LC684 Series: ±(2% full scale + 1% offset value) at gain ≥10 m V /div Vertical Resolution: 8 bits... - Page 215 System Random Access Memory: LC334A LC374A LC534A LC574A LC334AM LC534AM LC564A LC574AM LC334AL LC534AL LC564A LC584A LC584AM LC684D LC684DM LC574AL LC584AL LC584AXL LC684DL LC684DXL Random Interleaved Sampling (RIS): for repetitive signals from : LC334, LC534 Series: 1 ns/div to 5 µ s/div LC374, LC574 Series: 1 ns/div to 2 µ...
- Page 216 Number of Segments Available: L C 3 3 4 A L C 3 7 4 A L C 5 3 4 A L C 5 7 4 A 2 t o 5 0 0 L C 5 6 4 A L C 5 8 4 A L C 6 8 4 D 2 t o 1 0 0 0...
- Page 217 Modes: N O R M A L, A U T O , S IN G LE , and S T O P . Sources: C H 1, C H 2, C H 3, C H 4, Line, Ext, Ext/10 (Ext/5 on LC564, ).
- Page 218 Pattern: T he oscilloscope triggers on the logic com bination of five inputs — C H 1, C H 2, C H 3, C H 4, and E X T T rigger, w here each source can be defined as “H igh,” “Low ,” or “D on't C are.” T he T rigger can be defined as the beginning or end of the specified pattern.
- Page 219 LC334: O ne PP005 probe is supplied per channel: D C to 350 M H z typical at probe tip, 500 V m ax. LC374, LC534, LC574A, LC564, LC584, LC684 Series: O ne PP005 probe is supplied per channel: D C to 500 M H z typical at probe tip, 500 V m ax.
- Page 220 Screen Type: C olor 10-inch R aster S can C R T , 0.26 m m dot pitch. LC684 Series: 10.4” T F T -LC D Resolution: 640 x 480 points Display Area: 170 m m x 125 m m LC684 Series: 212 m m X 160 m m Controls: T here are rear panel presets for position, brightness, and contrast;...
- Page 221 Microprocessor: 96 M Hz PowerPC™ 603e LC584AXL, LC684DXL: 192 M H z PowerPC ™ Video Memory: 1 M byte Cache Memory: 32 k bytes Persistence Data Map Memory: 16 bits per displayed pixel (64 000 levels) four processing functions m ay perform ed sim ultaneously.
- Page 222 Waveform Memory: T his features up to four 16-bit m em ories (M 1, M 2, M 3, M 4), w hose length corresponds to the length of the channel acquisition m em ory. Zoom and Math Memory: U p to four 16-bit W aveform P rocessing M em ories (A , B , C , D ), w hose length corresponds to the length of the channel acquisition m em ory Setup Memory: F our non-volatile m em ories (optional m em ory...
- Page 223 Remote Control: G P IB and R S -232-C for all front panel controls; internal functions RS-232-C Port: A synchronous; 115.2 k B aud for com puter or term inal control, printer or plotter connection GPIB Port: (IE E E -488.1) configurable as talk er/listener for com puter control and fast data transfer;...
- Page 224 Power: 90 to 132 V A C , or 180 to 250 V A C , 45 to 66 H z, autom atic voltage selection, 400 W m ax. (LC684 Series: 350 W m ax.) Battery Backup: front panel settings m aintained for tw o years Dimensions: (H W D ) 10.4 x 15.65 x 17.85 inches (264 x 397 x 453 m m ) Weight: 44 lb.
- Page 225 The available sampling rate of LeCroy oscilloscopes is often higher than that required for the analyzed signal’s bandwidth. Oversampling, particularly pronounced in the long-memory models, can be used to increase the displayed trace’s effective resolution: the ability of the instrument to distinguish closely spaced voltage levels.
- Page 226 Resolution Increase –3 dB Bandwidth Filter Length (Enhancement) (× Nyquist) (Samples) 0.241 0.121 0.058 0.029 0.016 W ith low -pass filters, the actual S N R increase obtained in any particular situation depends on the pow er spectral density of the noise on the signal.
- Page 227 w ould be incorrect. T his is because in som e circum stances an overflow m ay be a spik e of only one or tw o sam ples, and the energy in this spik e m ay not be enough to significantly affect the results.
- Page 228 T his screen shows the spectrum of a square signal before (top grid) and after (bottom grid) enhanced resolution processing. T he result clearly illustrates how the filter rejects high-frequency com ponents from the signal. T he higher the bit enhancem ent, the lower the resulting bandwidth.
- Page 229 In this exam ple the bottom trace has been significantly enhanced by a 3-bit enhanced resolution function. The original signal being highly oversampled, the resulting bandwidth is still high enough for the signal not to be distorted. L C X X X -O M -E R e v K IS S U E D : D e ce m b e r 1 9 9 9...
- Page 230 T his illustration shows the effect of enhanced resolution on a noisy signal. T he original trace (top grid) has been processed by a 2-bit enhanced resolution filter. T he result (bottom grid) shows a “sm ooth” trace, where m ost of the noise has been elim inated. IS S U E D : D e ce m b e r 1 9 9 9 L C X X X -O M -E R e v K...
- Page 231 The enhanced resolution function can only improve the resolution of a trace; it cannot improve the accuracy or linearity of the original quantization by the 8-bit ADC. The constraint of good temporal response excludes the use of maximally flat filters. The pass band will therefore cause signal attenuation for signals near the cut-off frequency.
-
Page 232: Blank Page
BLAN K PAG E IS S U E D : D e ce m b e r 1 9 9 9 L C X X X -O M -E R e v K... - Page 233 The WP02 Spectral Analysis package with FFT (Fast Fourier Transform) reveals signal characteristics not visible in the time domain, and adds the power of frequency domain analysis to your oscilloscope. FFT converts a time domain waveform into frequency domain spectra similar to those of a spectrum analyzer, but with important differences and added benefits.
- Page 234 F igure C –1 show s spectra of a sw ept triangular w ave. D iscontinuities at the edges of the w ave produce leak age, an effect clearly visible in T race A , w hich w as com puted w ith a rectangular w indow , but less pronounced in the V on H ann w indow in T race B (see below for explanations of leak age and w indow types).
- Page 235 Figure C–2 A n F F T operation on an N -point tim e dom ain signal m ay thus be com pared to passing the signal through a com b filter consisting of a bank of N /2 filters. A ll the filters have the sam e shape and w idth and are centered at N /2 discrete frequencies.
- Page 236 of choice for signals containing isolated peak s — periodic signals, for instance. T he pow er density spectrum (V /H z) is the pow er spectrum divided by the equivalent noise bandw idth of the filter in H z associated w ith the F F T calculation.
- Page 237 If a signal contains a frequency com ponent above N yquist, the spectrum w ill be aliased, m eaning that the frequencies w ill be folded back and spurious. S potting aliased frequencies is often difficult, as the aliases m ay ride on top of real harm onics. A sim ple w ay of check ing is to m odify the sam ple rate and observe w hether the frequency distribution changes.
- Page 238 R ectangular w indow s provide the highest frequency resolution and are thus useful for estim ating the type of harm onics present in the signal. B ecause the rectangular w indow decays as a sinx/x function in the spectral dom ain, slight attenuation w ill be induced. A lternative functions w ith less attenuation —...
- Page 239 S pectral pow er averaging is the technique to use w hen you are determ ining the frequency response of passive netw ork s such as filters. F igures 3 and 4 show the transfer functions of a low pass filter w ith a 3-dB cutoff of 11 M H z, obtained by exciting the filter w ith a w hite noise source (F ig.
- Page 240 Figure C–4 B ecause of its versatility, F F T analysis has becom e a popular analysis tool. H ow ever, som e care m ust be tak en w ith it. In m ost instances, incorrect positioning of the signal w ithin the display grid w ill significantly alter the spectrum .
- Page 241 Select “FFT” from the “Math Type” menu (see Chapter 10 for a full description of math and waveform processing menus). Spectra displayed with a linear frequency axis running from zero to the Nyquist frequency are shown at the right-hand edge of the trace. The frequency scale factors (Hz/div) are in a 1–2–5 sequence.
- Page 242 T he follow ing selections can be m ade using the “F F T result” m enu. T his is m easured w ith respect to a cosine w hose m axim um occurs at the left-hand edge of the screen, at w hich point it has 0°.
-
Page 243: Blackman-Harris
C hosen using the “with window” m enu, the window type defines the bandwidth and shape of the filter to be used in the FFT processing (see the table on page C –17 for these filters’ param eters). W hen “A C ”... - Page 244 O ther w aveform processing functions, such as A veraging and A rithm etic, can be applied to w aveform s before F F T processing is perform ed. T im e-dom ain averaging prior to F F T , for exam ple, can be used if a stable trigger is available to reduce random noise in the signal.
- Page 245 O ne of these F F T -related error m essages m ay be displayed at the top of the screen. Message Meaning “Incompatible input record type” F F T pow er average is defined only on a function defined a s F F T .
- Page 246 A summary of the algorithms used in the oscilloscope’s FFT computation is given here in the form of seven steps: 1. If the m axim um num ber of points is sm aller than the source num ber of points, the source w aveform data are decim ated prior to the F F T .
- Page 247 T he energy of the signal at a frequency n is distributed equally betw een the first and the second halves of the spectrum ; the energy at frequency 0 is com pletely contained in the 0 term . T he first half of the spectrum (R e, Im ), from 0 to the N yquist frequency is k ept for further processing and doubled in am plitude: R ’...
- Page 248 W here M is the m inim um m agnitude, fixed at about 0.001 of m in the full scale at any gain setting, below w hich the angle is not w ell defined. T he dB m P ow er S pectrum : ⎛...
- Page 249 This section defines the terms frequently used in FFT spectrum analysis and relates them to the oscilloscope. If the input signal to a sam pling acquisition system contains com ponents w hose frequency is greater than the N yquist frequency (half the sam pling frequency), there w ill be less than tw o sam ples per signal period.
- Page 250 E quivalent N oise B andW idth (E N B W ) is the bandw idth of a rectangular filter (sam e gain at the center frequency), equivalent to a filter associated w ith each frequency bin, w hich w ould collect the sam e pow er from a w hite noise signal.
- Page 251 In a sim ple sense, the frequency resolution is equal to the bin w idth Δf. T hat is, if the input signal changes its frequency by Δf, the corresponding spectrum peak w ill be displaced by Δf. F or sm aller changes of frequency, only the shape of the peak w ill change.
- Page 252 discrete bin frequencies. T his variation of the spectrum m agnitude is called the picket fence effect (the loss is called the scallop loss). A ll w indow functions com pensate for this loss to som e extent, but the best com pensation is obtained w ith the F lat T op w indow . T he pow er spectrum (V ) is the square of the m agnitude spectrum .
- Page 253 T he follow ing table lists the coefficients a . T he w indow functions seen in the tim e dom ain are sym m etric around the point k = N /2. Window Type Rectangular 1 .0 0 .0 0 .0 von Hann 0 .5...
- Page 254 B LA N K P A G E IS S U E D : D e ce m b e r 1 9 9 9 L C X X X -O M -E R e v K...
- Page 255 In this Appendix, a general explanation of how the instrument’s standard parameters are computed is followed by a table that defines and describes those parameters (page D–5). Proper determ ination of the top and base reference lines is fundam ental for ensuring correct param eter calculations. T he analysis begins by com puting a histogram of the waveform data over the tim e interval spanned by the left and right tim e cursors.
- Page 256 O nce top and base are estim ated, calculation of the rise and fall tim es is easily done (F ig.1). T he 90% and 10% threshold levels are autom atically determ ined by the oscilloscope, using the am plitude ( am pl ) param eter. T hreshold levels for rise or fall tim e can also be selected using absolute or relative settings ( r@ level, f@ level ).
- Page 257 delay width width width 50 % (Mesial) last first PERIOD PERIOD freq = 1/ period duty width/period TWO FULL PERIODS: cycles cmean, cmedian, crms, csdev TRIGGER computed on interval periods POINT area, points, data computed between cursors RIGHT CURSOR LEFT CURSOR Figure D–2 T o avoid these bias effects, the instrum ent uses cyclic param eters, including crm s and cm ean , that restrict the...
-
Page 258: Trigger Point
N o isy sp ike s ign o re d d u e to H ystere sis ba n d THRESHOLD DATA (1) CLK (2) c2d (1, 2) Δ − Δ c2d+(1, 2) LEFT CURSOR RIGHT CURSOR TRIGGER POINT C L O C K E D G E = P ositive Tra nsitio n D ATA E D G E = N e g ative Tran sitio n Figure D–3 M oreover, a hysteresis range m ay be specified to ignore any... - Page 259 a m p l to p b a se O n sig n a ls h a vin g tw o A m p litu d e : M e a su re s th e d iffe re n ce N O T b e tw e e n th e u p p e r a n d lo w e r le ve ls in m a jo r le ve ls (su ch a s tria n g le...
- Page 260 c s d e v W here: v C yclic sta n d a rd d e via tio n : S ta n d a rd denotes m easured ∑ m ean − d e via tio n o f d a ta va lu e s fro m th e m e a n sam ple values, and num ber va lu e o ve r a n in te g ra l n u m b e r o f p e rio d s.
- Page 261 F o r sin g le sw e e p w a ve fo rm s, d u r is 0 . F o r Tim e fro m first to se q u e n ce w a ve fo rm s: tim e fro m first to la st a cq u isitio n la st se g m e n t’s trig g e r.
- Page 262 first Indicates location of left cursor. In d ica te s th e va lu e o f th e h o rizo n ta l a xis H o rizo n ta l a xis a t th e le ft cu rso r. va lu e a t le ft Cursors are interchangeable: for cu rso r...
- Page 263 median Th e a ve ra g e o f b a se a n d to p va lu e s. A ve ra g e o f b a se a n d to p (S e e F ig . D – 2 ) minimum M e a su re s th e lo w e st p o in t in a w a ve fo rm .
- Page 264 r20–80% O n sig n a ls h a vin g tw o R ise 2 0 % to 8 0 % : Th e d u ra tio n o f th e Average duration N O T p u lse w a ve fo rm ’s risin g tra n sitio n fro m of rising 20–80 % m a jo r le ve ls (tria n g le o r sa w - 2 0 % to 8 0 % , a ve ra g e d fo r a ll risin g...
- Page 265 R o o t M e a n S q u a re o f d a ta b e tw e e n th e W here: v denotes measured sample cu rso rs — a b o u t th e sa m e a s sd e v fo r a ∑...
- Page 266 BLAN K PAG E IS S U E D : D e ce m b e r 1 9 9 9 L C X X X -O M -E R e v K...
- Page 267 The ASCII waveform storage feature allows waveforms to be saved to a mass-memory device in any of three ASCII formats: Spreadsheet, MathCad, and MATLAB. Each format is tailored for a commonly used analysis package. The user- interface changes that support ASCII waveform storage are found in the STORE menu (see Chapter 13).
- Page 268 This example was created using Microsoft Excel for Windows. A waveform stored in Spreadsheet format may be read into Microsoft Excel using the File -> Open window: Excel will now ask for m ore inform ation about the file type. Ensure that the ‘D elim ited’...
- Page 269 T he next step allows the specific delim iter to be specified. T he Spreadsheet form at generated by the instrum ent uses a com m a (,) to delim it colum ns. Ensure that this is selected. L C X X X -O M -E R e v K IS S U E D : D e ce m b e r 1 9 9 9...
- Page 270 T he third and final step allow s the form at of the colum ns to be specified. T he ‘general’ form at for each colum n should be used (this is the default). IS S U E D : D e ce m b e r 1 9 9 9 L C X X X -O M -E R e v K...
- Page 271 After you click the Finish button, a display sim ilar to that following should appear. L C X X X -O M -E R e v K IS S U E D : D e ce m b e r 1 9 9 9...
- Page 272 IS S U E D : D e ce m b e r 1 9 9 9 L C X X X -O M -E R e v K...
- Page 273 Plotting the data from a waveform requires the use of a scatter plot based on the data in the first two colum ns, with the first colum n used as the X values (from R ow 6 in this exam ple). L C X X X -O M -E R e v K IS S U E D : D e ce m b e r 1 9 9 9...
- Page 274 T he header created for the Spreadsheet form at contains all the inform ation required to extract various elem ents of a sequence waveform . T he following form ulas m ay be used to extract inform ation such as the start and end row of the data for a given segm ent, or the trigger tim e of a given segm ent.
- Page 275 These examples were created using MathSoft’s MathCad for Windows. On this page, the procedure for reading and graphing a file for a single segment is shown. The example on page E–10 is for multiple segments. This single-segm ent exam ple is valid for M athCad Versions 3.1 to 7: L C X X X -O M -E R e v K IS S U E D : D e ce m b e r 1 9 9 9...
- Page 276 T he following M athC ad exam ple dem onstrates how to extract data from a given segm ent. T he data used for this exam ple consisted of two segm ents of three sam ples each, allowing the entire im ported m atrix to be shown.
- Page 277 T his exam ple was created using M athW orks’ M AT LAB Version 4.2c.1 for W indows. R eading and graphing a waveform in M AT LAB m ay be achieved with two sim ple com m ands, as the following exam ple shows. T he first com m and loads the file into a m atrix which is autom atically nam ed after the file.
- Page 278 Format Fields in bold type are constants that are present in the output file, as shown. Fields in italic are variables that are filled in when the file is written. <scopeid>, <scopeserial> Segments, < num seg>, SegmentSize, < num pts> Segment, TrigTime, TimeSinceFirstSegment...
- Page 279 This format is compatible with the ASCII import of the LeCroy LW4xx Arbitrary Function Generator. L C X X X -O M -E R e v K IS S U E D : D e ce m b e r 1 9 9 9...
- Page 280 Format <“scopeid”> <“T riggerT im e”> <num seg> <num pts> Segment TimeSinceFirstSegment <num seg> < trigdelta( num seg )> Time Ampl Ampl1 <x(0)> <y(0)> [<y1(0)>] <x(1)> <y(1)> [<y1(1)>] <x(num gseg*num pts)> <y(num seg*num pts)> [<y1(num seg*num pts)>] Single-Segment Example “LECROYLC584AL,LC58412345” “23-March-90,12:44:23”...
- Page 281 Multi-Segment Example “LECROYLC584AL,LC58412345” “23-March-90,12:44:23” Segment TimeSinceFirstSegment Time Ampl ..1.05 2.05 The format created for MathCad is very similar to the Spreadsheet format, but with some differences due to the way MathCad interprets the header information. One of the most important of these is that the absolute trigger time is only given for the first segment, with relative times (in units of seconds) included for each segment.
- Page 282 Format y(0) y(1) y(num seg*num pts) Single-Segm ent Exam ple The MATLAB format is simple, without header information and having amplitude values only. Multiple segments will be appended without a separator. Only one value from the pair of amplitude values present in a dual-array will be stored.
- Page 283 Auto-Store, 12-9, 13-2 Average, A-9 Average Setup, 10-10 Averaging, B-3 AC, 3-2, 8-5, C-15 Acquisition Mem ory, C-4 in cre a sin g it b y co m b in in g ch a n n e ls, 2 -1 , 7 -5 Acquisition Modes, 6-1, 7-6, A-4 Background, 11-2, 11-21, 12-2 Acquisition Sum m ary, 5-3, 6-3,...
- Page 284 Chassis Term inal, 3-2 COPY TEMPLATE TO FLPY, Circuit Failures 12-13 te stin g fo r u sin g E xclu sio n Copying Color Schem es, 11-22 Trig g e r, 8 -1 1 Copying files between storage Cleaning and Maintenance, 3-3 m edia, 12-10 CLEAR INACTIVE m enu, 16-5 Coupling, 5-3, 8-5, 8-36, 8-38,...
- Page 285 DC Accuracy, A-3 DO RECALL, 13-4, 13-5, 14-21, DC Level, 12-23 15-3 DC Offset DO STO RE, 13-2 DO S. See UTILITIES:Mass co m p e n sa tin g fo r, 1 0 -1 5 Deadtim e Storage re d u cin g it u sin g S e q u e n ce Dot Join, A-8 M o d e , 7 -3 Dropout Trigger, 8-28, 8-42, A-6...
- Page 286 External Clock, 7-8, 7-9, A-5 13-1, 13-2, 13-5, 14-21, 15-1, External R eference, A-5 15-2, A-11 Extrem a, 10-3, 10-12, 11-3, A-9 FLPY UTIL, 12-12 for Math use m ax points m enu, 10-19, C-9 form at, 12-2 Form at, 12-3 Fall, D-2 FORMAT FLPY, 12-13 Fall 80–20 % , D-7...
- Page 287 Grid Color, 11-21 Grid intensity, 11-13 Landscape, 12-3 Grids, 11-7, 11-8, 11-9, 11-11, Last, D-8 11-13, 11-14, 11-16, 11-18, A-8 Ground, 3-2, 3-3 Leading Edge, D-2 Ground and Trace Level m arkers, Leakage, C-5, C-11, C-19 Level, 14-13 LEVEL, 6-4, 8-1 level m enu, 14-13 LIN E, 8-4 LOAD CHANGES NOW , 12-4...
- Page 288 Measurem ent Gate Highlighting, Noise Reduction, 10-3, B-2, B-6 11-4, 11-21 NORM, 6-2, 7-11, 10-3 Median, D-9 Num ber of points, 7-6, C-14, C-19 M edium -to-H igh-Frequency Nyquist Frequency, 10-19, 10-20, Triggering, 8-5 B-2, C-4, C-5, C-9, C-12, C-19 Mem ories, 2-1, 13-1, 13-4, 13-5, 15-1, 15-2, A-10 Mem ory, A-2, A-3, A-9, C-4, C-12...
- Page 289 Param eter Display, 11-10 Power Density Spectrum , C-4, Param eter sym bols, 14-6, 14-7 C-20 Param eters, 10-3, 14-6, 14-8, Power On 14-9, 14-10, 14-11, 14-12, S e lf-Te st, 3 -3 14-13, 14-14, 14-15, 14-16, Power Requirem ents 3-2 14-17, 14-18, 14-19, 14-20, Power Spectrum , 10-13, C-4, 14-22, A-10, D-1, D-5, D-6,...
- Page 290 Real-Tim e Display S TO P , 6 -1 S e e R o ll M o d e , 7 -3 Roof, 10-12 RECALL W ’FORM, 4-5, 13-4, in e xtre m a w a ve fo rm s, 1 0 -3 13-5 Root Mean Square (rm s), 14-8, Recall/Save, 15-1...
- Page 291 Segm ents, 6-1, 6-2, 7-3, 7-8, 7-9, SNG L, 6-2 7-10, 10-3, E-8, E-10 Software version inform ation, 16-2 SELEC T ABC D , 9-1 Source Trace, 10-7 SELECT CHANNEL, 5-1 Sources, A-5 Self-Test, 3-3 Special Modes, 7-11, 12-1, 12-19 Sensitivity, A-1 Spectral Analysis, 10-18, B-2, Sequence, 7-10...
- Page 292 Tim e, 8-21, 8-23 Trigger Com parator, A-6 in d isp la y, 1 1 -7 Trigger Configuration field, 4-9 Trig g e r H o ld -o ff b y, 8 -3 4 Trigger Controls, 8-1 Tim e and Frequency field, 4-9 Trigger Coupling, 8-4, 8-34, 8-36, Tim e at Level, D-11 8-38, 8-45, 8-46...
- Page 293 F ile Tra n sfe rs, 1 2 -1 0 W idth, 8-36, 8-37, 8-46, D-11 F lo p p y D isk, 1 2 -7 , 1 2 -1 2 , W indow Pattern Trigger, 8-19 1 2 -1 3 W indow Trigger, 8-8 G P IB p o rt, 1 2 -5 with, 8-45, 8-46...
- Page 294 8 544 107 00 France: LeCroy Sarl, Switzerland: LeCroy SA 1 69 18 83 20 North: 62 885 8050 Germany: LeCroy Europe G m bH, W est: 22 719 2228 Taiwan: Lecoln Tech. Co. 6221 82700 Greece: IFIPCO , 1 67 25 970 2 232 6368 Thailand: M easuretronix Ltd.
Need help?
Do you have a question about the LC Series and is the answer not in the manual?
Questions and answers