Advertisement
Quick Links
Advertisement

Related Manuals for Honeywell ACM 150 (Gen2)


Summary of Contents for Honeywell ACM 150 (Gen2)
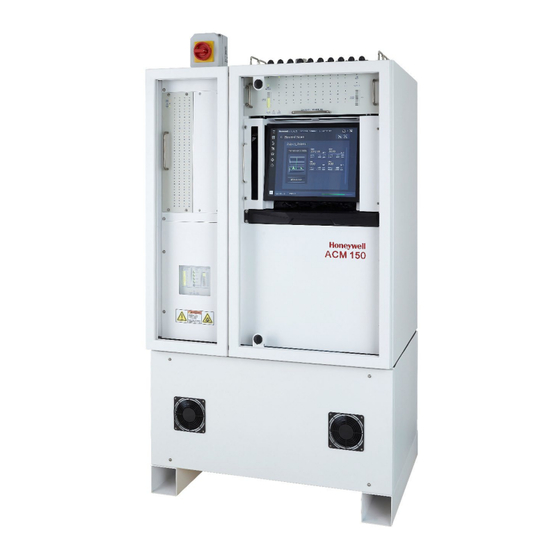
- Page 1 ACM 150 (Gen2) Air Composition Monitor...
- Page 2 Table of Contents Introduction 1.1. Contacts 1.2. ACM 150 standard warranty Safety 2.1. Safe and proper operation of the ACM 150monitor 2.2. End user responsibilities 2.3. Safety notices and terms 2.4. Danger/Warning/Caution/Note 2.5. Levels of ACM 150 user 2.5.1. All users 2.5.2.
- Page 3 ACM 150 3.2.3. Sample valve manifolds 3.2.4. Sample valve control panel 3.2.5. Control panel status 3.2.6. Cycle valves 3.2.7. Cycle valve control panel 3.2.8. Pump assemblies 3.2.9. FTIR bench & gas cells 3.2.10. Touchscreen computer assembly 3.2.11. Relay outputs 3.2.12. Relay output control panel 3.3.
- Page 4 ACM 150 4.4. Available outputs 4.5. Data interface and protocol Installation 5.1. Receipt and unpacking 5.2. Electrical power 5.2.1. Line power, 120 / 240 Volts AC 5.2.2. Emergency Power-Off (EPO) option 5.2.3. Lockout/Tagout (LOTO) disconnect 5.2.4. International line power 5.2.5. Isolation transformer 5.2.6.
- Page 5 ACM 150 6.2.2. Remote computer access 6.3. Status and scan results 6.3.1. Area scanning 6.3.2. Background 6.3.3. Status bar 6.3.4. Overview and Recent scan results 6.4. Changing the mode of operation 6.5. Alarm 1/Alarm 2 incidents and actions 6.5.1. Alarm 1/Alarm 2 Event log 6.5.2.
- Page 6 ACM 150 7.6.2. Configuration key 7.6.3. Reviewing and changing the order of scan 7.6.4. Composite Points 7.7. Settings – Method Manager 7.8. Settings – Relay Configuration 7.8.1. Reviewing the programmable relays 7.8.2. Selecting the relay program 7.9. Settings - Import/Export Configuration Shutdown Procedure 8.1.
- Page 7 ACM 150 10.2. Diagnostics Menu 10.2.1. Background Scan 10.2.2. View cycle 10.2.3. View Spectrum 10.2.4. Hardware Service 10.2.5. Software Service 10.3. Service Inspections and Procedures 10.3.1. Preparation for Servicing 10.3.2. Servicing the filters 10.3.3. Servicing the pumps 10.3.4. Servicing the valves 10.3.5.
- Page 8 ACM 150 12.3. Appendix C MODBUS register map 12.4. Appendix D Gas list 12.5. Appendix E Technical Specifications 12.6. Appendix F MSDS 12.6.1. Appendix F-1 KBr MSDS 12.6.2. Appendix F-2 MSDS 12.7. Appendix G Glossary 12.7.1. Access Codes 12.7.2. 12.7.3. 12.7.4.
- Page 9 ACM 150 Figure 17. Typical Relay Layout ........................31 Figure 18. Relay Control Panel ........................32 Figure 19. Power Distribution Panel ........................ 33 Figure 20. CDA Panel ............................37 Figure 21. Venturi Supply (Option) ......................... 38 Figure 22. Floor Mounting Locations ....................... 46 Figure 23.
- Page 10 ACM 150 Figure 69. Status Bar ............................. 114 Figure 70. Acquire Background ........................115 Figure 71. View Valve Cycles .......................... 116 Figure 72. View Spectrums ..........................117 Figure 73. Cycle Valve Test (Dual pump, line leak option) ................118 Figure 74. Cycle Valve Test (Venturi pump, line leak option) ................119 Figure 75.
- Page 11 The information in Honeywell Analytics’ published engineering specifications, manuals, and guides are correct as of publication date. Honeywell Analytics is not responsible for product application, including but not limited to compatibility with other equipment.
- Page 12 Tel: +1 847 955 8200 Toll free: +1 800 538 0363 Fax: +1 847 955 8210 detectgas@honeywell.com Europe, Middle East, and Africa Honeywell International Sarl Z.A. La Piece 16 1180 Rolle Switzerland Main Phone: +41 21 695 30 00 reception.rolle@honeywell.com...
- Page 13 ACM 150 1.2. ACM 150 standard warranty The following warranty is between the Purchaser and Honeywell Analytics known hereafter as Seller. • Seller warrants that for a period of one year after on-site start-up, its products shall be free from defects in material and workmanship provided that inspection by seller indicates such defects developed under normal and proper use.
- Page 14 2.2. End user responsibilities Use only the most current revision of this manual. The information in Honeywell Analytics’ published engineering specifications, manuals and guides are correct as of publication date. Honeywell Analytics is not responsible for product application, including but not limited to compatibility with other equipment.
- Page 15 ACM 150 2.4. Danger/Warning/Caution/Note DANGER Warns about hazards that will cause serious personnel injury, death or major property damage if ignored. WARNING The warning notice identifies potentially dangerous situations, where improper actions could cause death or serious injury. CAUTION The Caution notice is a general hazard which identifies situations where improper actions could cause damage to the equipment or product.
- Page 16 An employee of the user’s company or a third party service company who is a service technician or engineer and who has received training from Honeywell Analytics or its agent on the operation and service of the ACM 150 monitor and who is authorized by his/her company to perform this service.
- Page 17 ACM 150 2.7. Chemical safety Located within the sample gas cell are two windows made of a potentially toxic material called ZnSe (zinc Selenide). An MSDS for ZnSe is included in Appendix B. Special attention to the MSDS should be given and appropriate precautions taken by the user when performing maintenance on the gas cell Most of the time the ACM 150 monitor is operating, it is sampling ambient air without toxics.
- Page 18 ACM 150 2.9. Electrical safety Tools are required to access sections of the ACM 150 monitor with electrical connections. An appropriately sized ball driver or allen wrench is required to access the interior portions of the enclosure. A Phillips screwdriver is required to access the power cords at the AC power distribution unit, located immediately behind the computer door.
- Page 19 There are two heavy components that may need infrequent servicing or replacement every few years. The optics bench contains components that can be replaced by Honeywell Analytics. Care should be exercised when lifting and removing the optics bench. When removing the optics bench for off-site service, Honeywell Analytics suggests an adjustable height wheeled platform or dolly be positioned level with the optics drawer.
- Page 20 ACM 150 2.13. Flammability The construction of the ACM 150 monitor enclosure consists of nonflammable materials. All high voltage (110/220VAC) is contained within nonflammable enclosures. 2.14. Potential key failure points and trouble spots Potential key failure points and trouble spots can include, but are not limited to: •...
- Page 21 These labels are applied by the factory prior to shipment. NOTE If any label is absent or loose, please notify Honeywell Analytics. A new adhesive label will be sent. It may be applied to the ACM 150 monitor, as shown in the drawings, by the user or by one of our service engineers.
- Page 22 ACM 150 Figure 1. ACM 150 Outside Labels...
- Page 23 ACM 150 Figure 2. ACM 150 Inside Labels...
- Page 24 ACM 150 Technical Description and Theory of Operation 3.1. Overview of the ACM 150 monitor The ACM 150 monitor can monitor any or all the following locations: • Sources of a potential chemical leak, such as gas cabinets, valve boxes, pipes, process equipment, semiconductor tools and storage areas to alert emergency response teams of a pending problem and/or to shut off the flow of gases automatically.
- Page 25 ACM 150 Figure 3. General Arrangement...
- Page 26 ACM 150 3.2.2. Main power switch This switch controls the line power. The ACM 150 monitor cannot operate unless it is switched ON. Switching it OFF disconnects line power to all ACM 150 assemblies. This is also a Lockout/Tagout (LOTO) switch. It accepts an external padlock in the OFF position. Figure 4.
- Page 27 ACM 150 One to four manifolds are installed, providing 10, 20, 30 or 40 sample point inlet fittings. Blank plates seal off unused manifolds. Handles are provided for installation and removal of the manifold assemblies. Shown below are the sample tube fittings on the manifolds. Figure 6.
- Page 28 ACM 150 A column of LEDs on the left and right sides indicate the vacuum, measured in psia, in the bypass flow (Bypass Vacuum) and in the sample flow (Sample Vacuum). They are a troubleshooting aid should the vacuum fall below acceptable levels. Status LEDs are provided for the following: •...
- Page 29 ACM 150 3.2.6. Cycle valves When a sample area is selected by the computer, the corresponding sample valve diverts the flow path from bypass to sample. The boost pump draws the air sample in and pumps it to the gas cell. The boost pump connects to the gas cell through the cycle valve assembly.
- Page 30 ACM 150 3.2.7. Cycle valve control panel The Cycle Valve Control Panel provides both status and control, much like the Sample Valve Control Panel. Status indicators include: • Sample Pressure: This scale is psia or absolute pressure, as measured at the gas cell.
- Page 31 ACM 150 Figure 10. Cycle Valve Control Panel...
- Page 32 ACM 150 3.2.8. Pump assemblies 3.2.8.1. Venturi Pumps The ACM 150 monitor has two air-driven ducts (venturi pumps). One is the Bypass Venturi Pump. It draws a constant flow of air through the tubes and the sample valves. This flow is only interrupted when the sample valve is energized, i.e.
- Page 33 ACM 150 3.2.8.2. Mechanical pumps The pumps are isolated in the bottom section of the ACM 150 monitor to muffle the noise and to isolate vibration and heat. Cooling fans in the bottom section of the cabinet direct air flow across the pumps and their motors. The pumps are accessed by removing the front panel.
- Page 34 ACM 150 3.2.9. FTIR bench & gas cells 3.2.9.1. FTIR optics bench assembly Figure 13. FTIR Bench Assembly The Optics Bench is a Perkin Elmer Model Spectrum Two FTIR (Fourier Transform InfraRed) analyzer. It is the heart of the ACM 150 monitor, providing the analytical power to identify and quantify a vast array of gases.
- Page 35 ACM 150 3.2.9.2. Gas Cells Sampled air never flows through the FTIR Optics Bench. Instead, the samples flow through a gas cell. The infrared beam from the FTIR Optics Bench passes through a window on top of the bench where it is reflected by mirrors and directed into the gas cell. The infrared beam passes through windows in the gas cell, where the gas molecules in the sampled air absorb infrared radiation at wavelengths specific to each gas type.
- Page 36 ACM 150 Figure 14. Touchscreen Overview and with Events...
- Page 37 ACM 150 3.2.10.3. Keyboard For the entry of alphanumeric characters, the ACM 150 monitor has a keyboard mounted on a slide out drawer below the computer assembly. Pull out the keyboard only when needed. Push the slide out drawer back in to eliminate the risk of injury caused by the protruding drawer.
- Page 38 ACM 150 Figure 15. Relay Output Board...
- Page 39 ACM 150 The output relays are provided for interface to PLCs, for direct activation or alarm devices and/or for direct initiation of automatic gas shutdown. They may also be wired to status panels. All relays are double-pole double-throw (DPDT) with dry contacts rated for maximum 30 VDC, 2 A.
- Page 40 ACM 150 Figure 17. Typical Relay Layout • Relay number 1 is shown. • Typical of all 86 relays. • Figure 15 for layout and relay locations. 3.2.12. Relay output control panel The Relay control panel provides both status and control. When the ACM 150 monitor activates a relay, the corresponding LED lights and remains lit until the condition clears or the relay is reset.
- Page 41 ACM 150 Figure 18. Relay Control Panel The Control Panel Status LEDs for Power On, Manual Mode and Comm. Active have the same functions as the other control panels. Refer to Control panel status.
- Page 42 ACM 150 3.3. Electrical Layout 3.3.1. Power DISTRIBUTION PANEL The AC line power from the main power switch wires into the power distribution panel, which is shown below. This panel provides grounded receptacles for power cords wired to the various subassemblies and mechanical pumps in the ACM 150 monitor. Each subassembly has its own DC power supply, if DC power is required.
- Page 43 Note: 76-215-13926-00-x for 115VA 3.3.2. Interconnecting cables On request, Honeywell Analytic can provide a wiring diagram showing all the power cords and other interconnecting cables in the ACM 150 monitor and the connection points for each cable. Refer to this diagram to determine which cord to unplug when removing power from a specific pump or subassembly.
- Page 44 ACM 150 Table 1 shows the timing range for each flow cycle and the pressure or range of pressure in the gas cell during the cycle. Evacuation cycle: The ACM 150 monitor starts each sampling cycle by switching the valves so that the Gas Cell Venturi Pump draws a vacuum on the gas cell. The inlet valve to the gas cell is shut off.
- Page 45 You can also observe this on the local or remote computer screen by selecting View Cycle Valves. The timing is set by the Honeywell Analytics service engineer in the configuration software. These times may be increased or decreased to get good sampling and analysis results in the minimum amount of time.
- Page 46 ACM 150 3.4.5. CDA panel The panel shown below sets and controls the pressure of clean/dry air (CDA). It splits to two air set regulators, one for the Venturi Pump air supply and one for Line Leak Test. Solenoid valve S9 is normally opened to supply air to drive the two Venturi Pumps. It shuts off automatically when the Backup Exhaust Pump takes over and is manually reset to open.
- Page 47 ACM 150 Figure 21. Venturi Supply (Option) 3.4.6. Other sampling components 3.4.6.1. Filter A polypropylene filter is installed on the outlet of the Booster pump failure detection. It helps keep the gas cell clean by removing particulates down to 0.1 microns. 3.4.6.2.
- Page 48 The automatic Line Leak Test is built into all ACM 150s; however, it may be turned on or off in the configuration by Honeywell Analytics. For every sample line in use, the test requires a check valve installed near the sample tube inlets, which is shown in the flow schematic that’s available on request.
- Page 49 ACM 150 3.6. ACM 150 Operating Principle 3.6.1. Basic operation The ACM 150 monitor can provide qualitative identification and quantitative analysis of the chemicals in their gaseous state. Each time the ACM 150 monitor scans an air sample, it collects multiple spectra of that sample, typically 4 2.
- Page 50 ACM 150 3.6.4. Permanent calibration 3.6.4.1. Controlling variables The ACM 150 monitor eliminates or minimizes these variables so that their effects on calculating the concentration are insignificant, in the following manner: • The path length is fixed, e.g. at 10 M or 5 M. All reference calibrations and analyses are adjusted in your ACM 150.
- Page 51 ACM 150 The units of absorbance (A) are divided into milliabsorbance (mA) units, where 1000 mA = 1.0 A. When we calibrate for a chemical and collect that calibration spectrum, we are determining the number of milliabsorbance units per ppm of gas concentration for each wavenumber region where that chemical absorbs IR radiation.
- Page 52 150 monitor is always provided with at least one analytical methods, although several analytical methods may be used. These are the chemicals that were requested by the user and then grouped by a Honeywell Analytics application chemist into methods or groups of chemicals.
- Page 53 ACM 150 Installation environment 4.1. Space requirement No access is required from the rear or from either side. The ACM 150 monitor may be against a wall or set back-to-back with another monitor. Allow a space of 3 inches (8 cm) behind the rear for air circulation.
- Page 54 Additional Output Relays • Power fail • Watchdog timer • Manual Mode • General malfunction • General warning • General alarm 4.5. Data interface and protocol Network Ethernet Protocols TCP/IP webserver Other communication networks are available. Contact Honeywell Analytics for more information.
- Page 55 Report any signs of rough handling or damage during shipment to the transportation carrier. Inspect all equipment and/or parts after removal from shipping containers. NOTE Report any broken, damaged, or missing parts immediately to Honeywell Analytics or your local Honeywell Analytics representative. Figure 22. Floor Mounting Locations...
- Page 56 120 VAC with a minimum of 10,000 AIC (amperes interrupting capacity). Honeywell does not provide an external circuit breaker. The Main Power Switch is located on top of the ACM 150. Remove the cover and hard-wire the line power from the external...
- Page 57 ACM 150 Figure 24. Main Power Switch and Supply Connections NOTE For safe operation, Ground must be connected to an equipment grounding conductor or Protective Earth. DANGER! Electrocution danger. Before removing the Main Power Switch cover or connecting line power, verify that the external AC supply power is disconnected at the source in accordance with your company’s Lockout/Tagout procedures.
- Page 58 The ACM 150 monitor will operate at either 50 Hz or 60 Hz, single phase power. If your line power is not within the range of 110-115 VAC, advise Honeywell Analytics prior to placing an order. The ACM 150 monitor can be set up at the factory to operate on AC power in the range of 200-230 volts AC.
- Page 59 ACM 150 5.3. Utility gases and exhaust piping 5.3.1. Nitrogen supply The ACM 150 monitor requires a constant supply of nitrogen, which is used as a dry purge gas for the optics bench and as a zero gas for the Background cycle. The requirements are: Source plant bulk nitrogen supply or N...
- Page 60 ACM 150 5.3.3. Exhaust The ACM 150 monitor exhausts the air it samples through an exhaust pipe located on the top. Connect this to an exhaust duct with no flow restriction that is compatible with the types of gases monitored by the ACM 150 monitor. The requirements are: Flow Rate 12 scfm (340 lpm) Connection...
- Page 61 3/8 inch Teflon or polypropylene in metal • thin wall tubing that can kink conduit. Before using tubing, consult with Honeywell when bent Analytics about material CAUTION! Tygon, polyethylene, copper and aluminum absorb or react with many gases. Use only the materials listed above. Make no substitutions.
- Page 62 The buyer is responsible for deciding which areas and gases to monitor and the exact location of the sampling points in gas cabinets, storage rooms, valve boxes, exhaust ducts, exhaust hoods, breathing zones, etc. Honeywell Analytics does not determine and cannot advise the exact point to sample for hazardous gases. The buyer, the equipment manufacturer or a third-party consultant must make such decisions.
- Page 63 5.4.4.2. Application suitability and adaptability Honeywell Analytics provides a list of typical gases for the ACM 150 monitor and its other gas detection products. The list also identifies limitations. Before you can use the ACM 150 monitor as a monitor, a Honeywell Analytics applications chemist must provide the software, or analytical methods.
- Page 64 ACM 150 5.5. Wiring the outputs 5.5.1. Access plates Figure 27 shows two access plates on top of the ACM 150 monitor. They are provided for wiring the outputs. Remove one or both plates and cut or drill, as necessary to accommodate your preferred connection, such as: Flange mating to Wiremold or similar...
- Page 65 This is a fail-safe implementation, and it requires a change in the ACM 150 monitor software configuration by Honeywell Analytics.
- Page 66 ACM 150 Figure 28. Relay Output Wiring Power Fail Watchdog Timer Manual Mode General Malfunction General Alarm 1 General Alarm 2 WARNING! This sequence can cycle repeatedly and may result in an exposure to toxic gas while ERT personnel are repairing the leak. If the ACM 150 monitor output relays are used to shut down the gas source and interrupt the gas flow, a latching relay must be used in the control loop.
- Page 67 The ACM 150 monitor saves the infrared spectra of its area scans. The remote computer can send the saved spectra to Honeywell Analytics via e-mail. These spectra provide a “fingerprint” of the air samples. They are often used to verify alarm incidents, and they can help identify unknown odors with the aid of spectral search software.
- Page 68 5.6.3.4. Gateway Interface The ACM 150 monitor can provide an optional built-in programmable gateway that can communicate with several different data protocols including many used in popular PLCs. Ask your Honeywell Analytics representative for information regarding your application.
- Page 69 ACM 150 5.7. Installation drawings In addition to the drawings in this section, drawings may be separately provided to clarify the installation of special or modified assemblies. Figure 29. ACM 150 Installation Diagram 1...
- Page 70 ACM 150 Figure 30. ACM 150 Installation Diagram 2...
- Page 71 ACM 150 Form 1: Sample point matrix ACM 150 Gases Sample Installation Monitored Notes Port# Point Name...
- Page 72 Caution Labels have been applied to the FTIR optics bench by the manufacturer. Read and comply with those labels. Only trained personnel, including Honeywell Analytics service engineers, are qualified to open the FTIR optics bench and service the components inside with AC power applied.
- Page 73 ACM 150 6.2. Computer information 6.2.1. ACM 150 touchscreen and keyboard When any entry requires alpha-numeric characters, use the keyboard. 6.2.2. Remote computer access The ACM 150 monitor may be operated from a remote computer via network or Internet. All functions can be accessed remotely. The setup program is available to a remote user who has authorized access.
- Page 74 ACM 150 Alarm 1/ Alarm 2/ Service events: If there are no current alarm incidents, the display indicates No Alarm 1, No Alarm 2 and No Warn. Figure 32. Alarm Service Events When an alarm or a fault or a condition requiring service attention is detected, this display indicates a status change: Figure 33.
- Page 75 ACM 150 Manual and Frontpanel are test/service modes. When they are selected, normal scanning is interrupted, and the display changes from Automatic Mode to Manual Mode. Figure 34. Status Bar (Manual Mode) 6.3.4. Overview and Recent scan results Below is an image of Recent Scan Results. It updates as each area scan is completed, about every 15 seconds on a standard ACM 150 monitor.
- Page 76 ACM 150 Point This displays the name that the user designates for sample area, NOTE corresponding to the area number. Area Number, Port Number and Point Since area number is unlikely to have Number all correspond to the inlet port any meaning to the operator, the ACM number, 1 - 40, on top of the ACM 150 150 monitor software allows you to enter...
- Page 77 ACM 150 Active Gases The gases actively monitored at that area. If a gas is not shown as active, it is not being monitored at that area. Started The date and time of the scan is identified. Concentration Concentration of each active gas. Usually, the ACM 150 monitor confirms zero gas present, shown as 0.
- Page 78 ACM 150 6.4. Changing the mode of operation To change from the Current Scan display at the ACM 150 monitor, touch the desired menu item. Figure 37. Menu Tree Table 2: Menu Access Levels Menu Description Access Overview Display all points and event status Event history Display event history Archives...
- Page 79 ACM 150 6.5. Alarm 1/Alarm 2 incidents and actions The primary purpose of the ACM 150 monitor is to generate a Alarm 1/Alarm 2 Incident whenever the level of a hazardous gas exceeds set point limits. Such incidents cause several actions to occur automatically: •...
- Page 80 ACM 150 Press button to export events. User can download files where “Archives>Download”. Figure 39. Export Events 6.5.2. Relay activation When an Alarm 1/Alarm 2 Incident occurs, the ACM 150 monitor software activates the corresponding relays. All ACM 150 monitors have at least 80 output relays. The action of each relay is programmable.
- Page 81 ACM 150 6.5.2.2. Programming relays The ACM 150 monitor output relays are all programmable. The relays may be configured by an authorized user to activate based on the following selections: Trigger The Alarm 1 or Alarm 2 level gas concentration Mode Direct or Latching Activation Points (Areas)
- Page 82 6.5.2.4. Special Latching Relays If you do not have latching relays in your control scheme, then Honeywell Analytics recommends that the ACM 150 monitor relays be changed to latch. This is a simple configuration change in the ACM 150 monitor software. When set to latch, the relays must be manually reset to open.
- Page 83 ACM 150 Figure 40. Select a Point Lock-on Scan The Lock-on Mode screen, Figure 40, allows you to select the area you want to scan. You can only select an area that has been setup for monitoring, which is indicated by a green box.
- Page 84 ACM 150 Figure 42. Lock-on Scan Spectrum 6.6.2. Demand scan mode The Demand Scan Mode interrupts normal scanning to conduct 2 scans of the selected area. Normal area scanning resumes automatically. Demand Scan is intended for the following uses: • To provide a quick means of monitoring any area during an emergency and reporting the levels of hazardous gases present there.
- Page 85 ACM 150 Figure 43. Demand Scan After an area is selected, normal scanning is interrupted while two scans are collected. The results are displayed as shown in Figure 44. The concentration readings and status of each active gas at the sample point are displayed. Programmable relays activate if Alarm 1/Alarm 2 set points are exceeded.
- Page 86 ACM 150 Figure 44. Demand Scan Spectrum In Demand Scan the infrared spectrum is displayed, and it may be expanded for viewing by touching the display. At the same time, the data and the spectrum are archived automatically. The archived spectra may allow an application chemist identify gases which were in the sampled area at the time but not actively monitored.
- Page 87 ACM 150 6.7. Archived Spectrum and Trends The ACM 150 monitor stores the infrared spectrum data from all its modes for the past 15 days. The Archived View allows you to selectively review and identify these spectra. Figure 45. Archived Views...
- Page 88 ACM 150 6.7.1. Archived spectrum view When you select Archived Spectrum View, the menu shown in Figure 45 display. Use the number keys on the keyboard to enter the desired date and the time interval Normal: Scans collected in the normal scan mode. Generally, only the Alarm 1 and Alarm 2 normal scans are important to the user.
- Page 89 ACM 150 6.7.2. Trend graphs Trend Graphs are available for all the active gases on every scanned point. The data from each scan is stored for this purpose. Trend Graphs provide a means of viewing a leak incident from start to finish. Figure 47.
- Page 90 ACM 150 Pressing the selected area changes the display by generating a trend graph. Figure 48 shows a graph of four gases over a one-day time period. In this case, there is a constantly changing H S and CO concentration shown in green color. To rescale the y-axis for a greater resolution, move scale x and y scale bar.
- Page 91 You may get some low-level readings for certain chemicals, especially if they are measured in the water vapor region of the infrared spectrum. It may be necessary for the Honeywell Analytics application chemist to adjust the analytical method for the specific background purge gas and normal air chemistry at the user’s location.
- Page 92 ACM 150 Record all of the incidents on Form 3, “Details of alarms, problems or non-spec performance. Form 2: Plan for ACM 150 incidents. Port # Active Points Sample Point Actions for Warn/ Name or Alarm 1/Alarm 2 Equipment ID # Incidents...
- Page 93 Set enable SNR fault on samples can inhibit gas alarm event, which can help suppress potential false gas alarm event by potential system failure. The customer enables the signal-to-noise ratio on samples at their own risk. Honeywell Analytics disclaims all liability resulting from customers enabling signal-to- noise ratio on samples. 6.9.4. Maintenance gas...
- Page 94 ACM 150 6.10. Spectrum Overlay Menu: Diagnostics> View Spectrum User can compare a spectrum vs other reference Spectrums. User can select Spectrums by pressing “ADD SPECTRUM”. Figure 49. Spectrum Overlay The user can compare a spectrum of a point vs other reference Spectrums by click the spectrum and can select Spectrums by pressing the “ADD SPECTRUM”...
- Page 95 ACM 150 Figure 50. Move to Spectrum Overlay...
- Page 96 ACM 150 6.11. Information The user can check ACM 150 product information, system settings, user settings and basic current status. Figure 51. ACM 150 Product Information...
- Page 97 7.2. ACM Configuration Settings> ACM Configuration Admin user can set ACM configuration parameters. CAUTION! Please contact to Honeywell service for more information 7.3. Settings - General Configuration 7.3.1. Date and Time Configuration Settings> General Configuration>Date/Time. Set the time, using a 24-hour clock.
- Page 98 Select Login level, which prompts you to enter a password. A default administrator account and password are created by Honeywell Analytics in the configuration software and given to the person in charge of the ACM 150 monitor. Log in administrator account can access Account manager menu as shown.
- Page 99 ACM 150 Access level Functional range Default Access Level. Viewer View most screens Viewer Service Service Admin Service Administrator NOTE Creating temporary Admin password when you forget admin password, please send information for S/N and date to HA service. 7.5. Settings –...
- Page 100 ACM 150 If you know the name for a point but not the gases to be monitored, you can assign the name now and configure the gases later. If there is no status indicator next to the point, it has not yet been configured. Figure 54.
- Page 101 ACM 150 7.6. Settings – Order of Scan Settings> Order of Scan The Order of Scan defines the sequence of point scanning. Points may be scanned in any order, and points may be repeated in the sequence. It is also possible to have points in the sequence without making them active.
- Page 102 ACM 150 7.6.2. Configuration key For reference, a configuration key displays down the right side of the screen. This key indicates which of the points are enabled in Point Configuration. NOTE Only points with Scan Enabled in the Single Point Configuration can be scanned. The Configuration Key identifies the enabled points.
- Page 103 ACM 150 7.6.3. Reviewing and changing the order of scan Until you login with an access code, you can only review but not change the order of scan. After you login, you may edit the sequence and enable or disable points. When editing Order of Scan follow the steps in Table Figure 57.
- Page 104 ACM 150 Figure 58. Editing the Order of Scan...
- Page 105 ACM 150 Table 3: Scan Points Configuration Decide on the scan sequence you want to use before you make any changes. Note that points may be scanned in any sequence. If you want the ACM 150 monitor to spend more time scanning one or more critical points, you can repeat the point(s) in the sequence.
- Page 106 ACM 150 Figure 59. Composite Points CAUTION! Composite point sampling may expose employees to hazardous conditions by lowering the gas detection capability. Use Composite Points only if the rate of scan must be increased. The following rules apply and must be followed: 1.
- Page 107 ACM 150 7.7. Settings – Method Manager Settings> Method Manager Analytical methods (defined in Analytical methods) are dynamic. Methods may be updated, new methods added, and old methods deleted, as often as required, to keep pace with the ever-changing R&D and production chemicals. Use the Method Files key to import new and updated methods and to delete methods no longer used.
- Page 108 ACM 150 7.8. Settings – Relay Configuration The ACM 150 monitor has 80 programmable relay outputs. The functions and uses of the relays are described in section Alarm 1/Alarm 2 incidents and actions. These relays have a default setup that controls their program until that setup is changed. 7.8.1.
- Page 109 ACM 150 Figure 62. Relay Configuration...
- Page 110 ACM 150 7.8.2. Selecting the relay program Follow the steps in Table 4 when assigning levels, points and gases to a relay. Table 4. Relay Programming Steps Before you proceed to change the default relay program, you should first have a plan for each of the relays you want to program and use.
- Page 111 ACM 150 Figure 63. Selecting Relay Gases NOTE After programming relays, test them to verify that they are wired correctly to external devices so that they will perform their alarm and control functions properly.
- Page 112 ACM 150 7.9. Settings - Import/Export Configuration Settings> Export/Import Configuration After you setup the ACM 150 monitor and each time you change the setup, you want to save the configuration to the ACM 150 monitor hard disk. Also, you should backup the configuration to a USB flash drive.
- Page 113 ACM 150 8. Shutdown Procedure 8.1. Emergency shut down Immediately turn off the Main Power Switch located on top of the ACM 150 monitor to disconnect power to all the internal circuits. Figure 65. Main Power Switch 8.2. Planned shut down 8.2.1.
- Page 114 ACM 150 CAUTION! This is a high-pressure safety hazard. The compressed air (CDA) supply pressure normally exceeds 100 psig (7 kg/cm2). After shutting off the external supply valve, check the internal pressure regulators on the CDA Panel, Figure 20, to ensure that they read zero.
- Page 115 ACM 150 Maintenance 9.1. Lockout / Tagout Procedure 9.1.1. ACM 150 Before accessing, testing, touching or removing any electrical circuits, plates or shields in the ACM 150 monitor, disconnect the power following the procedure in Planned shutdown for both line power and utility gases. The Main Power Switch, Figure 24, is lockable in the Off position, and it provides Lockout / Tagout for the ACM 150 monitor.
- Page 116 ACM 150 9.2. Decontamination / Decommissioning Procedures 9.2.1. Purpose To establish a safe procedure for decontamination and the eventual decommissioning of the ACM 150 monitor at a customers’ site. 9.2.2. Procedures Wear appropriate Personal protective Equipment. Standard Nitrile gloves recommended. 1.
- Page 117 ACM 150 9.3. Inspection and service schedule The ACM 150 monitor constantly monitors itself for proper operation. Problems are identified as Service Events and they change Service Status. At the same time, relays are activated to notify the user of service problems or a loss of power (refer to Troubleshooting).
- Page 118 ACM 150 9.3.3. Annual PM services Inspect and service the ACM 150 monitor in accordance with Service inspections and procedures. If you have not already done so during the past 12 months, replace these expendable items: • Cabinet filters • Gas cell filter •...
- Page 119 ACM 150 10. Service Operations 10.1. Archives Menu This menu service export measured gas readings and other events. User data exporting may take time to gather the database. User can download files from the “Download” menu when data extracting is ready. NOTE Archive data list in screen has size limit.
- Page 120 ACM 150 10.1.2. Gas conc. Trend Archives>Gas conc Trend Select a point and show gases concertation trend. It can be exported. 10.1.3. SNR Trend Archives> SNR Trend S/N is the signal-to-noise ratio. It is calculated automatically during every ‘Background’. S/N determines the lower detection sensitivity of the FTIR analyzer, the higher the value the better.
- Page 121 ACM 150 10.1.4. ZPD Trend Archives>ZPD Trend The ZPD Trends indicate changes in the FTIR detector signal, which is the relative intensity of the infrared radiation on the detector (refer to ZPD values (Energy and Position) for a complete explanation). Figure 67.
- Page 122 ACM 150 10.1.4.2. Sample point ZPD Trends Archives>ZPD Trend>Sample ZPD You can also trend the average daily value of the ZPD energy for any active sample point. 10.1.5. Download Archives> Download All user exported data are listed to download. It may show progress during gathering data. User can download the data to external USB drive.
- Page 123 ACM 150 10.2. Diagnostics Menu Diagnostics> Table 6: Diagnostics Menu Menu Sub menu Description Access Mode Background Manual background Service Auto Scan Scan View cycle View valve cycles Service Auto valve View View and compare Service Auto Spectrum spectrums Cycle valve test Admin Test Hardware...
- Page 124 ACM 150 10.2.1. Background Scan Diagnostics> Background Scan You can obtain a background spectrum on demand by selecting ‘Background scan’. As shown in Table 6, the background spectrum is displayed for evaluation. In this mode it is also possible to ‘Save New Factory Background’ Scan’, which would replace the prior reference background.
- Page 125 ACM 150 10.2.2. View cycle Diagnostics> View cycle This mode displays the ACM 150 monitor flow schematic with the current activation state of each Cycle Valve, as shown in Figure As the ACM 150 monitor progresses through its sampling sequence, you can observe the changing activate states.
- Page 126 ACM 150 10.2.3. View Spectrum Diagnostics> View Spectrum This screen shows selected the spectrum and can compare from reference spectrums: Figure 72. View Spectrums 10.2.4. Hardware Service Diagnostics> Hardware Service 10.2.4.1. Cycle valve test Diagnostics> Hardware Service >Cycle valve test This mode displays the ACM 150 monitor flow schematic.
- Page 127 ACM 150 Figure 73. Cycle Valve Test (Dual pump, line leak option)
- Page 128 ACM 150 Figure 74. Cycle Valve Test (Venturi pump, line leak option) 10.2.4.2. Sample valve test Diagnostics> Hardware Service>Sample valve test All the sample valves, 1-40, may be controlled manually. The figure below shows valves 1-40. No valves are activated when you enter this mode. Select the valve you want to activate to open it.
- Page 129 ACM 150 Figure 75. Sample Valves Manual Control...
- Page 130 ACM 150 10.2.4.3. Relay test Diagnostics> Hardware Service>Relay test All the output relays may be controlled manually. The ACM 150 monitor has 40 programmable relays. The figure below shows only the first row of the menu, programmable relays 1-10. No relays are activated when you enter this mode. Select the relay you want to activate to open it.
- Page 131 ACM 150 10.2.4.5. Kinked Tube Test Diagnostics>Hardware Service>Kinked tube Test Allows the detection of kinked sample tubes by analyzing the Sample Flow pressure. If a tube is kinked or bent severely and the pressure does not reach the configurable setpoint Kinked Tube Threshold, a service event is generated indicating the port and the pressure value.
- Page 132 ACM 150 10.2.5. Software Service Diagnostics>Software Service 10.2.5.1. Memory Maintenance Diagnostics>Software Service>Memory Maintenance The screen “Memory Maintenance” may be used to analyze and control the database on the ACM 150 monitor and is designed for our Field Service Engineers. Figure 78. Memory Maintenance...
- Page 133 ACM 150 10.2.5.2. Alarm Simulation Diagnostics>Software Service>Alarm Simulation For testing communication links to external devices via Modbus/TCP output, such as a PLC connection, the ACM 150 monitor, and higher features Alarm Simulation. When simulating an alarm on a specific port and for one or more gases, a message assuming a concentration of Alarm Level + 5% for each selected gas is sent via Modbus/TCP.
- Page 134 ACM 150 10.2.5.3. Fault Simulation Diagnostics>Software Service>Fault Simulation For testing communication links to external devices via Modbus/TCP output, such as a PLC connection, the ACM 150 monitor, and higher features Fault Simulation Select a fault to simulate Press "START" to start simulating Fault simulation is running only on this screen.
- Page 135 ACM 150 10.3. Service Inspections and Procedures 10.3.1. Preparation for Servicing 10.3.1.1. Expendable parts on hand Expendable parts, which are inspected and possibly replaced during PM servicing, should be stocked on-site and available when needed. 10.3.1.2. Recommended spare parts To minimize the time for repair, it is recommended that spare parts be stocked by the ACM 150 monitor user.
- Page 136 ACM 150 10.3.2. Servicing the filters The rate of particulate accumulation varies with the local conditions. Follow the recommended intervals for replacing filters unless your periodic inspections/tests indicate that more frequent replacement is necessary. 10.3.2.1. Cabinet air filters and fans Cooling fans are installed in the main cabinet and the lower pump cabinet.
- Page 137 ACM 150 10.3.2.4. Visual inspection You should visually inspect the gas cell filter and in-line filters during each service. The filter housing is white and semi-transparent when new. If the housing appears clean and, if testing indicates there is no flow restriction, you can postpone replacement until the next service.
- Page 138 ACM 150 10.3.4. Servicing the valves 10.3.4.1. Self-Monitoring and Manual Testing If any solenoid valve fails to switch or open, it will cause a change in absolute pressure or in the infrared spectrum that is sufficient to generate a Service Status message in most cases.
- Page 139 ACM 150 NOTE Compression tube fittings, e.g. Swagelok fittings, should be turned with a wrench 1/4 turn past finger tight. Avoid over-tightening the fittings. 10.3.5. Evaluating the FTIR optical path The modulated infrared beam produced inside the FTIR analyzer (optics bench) passes through windows, reflects off mirrors and ultimately focuses onto a 2 mm diameter detector.
- Page 140 ACM 150 10.3.5.2. Signal-to-noise ratio (S/N) Follow the instructions in Background, S/N and drift and look at the trend over the past 15 days of the ‘Background S/N Ratio’. Expect S/N to degrade slightly and trend downward over time. If there is a sudden drop in S/N or if the value falls below acceptable limits, it fails this evaluation.
- Page 141 ACM 150 10.3.6.3. Visual check of the gas cell and FTR optics With the gas cell in place, visually examine the internal mirrors for any degradation of the highly reflective surfaces, which includes: Pitting of the mirror surfaces • • Flaking-off of the mirror coating Coating of dust or chemicals •...
- Page 142 ACM 150 10.4.1. Cycle valve tests If you are at the monitor, refer to Cycle valve control panel, or if you are at a remote location, refer to View valve cycles. Observe the readings from the gas cell pressure transducer (‘sample pressure’ or ‘sample cell’) as the ACM 150 monitor scans through all its active points.
- Page 143 ACM 150 10.4.2. Sample valve tests Verify that vacuum is present by observing the Sample Vacuum and the Bypass Vacuum readings from the respective pressure transducers. At the monitor, you can observe the vacuum LEDs, Figure 7, or from a remote location, observe the readings using View Valve Cycles, Figure Continue to observe the Sample Vacuum as the ACM 150 monitor scans through all its...
- Page 144 ACM 150 10.4.3. Line leak tests (optional) If you are using the Line Leak Test, refer Hardware servicing and select ‘Perform an Entire Line Leak Test’. Every point that is currently scanned (Programmable relays) is included in the test. The Line Leak LED on the Sample Valve Control Panel (Figure 7) lights while the test is running.
- Page 145 10.4.4. Evaluating/Resolving the ZPD Position For the Perkin Elmer bench, start up the Perkin Elmer software and perform diagnostics. If the problem remains, contact Honeywell Analytics for service assistance. 10.4.5. Evaluating/Resolving spectral balance You evaluate the spectral balance using a Background spectrum. A Background spectrum is provided in “Background Scan”...
- Page 146 Spectral Balance operation in the future. There is less absorbance due to water in the air at 5000cm-1 and 2500cm-1, and Honeywell expects a throughput of at least 20%. However, at this time, they have not expected throughput data for the Spectral Balance for the 5000::2500 ratio at this time.
- Page 147 ACM 150 10.5.1.2. Cycle valves Remove the Cycle Valves as a subassembly. First, disconnect the tube fittings connecting these valves to external components. Next, unscrew the electrical connectors. These tube fitting connections and electrical connectors are identified in Figure 9. As you disconnect each tube and connector, verify that it is properly labeled.
- Page 148 ACM 150 10.5.2. Backup vacuum pump Turn off the main power switch. You need the service kit for the Gas vacuum pump. If the kit includes instructions with diagrams, do not use them. Instead, refer to Figure 82 Table 7 and use the following procedure: Let the pump cool until it is no longer too hot to handle.
- Page 149 ACM 150 Figure 83. Backup Vacuum Pump Diagram...
- Page 150 ACM 150 Table 7: Backup Vacuum Pump Parts List Item # Service Part Quantity Body Vane* Shroud End plate Gasket* Muffler box O-Ring* Felt* (Do not use) End cap End cap arm Nipple Plate bolt Service Kit * denotes parts included in Service Kit...
- Page 151 ACM 150 10.5.3. Line leak test setup procedure These are the procedures recommended to set up the Line Leak Test so that it works correctly: 10.5.3.1. Prepare for test and setup Disconnect a few sample tubes at inlet fitting, e.g. points 1 thru 4. Make sure that you have CDA supplied to the ACM 150 monitor and that you have installed check valves at all the sample point inlets.
- Page 152 ACM 150 Troubleshooting 11.1. Identifying problems 11.1.1. Utilizing relay outputs The ACM 150 monitor computer constantly monitors the operating status of the system. If any problem develops that requires the user’s attention, it generates a message identifying the problem. The sooner you are aware of a problem, the sooner you can take actions to resolve it and minimize (or even avoid) downtime.
- Page 153 Verify that the cables and Interconnecting cables power cords are connected to the relay board(s) Cannot load factory Check for missing file or Contact Honeywell background spectra path error (should not occur Analytics after initial start- up) Energy (ZPD) Too little reaching...
- Page 154 ACM 150 11.3. Backup log files User can monitor operating history include faults to investigate root cause. Please refer to following procedures to export log files from HMI PC and SBC. 11.3.1. HMI PC log files There are two methods to copy log files into a USB drive. - Go to Diagnostics / Software service / Memory Maintenance / Export - Go to Archives/ Download.
- Page 155 ACM 150 12. Appendix 12.1. Appendix A Master parts list 1. BASE UNIT 76-ACM 150-115-1 FTIR-based analyzer, for measurement of up to 15 gases per sample point. Includes primary venturi pump with automatic switch-over to electric backup pump, touchscreen user friendly interface (point and click), built-in diagnostics, configurable gas selection, web-based user interface, 10 point sample valve assembly including dust filter, 80 user-programmable relay contacts;...
- Page 156 ACM 150 3. OPTIONS AND ACCESSORIES Kit, Data Interface, Control Net B3514 76-150-14392-02 Kit, Data Interface, Control Net, Redundant B3514 76-150-14398-02 Kit, Data Interface, Modbus TCP/IP 76-150-14391-10 Kit, Data Interface, Profibus DP 76-150-14390-04 4. ACM 150 Gen 2 Spares Touch LCD monitor 3014B1214 HMI computer 3014B1215...
- Page 157 ACM 150 6. ACM 150, ACM 150 Gen 2 Spares Assy, Cable, Communication, Converter-P1 76-220-13875-01-A Assy, Adaptor booster pump new type con 76-220-13987-00-A Assy, Cable, Booster Pump 76-220-13985-01-A Kit, Repair, Exhaust Pump 76-3420-10018 O-Ring, Repair, Exhaust Pump 76-3420-10025 Assy, Manifold,10 Point Sample 76-360-12223-00-C Optics, KRS-5 Crystal,25mm DIA x 22mm 76-4680-10008...
- Page 158 ACM 150 12.2. Appendix B Event list Fault Event Event Displayed Message Remark Category Level Code Bench Fault - ZPD value out of (Only for PKI) System range on Point# (energy: #, #ZPD energy Down position: #) #ZPD position System Bench Fault Bench Fault - Wrong data size (Only for PKI)
- Page 159 ACM 150 Pump Fault - Check Booster Require Pump #Point area id Service (Sample pressure during #Cell pressure Evac: #psi) System Scan Fault - No background Down spectra available Require Scan Fault - No factory Service background spectra available Scan Fault - Cell pressure failed to # Target pressure reach 14.7 psi.
- Page 160 ACM 150 Diag info - Succeed to create Information Require Diag info - Failed to create MTD Service Diag info - Succeed to create Information Require Diag info - Failed to create TWA Service Diag info - Succeed to import Information configuration (*.zip)
- Page 161 ACM 150 Require System fault - Board simulator Service problem Require System fault - Bench simulator Service problem Require System fault - Board simulator Service utility problem System System fault - Restart ACM Down Software System DB Fault - Can't connect to Temp Down System DB Fault - Temp DB command...
- Page 162 ACM 150 12.3. Appendix C MODBUS register map Function Ref. Register Channel Type Function Value Remark Code 00100 Ch #01 Byte Alarm1 0: Normal status per 1: Alarm1 point# is triggered Read/Write 04000 Ch #40 Byte Discrete 0x01 Outputs or 00101- Alarm1 Ch #01...
- Page 163 ACM 150 concentratio n of the 48101- Unsigned short latest 0-65535 48116 scanned point# (1st point) 101-160 The latest (NOTE. (only if scanned 48120 Unsigned short Value = compost point# (2nd 100 + ie scan) point) Point#) concentratio n of the (only if 48121- Unsigned short...
- Page 164 ACM 150 CCITT 0x0000 ~ CRC16 0xFFFF 48203 Unsigned short Checksum Single Scan CCITT 0x0000 ~ CRC16 0xFFFF 48204 Unsigned short Checksu m Single Scan (B) CCITT 48205 Unsigned short 0x0000 ~ CRC16 0xFFFF Checksu m Single Scan (C) CCITT 48206 Unsigned short 0x0000 ~...
- Page 165 ACM 150 High byte: Operation mode 0x01xx: Automatic mode 0x02xx: Test mode New for (Manual 48317 Unsigned short mode/ 150 G2 Panel mode) Low byte: Request type (Refer to Appendix) Point# Enabled status Bitmap for point New for 0x0000 ~ 48318 Unsigned short #1~#16...
- Page 166 ACM 150 Point# Enabled status Bitmap for point New for 0x0000 ~ 48319 Unsigned short #17~#32 0xFFFF bit[15]: 150 G2 Point#32 status … bit[0]:Point# 17 status Point# Enabled status Bitmap for point New for 0x0000 ~ 48320 Unsigned short #33~#48 0xFFFF bit[15]: 150 G2...
- Page 167 ACM 150 Relay #33~#48 bit[15]: Relay#48 status … bit[0]:Relay #33 status Relay# triggered status Bitmap for Relay New for 0x0000 ~ 48325 Unsigned short #49~#64 0xFFFF bit[15]: 150 G2 Relay#64 status … bit[0]:Relay #49 status Relay# triggered status Bitmap for point New for 0x0000 ~...
- Page 168 ACM 150 bit[0]:valve# 17 status Sample valve status Bitmap for valve New for #33~#48 0x0000 ~ 48330 Unsigned short bit[15]: 0xFFFF 150 G2 valve#48 status … bit[0]:valve# 33 status Sample valve status Bitmap for valve New for #49~#60 0x0000 ~ 48331 Unsigned short bit[15]:...
- Page 169 ACM 150 System Running Counter (SRC) Float New for 48401- The counter 0 .. (2^32)- (Mid-Little 48402 starts from endian) 150 G2 0, and is increased by 1 per one second System Parameter Update Counter (SPUC) The counter is SRC Float New for 48403-...
- Page 170 ACM 150 The counter is SRC value updated when point#40 parameters were changed. Point Parameter Update Counter (PPUC) Float The counter New for 484523- 0 .. (2^32)- (Mid-Little means the 48524 endian) value of the 150 G2 SRC when point#60 parameters were changed.
- Page 171 ACM 150 status … bit[0]:Point# 1 status Gas name New for 49101- ASCII of Gas#1 on 49116 (Char * 32) TPN. 150 G2 Gas unit of New for 49117- ASCII Gas#1 on 49120 (Char * 8) TPN. 150 G2 Alarm2 Float New for 49121-...
- Page 172 ACM 150 12.4. Appendix D Gas list Please contact Honeywell Analytics for the latest version.
- Page 173 ACM 150 12.5. Appendix E Technical Specifications Performance Specifications Analysis Method Continuous scan FT-IR analyzer (FT-IR = Fourier transform 5.0 m path length infrared) Gas Cell Path Gases Monitored Organic, PFC, CFC, HFC, Metal Organic, NF3 and a wide variety of other inorganic gases Lower Detection Limit 0.1 to 2.0 ppm for 5.0 m path cell, gas dependent...
- Page 174 ACM 150 Overall Dimensions 66 x 34 x 25 inches (HxWxD) 1,676 x 864 x 635 mm (HxWxD) Weight Operating 349 kgs / 770 lbs Shipping 470 kgs / 1036 lbs Standard Outputs and Communications Relay Outputs contacts 80 x DPDT (double-pole double-throw), programmable by sample point and gas type max.
- Page 175 ACM 150 12.6. Appendix F MSDS 12.6.1. Appendix F-1 KBr MSDS Trade name: Potassium Bromide 1 Identification of the substance/mixture and of the company/undertaking Product details Article number: 09934418 Trade name: Potassium Bromide Application of the substance / the preparation: Laboratory chemicals Manufacturer/Supplier: PerkinElmer Life and Analytical Sciences 710 Bridgeport Avenue...
- Page 176 ACM 150 4 First aid measures Trade name: Potassium Bromide General information: • Seek immediate medical advice. • No special measures required. After inhalation: Supply fresh air; consult doctor in case of complaints. After skin contact: Generally, the product does not irritate the skin. After eye contact: Rinse opened eye for several minutes under running water.
- Page 177 ACM 150 Trade name: Potassium Bromide General protective and hygienic measures: The usual precautionary measures for handling chemicals should be followed. Breathing equipment: Not required. Protection of hands: • The glove material must be impermeable and resistant to the product/ the substance/ the preparation.
- Page 178 ACM 150 11 Toxicological information Acute toxicity Trade name: Potassium Bromide Primary irritant effect: • on the skin: No irritant effect • on the eye: No irritating effect Sensitization: No sensitizing effects known. Additional toxicological information: When used and handled according to specifications, the product does not have any harmful effects according to our experience and the information provided to us.
- Page 179 ACM 150 Trade name: Potassium Bromide Cancerogenity categories EPA (Environmental Protection Agency): Substance is not listed. IARC (International Agency for Research on Cancer): Substance is not listed. NTP (National Toxicology Program): Substance is not listed. TLV (Threshold Limit Value established by ACGIH): Substance is not listed. NIOSH-Ca (National Institute for Occupational Safety and Health): Substance is not listed.
- Page 180 ACM 150 12.6.2. Appendix F-2 MSDS Trade name: Zinc Selenide 1 Identification of the substance/mixture and of the company/undertaking Product details Trade name: Zinc Selenide Article number: 09934409B Application of the substance / the preparation: Laboratory chemicals Manufacturer/Supplier: PerkinElmer Life and Analytical Sciences 710 Bridgeport Avenue Shelton, Connecticut 06484 USA Emergency information:...
- Page 181 ACM 150 Trade name: Zinc Selenide Hazard-determining components of labelling: zinc selenide Hazard statements: • H301 Toxic if swallowed. • H331 Toxic if inhaled. • H373 May cause damage to organs through prolonged or repeated exposure. H410 Very toxic to aquatic life with long lasting effects. Precautionary statements: •...
- Page 182 ACM 150 Trade name: Zinc Selenide General information: • Immediately remove any clothing soiled by the product. • Remove breathing equipment only after contaminated clothing have been completely removed. In case of irregular breathing or respiratory arrest provide artificial respiration. After inhalation: •...
- Page 183 ACM 150 Trade name: Zinc Selenide Precautions for safe handling: • Thorough dedusting. • Ensure good ventilation/exhaustion at the workplace. Open and handle receptacle with care. Information about fire and explosion protection: Keep respiratory protective device available Storage (conditions for safe storage, including any incompatibilities) Requirements to be met by storerooms and receptacles: No special requirements.
- Page 184 ACM 150 Trade name: Zinc Selenide Appearance • Form: Solid • Color: Dark brown • Odor: Characteristic • Odor threshold: Not determined pH-value: Not applicable. Change in condition • Melting point/Melting range: >1100°C • Boiling point/Boiling range: Undetermined. Flash point: Not applicable. Flammability (solid, gaseous): Product is not flammable.
- Page 185 ACM 150 Trade name: Zinc Selenide Acute toxicity Primary irritant effect: • on the skin: No irritant effect • on the eye: No irritating effect Sensitization: No sensitizing effects known. Toxicity Aquatic toxicity: No further relevant information available. Persistence and degradability No further relevant information available. Behavior in environmental systems: •...
- Page 186 ACM 150 Trade name: Zinc Selenide IMDG, IATA • Class: 6.1 Toxic substances. Packing group • ADR: I Environmental hazards: • Marine pollutant: No • Special marking (ADR): Symbol (fish and tree) Special precautions for user Warning: Toxicsubstances. Danger code (Kemler): 66 Transport in bulk according to Annex II of MARPOL73/78 and the IBC Code: Not applicable.
- Page 187 ACM 150 Trade name: Zinc Selenide Precautionary statements • P260: Do not breathe dust/fume/gas/mist/vapours/spray. • P261: Avoid breathing dust/fume/gas/mist/vapours/spray. • P273: Avoid release to the environment. • P264: Wash thoroughly after handling. • P270: Do not eat, drink or smoke when using this product. •...
- Page 188 The ACM 150 monitor only monitors for chemicals in their gas (vapor) phase. 12.7.5. Honeywell Analytics 12.7.6. This refers to the HA Local Area Network, which includes a server computer, a network hub and usually one or more remote network computers. The LAN always interfaces to HA monitors.
- Page 189 12.7.8. PSIA Pounds per square inch absolute, pressure relative to a vacuum. 12.7.9. PSIG Pounds per square inch gauge, pressure relative to atmospheric pressure at sea level. 12.7.10. The ACM 150 monitor reports concentration values for gases in parts per million (PPM) and parts per hundred thousand (PPHT) (water vapor only).
- Page 190 ACM 150 Air Composition Monitor (Gen 2) Manual part number: 3014M5000 English, Revision 6 October 12, 2022 ©2022 Honeywell Analytics...
Need help?
Do you have a question about the ACM 150 (Gen2) and is the answer not in the manual?
Questions and answers