Vaisala Optimus OPT100 User Manual
Dga monitor for power transformers
Hide thumbs
Also See for Optimus OPT100:
- Installation manual (96 pages) ,
- User manual (78 pages) ,
- Installation manual (72 pages)

Related Manuals for Vaisala Optimus OPT100


Summary of Contents for Vaisala Optimus OPT100
- Page 1 M211858EN-U User Guide Vaisala Optimus ™ DGA Monitor for power transformers OPT100...
- Page 2 This product contains software developed disclosed to a third party without prior by Vaisala or third parties. Use of the written permission of the copyright holder. software is governed by license terms and Translated documents and translated...
-
Page 3: Table Of Contents
Table of contents Table of contents About this document..................9 Version information..................9 Related manuals....................9 Documentation conventions................10 Trademarks...................... 10 Patent notice..................... 11 Product overview...................12 Overview of OPT100 Optimus DGA monitor..........12 Basic features and options................12 Measured parameters..................13 2.3.1 Total gas pressure measurement............14 2.3.2 Calculating relative moisture saturation inside transformer.... - Page 4 OPT100 User Guide M211858EN-U 3.10 Configuring network connection..............55 3.11 Configuring user interface security..............56 3.12 Configuring Modbus protocol...............58 3.13 Configuring DNP3 protocol................59 3.14 Configuring IEC 61850 protocol..............61 3.15 Using protocol test mode................62 3.16 Configuring relays..................63 3.17 Configuring offsets..................64 3.18 Configuring custom averages...............66 3.19 Deleting data....................
- Page 5 Table of contents Modbus registers..................105 A.4.1 Measurement data registers..............105 A.4.2 Alert registers...................111 A.4.3 Status registers..................115 A.4.4 Test value registers................. 116 Exception responses..................117 Modbus communication examples.............. 118 Index........................121 Maintenance and calibration services............123 Technical support...................123 Warranty......................123 Recycling......................123...
- Page 6 OPT100 User Guide M211858EN-U List of figures Figure OPT100 front parts with Ground Mounting Set........16 Figure 2 OPT100 rear parts with Ground Mounting Set........17 Figure 3 OPT100 front parts with Wall Mounting Set..........18 Figure 4 OPT100 rear parts with Wall Mounting Set..........19 Figure 5 Cable glands and connectors on OPT100 cabinet........
- Page 7 List of figures Figure 44 Measurement cycle fault active..............88 Figure 45 OPT100 dimensions with Ground Mounting Set........101 Figure 46 OPT100 dimensions with Wall Mounting Set........102 Figure 47 Mounting dimensions of installation beams..........103...
- Page 8 OPT100 User Guide M211858EN-U List of tables Table Document versions (English)................9 Table 2 Related manuals....................10 Table 3 Applicable patents or applications..............11 Table 4 Measured parameters..................13 Table 5 Calculated parameters..................13 Table 6 Status LEDs......................24 Table 7 Modbus TCP communication settings............25 Table 8 Default Modbus RTU communication settings.........
-
Page 9: About This Document
Chapter 1 – About this document 1. About this document 1.1 Version information This document provides instructions for using, maintaining, and troubleshooting the Vaisala Optimus ™ DGA Monitor OPT100. Table 1 Document versions (English) Document code Date Description M211858EN-U November 2022 Applicable from software version 1.18.0 onward. -
Page 10: Documentation Conventions
Tip gives information for using the product more efficiently. Lists tools needed to perform the task. Indicates that you need to take some notes during the task. 1.4 Trademarks Vaisalaâ is a registered trademark of Vaisala Oyj. OPTIMUS ™ is a trademark of Vaisala Oyj. -
Page 11: Patent Notice
Chapter 1 – About this document Modbusâ is a registered trademark of Schneider Automation Inc. Chrome ™ is a trademark of Google Inc. Firefoxâ is a registered trademark of Mozilla Foundation. Microsoftâ and Edgeâ are either registered trademarks or trademarks of Microsoft Corporation in the United States and/or other countries. -
Page 12: Product Overview
OPT100 User Guide M211858EN-U 2. Product overview 2.1 Overview of OPT100 Optimus DGA monitor Optimus DGA Monitor OPT100 is a device for monitoring the internal condition of an electrical transformer using dissolved gas analysis (DGA), also known as fault gas analysis. The device is intended to be installed next to the transformer, and connected to it by two oil lines. -
Page 13: Measured Parameters
Chapter 2 – Product overview 2.3 Measured parameters Table 4 Measured parameters Parameter Output unit(s) Description Methane (CH Measured from extracted gas Ethane (C Measured from extracted gas Ethylene (C Measured from extracted gas Acetylene (C Measured from extracted gas Carbon monoxide (CO) Measured from extracted gas Carbon dioxide (CO Measured from extracted gas... -
Page 14: Total Gas Pressure Measurement
OPT100 User Guide M211858EN-U Property Output unit(s) Description Gas ratios for: Ratio Ratio is calculated from 24 h average values of • CH the gases • C • C • C • C • CO 2.3.1 Total gas pressure measurement Total gas pressure (TGP) is measurement parameter introduced in software version 1.12.0. Total gas pressure is the total dissolved gas pressure of the sampled oil volume, measured by the DGA monitor as part of its normal measurement cycle. -
Page 15: Notes For Normal Operation
Chapter 2 – Product overview A is a water solubility coefficient. Vaisala uses this standard value in all of its oil moisture transmitters. You can also use this equation with an oil-specific coefficient if it has been determined for your oil. -
Page 16: Parts With Ground Mounting Set
OPT100 User Guide M211858EN-U 2.5 Parts with Ground Mounting Set Figure 1 OPT100 front parts with Ground Mounting Set Status LEDs OPT100 DGA Monitor Door lock (3 pcs) Power supply unit (OPTPSU) Door lock Mounting stand Wedge anchors (6 pcs) -
Page 17: Figure 2 Opt100 Rear Parts With Ground Mounting Set
Chapter 2 – Product overview Figure 2 OPT100 rear parts with Ground Mounting Set Weather shield Cable glands and oil connections for DGA Monitor Cable glands for power supply unit More information ‣ Dimensions with Ground Mounting Set (page 101) -
Page 18: Parts With Wall Mounting Set
OPT100 User Guide M211858EN-U 2.6 Parts with Wall Mounting Set Figure 3 OPT100 front parts with Wall Mounting Set Status LEDs OPT100 DGA Monitor Door lock (3 pcs) Power supply unit Door lock... -
Page 19: Figure 4 Opt100 Rear Parts With Wall Mounting Set
Chapter 2 – Product overview Figure 4 OPT100 rear parts with Wall Mounting Set Installation beam (upper) Weather shield Installation beam (lower) Cable glands for DGA Monitor Cradle for power supply unit Cable glands for power supply unit More information ‣ Dimensions with Wall Mounting Set (page 102) -
Page 20: Opt100 Cable Glands And Connectors
RS-485 RS-485 connection. 5 … 10 mm 20 mm (0.20 … 0.39 in) Relay control Relay control to OPTPSU. Use Vaisala cable 7 … 12 mm 24 mm CBL210539. (0.28 … 0.47 in) DC in DC input from OPTPSU. Use Vaisala cable 9 …... -
Page 21: Optpsu Cable Glands And Connectors
Chapter 2 – Product overview 2.8 OPTPSU cable glands and connectors Figure 6 Cable glands and connectors on OPTPSU power supply unit Label Description Cable diameter Wrench size Ground connection. 13 mm 4 … 16 mm (12 … 5 AWG) conductor AC in Mains power input. -
Page 22: Interior Parts
(0.28 … 0.47 in) DC out DC output to DGA monitor, 24 V DC, 20 A. 9 … 16 mm 30 mm Use Vaisala cable CBL210544. (0.35 … 0.63 in) 2.9 Interior parts Figure 7 Inside DGA monitor cabinet Valve 5 (bleed valve). Must be manually accessed during initialization and uninstallation. -
Page 23: Status Leds
Chapter 2 – Product overview Figure 8 Inside Power Supply Unit cabinet (OPTPSU1 and OPTPSU2) Circuit breaker for AC or DC power (F1) Surge arresters Power switch (S1) Power supply Relays (3 pcs). Each relay has a LED that is lit when the relay is active. DC OK LED. -
Page 24: Gas Level Alerts
OPT100 User Guide M211858EN-U Table 6 Status LEDs Color Meaning Green DGA monitor operates normally and performs measurement cycles. Green (flashing) DGA monitor is in standby mode, or running a service tool. Requires user interaction to begin measurement. Yellow DGA monitor requires user interaction. For example, a device warning is active, a service tool requires user input, or the DGA monitor is being initialized or uninstalled. -
Page 25: Modbus Protocol
2.13 DNP3 protocol DNP3 protocol is an optional feature and requires a license. If a license is not installed on the DGA monitor, you cannot enable the protocol. Contact Vaisala for acquiring the license. OPT100 DGA monitor provides the following functionality over DNP3 (Distributed Network Protocol): •... -
Page 26: Iec 61850 Protocol
2.14 IEC 61850 protocol IEC 61850 protocol is an optional feature and requires a license. If a license is not installed on the DGA monitor, you cannot enable the protocol. Contact Vaisala for acquiring the license. Data measured by DGA monitor can be read using IEC 61850 protocol over the external Ethernet connection. -
Page 27: Protocol Test Mode
Chapter 2 – Product overview 2.15 Protocol test mode Figure 10 Protocol test mode enabled Protocol test mode overrides the data that is available to communication protocols with arbitrary test data. The mode is useful for verifying proper handling of data and alarms when integrating the DGA monitor with a SCADA system. -
Page 28: Autocalibration
OPT100 User Guide M211858EN-U When the test mode is enabled, normal measurement operation of the DGA monitor continues in the background. Only the data available through the digital output protocols is affected. When the mode ends, real measurement data and alert status are again available through the protocols. - Page 29 Chapter 2 – Product overview Autocalibration type Description Notes Automatically started DGA monitor performs Ensures the long term accuracy autocalibration autocalibration when needed of measurement results as and when environmental measurement conditions conditions are suitable. change and transformer oil ages. Typical interval between autocalibrations is one month.
-
Page 30: User Interface
OPT100 User Guide M211858EN-U 3. User interface 3.1 Overview of user interface DGA monitor runs a web server on its processing unit. The web server provides the user interface of the DGA monitor. Access the user interface through Ethernet and a web browser; no special software is needed. - Page 31 Chapter 3 – User interface 4. Choose the appropriate user level: • Select Admin to perform installation and maintenance tasks. • Select User to view data without making changes to the system. 5. If logging in as Admin, enter the password. The unique administration password of the DGA monitor is included in the delivery documentation but note that it can be changed by the Admin after a successful login.
-
Page 32: User Interface Basics
OPT100 User Guide M211858EN-U 3.1.2 User interface basics Figure 11 Elements of the DGA monitor user interface Current time of the DGA monitor, adjusted to the browser's time zone. DGA monitor keeps UTC time (Coordinated Universal Time) internally. Name of the currently selected user interface page Navigation for subpages (if any) Status indicator Alert indicator... - Page 33 Chapter 3 – User interface 3.1.2.2 Alert indicator Alert indicator shows the presence of active alerts. The colors of the indicator change according to the severity of the most severe currently active alert: Light gray background: no active alerts. Orange background: gas caution or device warning active.
-
Page 34: Figure 12 Alert Summary Message Being Shown
OPT100 User Guide M211858EN-U Figure 12 Alert summary message being shown... -
Page 35: Measurements Page
Chapter 3 – User interface 3.1.3 Measurements page Measurements page provides views into the measurement data in graphical and tabular formats. Gas measurements tab shows the primary graph view. Figure 13 Measurement graph Graph area. Measurement data created during autocalibration is marked with a light blue background. -
Page 36: Figure 14 Measurement Graph For 1 Day Rate Of Change Values
OPT100 User Guide M211858EN-U Graph lines show empty gaps if data is missing from 2 consecutive measurement cycles or for more than 3 hours. Data may be missing for several reasons. For example, DGA monitor may have been turned off, in standby mode, or measurement cycles have not produced reliable results for some or all measurement parameters. -
Page 37: Figure 15 Total Gas Pressure Graph
Chapter 3 – User interface You can change the pressure unit that is used to display the graph on page Settings > Units. Figure 15 Total gas pressure graph... -
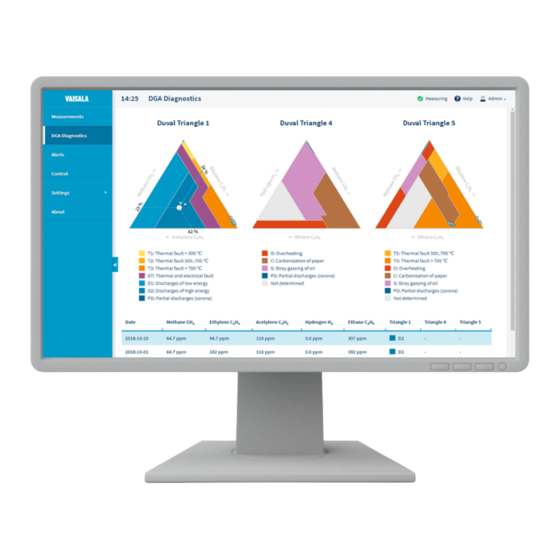
Page 38: Dga Diagnostics Page
(DGA) method for transformer fault diagnostics purposes, Duval Triangles (IEC 60599, Annex B). Customer acknowledges and agrees that Vaisala shall not assume any risk or liability in connection with the use or application of the diagnostics data by the Customer or any other user of such data. -
Page 39: Figure 17 Duval Triangles On The Dga Diagnostics Page
Chapter 3 – User interface DGA Diagnostics is an optional feature and requires a license. Contact Vaisala for acquiring the license. Figure 17 Duval triangles on the DGA diagnostics page DGA Diagnostics page shows the progression of selected data points from the past year overlaid on top of Duval triangles: •... -
Page 40: Alerts Page
OPT100 User Guide M211858EN-U • At least 5 reliable measurement points must exist in the previous 24 hours. Reliability criteria are the same as for gas alert functionality. • At least one of the following conditions is true: • Concentration of all triangle 1 gases is higher than OPT100 accuracy as listed in Table 10 (page 40) •... -
Page 41: Figure 19 Event Details For A Gas Caution Alert
Chapter 3 – User interface Alerts page shows the current alert status of the DGA monitor. 1. View number of currently active gas level alerts and device alerts by severity. 2. See Events section for more information on the individual alerts. By default, only active alerts are listed. -
Page 42: Control
OPT100 User Guide M211858EN-U 3.1.6 Control pages DGA Monitor page shows current status of the DGA monitor and contains the controls for initialization, starting and stopping the measurement, and uninstalling the DGA monitor. Only relevant controls are shown, and they can only be used by the Admin user. Figure 20 DGA monitor Control page... -
Page 43: Service
• Diagnostics package tool generates a diagnostic file package for use by Vaisala. The package can be used by Vaisala support to diagnose any issues you may have with the DGA monitor. • Bleeding tool is used to bleed excess gas out of the DGA monitor. Running this tool is only necessary if a device alert indicates the presence of excess gas in the system. -
Page 44: Figure 22 Service Tools Page
OPT100 User Guide M211858EN-U • Software update tool is on its own page. To update the software version of the DGA monitor, contact Vaisala helpdesk to get the software update file. Figure 22 Service tools page... -
Page 45: Settings
Chapter 3 – User interface 3.1.8 Settings pages Settings pages provide access to the configuration options of the DGA monitor. Settings can only be changed by the Admin user. Figure 23 Settings page 3.1.9 About page About page shows the serial number and software version of the DGA monitor. -
Page 46: Changing Administrator Password
If you are logged in as Admin you can Select View to see the software license texts of the open source components used in the DGA monitor software. Figure 24 About page 3.2 Changing administrator password CAUTION! If you forget your administrator password, contact Vaisala Support to reset it for you. -
Page 47: Figure 25 Changing Administrator Password
Chapter 3 – User interface Figure 25 Changing administrator password 1. Connect to the user interface as the Admin user. 2. In the top right corner, select Admin > Change password. 3. Enter the current password in Current password. 4. Enter the new password in New password and Confirm new password. The new password must be at least 8 characters long. -
Page 48: Starting Measurement
OPT100 User Guide M211858EN-U 3.3 Starting measurement In normal operation DGA monitor repeats the measurement cycle continuously. You can only start the measurement if DGA monitor is currently in standby. 1. Connect to the DGA monitor user interface and log in as an Admin user. 2. -
Page 49: Setting Date And Time
Chapter 3 – User interface 3. Enter a name for the device into Name. Maximum length is 64 characters. You can use alphanumerical characters, space, hyphen "-", and underscore "_". 4. Select Apply to save the name. More information ‣ Connecting to user interface (page 30) 3.5 Setting date and time Figure 27 Date and time settings page DGA monitor uses UTC (Coordinated Universal Time) internally. - Page 50 OPT100 User Guide M211858EN-U 3. To set date and time manually: a. Select Set time manually. b. Select or enter the current date into Date. The format is yyyy-mm-dd. c. Enter the current time into Time. The field is in 24-hour clock notation in format hh:mm.
-
Page 51: Configuring Unit Settings
Chapter 3 – User interface 3.6 Configuring unit settings Figure 28 Unit settings page 1. Connect to the user interface as the Admin user. 2. In the user interface, select Settings > Units. 3. Select the preferred unit to use for total gas pressure (hPa or psi). This selection only affects the viewing of the user interface and the downloading of data from the Latest values page. -
Page 52: Configuring Autocalibration
Figure 29 Autocalibration page Starting with software version 1.11.0, the DGA monitor performs autocalibration when needed and when environmental conditions are suitable. Vaisala recommends leaving this feature enabled, but Admin user can disable it from the Autocalibration page. Even if the automatically started autocalibration is disabled, the initial autocalibration will still run after the DGA monitor has been initialized. -
Page 53: Configuring Gas Level Alerts
Chapter 3 – User interface 3.8 Configuring gas level alerts Figure 30 Alert limits settings page Configure gas level alerts on the Alert limits settings page. There are separate rows for each individual gas level alert. Alerts for rate of change (ROC) values are on their own tabs. By default, all gas level alerts are off. -
Page 54: Muting Gas Level Alerts
OPT100 User Guide M211858EN-U 4. Select Apply to take the new alert limit settings into use. Changing gas alert settings will not immediately activate any new alerts. Gas alert status is updated only when the next measurement cycle results set is ready. -
Page 55: Configuring Network Connection
Chapter 3 – User interface Figure 31 Alert page with methane caution alert visible 3.10 Configuring network connection Figure 32 IP address settings page... -
Page 56: Configuring User Interface Security
OPT100 User Guide M211858EN-U Configure the network settings of the external Ethernet connection (ETH0). 1. Connect to the user interface as the Admin user. 2. In the user interface, select Settings > Network > IP address. 3. Select if the external Ethernet connection should be Enabled or Disabled. 4. - Page 57 To remove the notification, install a trusted TLS certificate (TLS 1.1 or 1.2) on the DGA monitor. However, note that HTTPS traffic is always encrypted even if the certificate is not trusted. Vaisala recommends using encrypted connections (HTTPS).
-
Page 58: Configuring Modbus Protocol
OPT100 User Guide M211858EN-U 3.12 Configuring Modbus protocol Figure 34 Modbus settings page 1. Connect to the user interface as the Admin user. 2. In the user interface, select Settings > Network > Modbus. 3. Select the connection type(s) for which Modbus protocol should be enabled. Select TCP (Ethernet), RTU (serial line), or both. -
Page 59: Configuring Dnp3 Protocol
Figure 35 DNP3 settings page DNP3 protocol is an optional feature and requires a license. If a license is not installed on the DGA monitor, you cannot enable the protocol. Contact Vaisala for acquiring the license. 1. Connect to the user interface as the Admin user. - Page 60 OPT100 User Guide M211858EN-U 4. If you enabled the DNP3 protocol, configure the following settings: Connection type Interface where DNP3 protocol will be available. Slave link address Address of this DGA monitor. Master link address Address of the DNP3 master. Default analog input variation Data format variation for analog input values.
-
Page 61: Configuring Iec 61850 Protocol
Figure 36 IEC 61850 settings page IEC 61850 protocol is an optional feature and requires a license. If a license is not installed on the DGA monitor, you cannot enable the protocol. Contact Vaisala for acquiring the license. 1. Connect to the user interface as the Admin user. -
Page 62: Using Protocol Test Mode
OPT100 User Guide M211858EN-U 3.15 Using protocol test mode Figure 37 Protocol test mode enabled 1. Connect to the user interface as the Admin user. 2. In the user interface, select Settings > Network > Protocol Test Mode. 3. Check the status of the protocols listed under Protocols. Make sure the protocols you want are enabled. -
Page 63: Configuring Relays
Chapter 3 – User interface 6. The test mode will end automatically after one hour. You can select a longer timeout from the drop-down menu marked Test mode timeout in. Select Update to take the new timeout into use. 7. Start testing by reading information from the DGA monitor from the SCADA system side. 8. -
Page 64: Configuring Offsets
OPT100 User Guide M211858EN-U 3. Each of the three relays is configured individually. For each relay: a. Select relay Mode: • In Normal mode, the relay is activated by the selected Trigger. • In Test mode, the relay activation is controlled manually from the Set test state buttons. -
Page 65: Figure 39 Configuring Offsets In Measurement Settings
Chapter 3 – User interface Figure 39 Configuring offsets in measurement settings • Apply saves changes. • Undo returns to previously applied offsets. • Clear removes configured offsets. 1. Go to Settings > Measurements > Offset. 2. Calculate offsets. Offsets can be increments or decrements. New offset is applied to the original measured values, not previously offset values. -
Page 66: Configuring Custom Averages
OPT100 User Guide M211858EN-U View offset values in Measurements page. Offset flag in the graphs shows when the newest offset has been applied. Offsets are added to measured values, 1 day averages, gas ratios and custom averages. Offset values are also shown in DGA Diagnostics. Figure 40 Offsets in Measurements If you have set gas level alerts, offsets may cause additional alarms. -
Page 67: Figure 41 Configuring Custom Averages In Measurement Settings
Chapter 3 – User interface Figure 41 Configuring custom averages in measurement settings 1. Go to Settings > Measurements > Averaging. 2. Enable custom averaging. 3. Select Hours or Measurement points. 4. Add values into Averaging fields as needed. If a field is left empty, custom average for the particular gas is not calculated. 5. -
Page 68: Deleting Data
OPT100 User Guide M211858EN-U View custom averages in Measurements page: Go to Gas measurements tab and select Custom averages in the dropdown menu. Avg flag in the graph shows when the custom average has been set. Figure 42 Custom averages in Measurements In Latest values tab, you can see custom average values in a separate column. -
Page 69: Figure 43 Deleting Measurement Data In Settings
Chapter 3 – User interface Figure 43 Deleting measurement data in settings 1. Go to Settings > Measurements > Delete data. 2. Select the date and time up to which you want to delete measurement data. 3. Press Delete. After pressing Delete, data cannot be restored. -
Page 70: Maintenance
OPT100 User Guide M211858EN-U 4. Maintenance 4.1 Maintenance safety WARNING! Keep away from live circuits. Operating personnel must observe safety regulations at all times. WARNING! Ground the DGA monitor cabinets as instructed in the wiring instructions. Verify the grounding before and after performing maintenance on the unit. -
Page 71: Maintenance
These updates are only applied to new measurement cycles after the update, which may cause some discontinuity in the measured gas levels even if the concentration of gases in the measured oil has not changed. Vaisala recommends starting autocalibration manually after a software update. - Page 72 OPT100 User Guide M211858EN-U 6. Select Upload to send the file to the DGA monitor. 7. DGA monitor verifies that the file was received successfully, and starts the update. The update may take up to 30 min. When the process is complete, a user interface message will show the result of the update.
-
Page 73: Starting Autocalibration Manually
If your OPT100 DGA monitor needs repair, note the following: • Make sure you have the latest product documentation before taking any actions. Check the OPT100 product page http://www.vaisala.com/opt100 for updates. • If a repair procedure you need is not available in the documentation, contact Vaisala for assistance. -
Page 74: Stopping Measurement
• Some repairs can only be performed by a Vaisala representative. • If OPT100 DGA Monitor is sent to Vaisala for repairs, use sufficient packing material to ensure safe shipping. Pay special attention to the connections at the bottom of the main cabinet. -
Page 75: Turning On Dga Monitor After Maintenance
Chapter 4 – Maintenance 2. If you have replaced any electrical components or wiring, verify that: • All components that are secured to a DIN rail are firmly in place. • There are no disconnected cables or loose wires. • All grounding wires are attached. •... -
Page 76: Uninstalling Dga Monitor
OPT100 User Guide M211858EN-U DGA monitor warms up during the first three measurement cycles. Measurements made during the warm-up cycles are not guaranteed to be within the accuracy specification. 4.7 Uninstalling DGA monitor • Adjustable wrench • Screwdriver with 3-mm-wide (0.12‑in) slotted head •... - Page 77 Chapter 4 – Maintenance 6. Select Control > Uninstall > OK. The user interface shows the uninstallation stages and approximate times between the stages. The time required for the preparation stage varies, and it may take up to 60 min before you are prompted to perform the next step.
- Page 78 OPT100 User Guide M211858EN-U 7. When instructed to do so, push in the gray knob on the side of the bleed valve, and turn it 90° clockwise to lock the valve manually. Select Continue from the user interface when done. 8.
- Page 79 Chapter 4 – Maintenance 10. When instructed to do so, disconnect oil pipes from the Oil In and Oil Out connections on the outside of the DGA monitor. Place the ends of the pipes in the waste oil container to collect the oil that drains out.
-
Page 80: Forcing Uninstallation
OPT100 User Guide M211858EN-U 20. Place the equipment door side up in the original packaging, if available. Safe lifting and carrying of the DGA monitor requires two people. If original packaging is not available: • Use double wall cardboard boxes. If both OPT100 DGA Monitor and OPTPSU power supply unit are sent, pack them in separate boxes. - Page 81 Chapter 4 – Maintenance 5. Select Forced uninstallation > OK. 6. Select Confirm. 7. Follow the instructions in the user interface. 8. After completing the forced uninstallation sequence, follow the normal uninstallation instructions from step 16 until the end of the procedure to safely disconnect and transport the device.
-
Page 82: Troubleshooting
OPT100 User Guide M211858EN-U 5. Troubleshooting 5.1 Problem situations Table 11 Troubleshooting table Problem Possible cause Solution Green status LED is flashing. DGA monitor is in standby Start the measurement mode. mode. Starting measurement (page 48). Yellow status LED is lit. A device warning is active. Log in to the user interface. -
Page 83: System Statuses
HTTPS traffic is always encrypted even if the certificate is not trusted. I am unable to log in to the user Forgotten password. Contact Vaisala. See Technical interface as Admin user. support (page 123). DGA monitor LED lights are off. Issue with the power supply. -
Page 84: Device Alerts
OPT100 User Guide M211858EN-U Table 12 System statuses Symbol and text Meaning Autocalibrating DGA monitor is performing autocalibration cycles. Autocalibration improves measurement performance by adapting the DGA monitor to transformer oil conditions. Autocalibration takes from 2 to 5 days depending on the conditions. -
Page 85: Table 13 Device Alerts
Contact Vaisala for support if you are unable to resolve a device alert yourself. From the Service page of the user interface you can create a diagnostic data file that can help Vaisala diagnose the device alert. It is recommended that you do this if your DGA monitor stops due to an error, regardless of if the error was successfully resolved. - Page 86 Set new time or enable time sync in the Settings > General page. If this error reoccurs, consider changing the backup battery of the real-time clock. Contact Vaisala support for help with changing the backup battery. 1502 Unable to read measurement...
- Page 87 The lower level sensor may be disconnected, malfunctioning, or broken. Check if the connections are functional or if the sensor needs to be replaced. Contact Vaisala support. More information ‣ Generating diagnostics package (page 89)
-
Page 88: Resolving Measurement Cycle Fault
OPT100 User Guide M211858EN-U 5.4 Resolving measurement cycle fault Figure 44 Measurement cycle fault active Measurement cycle fault (code 2099) device alert is activated when DGA monitor has detected a problem that prevents measurement, and has automatically stopped running measurement cycles. Possible causes include hardware failure and problems with the oil connection. -
Page 89: Generating Diagnostics Package
The diagnostic package can be used by Vaisala support to diagnose any issues you may have with the DGA monitor. The diagnostic data in the file is intended for use only by Vaisala. 1. Connect to the user interface as the Admin user. -
Page 90: Bleeding Dga Monitor
OPT100 User Guide M211858EN-U More information ‣ Connecting to user interface (page 30) 5.6 Bleeding DGA monitor • Cabinet key • 5-mm Allen key The DGA monitor can accumulate excess gases in the measurement system. This can happen, for example, because of an air leak in the oil lines. The DGA monitor detects excess gases and enables device alert code 2112, Excess gas in the system. - Page 91 Chapter 5 – Troubleshooting 3. Select Bleed > Start to start the bleeding sequence. The user interface will change to show the bleeding stages and approximate times between the stages. 4. Follow the progress and instructions on screen. While waiting, open the door of the DGA monitor cabinet and locate the bleed plug.
-
Page 92: Installing Configuration Package
• Configuration package file from Vaisala Installing the configuration package is not possible when the device is measuring. Installing the configuration package is only needed if requested by Vaisala. 1. If the device is measuring, stop measurement. 2. In the user interface go to Service > Configuration package. - Page 93 Chapter 5 – Troubleshooting 3. Select Install. 4. Select Browse and locate the configuration package file that you received from Vaisala. 5. Select Upload. The user interface informs you when the installation is completed. If the installation fails, contact Vaisala helpdesk. You can download the...
-
Page 94: Technical Specification
OPT100 User Guide M211858EN-U 6. Technical specification 6.1 OPT100 technical specification Table 14 OPT100 measurement specification Parameter Range 1) 2) Accuracy Repeatability Methane (CH 0 … 10 000 ppm ±4 ppm or ±5 % of 10 ppm or 5 % of reading reading Ethane (C 0 …... -
Page 95: Table 16 Opt100 Field Performance
Chapter 6 – Technical specification Property Description/Value Initialization time to full accuracy Two days Data storage At least 10 years Expected operating life > 15 years Three cycles for ethane and hydrogen. Table 16 OPT100 field performance Parameter Typical variance to laboratory DGA Acetylene (C ±1 ppm or ±10 % of reading Hydrogen (H... -
Page 96: Table 18 Opt100 Operating Environment
OPT100 User Guide M211858EN-U Table 18 OPT100 operating environment Property Description/Value Transformer oil type Mineral oil +125 °C (+257 °F) Required minimum fire point transformer oil Transformer oil pressure at oil inlet Max. 2 bar continuous Burst pressure 20 bar Transformer oil temperature at oil inlet Max. +100 °C (+212 °F) Ambient humidity range 0 …... - Page 97 Chapter 6 – Technical specification Property Description/Value Supported protocols Modbus RTU, DNP3 (optional feature) Galvanic isolation 2 kV RMS, 1 min Ethernet interface Connector Industrial RJ45 connector with protective plug (outside OPT100 housing) Supported protocols Modbus TCP, HTTP, HTTPS, DNP3 (optional feature), IEC 61850 (optional feature) Standard IEEE 802.3...
-
Page 98: Table 21 Opt100 Mechanical Specifications
Stainless steel Swagelokâ fitting for 10 mm (0.39 in) outer diameter tubing. See list of accessories for adapters available from Vaisala. Max. length of oil pipe to transformer Max. 10 m (33 ft) with 7 mm (0.28 in) inner diameter tubing Max. -
Page 99: Opt100 Accessories And Spare Parts
Chapter 6 – Technical specification Table 22 OPT100 compliance Property Description/Value EU directives and regulations EMC Directive (2014/30/EU) Low Voltage Directive (2014/35/EU) OPT100 is specifically designed to be installed as part of another type of equipment that is excluded from the RoHS directive (2011/65/EU) scope. - Page 100 OPT100 User Guide M211858EN-U Description Part number Solenoid valves OPTVALVEKITSP...
-
Page 101: Dimensions With Ground Mounting Set
Chapter 6 – Technical specification 6.3 Dimensions with Ground Mounting Set [in] [0.79] 510 [20.08] 675 [26.57] 453 [17.83] 550 [21.65] 400 [15.75] 350 [13.78] Figure 45 OPT100 dimensions with Ground Mounting Set... -
Page 102: Dimensions With Wall Mounting Set
OPT100 User Guide M211858EN-U 6.4 Dimensions with Wall Mounting Set [in] 675 [26.57] 467 [14.45] 550 [21.65] 400 [15.75] Figure 46 OPT100 dimensions with Wall Mounting Set... -
Page 103: Figure 47 Mounting Dimensions Of Installation Beams
Chapter 6 – Technical specification [in] Ø 8.50 holes for M8 anchors or bolts Installation beam symmetry lines Figure 47 Mounting dimensions of installation beams... -
Page 104: Appendix A: Modbus Reference
OPT100 User Guide M211858EN-U Appendix A. Modbus reference A.1 Default Modbus communication settings Table 25 Modbus TCP communication settings Property Specification IP address of Modbus server IP address of DGA monitor on interface ETH0 Modbus server port Table 26 Default Modbus RTU communication settings Property Specification Baud rate... -
Page 105: Modbus Registers
Appendix A – Modbus reference A complete 32-bit floating point or 32-bit integer value should be read and written in a single Modbus transaction. CAUTION! Reading the measurement data registers with incorrect floating point format setting may occasionally result in correct-looking, but nevertheless incorrect values. - Page 106 OPT100 User Guide M211858EN-U Register number Address Register Data format Unit and notes description 001C Carbon monoxide 32-bit float 001D 001E Carbon dioxide 32-bit float 001F 0020 Total dissolved 32-bit float combustible 0021 gases (TDCG) 0022 Hydrogen 32-bit float 0023 0024 Moisture in oil 32-bit float...
- Page 107 Appendix A – Modbus reference Register number Address Register Data format Unit and notes description 003A Carbon monoxide 32-bit float 003B 003C Carbon dioxide 32-bit float 003D 003E Total dissolved 32-bit float combustible 003F gases (TDCG) 0040 Hydrogen 32-bit float 0041 0042 Moisture in oil...
- Page 108 OPT100 User Guide M211858EN-U Register number Address Register Data format Unit and notes description 005E Hydrogen 32-bit float 005F Rate of change (ROC), 7 days 0064 Methane 32-bit float 0065 0066 Acetylene 32-bit float 0067 0068 Ethylene 32-bit float 0069 006A Ethane 32-bit float...
- Page 109 Appendix A – Modbus reference Register number Address Register Data format Unit and notes description 0080 Carbon monoxide 32-bit float 0081 0082 Carbon dioxide 32-bit float 0083 0084 Total dissolved 32-bit float combustible 0085 gases (TDCG) 0086 Hydrogen 32-bit float 0087 Gas ratios (24 hour average values) 008C...
- Page 110 OPT100 User Guide M211858EN-U Register number Address Register Data format Unit and notes description Custom averages 00AA Methane 32-bit float 00AB 00AC Acetylene 32-bit float 00AD 00AE Ethylene 32-bit float 00AF 00B0 Ethane 32-bit float 00B1 00B2 Carbon monoxide 32-bit float 00B3 00B4 Carbon dioxide...
-
Page 111: Alert Registers
Appendix A – Modbus reference Register number Address Register Data format Unit and notes description 00E1 Carbon dioxide 16-bit signed integer 00E2 Total dissolved 16-bit signed combustible integer gases (TDCG) 00E3 Hydrogen 16-bit signed integer 00E4 Moisture in oil 16-bit signed integer 00E5 Temperature of... -
Page 112: Table 29 Alert Registers (Read-Only)
OPT100 User Guide M211858EN-U Table 29 Alert registers (read-only) Register number Address Register Data format Bit order description 000A Gas level caution 16-bit field 0 = Methane alerts for present 1 = Acetylene values 2 = Ethylene 3 = Ethane 4 = Carbon monoxide 5 = Carbon dioxide... - Page 113 Appendix A – Modbus reference Register number Address Register Data format Bit order description 000C Gas level caution 16-bit field 0 = Methane alerts for 7 day 1 = Acetylene average ROC 2 = Ethylene values 3 = Ethane 4 = Carbon monoxide 5 = Carbon dioxide...
- Page 114 OPT100 User Guide M211858EN-U Register number Address Register Data format Bit order description 000E Gas level alarms 16-bit field 0 = Methane for present values 1 = Acetylene 2 = Ethylene 3 = Ethane 4 = Carbon monoxide 5 = Carbon dioxide 6 = TDCG 7 = Hydrogen...
-
Page 115: Status Registers
Appendix A – Modbus reference Register number Address Register Data format Bit order description 0010 Gas level alarms 16-bit field 0 = Methane for 7 day average 1 = Acetylene ROC values 2 = Ethylene 3 = Ethane 4 = Carbon monoxide 5 = Carbon dioxide... -
Page 116: Test Value Registers
OPT100 User Guide M211858EN-U Register Address Register description Data Notes number format 0002 Measurement reliability 16-bit field 0 = Measurement is unreliable because of high ambient temperature 1 = Measurement is reliable 0003 Gas alerts muted 16-bit field 0 = Gas level alerts operating normally 1 = Gas level alerts muted 0004... -
Page 117: Exception Responses
Appendix A – Modbus reference Register number Address Data format Test value 00D0 32-bit integer -1234567890 00D1 00D2 64-bit integer -1234567890123456789 00D3 00D4 00D5 00D6 32-bit float 1.23456 00D7 00D8 64-bit float 1.23456789 00D9 00DA 00DB A.5 Exception responses Table 32 Modbus exception responses Code Name Reason... -
Page 118: Modbus Communication Examples
OPT100 User Guide M211858EN-U A.6 Modbus communication examples Reading acetylene value Device address used in the following examples is 240 (F0 The values returned by the device differ depending on the measurement conditions. Your device may not return the same values. Request Bytes on the line (hexadecimal) Description... - Page 119 Appendix A – Modbus reference Response Modbus RTU checksum (silence for > 3.5 bytes) End of Modbus RTU frame Communication description Register number 23 (1-based Modbus register number) = address 0016 (0-based address used in actual communication). Data format Two 16-bit Modbus registers interpreted as IEEE 754 binary32 floating point value, least significant word first.
-
Page 121: Index
Index Index caution..............111 accessories.............. 99 configuring............53 alert indicator............33 deactivation............24 autocalibration..........28, 52 muting..............54 starting..............73 graphs............... 35 bleeding..............90 IEC 61850 protocol..........26 configuring............. 61 calculated parameters........... 13 calibration..............maintenance..............cleaning..............70 remote access............71 configuration package..........92 software update............ 71 connecting to user interface.......30 turning off.............. - Page 122 OPT100 User Guide M211858EN-U options............... 12 user interface........... 30, 32 OSS licenses............45 about page............45 alerts page............40 control page............42 parts DGA diagnostics page........38 cable glands............ 20, 21 general page............49 connectors............20, 21 network page............55 ground mounting set...........16 settings pages............45 interior..............
-
Page 123: Maintenance And Calibration Services
Maintenance and calibration services Vaisala offers comprehensive customer care throughout the life cycle of our measurement instruments and systems. Our factory services are provided worldwide with fast deliveries. For more information, see www.vaisala.com/ calibration. • Vaisala Online Store at store.vaisala.com is available for most countries. - Page 126 www. v aisala.com...
Need help?
Do you have a question about the Optimus OPT100 and is the answer not in the manual?
Questions and answers