
Related Manuals for BioLAB BSFL-103


Summary of Contents for BioLAB BSFL-103
- Page 1 Operation Manual BSFL-103 Fluorescence Spectrophotometer Thank you for Choosing Biolab products. Please read the “Operating Instructions” and “Warranty” before operating this unit to assure proper operation.
-
Page 2: Table Of Contents
Fluorescence Spectrophotometer BSFL-103 Index 1. Preface..............................03 2. Appearance and Performances of the Instrument ..........08 3. Operation of the Instrument.......................14 4. Installation of the Instrument......................19 5. Maintenance of the Instrument....................24 6. Environmental Requirements of Using Software and Installation.........26 7. Operation of Software........................27 8. -
Page 3: Preface
The amounts of the functions and the convenience of measuring vary with the different modes of measurement. For proper use of the BSFL-103 Fluorospectrophotometer, the user of the instrument should have a basic knowledge of using optical instruments and a basic knowledge of molecular fluorescence spectroscopy. - Page 4 Fluorescence Spectrophotometer BSFL-103 Alert Symbols of Safe Operation Symbol indicates important information of operating the instrument Please read carefully and operate according to the instructions following. This symbol indicates a potentially hazard to the electrical appliances through the operation, and indicates that a qualified professional man is needed to deal with such a hazard according to the corresponding procedures.
- Page 5 Fluorescence Spectrophotometer BSFL-103 Points for Attention to Operation 1. The BSFL-103 Fluorospectrophotometer is suitably used in a laboratory room to perform analytical measurements. If the instrument needs to be used at a worksite, the working environment of the worksite should accord with the demands of the laboratory environment basically.
- Page 6 Fluorescence Spectrophotometer BSFL-103 pass into the sample compartment. When a sample of unknown concentration is measured, PMT level should be set from low grade to high grade (1-17) gradually. 8. After PMT level is adjusted, the original set for zero-point of fluorescence should be checked and note that zero-point adjustment may be needed again.
-
Page 7: Appearance And Performances Of The Instrument
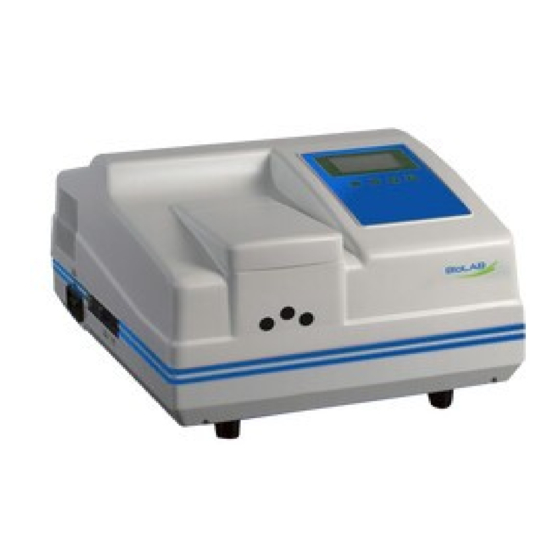
1. Appearance of the Complete Instrument and Main Components 1.138% The Complete InstrumentThe Complete Instrument Heat Dissipation Opening at the Top of the Instrument Heat Dissipation Fan Operating Panel Power Line Sample Compartment USB Interface RS232 Communication Connector Fig. 1-1 BSFL-103 Fluorospectrophotometer Main Unit www.biolabscientific.com... - Page 8 Fluorescence Spectrophotometer BSFL-103 Fig. 1-2 The Left Side View of BSFL-103 Fluorospectrophotometer Main Unit Sample Compartment (inside it a cell holder used to hold a sample cell), Power Switch (used to turn on/off the power source of the instrument), Fuse Holder (used to mount a fuse), Power Socket (used to interconnect a feed cable), Xenon Lamp Switch (used to turn on/off the Xenon lamp).
- Page 9 Fluorescence Spectrophotometer BSFL-103 2. Sample Compartment Filter Position Sample Cell Position Fig. 1-4 Sample Compartment and Quartz Sample Cell (10 mm) 3. Filter Fig. 1-5 Filter (center wavelength 365 nm) www.biolabscientific.com...
- Page 10 Fluorescence Spectrophotometer BSFL-103 1.2 Operating Panel of the Instrument Fig. 1-6 Operating Panel of BSFL-103 Fluorospectrophotometer Main Unit key, 2. key, 3. key, 4. key, 5. Display window. Print Normalise Print Mode www.biolabscientific.com...
- Page 11 Wavelength Power Source of Emission Photomultiplier Display Xenon Lamp Monolithic Monochromatoraton Processor 单色器 Board Preamplifier Negativ High Voltage Serial Interface Serial Printer Fig. 1-7 Signal Processing and Control System Optical System Fig. 1-8 Optical System Arrangement of BSFL-103 Fluorospectrophotometer www.biolabscientific.com...
- Page 12 Fluorescence Spectrophotometer BSFL-103 1.4 Measurement Functions of the Instrument 1.4.1 Working Modes of Measurement 1. Wavelength scan mode. At a fixed excitation wavelength a spectrum is obtained in which the fluorescent intensity of a sample varies with wavelength. 2. Time scan mode. At a fixed excitation wavelength, a spectrum is obtained in which the fluorescent intensity of a sample varies with time.
- Page 13 Fluorescence Spectrophotometer BSFL-103 1.5 Performance Index of the Instrument (Specifications) Light source 150W Xenon lamp (consumable part) Excitation filter Filter character: ±5nm labeled (An interference filter with center wavelength 365nm used as standard configuration. Users may separately purchase other φ25mm interference filters with center wavelength within 200―850nm...
-
Page 14: Operation Of The Instrument
First turn on the power source of the xenon lamp, and then turn on the power source of the BSFL-103 Fluorospectrophotometer main unit. The xenon lamp needs to stabilize for some time when it is lit. For precise measurement, the time should be 30 minutes over. - Page 15 Motor driver board error No obvious wave peak. The value from bottom to Self- Wavelength Wavelength error top and to bottom again, correcting Check if the sample cell is correcting shows a wave peak. empty Table 1-2 BSFL-103 Fluorospectrophotometer Initialization List www.biolabscientific.com...
- Page 16 (measuring with a single instrument, measuring with an on-line computer) of the instrument are separately different. When the BSFL-103 Fluorospectrophotometer main unit is connected with a computer, the selection of the different measuring modes and the operating methods are seen in detail in Section 7, Section 8 and Section 9 of Part Two.
- Page 17 Fluorescence Spectrophotometer BSFL-103 Fluorescence Value Mode. Wait till the value is stable. Press “Adj 0” to adjust the fluorescence value to zero(±0.1). Attention: Zero adjustment is not allowed in the following measurement. (4) Measurement for Standard Sample. Place a series of standard solutions (from dilute to concentrated) in the light path one by one.
- Page 18 2.3.3 Shutdown Instrument Turn off the power source of the BSFL-103 Fluorospectrophotometer main unit first, and then the power source of the xenon lamp. (The order is reverse to that of startup.) If in on-line mode, close the software first, then turn off the power source of the main unit, and turn off the Xenon lamp.
-
Page 19: Installation Of The Instrument
3.2 Unpacking for Checking The BSFL-103 Fluorospectrophotometer main unit and the computer or the main unit and the printer are packed with a fiberboard box. For long-distance transport, users may make a request for a wooden box as additional outer packing. - Page 20 Fluorescence Spectrophotometer BSFL-103 3.2.2 Unpacking for Counting Unpack at the position of adhesive seal tape. Take out the BSFL-103 Fluorospectrophotometer main unit carefully. (Please keep the outer packing so as to use it again when moving the instrument later. Check the main unit, the standard fittings, accessories purchased by choice and spare parts against the packing list.
- Page 21 3.3.3 Connecting the Power Cord Place the BSFL-103 Fluorospectrophotometer main unit and the computer or the printer on a sturdy working table, and they should be 10cm over away from the wall. Connect the power cord accompanied with the instrument to the electric supply socket of the laboratory room.
- Page 22 (5) Shutdown of Instrument After finishing the test, shut down the instrument. Please turn off the power source of the xenon lamp first. And then turn off the power source of the BSFL-103 Fluorospectrophotometer main unit . 2. Testing Mode by using the Instrument in Combination with an On-line Computer Finish the measurement for Raman Spectral Peak of water by using wavelength scan and time scan in the computer software.
- Page 23 Fluorescence Spectrophotometer BSFL-103 3.4.2 Checking Wavelength of the Instrument The instrument can automatically check the accuracy of indicated value of the instrument wavelength. If finding a mistake, may use a mercury-arc lamp to check (If there is no mercury- arc lamp, a fluorescent lamp can be used instead, but a professional man must be needed to do such work.
-
Page 24: Maintenance Of The Instrument
Fluorescence Spectrophotometer BSFL-103 Maintenance of the Instrument 4.1 Routine Maintenance 1. In routine operation, always check and make sure that the working conditions accord with the demands. If finding that the working conditions do not accord with the demands, should take measures without delay. - Page 25 Fluorescence Spectrophotometer BSFL-103 4. The xenon lamp should avoid being turned on/off repeatedly under a high voltage. Note: Because the life of the xenon lamp is closely related to the number of on-off of the lamp power source, the unnecessary number of turning on/off the xenon lamp should be cut down as far as possible.
-
Page 26: Environmental Requirements Of Using Software And Installation
While the computer is running, it is necessary to turn off the screen saver and to turn off power management in the BIOS program to ensure that the “Data processing software package of BSFL-103 Fluorospectrophotometer” (“ Software “ for shorter, the same below) can run normally. -
Page 27: Operation Of Software
6.1.1 Connection of BSFL-103 Main Unit with a Computer The BSFL-103 main unit is connected through a USB port of a computer. The USB driver will be installed when the first time connected. Please run the software after the installation is finished. - Page 28 Fluorescence Spectrophotometer BSFL-103 EM Wavelength Fluor. Storage Fluor. Fig. 2-1 Interface of Wavelength Scan Wavelength Scan Fig. 2-2 Switchover of Working Mode 6.2 Three Interfaces of Working Mode There are Three Interfaces of Working Mode, namely the interface of wavelength scan, the interface of time scan and the interface of quantitative analysis.
- Page 29 Fluorescence Spectrophotometer BSFL-103 6.2.1 The Interface of Wavelength Scan Wavelength scan means that in the conditions of selected excitation source (namely at excitation wavelength) people measure the fluorescent intensity which varies with fluorescent emission wavelength, that is, plot the fluorescence spectrum of a sample component.
- Page 30 Fluorescence Spectrophotometer BSFL-103 6.2.3 The Interface of Quantitative Analysis Quantitative analysis means that in the conditions of selected excitation source (namely at excitation wavelength) by measuring the fluorescent emission intensity (F) of the component (its unknown concentration C) to be determined, from the formula F=KC, the concentration of the component to be determined is acquired.
-
Page 31: Operation Of Wavelength Scan Mode (Connected With A Computer)
Fluorescence Spectrophotometer BSFL-103 Operation of Wavelength Scan Mode (Connected with a Computer) 7.1 The Interface of Wavelength Scan Mode On completion of initialization for the instrument, the interface of wavelength shown in Fig.2- 5 is immediately displayed. The first row at the top of screen is Menu Bar. In the second row are 15 “Shortcut Icons”. - Page 32 Fluorescence Spectrophotometer BSFL-103 “Adjust Zero” is the button for zero adjustment of the current value. It is used to deduct a background value. “PMT(Level 1)” is the button for PMT level adjustment. Select a proper PMT level(1-17) in the pop-out window. Then click OK.
- Page 33 Fluorescence Spectrophotometer BSFL-103 ---“Show P/V Data” button means to display the values of peak & valley in a spectrum after peak & valley detection. ---“Print” button means to print out a spectrum and data. ---“Exit System” button means to close F96 Software.
- Page 34 Fluorescence Spectrophotometer BSFL-103 Fig. 2-6 Interface of Wavelength Scan Parameter 1. EM Start. Set the start wavelength of scan. 2. EM End. Set the end wavelength of scan. 3. Y Axis Min. Set the minimum of Y axis in the scan spectrum.
- Page 35 Fluorescence Spectrophotometer BSFL-103 Fig. 2-7 Interface of Wavelength Scan Parameter – Replicate Scan Settings 12.Delay. Set the Delay between two scans. 13.Autosave Filename. Edit the filename of spectrum. The software will automatically add the current time of scan after the filename.
- Page 36 Fluorescence Spectrophotometer BSFL-103 7.2.2 Spectrum Processing Clicking the “Spectrum” button from Menu Bar in Fig.2-5 presents a pull-down sub-menu as shown in Fig.2-9. 1.Zoom. This means to reduce or enlarge a spectrum. After clicking this item you only need to input the scale data of a new spectrum.
- Page 37 Fluorescence Spectrophotometer BSFL-103 Fig. 2-10 Interface of Arithmetic Operation 7.Sigma. After clicking this item, input “Lambda Start” and “Lambda End”, and then click the “Sigma” button. You will get the integral value of fluorescence within the range of set wavelength.
- Page 38 Fluorescence Spectrophotometer BSFL-103 7.2.1 Save Processing Click “File” in Fig.2-5 and a pull-down sub-menu is shown in Fig.2-11. Fig. 2-11 Save Processing Sub-menu 1. Select Channel. 10 channels (storage windows) altogether are provided for selection. Program can separately open 10 storage windows of wavelength scan or time scan at most for users’...
-
Page 39: Operation Of Time Scanning Mode (When Connected With A Computer)
Fluorescence Spectrophotometer BSFL-103 9. Show Parameter. Display the parameters in the current channel. 10.Research Zero. This function will do wavelength correct of emission monochromator using grating zero order light. 7.2.4 Display Setting Click “View” in Fig.2-5. A pull-down sub-menu is shown in Fig.2-12. - Page 40 Fluorescence Spectrophotometer BSFL-103 menu and the interface of wavelength can be changed to the interface of time scan. See Fig.2- The time scan interface is the same as that of wavelength scan interface except for the unit of X-axis. The functions of the shortcuts are also the same. For more details, please turn to Section 7.1.
- Page 41 Fluorescence Spectrophotometer BSFL-103 Fig.2-14 Time Scan Parameter Settings – Replicate Scan 11.Delay. Set the delay time between two scans. 12.Auto Saved Name. Edit the filename of spectrum. The software will automatically add the current time of scan after the filename.
-
Page 42: Operation Of Quantitative Analysis Mode (When Connected With A Computer)
Fluorescence Spectrophotometer BSFL-103 Operation of Quantitative Analysis Mode (When connected with a Computer) 9.1 Interface of Quantitative Analysis Mode Click “Working Mode” on the upper left screen. The interface of quantitative analysis mode from the pull-down menu will appear as shown in Fig.2-15 Fig. - Page 43 Fluorescence Spectrophotometer BSFL-103 Fig. 2-16 Shortcuts in the Interface of Quantitative Analysis 9.1.1 The Functions of Short cuts on the Bottom of the Screen The “Set Standard” button is used to set standard sample. After clicking it, a “Set Standard Sample”...
- Page 44 Fluorescence Spectrophotometer BSFL-103 9.1.2 The Functions of Shortcuts of Icon When the mouse pointer is moved onto a shortcut of icon, the functions of the shortcut of icon will show. Icons are arranged in order from left to right. The functions are described bellow.
- Page 45 Fluorescence Spectrophotometer BSFL-103 9.1.3 Menu on the Top of the Screen Menu on the top of the screen has columns such as “Analysis Mode”, “Set Parameter”, “Curve Type”, “Spectrum”, “Data”. 1. Analysis Mode This feature has not been activated yet.
- Page 46 Fluorescence Spectrophotometer BSFL-103 Click “Input Coefs.” in “Curve Type” menu. ① Click “Set Working Curve Parameter” icon. “Input Coefficient” dialog appears. After ② inputting coefficients “K0” and “K1” separately, click “OK” (In linear curve “K0” represents intercept and “K1” represents slope.). Thus an equation of the working curve is created and can be used for measuring a sample.
- Page 47 Fluorescence Spectrophotometer BSFL-103 a dialog box will appear. Enter a name of the file and click “Save”. ⑾ Save File As. Save the data in the quantitation files onto the hard disk. Rename the new file and click “Save”. ⑿...
- Page 48 Fluorescence Spectrophotometer BSFL-103 9.2.3 Zero-point Adjustment Place the blank solution into the light path. Click the “Adjust Zero” button (See Fig.2-19). At this time the fluorescence value on the upper right of the interface becomes 0.0. 9.2.4 Standard Sample Setting After clicking the “Set Standard.”...
- Page 49 Fluorescence Spectrophotometer BSFL-103 9.2.5 Measurement of Standard Samples In the “Standard Samples” in the interface of quantitative analysis, 5 rows of data of standard samples input in are listed respectively (See Fig.2-19). When measuring, put the No.1 standard sample into the sample compartment. Then double click the row of the No.1 standard sample.
-
Page 50: Appendix: Data Processing With Microsoft Excel 2000
Fluorescence Spectrophotometer BSFL-103 Appendix: Data Processing with Microsoft Excel 2000 Data Processing with Microsoft Excel 2000 Software Experimental data processing of fluorophotometry by using Excel 2000 Software. Open Microsoft Excel 2000 software. The interface of the software will be displayed on the screen of the computer. - Page 51 Fluorescence Spectrophotometer BSFL-103 2. Enter the Chart Wizard System (1) Preview Generated Graphics. Click the “Chart Wizard” button on the interface of Excel to go into “Chart Wizard 4-Procedure 1”. From “Chart Types” on the “Standard Types” page, select “XY Scatter Chart”. From the sub-chart types, select “Scatter Charts with Smooth Lines”.
- Page 52 Fluorescence Spectrophotometer BSFL-103 4. Measurement of Unknown Sample Under the same condition measure the fluorescent intensity of unknown sample solution. Comparing the fluorescence value with that in the above standard curve, or putting the value into the fitting equation, you may obtain the concentration of riboflavin in the unknown sample.
- Page 53 Fluorescence Spectrophotometer BSFL-103 BIOLAB SCIENTIFIC LTD. 3660 Midland Avenue, Suite 300, Toronto, Ontario M1V 0B8 Canada Email: contact@biolabscientific.com Tel: +1 707 533 1445 Website: www.biolabscientific.com www.biolabscientific.com...
Need help?
Do you have a question about the BSFL-103 and is the answer not in the manual?
Questions and answers