Table of Contents
Advertisement
Quick Links
Advertisement
Table of Contents

Related Manuals for RigExpert AA-170


Summary of Contents for RigExpert AA-170
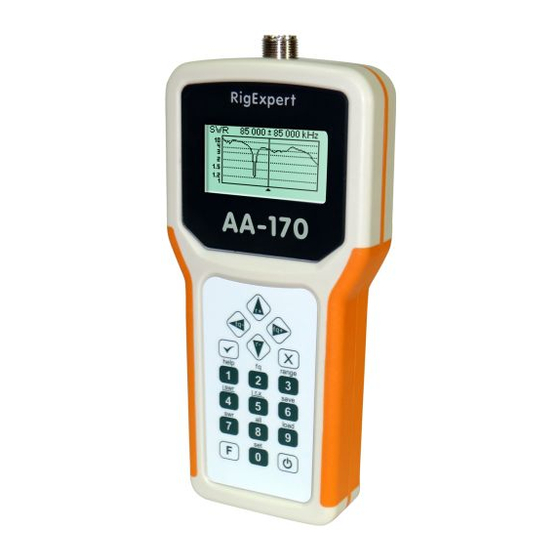
- Page 1 ® RigExpert AA-170 Antenna Analyzer (0.1 to 170 MHz) User’s manual...
-
Page 2: Table Of Contents
Table of contents 1. Description ......................3 2. Specifications ....................... 4 3. Precautions......................5 4. Operation......................6 4.1. Preparation for use ..................6 4.2. Turning the analyzer on or off................ 6 4.3. Main menu ..................... 7 4.4. Single- and multi-point measurement modes..........7 4.4.1. -
Page 3: Description
1. Description RigExpert AA-170 is a powerful antenna analyzer designed for testing, checking, tuning or repairing antennas and antenna feedlines. Graphical SWR (Standing Wave Ratio) and impedance display are key features of this analyzer which significantly reduce the time required to adjust an antenna. -
Page 4: Specifications
2. Specifications Frequency range: 0.1 to 170 MHz Frequency entry: 1 kHz resolution SWR measurement range: 1 to 10 SWR measurement for 50 and 75-Ohm systems SWR display: numerical or easily-readable bar R and X range: 0…1000, -1000…1000 in numerical mode, 0…200, -200…200 in graph mode Display modes: - SWR at single or multiple frequencies... -
Page 5: Precautions
3. Precautions Never connect the analyzer to your antenna in thunderstorms. Lightning strikes as well as static discharge may kill the operator. Never leave the analyzer connected to your antenna after you finished operating it. Occasional lightning strikes or nearby transmitters may permanently damage it. -
Page 6: Operation
When this button is pressed, firmware version number as well as battery voltage are displayed on the LCD. The on-screen menu system of RigExpert antenna analyzers provides a simple but effective way to control the entire device. -
Page 7: Main Menu
• The USB icon is displayed when the analyzer is plugged to a personal computer or to a DC adapter with USB socket. RigExpert antenna analyzers are self-documenting: pressing the key will bring a help screen with a list of available keys for the current mode. -
Page 8: Swr Mode
Pressing the key will show a list of other commands. 4.4.2. MultiSWR mode RigExpert AA-170 has an ability to display SWR for up to five different frequencies at a time. Numerical display Bars You may use this feature to tune multi-band antennas. -
Page 9: Show All" Mode
• In the parallel model, impedance is expressed as resistance and reactance connected in parallel: 4.5. Graph modes A key feature of RigExpert antenna analyzers is ability to display various parameters of a load graphically. Graphs are especially useful to view the behavior of these parameters over the specified frequency band. -
Page 10: Swr Graph
4.5.1. SWR graph In the SWR graph mode (press the key in the Main menu), values of the Standing Wave Ratio are plotted over the specified frequency range: You may set the center frequency (the key) or scanning range (the key). -
Page 11: Data Screen
4.5.3. Data screen In the SWR graph and R,X graph modes, press the combination to display various parameters at cursor: 4.5.4. Memory operation In the SWR graph and R,X graph modes, you may choose to scan to memory (the key). There are 100 independent memory slots. Later, you may recall ( ) the plots from the specified memory. - Page 12 – reference impedance selection for SWR measurement: 50 or 75 Ohm; – select series or parallel model of load; – go to the third page of settings which contains various test commands used for fast checking of the entire analyzer. –...
- Page 13 If the bars are not filled at all, the RF output stage or/and the detector are not working properly in the analyzer. – detector output voltage vs. frequency graph. With no load at the antenna connector, the display should look like shown on the picture: The voltage curve should stay between the horizontal dotted lines.
-
Page 14: Computer Connection
– go to the first page of settings. 4.7. Computer connection RigExpert antenna analyzers may be connected to a personal computer for displaying measurement results on its screen, taking screen shots of the LCD, as well as for updating the firmware. -
Page 15: Applications
5. Applications 5.1. Antennas 5.1.1. Checking the antenna It is a good idea to check an antenna before connecting it to the receiving or transmitting equipment. The SWR graph mode is good for this purpose: The above picture shows SWR graph of an HF antenna. The operating frequency is 7.1 MHz. -
Page 16: Coaxial Lines
Physical dimensions of a simple antenna (such as a dipole) can be adjusted knowing the actual resonant frequency and the desired one. Other types of antennas may contain more than one element to adjust (including coils, filters, etc.), so this method will not work. Instead, you may use the SWR mode or the Show all mode to continuously see the results while adjusting various parameters of the antenna. - Page 17 Each type of cable has different velocity factor: for instance, for RG-58 it is 0.66. Notice that this parameter may vary depending on the manufacturing process and materials the cable is made of. To measure the physical length of a cable, 1.
-
Page 18: Velocity Factor Measurement
5.2.3. Velocity factor measurement For a known resonant frequency and physical length of a cable, the actual value of the velocity factor can be easily measured: 1. Locate a resonant frequency as described above. Example: 10.09 meters (33.10 feet) of open-circuited cable. Resonant frequency is 4835 kHz at the 1/4-wave point. -
Page 19: Making 1/4-Λ, 1/2-Λ And Other Coaxial Stubs
5.2.5. Making 1/4-λ, 1/2-λ and other coaxial stubs Pieces of cable of certain electrical length are often used as components of baluns (balancing units), transmission line transformers or delay lines. To make a stub of the predetermined electrical length, 1. Calculate the physical length. Divide the electromagnetic constant by the required frequency (in Hz). -
Page 20: Measuring The Characteristic Impedance
5.2.6. Measuring the characteristic impedance The characteristic impedance is one of the main parameters of any coaxial cable. Usually, its value is printed on the cable by the manufacturer. However, in certain cases the exact value of the characteristic impedance is unknown or is in question. To measure the characteristic impedance of a cable, 1. -
Page 21: Measurement Of Other Elements
Example 2: sqrt (75.2 · 52.1) = 62.6 Ohm 5.3. Measurement of other elements Although RigExpert antenna analyzers are designed for use with antennas and antenna- feeder paths, they may be successfully used to measure parameters of other RF elements. -
Page 22: Transformers
Unknown inductor 5.3.2. Transformers RigExpert analyzers can also be used for checking RF transformers. Connect a 50 Ohm resistor to the secondary coil (for 1:1 transformers) and use SWR graph or R,X graph modes to check the frequency response of the transformer. Similarly, use resistors with other values for non-1:1 transformers. -
Page 23: Rf Signal Generator
5.4. RF signal generator The output signal of the AA-170 has rectangular waveform and level of about -10 dBm (at the 50 Ohm load). Therefore this analyzer can be used as a source of RF signal for various purposes. - Page 24 Copyright © 2007-2013 Rig Expert Ukraine Ltd. http://www.rigexpert.com RigExpert is a registered trademark of Rig Expert Ukraine Ltd. Printed in Ukraine 15-Jan-2013, firmware ver. 201...
Need help?
Do you have a question about the AA-170 and is the answer not in the manual?
Questions and answers