Sign In
Upload
Download
Table of Contents
Contents
Add to my manuals
Delete from my manuals
Share
URL of this page:
HTML Link:
Bookmark this page
Add
Manual will be automatically added to "My Manuals"
Print this page
×
Bookmark added
×
Added to my manuals
Manuals
Brands
RigExpert Manuals
Measuring Instruments
AA-600
User manual
RigExpert AA-600 User Manual
Antenna analyzer 0.1 to 600 mhz; 0.1 to 1000 mhz; 0.1 to 1400 mhz
Hide thumbs
1
2
Table Of Contents
3
4
5
6
7
8
9
10
11
12
13
14
15
16
17
18
19
20
21
22
23
24
25
26
27
28
29
30
31
32
33
34
35
36
37
38
39
40
page
of
40
Go
/
40
Contents
Table of Contents
Troubleshooting
Bookmarks
Table of Contents
Table of Contents
1 Description
2 Specifications
3 Precautions
4 Operation
Preparation for Use
Turning the Analyzer on or off
Main Menu
Single- and Multi-Point Measurement Modes
SWR Mode
Swr2Air Mode
Multiswr Mode
Show All Mode
Graph Modes
SWR Graph
R,X Graph
Smith/Polar Chart
Data Screen
Memory Operation
Calibration
TDR (Time Domain Reflectometer) Mode
Theory
Practice
Settings Menu
Computer Connection
5 Applications
Antennas
Checking the Antenna
Adjusting the Antenna
Coaxial Lines
Open- and Short-Circuited Cables
Cable Length Measurement
Velocity Factor Measurement
Cable Fault Location
Making 1/4-Λ, 1/2-Λ and Other Coaxial Stubs
Measuring the Characteristic Impedance
Measurement of Other Elements
Capacitors and Inductors
Transformers
Traps
RF Signal Generator
6 Troubleshooting
Advertisement
Quick Links
1
Specifications
2
Calibration
3
Troubleshooting
Download this manual
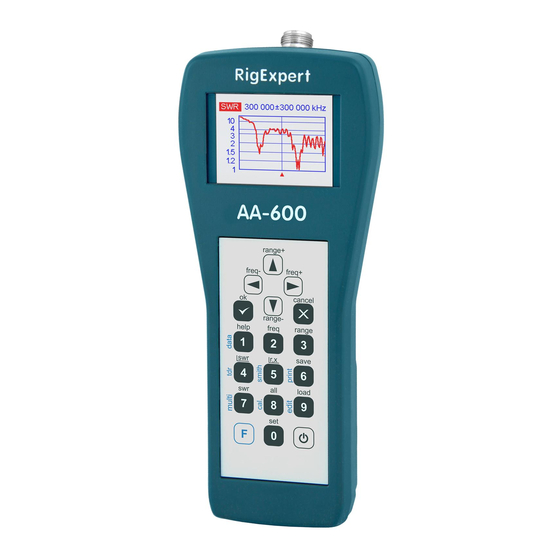
RigExpert
AA-600
Antenna Analyzer
0.1 to 600 MHz
AA-1000
Antenna Analyzer
0.1 to 1000 MHz
AA-1400
Antenna Analyzer
0.1 to 1400 MHz
User's manual
®
Table of
Contents
Previous
Page
Next
Page
1
2
3
4
5
Advertisement
Table of Contents
Need help?
Do you have a question about the AA-600 and is the answer not in the manual?
Ask a question
Questions and answers
Related Manuals for RigExpert AA-600
Measuring Instruments RigExpert AA-30 User Manual
Antenna analyzer (24 pages)
Measuring Instruments RigExpert AA-54 User Manual
Antenna analyzer (24 pages)
Measuring Instruments RigExpert AA-1400 User Manual
Antenna analyzer 0.1 to 600 mhz; 0.1 to 1000 mhz; 0.1 to 1400 mhz (40 pages)
Measuring Instruments RigExpert AA-1000 User Manual
Antenna analyzer 0.1 to 600 mhz; 0.1 to 1000 mhz; 0.1 to 1400 mhz (40 pages)
Measuring Instruments RigExpert AA-35 ZOOM User Manual
Antenna and cable analyzer (28 pages)
Measuring Instruments RigExpert AA-35 ZOOM User Manual
Antenna and cable analyzer (28 pages)
Measuring Instruments RigExpert AA-200 User Manual
Antenna analyzers (21 pages)
Measuring Instruments RigExpert AA-500 User Manual
Antenna analyzers (21 pages)
Measuring Instruments RigExpert AA-55 ZOOM Software Manual
Zoom series antenna and cable analyzer (20 pages)
Measuring Instruments RigExpert AA-230 ZOOM Software Manual
Antenna and cable analyzer (22 pages)
Measuring Instruments RigExpert AA-2000 ZOOM User Manual
Antenna and cable analyzers (40 pages)
Measuring Instruments RigExpert AA-650 ZOOM User Manual
Antenna and cable analyzers (40 pages)
Measuring Instruments RigExpert AA-1500 ZOOM User Manual
Antenna and cable analyzers (40 pages)
Measuring Instruments RigExpert AA-170 User Manual
Antenna analyzer (0.1 to 170 mhz) (24 pages)
Measuring Instruments RigExpert AA-3000 ZOOM User Manual
(44 pages)
Measuring Instruments RigExpert Stick Pro User Manual
(9 pages)
This manual is also suitable for:
Aa-1400
Aa-1000
Table of Contents
Save PDF
Print
Rename the bookmark
Delete bookmark?
Delete from my manuals?
Login
Sign In
OR
Sign in with Facebook
Sign in with Google
Upload manual
Upload from disk
Upload from URL


Need help?
Do you have a question about the AA-600 and is the answer not in the manual?
Questions and answers