
Related Manuals for Abov E-OCD II


Summary of Contents for Abov E-OCD II
- Page 1 E-OCD II Debugger User’s Manual Version 1.0.2 Global Top Smart MCU Innovator, ABOV Semiconductor www.abovsemi.com...
-
Page 2: Table Of Contents
Contents E-OCD II User’s Manual Contents Introduction ............................ 4 E-OCD II The Chip and Onboard Debugging Solution ............4 1.1.1 Software Requirements ..................4 1.1.2 Hardware Requirements ..................4 Software Installation ......................5 Hardware Driver Detection ....................11 1.3.1 Human Interface Devices ..................11 E-OCD II Interface Hardware ....................... - Page 3 ABOV’s SDK DLL Connections ..................82 IAR Project Settings ......................83 Download Hex File ......................85 Cautions for Debugging ....................87 SDK DLL Compatibility According to IAR Versions ............89 Appendix: E-OCD II Isolator Interface ..................90 Revision history ............................. 91...
-
Page 4: Introduction
E-OCD II The Chip and Onboard Debugging Solution E-OCD II is short for ‘Enhanced On-Chip Debugger’. E-OCD II is a debugger tool for ABOV 8bit MCU. E-OCD II is MCU debugging control via 2pin or 3pin (added RunFlag) OCD interface. E-OCD II is dedicated to onboard programming and debugging via serial interfaces (DSCL, DSDA). -
Page 5: Software Installation
The installer program can be downloaded from the ABOV website. It is recommended that the latest version of the E-OCD II software be used because ABOV constantly adds newer devices and features. Both 32-bit and 64-bit versions are available. To check the operating system details of the PC, open the Control Panel and click on the System icon. - Page 6 Introduction E-OCD II Debugger User’s Manual To install the E-OCD II software, perform the following: Execute the installer. The 32-bit installer file name starts with ‘Setup32_’ keyword. The 64-bit installer file name starts with ‘Setup64_’ keyword. [64-bit systems only] Once the warning message below message box, click ‘Yes’.
- Page 7 E-OCD II Debugger User’s Manual Introduction Read the license agreement. If agree, select I accept the items of the license agreement on the license agreement dialog box and click ‘Next’. Figure 1-4 License Agreement Enter the ‘User Name’ and ‘Company Name’ and click ‘Next’.
- Page 8 Introduction E-OCD II Debugger User’s Manual Select ‘Complete’ and click ‘Next’. Figure 1-6 Select a Setup Type Click ‘Install’. Figure 1-7 Begin the Installation...
- Page 9 E-OCD II Debugger User’s Manual Introduction Wait until all the application components are installed. Figure 1-8 Installing Click Finish to complete the installation. Figure 1-9 InstallShield Wizard Complete...
- Page 10 Introduction E-OCD II Debugger User’s Manual Note the installation folder path. This information is needed when you install the hardware driver. 32-bit: C:\Program Files\ABOV Semiconductor\OCD II_debugger32 64-bit: C:\Program Files (x86)\ABOV Semiconductor\OCD II_debugger64...
-
Page 11: Hardware Driver Detection
E-OCD II USB type is HID (Human Interface Devices). Windows of Microsoft support HID USB Driver. So when E-OCD II debugger is connected to computer, HID USB Driver is installed to the computer and user can use E-OCD II debugger automatically. - Page 12 Introduction E-OCD II Debugger User’s Manual Find Human Interface Devices in list. Figure 1-11 Device Manager : HID Check HID properties to confirm E-OCD II Hardware Vendor ID Figure 1-12 Device Manager : HID Properties...
- Page 13 E-OCD II Debugger User’s Manual Introduction Select Hardware Ids in Detail Tap of HID properties. Figure 1-13 HID-compliant Device Properties E-OCD II Hardware vendor ID is 0x1A29. If VID_1A29 is searched, E-OCD II is connected properly. Figure 1-14 HID-compliant Device Properties : Hardware Ids...
-
Page 14: Ocd Ii Interface Hardware
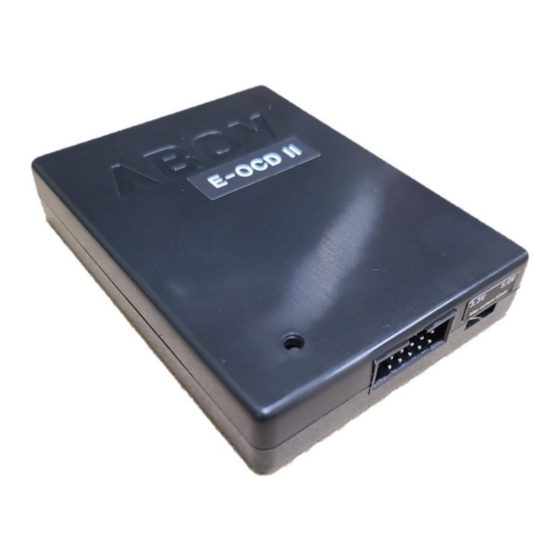
E-OCD II Interface Hardware E-OCD II Interface The E-OCD II interface supports ABOV 8-bit MCUs that use either the OCD or OCD II interface logic. So, the user can perform debugging for both OCD and OCD II-compatible MCU series using this hardware. -
Page 15: E-Ocd H/W Connection
E-OCD II Debugger User’s Manual E-OCD II Interface Hardware Two LEDs for ‘Power’ and ‘Debug Run’ Not support hot plugging Note : The target system must not be powered during insertion or release of the OCD interface 2.1.2... -
Page 16: Hardware Connection/Disconnection Procedures
2.1.4 E-OCD II Interface Connection The E-OCD II interface supports both the OCD and OCD II interfaces. But since the OCD and OCD II interface protocols are not compatible with one another, the target protocol must be selected first. Even if the target MCU uses the OCD or OCD II interface, it does not enter debug mode if the procedure below is not correctly followed: Power off the target system. -
Page 17: E-Ocd Ii Interface Disconnection
E-OCD II Power Out to Target System E-OCD II can Power out to target system two types of voltages(3.3V, 5.0V). User can select the output voltage using a switch on E-OCD II. And then push the power button icon on OCD debugger program. -
Page 18: Debugger Software (For Microsoft Windows)
ABOV debugger type(E-OCD II, OCD, OCD II debugger). Figure 3-1 Debugger Program The ‘power icon’ is black off when the E-OCD II is first connected to the PC Figure 3-2 Toolbar : Power Icon When the ‘power icon’ is selected, the icon color is changed and the power voltage is output - The output voltage can be changed with E-OCD II switch (3.3V or 5.0V) -
Page 19: Common Features
Figure 3-5 Device Recognition Common Features The debugger software supports the MC9x/A9x series developed by ABOV Semiconductor Co., Ltd. The following features are provided, regardless of whether the OCD or OCD II interface is used: Detect the target device automatically ... - Page 20 Debugger Software (for Microsoft Windows) E-OCD II Debugger User’s Manual Support the following emulation methods : - Real-time emulation - Step emulation (source line level or code level) - Emulation abortion Save and load the most recent debugging environment automatically.
-
Page 21: Menu Descriptions
E-OCD II Debugger User’s Manual Debugger Software (for Microsoft Windows) Menu Descriptions This section introduces an overview of the menu items. Figure 3-6 Debugger Program... -
Page 22: File
Debugger Software (for Microsoft Windows) E-OCD II Debugger User’s Manual 3.3.1 File The File menu includes the following items: Figure 3-7 Menu 'File' Open… : Open the selected local text file in a child text window. The shortcut key is Ctrl + O. -
Page 23: View
E-OCD II Debugger User’s Manual Debugger Software (for Microsoft Windows) 3.3.2 View The View menu controls the display of the debugger software frame and child windows. Figure 3-8 Menu : View Dockable Windows : Shows or hides a variety of child views. Only selected child views are opened. - Page 24 Debugger Software (for Microsoft Windows) E-OCD II Debugger User’s Manual Figure 3-10 Customize : Commands The Toolbars tab offers a Toolbar style. Figure 3-11 Customize : Toolbars...
- Page 25 E-OCD II Debugger User’s Manual Debugger Software (for Microsoft Windows) The Keyboard tab allows the user to define a shortcut key for each command or reset it to the default setting. Figure 3-12 Customize : Keyboard In the Menu tab, the user can change the Menu style.
- Page 26 Debugger Software (for Microsoft Windows) E-OCD II Debugger User’s Manual In the Options tab, the user can change toolbar tip display, icon size, and so on. Figure 3-14 Customize : Options Status Bar : It turns the status bar on or off. The Status bar displays information on the current state of debugger.
- Page 27 E-OCD II Debugger User’s Manual Debugger Software (for Microsoft Windows) Caption Bar : It turns the Caption bar on or off. The Caption bar displays the device name and what device is connected to the OCD or OCD II interface.
-
Page 28: Emulation
Debugger Software (for Microsoft Windows) E-OCD II Debugger User’s Manual 3.3.3 Emulation This menu is to control the start and stop of the code. Figure 3-16 Menu : Emulation 3.3.4 Emulation : Load Hex It displays a dialog box to enter the hex file name. The target device is programmed with this hex file. - Page 29 : This is an important notification. The instructions listed in the message are regarding comparison or branching that are not supported by some old ABOV devices. Although the debugger detects these instructions while downloading the hex file, it cannot determine whether they are instructions or data patterns.
- Page 30 Debugger Software (for Microsoft Windows) E-OCD II Debugger User’s Manual Download : Downloads the selected hex file to the target device and starts programming its flash memory. Close : Closes the dialog box. If the target device has configurations, the Configuration dialog box below is opened.
- Page 31 E-OCD II Debugger User’s Manual Debugger Software (for Microsoft Windows) 3.3.5 Emulation : Reset and Run It begins emulation from the address 0000h after resetting the target device. Its action is the same as that of a real situation. Emulation continues until a break occurs or the developer stops the emulation.
- Page 32 Debugger Software (for Microsoft Windows) E-OCD II Debugger User’s Manual 3.3.9 Emulation : Step Over The emulation pauses at the next line of code or the next mnemonic code. 3.3.10 Emulation : Step Auto : It executes a step run every 100ms. You can halt it by clicking the Stop button.
-
Page 33: Break/Configure
E-OCD II Debugger User’s Manual Debugger Software (for Microsoft Windows) 3.3.13 Break/Configure This menu is to control the break settings, emulation options, device configurations, and so on. You can emulate your program with more options by using these controls. Some items under this menu do not apply to the OCD device series because these functions are not supported by the OCD interface specifications. - Page 34 Debugger Software (for Microsoft Windows) E-OCD II Debugger User’s Manual 3.3.14 Break/Configure : Clear All Break It clears all program counter breaks and data breaks (OCD II devices only). 3.3.15 Break/Configure : Set Data Break It is available only to OCD II devices. OCD II devices can be debugged with more powerful and flexible break functions.
- Page 35 E-OCD II Debugger User’s Manual Debugger Software (for Microsoft Windows) Clicking ‘Add break’ opens the following dialog box to help set a data break condition: On this dialog box, you can set the target memory (CODE, XDATA, IRAM, or SFR) and its address by using either of the following options: ...
- Page 36 Debugger Software (for Microsoft Windows) E-OCD II Debugger User’s Manual If you select <= and the input number is 56 (decimal), the following data break condition will be set. if (target device’s value <= 56) BREAK occur; Signed / Unsigned : A signed variable uses the variable’s MSB (most significant bit) as + or –.
- Page 37 E-OCD II Debugger User’s Manual Debugger Software (for Microsoft Windows) 3.3.16 Break/Configure : Break BEFORE/AFTER exec Select this to toggle between the following two modes regarding the timing of break event detection. Break BEFORE exec. : When the OCD logic detects a break event, the target device is stopped before the OPCODE of the program counter break is executed.
- Page 38 Debugger Software (for Microsoft Windows) E-OCD II Debugger User’s Manual 3.3.18 Break/Configure : Clear Emulation Time This menu item is enabled only for OCD II devices. It clears the last emulation time and execution clock information. 3.3.19 Break/Configure : Step Run Option You can select the unit of step runs between the source-line level and OPCODE level.
- Page 39 E-OCD II Debugger User’s Manual Debugger Software (for Microsoft Windows) 3.3.21 Break/Configure : Chip Configuration This is to configure the target device’s hardware configuration, including code protection, oscillation control, and I/O port option. Each device series has a different configuration.
- Page 40 Debugger Software (for Microsoft Windows) E-OCD II Debugger User’s Manual Figure 3-29 Get Xin Frequency Dialog Note : The value entered here is not of the real emulation clock, but a fake frequency. If you have connected the OCD II and the RTIME pin, this value is ignored because the debugger can get real emulation time.
- Page 41 E-OCD II Debugger User’s Manual Debugger Software (for Microsoft Windows) Figure 3-31 Dialog for E-OCD II Interface Note : No device series will be selected by default. You must select one of the listed series; else, this dialog box will not close Turn off the target system and click Yes.
-
Page 42: Power Out (3.3V Or 5.0V)
User can select the power output voltage with a switch on the side of the E-OCD II When Pressing the power icon in the PC program – as shown below picture, The E-OCD II can be selected voltage switch out is on and the voltage selected by switch is output. - Page 43 When the device is not recognized by the own power of E-OCD II, the user must use an external power. Connecting target board with the power of E-OCD II is on, it may cause breakage of the target board. Connecting E-OCD II with the power of target board is on, it may cause breakage of E-OCD User must connect the E-OCD II to target board with both power off.
-
Page 44: Test
Debugger Software (for Microsoft Windows) E-OCD II Debugger User’s Manual 3.3.25 Test This menu is to examine the interface or device. Some functions under this menu are designed to for maker test purpose and not for end users. Figure 3-35 Menu ‘Test’ for OCD Device Series Figure 3-36 Menu ‘Test’... - Page 45 E-OCD II Debugger User’s Manual Debugger Software (for Microsoft Windows) Chip Trimming : This function is not for end users. It is designed to change device configurations, including user configuration and trimming values. A password is required to access this function.
-
Page 46: Window
Debugger Software (for Microsoft Windows) E-OCD II Debugger User’s Manual 3.3.26 Window This menu is to control the text file window’s view. Figure 3-41 Menu ‘Window’ Split : You can split the text file window’s view as shown in two as shown below. You can move or remove the splitter by dragging the mouse. -
Page 47: Help
E-OCD II Debugger User’s Manual Debugger Software (for Microsoft Windows) Windows… : This helps select the desired text window. Figure 3-43 Windows Dialog 3.3.27 Help This menu supports to check the debugger version. Figure 3-44 Menu ‘Help’ Figure 3-45 Program Information 3.3.28... -
Page 48: Child Windows
Debugger Software (for Microsoft Windows) E-OCD II Debugger User’s Manual Child Windows The MCS51 CPU architecture is given below. Each child window provides editing functionality and displays its data. Figure 3-47 MCS51 CPU Architecture The debugger shows the target device’s all internal data and status in a convenient manner. The debugger provides a dumped format view, disassembled format view, and various information that are very helpful to debugging your application program code. - Page 49 E-OCD II Debugger User’s Manual Debugger Software (for Microsoft Windows) Figure 3-48 Example : Moving Cocked Child View in the Debugger All dockable windows can be moved out of the debugger frame as shown below: Figure 3-49 XDATA Window Out of the Debugger Frame...
- Page 50 Debugger Software (for Microsoft Windows) E-OCD II Debugger User’s Manual All dockable windows have Hide and Close buttons. The Hide button moves the child window aside in the debugger frame, but does not close it. The Close button closes the child window.
-
Page 51: Code Dump View
E-OCD II Debugger User’s Manual Debugger Software (for Microsoft Windows) 3.4.2 Code Dump View This view shows the target device’s code memory in the hex dumped format. It displays data page by page (hexadecimal addresses range from 0xXX00 to 0xXXFF). You can use the Page Up or Page Down keys to move to the previous or next page. - Page 52 Debugger Software (for Microsoft Windows) E-OCD II Debugger User’s Manual Load pattern ( : Fill a code area with a hex file. The only available format is the Intel-Hex format. Figure 3-53 Pattern Load Dialog Save pattern ( : Save a code area as a hex file. The code area is specified by entering its start and end addresses.
- Page 53 E-OCD II Debugger User’s Manual Debugger Software (for Microsoft Windows) Set data break : This function is available only to OCD II devices. Double-click on data in the window to set or remove a data break. Double-clicking on an already set data break will pop up the dialog box shown below.
-
Page 54: Code Disassemble View
Debugger Software (for Microsoft Windows) E-OCD II Debugger User’s Manual 3.4.3 Code Disassemble View This view shows the target device’s code memory in the disassembled format. Figure 3-57 Disassemble View Window All operands are displayed as hexadecimal numbers. The current device program counter is colored in dark gray. - Page 55 E-OCD II Debugger User’s Manual Debugger Software (for Microsoft Windows) Double-clicking on the Mnemonic area of a line allows you to modify the assembly code. Once you modify the code, click Modify. Figure 3-59 Modifying the Assembly Code Move button ( : Move the display address and caret position by typing.
-
Page 56: Xdata Dump View
Debugger Software (for Microsoft Windows) E-OCD II Debugger User’s Manual 3.4.4 XDATA Dump View This view shows the target device’s XDATA memory in the hex dumped format. It displays data page by page (hexadecimal addresses range from 0xXX00 to 0xXXFF). You can use the Page Up or Page Down keys to move to the previous or next page. - Page 57 E-OCD II Debugger User’s Manual Debugger Software (for Microsoft Windows) Load pattern ( : Fill a code area with a hex file. The only available format is the Intel-Hex format. Figure 3-63 Pattern Load Dialog Save pattern ( : Save a code area as a hex file. The code area is specified by entering its start and end addresses.
- Page 58 Debugger Software (for Microsoft Windows) E-OCD II Debugger User’s Manual Set data break : This function is available only to OCD II devices. Double-click on data in the window to set or remove a data break. Double-clicking on an already set data break will pop up the dialog box shown below.
-
Page 59: Idata (Iram) Dump View
E-OCD II Debugger User’s Manual Debugger Software (for Microsoft Windows) 3.4.5 IDATA (IRAM) Dump View This view shows the target device’s IDATA (IRAM) memory in the hex dumped format. It displays data page by page (hexadecimal addresses range from 0x0000 to 0x00FF). The upper side of this widow displays the address of the current caret position. - Page 60 Debugger Software (for Microsoft Windows) E-OCD II Debugger User’s Manual Set data break : This function is available only to OCD II devices. Double-click on data in the window to set or remove a data break. Double-clicking on an already set data break will pop up the dialog box shown below.
-
Page 61: Sfr Dump View
E-OCD II Debugger User’s Manual Debugger Software (for Microsoft Windows) 3.4.6 SFR Dump View This view shows the target device’s SFRs (special function registers) in the hex dumped format. It displays 128 bytes (hexadecimal addresses range from 0x0080 to 0x00FF). The upper side of this widow displays the address and the SFR name of the current caret position. -
Page 62: Registers View
Debugger Software (for Microsoft Windows) E-OCD II Debugger User’s Manual Figure 3-70 Access Break Dialog 3.4.7 Registers View This view shows the target device’s registers in the hex dumped format. PSWs (program status words) use a binary format. Edit : You can edit data here directly by typing. Note that data changes made in this editor are not transmitted to the target device until you click the Modify button. - Page 63 E-OCD II Debugger User’s Manual Debugger Software (for Microsoft Windows) 3.4.8 Output View This view uses a tabbed window. Each window tab shows different information. Status tab : This tab lists breaks that have occurred. Figure 3-72 Output Window : Status Tab The information of each occurrence includes: ...
- Page 64 Debugger Software (for Microsoft Windows) E-OCD II Debugger User’s Manual Breaks tab : This tab lists the set breaks. If you are using an OCD II device, refer to Set data break too. Figure 3-73 Output Window : Breaks Tab...
-
Page 65: Source View
E-OCD II Debugger User’s Manual Debugger Software (for Microsoft Windows) 3.4.9 Source View This view shows a text file or source code file with each line numbered. The data displayed in the view is not editable, and each tab shown is sized as four spaces. - Page 66 Debugger Software (for Microsoft Windows) E-OCD II Debugger User’s Manual Find Text (T) : This finds your specified text in the file and colors the result. Figure 3-76 Find The following example shows that all occurrences of the search text are colored in red: Figure 3-77 Searched Text Find Next…...
- Page 67 E-OCD II Debugger User’s Manual Debugger Software (for Microsoft Windows) Goto line # (G) : This takes you to your desired line in the text file. Selecting this will prompt you to type in a decimal line number. Figure 3-79 Get Decimal Number Dialog...
-
Page 68: Global Variable View
Debugger Software (for Microsoft Windows) E-OCD II Debugger User’s Manual 3.4.10 Global Variable View This view shows and allows editing global variables of the source code. Figure 3-80 Global Variable View Add global variable ( : Add global symbols to this view. This button is disabled when the symbol information is empty. - Page 69 E-OCD II Debugger User’s Manual Debugger Software (for Microsoft Windows) Double-click on the symbol name you want to add. Select the variable and click Add. Type in the symbol name and click Add.
- Page 70 Debugger Software (for Microsoft Windows) E-OCD II Debugger User’s Manual Remove global variable ( : Remove global symbols from this view. This button is disabled when the symbol information is empty. Figure 3-82 Global Variable Remove Dialog You can remove a global symbol in one of the following ways: ...
- Page 71 E-OCD II Debugger User’s Manual Debugger Software (for Microsoft Windows) Note: Array data is not supported: If you want to use array data, you will need to use a Keil plug-in.
- Page 72 Debugger Software (for Microsoft Windows) E-OCD II Debugger User’s Manual Figure 3-83 Global Variable View Edit : Double-click on the data area that you wish to edit, and the following dialog box will open. Figure 3-84 Edit Dialog Available data formats include: ...
- Page 73 E-OCD II Debugger User’s Manual Debugger Software (for Microsoft Windows) Real time monitoring : This function is available only to OCD II devices. In general, a developer cannot see the target device’s internal data. But, the OCD II interface supports data monitoring even while the CPU is operating.
-
Page 74: Local Variable View
Debugger Software (for Microsoft Windows) E-OCD II Debugger User’s Manual 3.4.11 Local Variable View This view shows and allows editing local variables of the source code. Figure 3-86 Local Variable View Add/remove local variable : Adding or removing local variables in this view is processed automatically by the debugger. - Page 75 E-OCD II Debugger User’s Manual Debugger Software (for Microsoft Windows) The view, in this example, then shows function : MAIN and its local variables as shown below: Figure 3-88 Example : Function main Values : In this view, values are displayed as hexadecimal, decimal, or binary numbers.
-
Page 76: Keil Plug-In
Using the Keil plug-in, you can work with the ABOV E-OCD II interface on the μVision Debugger. The ABOV E-OCD II interface fully supports the Keil Vision IDE. ABOV’s target driver is seamlessly integrated with the Keil debugger, allowing Keil C51 users to work in the Vision environment without switching between the Keil compiler and ABOV’s external OCD software. -
Page 77: Getting Started
E-OCD II Debugger User’s Manual Keil Plug‐in 4.1.1 Getting Started The μVision Debugger provides two ways to debug your embedded applications: Simulator : μVision provides everything you need to quickly develop high-fidelity simulations that help you test, debug, and prove the stability and quality of your software design. Before starting the μVision Debugger, select Use Simulator from Project Options>Debug Tab to simulate... -
Page 78: Keil Plug-In Setup
4.2.1 Bind PK51 ABOV provides the Keil plug-in together with its debugging software installer package. The only thing you need to do is editing the Keil PK51 configuration file. The file is named Tools.ini and located in the Keil folder, for example, C:\Keil. -
Page 79: Add Flash Control To Your Project
Set your project options as shown in the following dialog box. Now, you can erase, read, or write the code to your target MCU. If you are not using code banking, use ‘ABOV E-OCD II Dongle. Figure 4-2 ABOV E-OCD II Dongle If you are using code banking, use ‘ABOV E-OCD II banked. -
Page 80: Add Debugger Control To Your Project
Set your project options as shown in the following dialog box. Now, you can emulate and debug your target MCU. If you are not using code banking, use ‘ABOV E-OCD II Dongle.’ Figure 4-4 ABOV E-OCD II Dongle If you are using code banking, use ‘ABOV E-OCD II Banked.’... -
Page 81: Iar 8051 Gui (Compiler And Debugger)
IAR 8051 GUI (Compiler and Debugger) IAR 8051 GUI (Compiler and Debugger) Basic Features This user guide introduces a method to develop ABOV devices in the 8051 debugger of IAR (C-SPY) environment. How to connect and detect the OCD/ OCD II/ E-OCD II debugger. -
Page 82: Abov's Sdk Dll Connections
Segger. Products of other companies are connected by using Third Party Drivers. ABOV developed DLLs to support its debuggers and devices by using SDK sources of IAR. SDK DLL compatibility between IAR versions It needs to remember that IAR SDK DLL is compatible according to IAR versions. -
Page 83: Iar Project Settings
Figure 5-1 Debugger / Driver Setting 5.4.2 IAR Third-Party Driver Settings Select ‘Options…’, then select ‘Debugger’. Finally select ‘Third-Party Driver.’ Press ‘OK’ button to connect to an SDK DLL file provided by ABOV (Check the IAR version for the compatibility of SDK DLL). - Page 84 IAR 8051 GUI (Compiler and Debugger) E-OCD II Debugger User’s Manual Figure 5-2 Third-Party Driver /Setting...
-
Page 85: Download Hex File
Download Hex File By pressing a debugging button ( ), you can proceed operations consecutively. Detect OCD/ OCD II/ E-OCD II debugger. For each debugger, select POR (Power-on Reset) for the series to which a target device belongs. - Page 86 IAR 8051 GUI (Compiler and Debugger) E-OCD II Debugger User’s Manual When the target is detected normally, a Hex File is downloaded into the Flash of the target. If a target device has options, After downloading a Hex file, the corresponding option dialog for the device is displayed.
-
Page 87: Cautions For Debugging
Figure 5-7 IAR Debugger After downloading a Hex file, it displays the number limit of the Breakpoints. ABOV’s devices limit the number of built-in Breakpoints. The number of Breakpoints for each device is different. It displays the number of Breakpoints available for developers, except for Breakpoints used by IAR debugger. - Page 88 IAR 8051 GUI (Compiler and Debugger) E-OCD II Debugger User’s Manual It displays a warning message if a developer sets a larger number than the number of available Breakpoints on the device. Breakpoint settings made after the warning message are ignored.
-
Page 89: Sdk Dll Compatibility According To Iar Versions
Some of SDK DLL are not compatible if their Embedded Workbenches have different versions. As of 2019, ABOV supports the version 8.0 and 8.1 of Embedded Workbench. Check the IAR version by following the procedure below: Start the IAR. -
Page 90: Appendix: E-Ocd Ii Isolator Interface
E-OCD II Debugger User’s Manual Appendix: E-OCD II Isolator Interface The E-OCD II isolator interface is designed to prevent power collision between the Host PC and target hardware: The operating voltage ranges between 2.8–5.5 V. This is slightly higher than the regular OCD/OCD II interfaces. -
Page 91: Revision History
E-OCD II Debugger User’s Manual Revision history Revision history Version Date Description 1.0.0 Jun. 28, 2019 Document created 1.0.1 Sep. 29, 2020 New Format Document created. 1.0.2 Oct. 20, 2020 Added contents of E-OCD II... - Page 92 ABOV Semiconductor ("ABOV") reserves the right to make changes, corrections, enhancements, modifications, and improvements to ABOV products and/or to this document at any time without notice. ABOV does not give warranties as to the accuracy or completeness of the information included herein. Purchasers should obtain the latest relevant information of ABOV products before placing orders.
Need help?
Do you have a question about the E-OCD II and is the answer not in the manual?
Questions and answers