Sign In
Upload
Download
Table of Contents
Contents
Add to my manuals
Delete from my manuals
Share
URL of this page:
HTML Link:
Bookmark this page
Add
Manual will be automatically added to "My Manuals"
Print this page
×
Bookmark added
×
Added to my manuals
Manuals
Brands
ADVANTEST Manuals
Measuring Instruments
R3132 Series
Operation manual
ADVANTEST R3132 Series Operation Manual
Spectrum analyzer
Hide thumbs
1
2
3
4
5
6
7
8
9
Table Of Contents
10
11
12
13
14
15
16
17
18
19
20
21
22
23
24
25
26
27
28
29
30
31
32
33
34
35
36
37
38
39
40
41
42
43
44
45
46
47
48
49
50
51
52
53
54
55
56
57
58
59
60
61
62
63
64
65
66
67
68
69
70
71
72
73
74
75
76
77
78
79
80
81
82
83
84
85
86
87
88
89
90
91
92
93
94
95
96
97
98
99
100
101
102
103
104
105
106
107
108
109
110
111
112
113
114
115
116
117
118
119
120
121
122
123
124
125
126
127
128
129
130
131
132
133
134
135
136
137
138
139
140
141
142
143
144
145
146
147
148
149
150
151
152
153
154
155
156
157
158
159
160
161
162
163
164
165
166
167
168
169
170
171
172
173
174
175
176
177
178
179
180
181
182
183
184
185
186
187
188
189
190
191
192
193
194
195
196
197
198
199
200
201
202
203
204
205
206
207
208
209
210
211
212
213
214
215
216
217
218
219
220
221
222
223
224
225
226
227
228
229
230
231
232
233
234
235
236
237
238
239
240
241
242
243
244
245
246
247
248
249
250
251
252
253
254
255
256
257
258
259
260
261
262
263
264
265
266
267
268
269
270
271
272
273
274
275
276
277
278
279
280
281
282
283
284
285
286
287
288
289
290
291
292
293
294
295
296
297
298
299
300
301
302
303
304
305
306
307
308
309
310
311
312
313
314
315
316
317
318
319
320
321
322
323
324
325
326
327
328
329
330
331
332
333
334
335
336
337
338
339
340
341
342
343
344
345
346
347
348
349
350
351
352
353
354
355
356
357
358
359
360
361
362
363
364
365
366
367
368
369
370
371
372
373
374
375
376
377
378
379
380
381
382
383
384
385
386
387
388
389
390
391
392
393
394
395
396
397
398
399
400
401
402
403
404
405
406
407
408
409
410
411
412
413
414
415
416
417
418
419
420
421
422
423
424
425
426
427
428
429
430
431
432
433
434
435
436
437
438
439
440
441
442
443
444
445
446
447
448
449
450
451
452
453
454
455
456
457
458
459
460
461
462
463
464
465
466
467
468
469
470
471
472
473
474
475
476
477
478
479
480
481
482
483
484
485
486
487
488
489
490
491
492
493
494
495
496
497
498
499
500
501
502
503
504
505
506
507
508
509
510
511
512
513
514
515
516
517
518
519
520
521
522
523
524
525
526
527
528
529
530
531
532
533
534
535
536
537
538
539
540
541
542
543
544
545
546
547
548
549
550
551
552
553
554
555
556
557
558
559
560
561
562
563
564
565
566
567
568
569
570
571
572
573
574
575
576
577
578
579
580
581
582
583
584
585
586
587
588
page
of
588
Go
/
588
Contents
Table of Contents
Bookmarks
Table of Contents
Table of Contents
1 Introduction
Product Description
Accessories
Standard Accessories List
Power Cable Options
Options
Operating Environment
Environmental Conditions
Power Requirements
Power Fuse
Power Supply Specifications
Replacing the Power Fuse
Power Cable
System Checkout
Connecting the Power Supply Cable
Screen Display after Self Tests Have Completed
Self Test Screen
Screen Shown after Executing Self Test
Cleaning, Storing and Transporting the R3132 Series Spectrum Analyzer
Cleaning
Removing the Display Filter
Storing
Transporting
Calibration
Replacing Parts with Limited Life
2 Operation
Panel Description
Front Panel
Front Panel (R3132/32N/62)
Screen Annotation
Front Panel (R3172)
Front Panel (R3182)
Sweep
Screen Annotation
2.1.3 Rear Panel
Basic Operation
Operating Menus and Entering Data
2.2.2 Displaying Spectrums and Operating the Markers
Factory Defaults Screen
Active Area Display
Setting the Center Frequency
Measuring Settings Screen
Peak Search Display Screen
Measuring Window and the Display Line
Activating the Display Line
Making a Comparison between Peaks Using Reference Lines
Screen Display Showing the Measuring Window
Measuring Frequency Using Counter
Measuring Settings Screen
Frequency Counter Measurement (Resolution: 1 Khz)
Auto Tuning
Frequency Counter Measurement (Resolution: 10 Hz)
Screen Display Prior to Auto Tuning
Screen Display after Auto Tuning
2.2.6 Tracking Operations
Signal Tracking Screen
UNCAL Message
Continuous Peak Search Screen
Screen with UNCAL Message
Separating Two Signals
UNCAL Message Removed
Setup for Measuring Two Signals Separately
Two Superimposed Peaks
Two Discernible Peaks
Two Distinct Peaks Can Now be Seen
Measuring Low Level Signals
Setup for Verifying the Dynamic Range
Screen Display Prior to Changing the RBW
Screen Display after Changing the RBW
Screen Display after Changing the VBW
The Trace after Averaging
Spectrum Displayed When the Pre-Amplifier Is Used
2.2.10 Input Saturation
Setup for Input Saturation
Screen Display Without Saturation
Harmonic Distortion
Screen Display Showing Saturation
Setup for Measuring Harmonic Distortion
Screen Display Showing Harmonic Distortion
2.2.12 Intermodulation
Screen Display Showing Reduced Harmonic Distortion
Setup for Measuring Intermodulation
Screen Display Showing Intermodulation Distortion
Screen Display Without Intermodulation Distortion
2.2.13 Calibration
2.2.14 Entering User-Definable Antenna Correction Data
Screen Display Showing the Cal Menu
Editing the Correction Data Table
Screen for the EMC Menu
Screen Display Showing the User-Definable Correction Data Table
External Mixer (OPT16 Thru OPT19)
Product Summary
Configuration of the Options
Setup for the R3172 and Waveguide Mixer
Setup for the R3182 and Waveguide Mixer
File Names
Measurement Examples
Measuring the Channel Power
Setup for Measuring the Channel Power
Setting the Offset Level
Measuring the Channel Power
Measuring the Occupied Bandwidth (OBW)
Setup for Measuring the Occupied Bandwidth
Setting the Detector Mode
OBW Measurement Screen
OBW(95%) Measurement Screen
Measuring Adjacent Channel Leakage Power (ACP)
2.3.3.1 Full Screen Mode
Setup Measuring Adjacent Channel Leakage Power
PDC Trace
CS/BS Setup Dialog Box
Root Nyquist Filter Dialog Box
ACP Measurement Display in Full Screen Mode
Measurement Using ACP GRAPH
ACP at the 100 Khz
2.3.3.2 SEPARATE Display
Setup Measuring Adjacent Channel Leakage Power
PHS Trace
CS/BS Setup Dialog Box
Measurement Result in ACP Separate Screen Mode
Measuring Burst Signals Using the Gated Sweep
Setup for Measuring a Burst Signal
Burst Signal Displayed in Split Screen Mode
Trigger Setup
Gate Setup
Burst Signal by Use of the Gated Sweep (Separate Screen Mode)
Burst Signal by Use of the Gated Sweep (Full Screen Mode)
Measuring Burst Signals in the Time Domain
Setup for Measuring a Burst Wave Signal
Burst Signal in the Time Domain
Burst Signal in Synchronization with the Trigger Signal
Measuring Burst Signal Leading Edge
Measuring Burst Signal Trailing Edge
2.3.6 Pass/Fail Judgments Using the Limit Line Function
Setting Limit Line
Screen Displayed after Limit Line 1 Data Has Been Entered
Screen Displayed after Limit Line 2 Data Has Been Entered
PASS/FAIL Result Using Limit Line 1 (PASS)
PASS/FAIL Result Using Limit Lines 1 and 2 (FAIL)
PASS/FAIL Result Using Limit Lines 1 and 2 (PASS)
Judgment Result after the Offset Has Been Changed (FAIL)
Judgment Result after the Offset Has Been Changed (PASS)
Measurements Using TG (OPT74)
Setup for TG Measurements
Measurement Screen after a Normalization Calibration
Connecting the Unit under Test
Insertion Loss Measurement Screen
Spectrum Mask Measurement
Setup for Measuring the Spectrum Mask
Setting Limit Line1
A Trace Used with
CS/BS Setup Dialog Box
Spectrum Mask Measurement Screen
Measuring Output Levels Using the Software Image Suppression Function (OPT16 Thru OPT19)
Setup for Measuring VCO Output Levels
Measurement Signal with an Image Signal
Measurement Signal with the Image Signal Eliminated
Software Image Suppression Function in Split Screen Mode
FM Demodulation Function (OPT73)
Setup for Measurements Using the FM Demodulation Function
Relationship between Frequency Range and the Value of RBW
FM Deviation Measurement
How to Calculate the Sensitivity
Sensitivity Measurement Screen
Simultaneously Displaying Sensitivity and Demodulation
Setting Offset and Slope Used for Linearity Measurements
Setting Offset and Slope When Using the Measuring Window
Linearity Measurement
Other Functions
Using Floppy Disks
Floppy Disk Write Protection
Screen for the F.disk Menu
Saving or Recalling Data
Screen Display Showing Floppy Disk as the Destination
Display for Selecting the Data to be Saved
Display after Data Has Been Saved to a File
Screen Display Showing File Protection Enabled
Screen Display Showing the Selected File
Screen Display Showing Recalled Data
Screen as Shown When Deleting a File
Screen as Shown after Deleting File Data
Outputting Screen Data
Screen Display Showing Floppy Disk as the Specified Destination
Recommended Compatible Printers
Printer Setup Screen
Setting Date and Time
Time/Date Menu
Setting the Screen Title
Dialog Box Used to Enter Titles
Displaying the Screen Title
3 Reference
Menu Index
Menu Map
Save Recall
Menu Function Descriptions
AUTO TUNE Key (Auto Tuning)
BW Key (Bandwidth)
CAL Key (Calibration)
CONFIG Key (Configuration)
COPY Key (Hard Copy)
COUNTER Key (Frequency Counter)
DISPLAY Key (Line and Window)
EMC Key (EMC Measurement)
FREQ Key (Frequency)
3.3.10 Hold Mode
LEVEL Key (Frequency Level)
LOCAL Key (GPIB Remote Control)
MEAS Key (Measurement)
MKR Key (Marker)
MKR → Key (Marker →)
PAS/FAIL Key (Pass/Fail Judgment)
PK SRCH Key (Peak Search)
POWER MEASURE Key (Power Measurement)
PRESET Key (Initialization)
RECALL Key (Data Readout)
REPEAT Key (Continuous Sweep)
SAVE Key (Saving Data)
Self Test Key (Self Test)
SINGLE Key (Single Sweep)
SPAN Key (Frequency Span)
SWEEP Key (Sweep Time)
TG Key (Tracking Generator) (OPT74)
TRACE Key (Trace Data)
TRIG Key (Trigger)
UTILITY Key (Utility)
List of Settings
Factory Defaults (R3132/N)
Factory Defaults (R3162)
Factory Defaults (R3172)
Factory Defaults (R3182)
Values for Default Config
Gpib
Arrangement of the Three Status Registers
Details of the Three Status Registers
Structure of the Status Byte Register
Frequency (1 of 3)
Level
MKR (1 of 2)
Mkr
Auto Tune
Power (1 of 3)
Pass/Fail
Preset
Tg (Opt74)
Relationship between Screen Graticule and Trace Data
Trace Accuracy Specification Codes
I/O Format
Parameter Setup
Connection between the Controller and the Spectrum Analyzer
Cable Wiring Diagram
Data Format
Performance Verification Items
Performance Verification Items for Tracking Generator
Performance Verification Items for FM Demodulation
Instrument Required (1 of 3)
Setup of Frequency Reference Source Accuracy Test
Setup of CAL out Level Accuracy Test
Display
Setup of Displayed Average Noise Level Test
Center Frequency Setting for Display Average Noise Level
Start and Stop Frequencies Setting
Setup of Resolution Bandwidth Switching Uncertainty
RBW Switching Uncertainty Test Setting
Setup of Resolution Bandwidth Accuracy and Selectivity Test
RBW and Span for 3 Db down Width Measurement Setting
RBW Selectivity Test Setting
Setup of QP Bandwidth Accuracy Test
RBW and Span for 6 Db down Width Measurement Setting
Setup of if Gain Uncertainty Test
IF Gain Uncertainty Measurement Setting
Setup of Input Attenuator Switching Accuracy Test (R3132/32N/62)
Input Attenuator Switching Accuracy Test Setting for R3132/32N
Input Attenuator Switching Accuracy Test Setting for R3162
Setup of Input Attenuator Switching Accuracy Test (R3172/82)
Input Attenuator Switching Accuracy Test Setting for R3172/82
Setup of Scale Fidelity Test
Db/DIV Scale Fidelity Test Setting
Db/DIV Scale Fidelity Test Setting
Linear Scale Fidelity Test Setting
Setup of Residual FM Test
Setup of Noise Sidebands Test
Setup of Image, Multiple and Out-Of-Band Responses Test
Image, Multiple, Out-Of-Band Response Test Setting
Setup of Accuracy of Frequency Readout and Frequency Counter Test
Frequency Readout Accuracy Test Setting
Count Frequency Marker Accuracy Test Setting
Test
Setup of Second Harmonic Distortion Test
Setup of Frequency Response Test
Setup of Frequency Span Accuracy Test
Center and Span Frequencies for the R3132 Series
Center and Span Frequencies for the R3162/72/82
Center and Span Frequencies for the R3172/82
Center and Span Frequencies for the R3182
Setup of Third Order Intermodulation Distortion Test
Third Order Intermodulation Distortion Test Setting
Third Order Intermodulation Distortion Test Setting for the R3162/72/82
Setup of Gain Compression Test
Setup of Sweep Time Accuracy Test
Sweep Time Accuracy Test Setting
Setup of Residual Response Test
Setup of Absolute Output Level Accuracy Test
Setup of Output Level Flatness Test
Output Flatness Test Setting
Setup of Output Switching Accuracy Test
TG Output Level Switching Accuracy Test Setting
Setup of Harmonic Distortion Test
Harmonic Distortion Test Setting
Setup of Non Harmonic Distortion Test
Setup of TG Leakage Test
Setup for Checking the Offset Error (Internal Mixer Mode)
Setup for Checking the Linearity Error (Internal Mixer Mode)
Relationship between the Frequency Range and Signal Generator Frequency Setting
Setup for Checking the Offset Error (External Mixer Mode)
Setup for Checking the Linearity Error (External Mixer Mode)
Relationship between the Frequency Range and Signal Generator Frequency Setting (Used on the R3132 Series)
List of Performance Verification Test Items
Equipment List for Performance Verification Test
Setup of Noise Level Test
Setup of Source Module Calibration
Setup of Frequency Response Test
List of Performance Verification Test Items
Equipment List for Performance Verification Test
Setup of Noise Level Test
Setup of Source Module Calibration
Setup of Frequency Response Test
List of Performance Verification Test Items
Equipment List for Performance Verification Test
Setup of Noise Level Test
Setup of Source Module Calibration
Setup of Frequency Response Test
List of Performance Verification Test Items
Equipment List for Performance Verification Test
Setup of Noise Level Test
Setup of Source Module Calibration
Setup of Frequency Response Test
Advertisement
Quick Links
1
Product Description
Download this manual
Cover
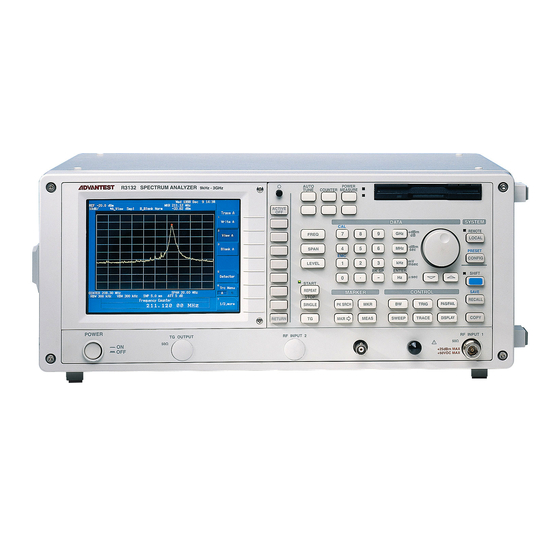
R3132 Series
Spectrum Analyzer
Operation Manual
MANUAL NUMBER
FOE-8335156H00
Applicable models
R3132
R3132N
R3162
R3172
R3182
First printing March 20, 1999
1999
C
ADVANTEST CORPORATION
All rights reserved.
Printed in Japan
Table of
Contents
Previous
Page
Next
Page
1
2
3
4
5
Advertisement
Table of Contents
Need help?
Do you have a question about the R3132 Series and is the answer not in the manual?
Ask a question
Questions and answers
Related Manuals for ADVANTEST R3132 Series
Measuring Instruments ADVANTEST R3131A Manual
Spectrum analyzer (12 pages)
Measuring Instruments ADVANTEST R3131 Series Operation Manual
Spectrum analyzer (276 pages)
Measuring Instruments ADVANTEST R3131 Operation Manual
Spectrum analyzer (261 pages)
Measuring Instruments ADVANTEST R3162 Operation Manual
Spectrum analyzer (588 pages)
Measuring Instruments ADVANTEST R3172 Operation Manual
Spectrum analyzer (588 pages)
Measuring Instruments ADVANTEST R3182 Operation Manual
Spectrum analyzer (588 pages)
Measuring Instruments Advantest R3465 Series Operation Manual
Spectrum analyzer (497 pages)
Measuring Instruments Advantest R3267 series Operation Manual
Spectrum analyzer (398 pages)
Measuring Instruments ADVANTEST R3267 Operation Manual
R3267 series opt62 3gpp measurement option (253 pages)
Measuring Instruments ADVANTEST R3264 Operation Manual
R3267 series opt08 rx control option (145 pages)
Measuring Instruments ADVANTEST R3267 Series Operation Manual
Spectrum analyzer (105 pages)
Measuring Instruments ADVANTEST R3261C Operation Manuals
R3261 series; r3361 series spectrum analyzer (455 pages)
Measuring Instruments ADVANTEST R3765G Series Operation Manual
Network analyzer (446 pages)
Measuring Instruments ADVANTEST R3765CG Operation Manual
Network analyzer (446 pages)
Measuring Instruments ADVANTEST R3755 Series Operation Manual
Network analyzer (148 pages)
Measuring Instruments ADVANTEST R3755A Operation Manual
Network analyzer (148 pages)
This manual is also suitable for:
R3132
R3132n
R3162
R3172
R3182
Table of Contents
Save PDF
Print
Rename the bookmark
Delete bookmark?
Delete from my manuals?
Login
Sign In
OR
Sign in with Facebook
Sign in with Google
Upload manual
Upload from disk
Upload from URL


Need help?
Do you have a question about the R3132 Series and is the answer not in the manual?
Questions and answers