
Subscribe to Our Youtube Channel
Related Manuals for Lasermet ADM-1000


Summary of Contents for Lasermet ADM-1000
- Page 1 Advanced Digital Meter ADM-1000 Operating Instructions Including PC Interface Software for the Remote Operation of Meter (Part 2 of manual) June 2012...
-
Page 2: Issue Notes
Issue Notes Issue 1.5 18/06/2012 Lasermet reserves the right to change the design, modify the operation of functions, add new features, or make any other changes at any time without prior notice. This document is copyright. All rights reserved. PC Interface. This feature is documented in Part 2 of this manual The PC Interface Program extends the user interface of the meter: ... -
Page 3: Table Of Contents
Other Functions ......................28 Detector Temperature ..................28 Head Information ....................28 Instrument Information..................28 Specifications ......................29 Connecting the ADM-1000 to a P.C................. 30 Data output ......................32 ADM-1000 Firmware Update ................33 3 of 49 June 2012... - Page 4 Screen appearance ....................45 Saving a waveform ....................45 Saving a waveform as an image ................45 Saving a waveform as data ................... 47 Reading the ADM-1000 firmware version ..............48 Note on USB time-outs ..................... 48 Trademarks ......................48 4 of 49...
-
Page 5: Introduction
Introduction The ADM-1000 is an advanced hand-held or bench Digital Meter. It is used in conjunction with one of a range of detector heads for measuring and displaying optical power and waveforms. The ADM-1000 may only be used with compatible Lasermet detector heads. The range of heads available includes photodiode and thermal types covering a range of sensitivities and wavelengths. -
Page 6: Adm1000 Equipment
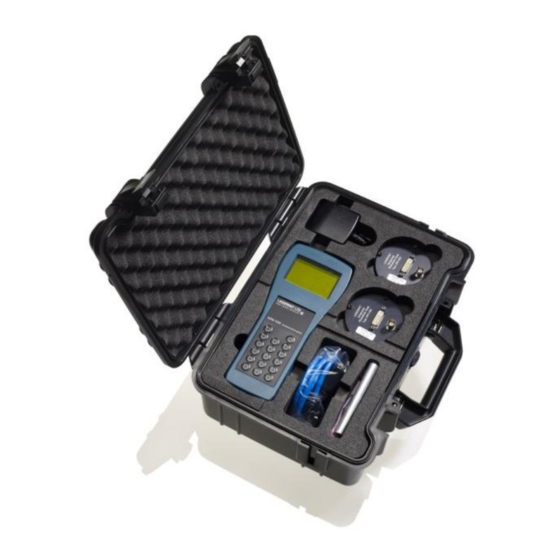
ADM1000 equipment The ADM1000 system comprises of the following items included with the meter Description Part number/Order Code ADM1000 hand held meter ADM-1000 Integral battery pack ADM Cable Meter-Head Interface ADM-C-1.2 Mains power lead The following optional items are selected by the user... -
Page 7: Detector Heads
Detector Heads Standard Photodiode Head IPDH-10S (Integrating Photo Diode Head) This is supplied complete with an integrating sphere for maximum reduction of reflections, easy alignment and high accuracy. Laser light Serial No. aperture. Connector Integrating to meter sphere within unit Analogue output coax socket to connect to oscilloscope, datalogger etc... -
Page 8: Specifications For Detector Heads
Dimensions (mm) 64 x 41 x 17 Aperture Diameter (mm) All Lasermet detector heads have an M6 thread in order mount them on standard posts on an optical table. For posts using ¼” UNC thread an optional adaptor can be ordered. -
Page 9: Power Sources
A DC power supply is included with the ADM-1000. The lead is connected to the 6VDC IN socket on the end of the ADM-1000, the power supply is then plugged into the mains. The ADM-1000 will operate from the power supply regardless of whether the battery pack is fitted or not. -
Page 10: Battery Pack
The battery pack may be charged when it is attached to the ADM-1000 by plugging in the DC power supply into the 6VDC IN socket on the ADM-1000. So long as the power supply is connected and operating, the battery is charged even if the ADM- 1000 is switched off via its keypad. -
Page 11: Switching On
To turn the unit off, press and hold the ‘O’ button at the top of the keypad until the unit turns off. If the ADM-1000 is connected to a USB port, turn it off by pressing the ‘O’ button until the progress bar fills up (this ensures the settings are saved), then unplug the USB lead to turn the unit off. - Page 12 Po wer Of f Me nu Po wer On Di splay Mo de Ba cklig ht Un do En ter Ke ypa d L ayou t Diagram 1 12 of 49 June 2012...
-
Page 13: Display Mode Summary
Display Mode Summary The ADM-1000 can operate in digital (numerical) or graphical (waveform) display mode. Digital Display Features Manual or auto ranging numerical display. This display shows the measured value in numerals with units. A bargraph trend indicator beneath the digits shows the current value relative to the full scale on the selected range. -
Page 14: Operation
Refer to the keypad diagram 1 to identify the keys. Connect the ADM-1000 to the head using the supplied cable, and switch the unit on by holding the ‘I’ button at the top of the keypad until the unit beeps. -
Page 15: Auto-Range
Auto-Range The ADM-1000 has an auto-range capability in the digital display mode. In this mode, the meter will automatically switch to a higher (less sensitive) range when the measurement exceeds the present range. Similarly the meter will switch to a more sensitive range when the measurement is less than about 9% of full scale. -
Page 16: Peak/Average Measurement
Peak/Average Measurement There are two types of measurement mode that can be selected for the digital display- Average or Peak. In average measurement mode, the measured signal is averaged over a period set by the user and will give a useful average (mean) value for steady (CW) sources or pulse periods which are less than the user-set average time period. -
Page 17: Zero Offset
Zero Offset For accurate measurements it may be necessary to set the point at which zero light is displayed. This is achieved by blocking off all light to the detector and then zeroing the meter. To set the zero point, press the menu button, scroll down to Zero, press The options Set and Clear are presented. -
Page 18: Display Contrast
Display Contrast To set the display contrast, press Menu, scroll down to Display, press Scroll down to Contrast, press . The current contrast level is displayed. Use the up/down buttons to change the contrast over the range 0 - 30 for best viewing. -
Page 19: Graphical Mode Functions
Graphical Mode Functions The ADM-1000 has a sophisticated graphical display mode which can show the variation of the measured value with time. Various trigger modes allow the capturing of difficult waveforms, and comprehensive cursor functions allow for calculation of parameters such as time, power, frequency and energy. -
Page 20: Timebase (Horizontal Scale) Setting
Timebase (Horizontal Scale) setting Press the left arrow (4) button to reduce the timebase speed. Press the right arrow button (6) to increase the timebase speed. The timebase can also be set by pressing Menu, scrolling down to X Scale and pressing to select, then choosing the desired timebase setting. -
Page 21: Bandwidth Limit
Bandwidth Limit On some types of heads a bandwidth limit function is available which is useful for filtering high frequency noise and interference when trying to look at a small steady or slowly-moving signal. This usually limits the risetime to 100ms and the bandwidth to approximately 5Hz. - Page 22 Diagram 4: Trigger Operation Set ‘TRG’ mode: Press 5 so that ‘Trg’ is displayed in the bottom corner of the display. If you have just entered waveform mode or have just changed range, press reset the trigger level to the middle of the screen. The trigger level is shown as a horizontal line across the screen.
-
Page 23: Auto Mode
Trigger Slope Press the Menu button. Scroll down to the Trigger Slope option and press . Use the up and down arrow buttons to switch between positive (rising edge) and negative (falling edge) slope. Press to leave the trigger slope setting function. -
Page 24: Normal Mode
Normal Mode In Normal mode, if no valid triggers occur the waveform is not updated and ‘No trig’ is shown at the top of the display. The last waveform that triggered the instrument is kept on the screen until the signal next crosses the trigger level in the specified direction. -
Page 25: Cursor Function
Cursor Function The ADM-1000 has a cursor function which enables various measurements and calculations to be made on displayed waveforms. In waveform display mode, press ACQ (0) to stop the acquisition. Two small crosses are displayed on the waveform at the leftmost side of the screen, one of which is flashing. - Page 26 ∆ P (Delta-P) Power difference between the cursors. This is used for measuring pulse amplitudes or amplitude differences. 1/∆t (Frequency) This is used to measure frequency (PRF) in Hertz. The display should if possible be arranged so that two pulses can be seen, and the cursors should then be set to the same point on each of the two adjacent pulses.
- Page 27 Pulse Energy The total energy between the cursors, in Joules. For pulse energy, the display is arranged to show one pulse as large as possible, and the cursors set one either side of the pulse. The energy in the pulse is displayed. The total energy between any two points can also be shown.
-
Page 28: Other Functions
Other Functions Detector Temperature Some types of detector head have a temperature sensor and the ADM-1000 will show the detector temperature on the display as shown in diagram 2. If the detector temperature exceeds a preset level the temperature indication will flash as a warning that continued use may permanently damage the detector. -
Page 29: Specifications
Keypad: 17 keys with tactile feedback. Illumination: Green LED on both display and keypad. User settable brightness. Detector Input: Lasermet Detector Heads. DVI-I connector. Analogue sample rate: Depends on Detector Head type, up to 1MHz. Analogue risetime: 700ns typical. Analogue input 0 –... -
Page 30: Connecting The Adm-1000 To A P.c
USB power the USB lead should not exceed 2m. If the ADM-1000 is connected to a low power port such as a USB hub which has no power supply of its own, or a long USB lead is used, the meter will need batteries or a power adaptor. - Page 31 Properties box opens, click ‘Device Manager’. Click on the ‘+’ sign next to ‘Ports (COM & LPT)’. In the list should be the entry, ‘Lasermet ADM-1000 (COMX) where X is the COM port number. Make a note of this number. Close the Device Manager.
-
Page 32: Data Output
Set the ADM1000 to the desired display settings including numerical or waveform mode, ranges etc. so that the required information is being shown on the screen. Press the menu button on the ADM1000 and scroll down to ‘Logging’, press the green tick. -
Page 33: Adm-1000 Firmware Update
.net Framework is required, it can be downloaded and installed from the Microsoft website www.Microsoft.com. To update the software in the ADM-1000, first connect and install the ADM-1000 on a PC as described above. Next locate the new software in a convenient folder on the PC from where it can be accessed. - Page 34 Make sure the Manual Start option is not ticked, then click Start. The meter should give two short beeps and the download should start automatically. On completion the meter should restart, showing the new version on the screen. The ADM Update utility will show “Successful Update” as shown above and can then be closed.
-
Page 35: Pc Interface Program User Manual (Part 2)
Advanced Digital Meter ADM-1000 PC Interface Program User Manual (Part 2) May 2012 35 of 49 June 2012... -
Page 36: Introduction
Introduction The ADM-1000 is an advanced hand-held or bench Digital Meter. It is used in conjunction with one of a range of detector heads for measuring and displaying optical power and waveforms. The PC Interface Program extends the user interface of the meter: ... -
Page 37: Removing The Program
If the meter has not previously been connected in this way, the PC will run the Windows ‘Found New Hardware’ wizard. In this case, follow the instructions in the ADM-1000 meter manual to install the USB drivers. When this has been done, the PC is ready to communicate with the meter. - Page 38 You will now know which COM port to select from the drop-down list, so make the selection and click on OK. The main window of the program should open: 38 of 49 June 2012...
-
Page 39: Basic Controls
Basic controls The program initially displays the numeric power reading and a bargraph, which is regularly updated. Controls are provided which allow the user to set the power range and the meter mode from the PC. Power range The power range adjustment can be set to auto or manual and the full-scale range can be selected in manual mode. -
Page 40: Capturing A Log File
Capturing a log file To record long-term power variations, a log file can be captured. From the Meter menu, select Logging..A dialog box will be displayed: To create a log file, follow these steps: Enter the file name and path of the log file you wish to create (the easiest way to do this is via the Browse... -
Page 41: Viewing A Log File
Viewing a log file Log files can be viewed in two ways: by loading into a spreadsheet program such as Microsoft Excel and by displaying using the internal viewer. Using Excel The log will be saved as a CSV (comma separated variable) file, which is a plain text file corresponding to a spreadsheet, in which columns are separated by commas and lines by newline characters. -
Page 42: Using The Internal Viewer
Using the internal viewer In the Logging dialog, enter the filename of the file you would like to view (again using the Browse... button is the easiest way) and click on View file. The log file will be displayed as a graph: This shows a file captured with readings every 10 seconds for 10 minutes, using error limits of 0.2mW and 0.8mW. -
Page 43: Graphical (Waveform) Display
Graphical (waveform) display To use the meter’s waveform capture mode, click on the Graphic Display tab. A screen like the following will be shown: This reproduces the graphic screen from the meter, but 250 points can be displayed rather than 100, and the vertical scale has greater resolution, depending on how much the user expands the view by dragging the main window border. -
Page 44: Cursor Measurements
Cursor measurements On-screen cursors can be used to make measurements from the trace, as in the following example: The cursors are enabled by checking the box in the Cursors group. The left-hand cursor is placed by positioning the mouse pointer and clicking the left button. The right-hand cursor is placed in the same way with the right mouse button. -
Page 45: Screen Appearance
Screen appearance The graphic display can be set to one of three colour schemes, ‘Oscilloscope’, ‘White paper’ or ‘Black screen’, by selecting Set graph colours from the Meter menu. The selection will be recalled the next time the program is run. Saving a waveform The displayed waveform can be saved by selecting Save graphic screen from the Meter menu. - Page 46 The output (in this case a PNG file) looks like this: The colours and layout are chosen for optimum effect when copied into a document. 46 of 49 June 2012...
-
Page 47: Saving A Waveform As Data
Saving a waveform as data To save a waveform as data, follow the same procedure but choose a CSV file instead. The program will save the trace in a form that can be opened in Excel, with the following result: This shows the beginning of the data file for the waveform shown previously. -
Page 48: Reading The Adm-1000 Firmware Version
Reading the ADM-1000 firmware version The features available from the ADM-1000 in future may depend on the version of firmware (software embedded in the meter). To read the current version number, select Read firmware version from the Meter menu. The program will then display the version number. - Page 49 Lasermet are manufacturers and suppliers of a full range of laser safety equipment and services, including: Laser Eyewear; Laser Interlock Systems- Design, Manufacture and Installation; Shutters; Warning Signs; Laser Enclosures, Curtains and Blinds; Laser and LED test and classification service;...
Need help?
Do you have a question about the ADM-1000 and is the answer not in the manual?
Questions and answers