Table of Contents
Advertisement
Available languages
Available languages
Quick Links
ARTICOLI & APPARECCHI PER MEDICINA
SISTEMA DI ACQUISIZIONE DATI ECG
DMS 300-BTT02
Manuale d'uso
ATTENZIONE: Gli operatori
devono leggere e capire completamente
questo manuale prima di utilizzare il prodotto.
33320 - 33321
Shenzhen Creative Industry Co., Ltd.
2/F Block 3 Nanyou Tian'an Industry Town
518054 Shenzhen, GD - P.R.C.
Made in China
Shanghai International Holding Corp. GmbH (Europe)
Eiffestrasse 80, 20537 Hamburg - Germany
Gima S.p.A.
Via Marconi, 1 - 20060 Gessate (MI) Italy
gima@gimaitaly.com - export@gimaitaly.com
www.gimaitaly.com
0123
Advertisement
Chapters
Table of Contents

Related Manuals for Gima DMS 300-BTT02


Summary of Contents for Gima DMS 300-BTT02
- Page 1 Gima S.p.A. Via Marconi, 1 - 20060 Gessate (MI) Italy gima@gimaitaly.com - export@gimaitaly.com www.gimaitaly.com ARTICOLI & APPARECCHI PER MEDICINA SISTEMA DI ACQUISIZIONE DATI ECG DMS 300-BTT02 Manuale d’uso ATTENZIONE: Gli operatori devono leggere e capire completamente questo manuale prima di utilizzare il prodotto.
-
Page 2: Table Of Contents
CONTENUTI Prefazione ................................ 3 Informazioni generali ............................3 Dichiarazione EMC ............................4 Capitolo 1 Descrizione dell'apparecchiatura ....................7 1.1 Uso previsto ..............................7 1.2 Specifiche tecniche ............................. 7 1.3 Collegamento hardware ..........................8 1.4 Requisiti di sistema ............................. 8 1.5 Installazione del driver della chiave di sicurezza USB ................9 1.6 Installazione del software ECG a riposo a 12 derivazioni ................. -
Page 3: Prefazione
PREFAZIONE Informazioni generali • Benvenuti nel Sistema di Acquisizione Dati ECG DMS 300-BTT02. Questo sistema include la Scatola di Ac- quisizione Dati ECG DMS 300-BTT02 e il software ECG a riposo a 12 derivazioni. • Di seguito vengono illustrate tutte le funzioni e gli utilizzi del Sistema di Acquisizione Dati ECG in modo spe- cifico per consentire all'utente di familiarizzare con esso e di comprenderlo rapidamente. -
Page 4: Dichiarazione Emc
• Il Sistema di Acquisizione Dati ECG è a prova di defibrillazione. Non è quindi necessario rimuovere gli elettrodi ECG durante la defibrillazione. • Durante la defibrillazione, non toccare il paziente, gli elettrodi o i fili conduttori. Se la defibrillazione viene eseguita durante il campionamento dell'ECG, ciò... - Page 5 Indicazioni e dichiarazione del produttore - emissioni elettromagnetiche Il Sistema di Acquisizione Dati ECG è destinato all'uso nell'ambiente elettromagnetico specificato di seguito. Il cliente o l'utente del Sistema di Acquisizione Dati ECG deve assicurarsi che venga utilizzato in tale am- biente.
- Page 6 Indicazioni e dichiarazione del produttore - immunità elettromagnetica Il Sistema di Acquisizione Dati ECG è destinato all'uso nell'ambiente elettromagnetico specificato di se- guito. Il cliente o l'utente del Sistema di Acquisizione Dati ECG deve assicurarsi che venga utilizzato in tale ambiente.
-
Page 7: Capitolo 1 Descrizione Dell'apparecchiatura
Distanza di separazione consigliate tra le apparecchiature di comunicazione RF portatili e mobili e il Sistema di Acquisizione Dati ECG Il Sistema di Acquisizione Dati ECG è progettato per l'uso in un ambiente elettromagnetico in cui i disturbi RF irradiati sono controllati. Il cliente o l'utente del Sistema di Acquisizione Dati ECG può contribuire a prevenire le interferenze elettromagnetiche mantenendo una distanza minima tra le apparecchiature di comunicazione RF portatili e mobili (trasmettitori) e il Sistema di Acquisizione Dati ECG come indicato di seguito, in base alla potenza in uscita massima dell'apparecchiatura di comunicazione. -
Page 8: Collegamento Hardware
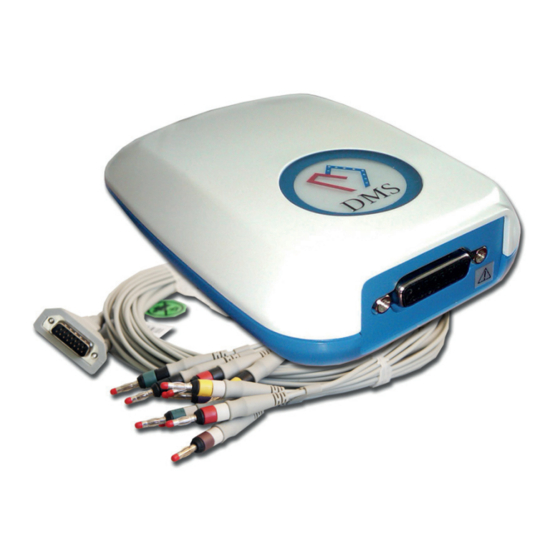
Dimensioni: Circa 120 × 85 × 28 mm Peso: Circa 190g Connettore dati: 1.3 Collegamento hardware Modello: DMS 300-BTT02 Modello cavo paziente: IEC10/L-15P-M Modello elettrodo: 01-3633 Collegare alla porta USB del computer Porta del cavo paziente Collegare al cavo paziente 1.4 Requisiti di sistema... -
Page 9: Installazione Del Driver Della Chiave Di Sicurezza Usb
È possibile modificare queste impostazioni in Windows XP/Vista/7 nelle proprietà di visualizzazione. Per ulte- riori domande sulla modifica delle impostazioni, consultare la guida di Windows XP/Vista/7. Il computer deve soddisfare i requisiti della norma EN60950-1. La stampante deve soddisfare i requisiti della norma EN60950-1. Il computer deve essere collocato al di fuori dell'AMBIENTE PAZIENTE. - Page 10 2. Selezionare l'opzione "I accept the terms in the license agreement" (accetto le condizioni del contratto di licenza). Fare clic su "Next" per continuare (Figura 1.5-3). Figura 1.5-3 Fare clic su "Next" per continuare Figura 1.5-4 Fare clic su "Install" per continuare con l'installazione...
-
Page 11: Installazione Del Software Ecg A Riposo A 12 Derivazioni
Figura 1.5-5 3. Fare clic su "Finish" al termine dell'installazione. Inserire la chiave di sicurezza nella porta USB del PC. Il sistema operativo guiderà automaticamente la chiave di sicurezza. Non è necessario riavviare il computer (Figura 1.5-6). Figura 1.5-6 1.6 Installazione del software ECG a riposo a 12 derivazioni 1. - Page 12 Figura 1.6-1 Inserire la password "dmsdms", fare clic su "OK". Fare clic su "Next" (Figura 1.6-2). Figura 1.6-2 Inserire il nome utente e l'organizzazione. Fare clic su "Next" per continuare (Figura 1.6-3). Figura 1.6-3...
- Page 13 3. Se si desidera modificare la cartella dati del paziente, fare clic sulla barra "Change" per selezionare la car- tella desiderata. Fare clic su "Next" per continuare (Figura 1.6-4). La directory di installazione predefinita del software è C:\ Resting12Lead. Si consiglia di selezionare un'unità con un disco rigido più...
-
Page 14: Capitolo 2 Impostazioni Di Sistema
Capitolo 2 IMPOSTAZIONI DI SISTEMA 2.1 Avviare il software PC-ECG 2.1.1 Prima di iniziare Prima di avviare l'ECG a riposo a 12 derivazioni, verificare quanto segue: • Controllare che i dispositivi di acquisizione dati ECG siano stati collegati correttamente. • Controllare che la linea di massa sia stata collegata correttamente. •... -
Page 15: Impostazioni Di Sistema
Tabella 2.2.1-1 Descrizione della schermata iniziale Voce Descrizione Pulsante Grafico: include Nuovo paziente, Referto, Strumenti e Esci. Il pul- sante Nuovo paziente include: Raccolta ECG standard, Raccolta ECG rapida, Monitoraggio ECG multiorario, Sollecitazione semplice. Il pulsante Strumen- ti include: Impostazioni di sistema, Posizionamento derivazioni, Creazione scheda cardio, Importazione dati da PDA, Uscita dati ECG e Uscita dati VCG. - Page 16 2.3.1 Informazioni generali Figura 2.3.1-1 Informazioni generali Consente all'utente di inserire nome, numero di telefono, numero di fax e indirizzo dell'ospedale. Le informa- zioni sull'ospedale appariranno nell'intestazione delle pagine del referto finale. Consente all'utente di inserire il nome, il numero di telefono e l'indirizzo del medico. Le informazioni appariran- no nell'intestazione delle pagine del referto.
- Page 17 2.3.3 Elaborazione del segnale In questa finestra è possibile impostare il filtro software, il tempo di campionamento e la porta COM (Figura 2.3.3-1). Figura 2.3.3-1 Elaborazione del segnale Filtro Un filtro software è progettato per eliminare i rumori dalle onde ECG. •...
- Page 18 2.3.4 Impostazione analisi Figura 2.3.4-1 Impostazione analisi Canale frequenza cardiaca Selezionare una derivazione per il calcolo della frequenza cardiaca. Per Derivazioni di Wilson, selezionare un canale qualsiasi tra le 12 derivazioni disponibili. Per Derivazioni di Frank, selezionare un canale qualsiasi tra X, Y e Z.
- Page 19 2.3.5 Impostazione referto e password Figura 2.3.5-1 Impostazione referto Tipo di stampa Se le lettere sono sul referto invertite, provare a utilizzare un altro tipo di stampa. Colore di stampa Selezionare il nero o il colore per stampare il referto corrispondente. Referto ECG - Orizzontale (3*4+2) –...
-
Page 20: Capitolo 3 Campionamento Dei Dati
2.3.6 Gestione del sistema L'icona di "Gestione del sistema" si trova in basso a destra dell'interfaccia di "Impostazioni di sistema". Fare clic con il tasto sinistro del mouse sull'icona. Figura 2.3.6-1 Gestione del sistema La password è "dms". L'utente può modificare l'impostazione del guadagno dell'hardware quando entra in "Gestione del sistema"; l'impostazione predefinita è... - Page 21 2. Utilizzando cavi standard a 12 derivazioni, seguire la procedura riportata di seguito: Per l'acquisizione dell'ECG standard è necessario applicare 4 elettrodi sugli arti e 6 sul torace. Gli elettrodi degli arti devono essere posizionati sopra polsi e caviglie. Ogni cavo è contrassegnato come segue: Posizioni degli elettrodi toracici Quarto spazio intercostale al limite destro dello sterno.
-
Page 22: Avvio Di Un Esame Su Un Nuovo Paziente
gato a una presa debitamente messa a terra. Per toraci estremamente pelosi, annidare gli elettrodi nei peli per massimizzare l'adesione o radersi le aree, o utilizzare nastro adesivo sopra gli elettrodi. NOTA Se la cute del paziente è sporca, pulirla prima con alcol etilico al 70% (alcool isopropilico) e asciugarla completamente. - Page 23 L'utente può scegliere di eseguire tutte queste funzioni o una qualsiasi di esse. Se l'utente seleziona "ECG simultaneo a 12 derivazioni", al termine del campionamento si illuminano i pulsanti ECG, FCG, HFECG e QTD. Se l'utente seleziona "VCG simultaneo a 3 derivazioni", si illuminano i pulsanti SAECG, VCG e TVCG. 3.2.1 Inserimento delle informazioni paziente Fare clic su "Avanti"...
- Page 24 Cancella Fare clic su "Cancella" per eliminare le informazioni precedenti e digitare quelle nuove. Scheda Altre informazioni – Fattori di rischio – Classe di sintomi Queste informazioni sono solo per i riferimenti del medico e non influiscono sui risultati dell'analisi. Figura 3.2.1-2 Altre Informazioni 3.2.2 Campionamento ECG simultaneo a 12 derivazioni Dopo aver compilato le informazioni sul paziente, fare clic con il pulsante sinistro del mouse su "Avanti"...
- Page 25 Seguire la procedura guidata, collegare il cavo paziente al paziente. Fare clic su "Avanti" per continuare. Figura 3.2.2-2 Schermata di campionamento ECG Campionamento ECG All'inizio del campionamento ECG, i tracciati ECG sono di colore giallo e non vengono registrati dal computer. Assicurarsi che la frequenza cardiaca venga identificata dal programma.
- Page 26 Pausa Fare clic su "Pausa" per interrompere il campionamento. Fare clic su "Riavvia" per avviare un nuovo campio- namento se si riscontrano rumori o altri eventi imprevisti, ad esempio elettrodi allentati. Se si esegue il campionamento solo dell'"ECG simultaneo a 12 derivazioni", al termine del campionamento verrà...
-
Page 27: Impostazione Componenti Ecg
Figura 3.2.3-2 Campionamento dati VCG Campionamento dati VCG All'inizio del campionamento, i tracciati ECG sono di colore giallo e non vengono registrate dal computer. Controllare se la frequenza cardiaca è stata identificata dal programma. È possibile controllare se la frequenza cardiaca è... -
Page 28: Raccolta Rapida Ecg
Impostazione componenti ECG Dopo l'acquisizione di un ECG in modalità automatica, i punti di misura globali per • P1: P onset • P2: P offset • D: QRS onset • S: QRS offset • T1: T onset • T2: T offset possono essere regolati manualmente. - Page 29 Successivo Fare clic sul tasto "Destra" per scegliere il battito a destra di quello attuale. Precedente Fare clic sul tasto "Sinistra" per selezionare il battito a sinistra di quello corrente. Modifica Fare clic sul pulsante "Modifica" per etichettare il battito come VE, SVE, Pausa, Normale, Ritmato, Artefatto, Mancata registrazione o Mancata rilevazione.
- Page 30 Modifica del dizionario dei dati Puntare e fare clic sul campo vuoto e digitate la descrizione. Al termine della digitazione della descrizione, fare clic sulla barra "Aggiungi". La nuova etichetta verrà aggiunta all'elenco. Fare clic su "OK". Se si desidera eliminare un'etichetta dall'elenco, fare semplicemente clic sull'etichetta che si desidera rimuo- vere.
- Page 31 Figura 4.1-3 Complesso Complesso grande Fare clic sulla scheda Complesso Grande per visualizzare un singolo canale della frequenza cardiaca Figura 4.1-4 Complesso Scansione pagina Fare clic sulla scheda Scansione Pagina per visualizzare dati ECG di 90 secondi.
- Page 32 Figura 4.1-5 Scansione pagina Interpretazione Fare clic sulla scheda Interpretazione per rivedere i parametri ECG, modificare le conclusioni e stampare il referto. Figura 4.1-6 Interpretazione...
-
Page 33: Analisi Fcg (Ecg Di Frequenza)
4.2 Analisi FCG (ECG di frequenza) 4.2.1 Diagnosi di localizzazione CAD Fare clic con il pulsante sinistro del mouse sull'icona "FCG" per accedere all'Analisi dell'ECG di frequenza (Figura 4.2.1-1). Figura 4.2.1-1 Cardiogramma dominio della frequenza In base alla distribuzione dello spettro di potenza ECG positivo su 12 derivazioni, il sistema CAD (diagnosi di localizzazione di arteriopatia cardiaca) fornisce automaticamente la posizione dell'ischemia miocardica e CAD. - Page 34 NOTA: Se più di una delle condizioni di cui sopra è soddisfatta contemporaneamente, selezionare quella che viene prima dall'alto. Se più del 10% dei battiti cardiaci sono anomalie, non eseguire l'analisi FCG. Perché i battiti anomali influiscono in modo significativo sui risultati delle analisi e non sono affidabili. Tabella 4.2.1-2 Descrizione della schermata di diagnosi di localizzazione CAD Voce Descrizione...
- Page 35 PHS: Deviazione e fluttuazione maggiori del cambio di fase. Scarsa funzione di conduzione dei vasi sanguigni. Modifica delle dinamiche del sangue. Correlazione incrociata. Funzione di trasferimento (modulo). Coerenza (CHR) Sono i gradi di corrispondenza reciproca dell'attività elettrica delle diverse parti del cuore, la coerenza della frequenza di ampiezza e del cambio di fase e la qualità...
- Page 36 Per ridurre l'immagine, fare clic con il pulsante destro del mouse su un punto qualsiasi dello schermo. Per ingrandire l'immagine, fare clic con il pulsante sinistro del mouse su un punto qualsiasi dello schermo. 4.2.4 Tabella indici Figura 4.2.4-1 Tabella indici Tabella indici Gli indici sono indipendenti dall'ECG convenzionale e sono unici in quanto più...
-
Page 37: Ecg Ad Alta Frequenza (Hfecg)
4.3 ECG ad alta frequenza (HFECG) I segnali ECG visibili su un ECG convenzionale hanno ampiezze di un millivolt e sono caratterizzati da frequen- ze inferiori a 100Hz. Le componenti normalmente invisibili hanno ampiezze dell'ordine di microvolt e sono ca- ratterizzate da una frequenza compresa all'incirca tra i 150 Hz a e i 250 Hz. -
Page 38: Dispersione Qt
Dizionario dei dati: fare clic sul pulsante con la freccia rivolta verso il basso e selezionare il termine dall'elenco. Fare clic sulla barra "Inserisci" per aggiungere il termine selezionato a "Interpretazione consigliata". Fare clic sul pulsante "Salva". Fare clic sulla barra "Calcola" per ottenere i risultati dell'analisi automatica. Fare clic sulla barra "Cancella"... -
Page 39: Ecg Mediato Del Segnale (Saecg)
Impostazione componenti QT I risultati di QTD sono il valore medio delle 5 onde consecutive. Utilizzare le frecce su e giù presenti sulla ta- stiera per selezionare l'onda per l'analisi QTD. Puntare il mouse sul canale che si desidera impostare. Le onde diventano verdi. Vi sono tre linee verticali sull’onda selezionata. - Page 40 facendo clic su di essa è possibile eliminare i battiti ECG indesiderati. Con il procedimento inverso è possibile accettare i battiti precedentemente rifiutati. È consigliabile rimuovere i battiti con artefatto dal file SAECG Late Potential. È possibile accedere al minuto 1 puntando e facendo clic con il mouse sulla scheda Pagina 1, op- pure è...
- Page 41 4.5.1 Procedura consigliata per l'esecuzione dell'esame SAECG 1. Applicare le derivazioni di Frank X, Y, Z. 2. Richiedere al paziente di riposare, disteso sulla schiena per 10 minuti prima di posizionare gli elettrodi sul paziente. Durante l'esame, il paziente deve rimanere nella stessa posizione di riposo senza muoversi né parlare.
- Page 42 Si noti che il QRS filtrato è di solito maggiore rispetto al QRS standard. I risultati dei calcoli vengono visualizzati nella casella dei dati in alto a destra dello schermo. Per uscire, fare clic con il pulsante Chiudi con il tasto sinistro del mouse nell'angolo in alto a destra dello schermo.
-
Page 43: Ecg A Vettore (Vcg)
4.6 ECG a vettore (VCG) Per accedere all’analisi VCG, fare clic con il tasto sinistro del mouse sull’icona "VCG" (Figura 4.6-1). Figura 4.6-1 ECG a vettore Tabella 4.6-1 Descrizione della schermata dell'ECG a vettore Voce Descrizione Sequenze dei vettori del piano frontale. Sequenze dei vettori del piano orizzontale. - Page 44 Piano frontale Figura 4.6-2 Piano frontale Questa schermata permette di visualizzare le sequenze dei vettori come animazioni. Per impostare la velocità delle animazioni, puntare il mouse sulla barra della velocità di riproduzione e trascinare fino alla posizione de- siderata. Fare clic sulla freccia giù e selezionare il guadagno. Dopo aver impostato la velocità...
- Page 45 3D (sequenze dei vettori in tre dimensioni) Tale funzione consente di visualizzare le sequenze dei vettori in tre dimensioni. Vi sono tre stili di visualizzazio- ne, ovvero Linea, Riempimento e Trasparente. Se si seleziona lo stile "Linea", le altre due opzioni diverranno grigie e non sarà...
-
Page 46: Ecg A Vettore Cronometrato (Tvcg)
4.7 ECG a vettore cronometrato (TVCG) Figura 4.7-1 ECG a vettore cronometrato Con questa funzione è possibile visualizzare l'ECG a vettore consecutivo sull'asse temporale. La metà superiore della schermata mostra l'ECG a tre canali X, Y, Z. La metà inferiore mostra l’ECG a vettore sui tre piani "X-Y", "X-Z"... -
Page 47: Capitolo 5 Altre Funzioni Del Software
Capitolo 5 ALTRE FUNZIONI DEL SOFTWARE 5.1 Gestione della banca dati Figura 5.1-1 Banca dati dei pazienti Cerca È possibile eseguire ricerche per ciascun paziente con criteri diversi quali directory, ID, nome, sesso, età, nu- mero di telefono, data di registrazione, medico di riferimento e tipo di apparecchiature. Cancella Fare clic sulla barra "Cancella condizione"... -
Page 48: Ripetizione Delle Analisi
in cui si desidera salvare i dati. I dati saranno spostati nella directory specificata. Per salvare i dati su CD è necessario installare un software per la masterizzazione di CD. Masterizzare dei file paziente sul CD. Importa Per visualizzare i dati esportati su un’altra directory o su CD, è necessario reimportare tali dati nella banca dati dei pazienti. -
Page 49: Scheda Cardio
Impostazione componenti ECG Nell’interfaccia Ripetizione delle analisi, l’utente deve impostare i componenti ECG. È possibile impostare i componenti ECG sia dalle singole derivazioni sia da tutte le derivazioni. • P1: P onset • P2: P offset • D: QRS onset •... -
Page 50: Referto
Stampa Fare clic su "Stampa" per stampare il referto. Anteprima Fare clic su "Anteprima" Per visualizzare l'anteprima di stampa. Salva impostazioni Fare clic su "Salva impostazioni" per salvare tutte le impostazioni. Esci Fare clic su "Esci" per chiudere la funzione. 5.4 Referto Figura 5.4-1 Referto Fare clic sull'icona "Referto"... -
Page 51: Esercizio
5.5 Esercizio La presente funzione è stata progettata per funzionare con il "Esame sotto sforo in due fasi". Fare clic sull'ico- na "Esercizio" nella schermata iniziale. Verrà visualizzata la seguente immagine. Figura 5.5-1 Inserimento delle informazioni paziente Inserimento delle informazioni paziente Immettere le informazioni sul paziente quali nome, ID, età, sesso, tipo di dispositivo di campionamento ECG, ecc. - Page 52 Tabella 5.5-1 Descrizione della schermata di campionamento dell'ECG sotto sforzo Voce Descrizione Mostra l'ECG a riposo. L'ECG iniziale di alcuni secondi viene selezionato come ECG a riposo e visualizzato entro 5 secondi dall'inizio del campionamento. Le attuali onde ECG. Modificare il guadagno e la velocità dell’ECG facendo clic sui pulsanti "Guadagno"...
- Page 53 Recupera Contrassegnare l'inizio della fase di recupero. Fare clic su questa icona dopo la ricezione della FC obiettivo. Salva Durante il campionamento ECG, è possibile salvare i tracciati ECG correnti facendo clic sull'icona "Salva". Questi tracciati ECG possono essere stampati al termine del campionamento. Consente di salvare 10 tracciati ECG.
- Page 54 Stampa Per visualizzare l'anteprima e stampare i referti ECG. Fare clic sul pulsante "Stampa" per visualizzare la se- guente immagine (Figura 5.5-6). Figura 5.5-6 Stampa referto La metà sinistra dello schermo mostra le impostazioni effettuate nel "Menu". La metà destra dello schermo mostra i tracciati ECG salvati.
-
Page 55: Capitolo 6 Interpretazione Del Referto
Capitolo 6 INTERPRETAZIONE DEL REFERTO 6.1 ECG simultaneo a 12 derivazioni Figura 6.1-1 ECG simultaneo a 12 derivazioni In alto a destra dell'immagine, viene mostrata la velocità e il guadagno che è di 25 mm/s e 10 mm/s. - Page 56 All'estrema destra dell'immagine, sono riportati PA, QA, SA, STM e TA, descritti come segue: Tabella 6.1-1 Interpretazione dei parametri Voce Descrizione Ampiezza dell’onda P dell’ECG mediato. Ampiezza dell’onda Q dell’ECG mediato. Ampiezza dell’onda S dell’ECG mediato. Massimo segmento ST. Ampiezza dell’onda T dell’ECG mediato. Nell’angolo in basso a sinistra sono visualizzati frequenza, durata dell’esame, frequenza cardiaca, durata P, durata QRS, durata T, intervallo PR, intervallo QT, intervallo QTc, asse P, asse QRS e asse T.
- Page 57 Figura 6.1-3 ECG simultaneo a 12 derivazioni Tabella 6.1-2 Interpretazione della tabella dei dati Voce Descrizione P+(mV) Ampiezza dell’onda P con andamento positivo P-(mV) Ampiezza dell’onda P con andamento negativo Q (mV) Ampiezza dell’onda Q R (mV) Ampiezza dell’onda R S (mV) Ampiezza dell’onda S R' (mV)
-
Page 58: Ecg Di Frequenza (Fgc)
Voce Descrizione ST60 (mV) Ampiezza del segmento ST a 60 ms dopo il punto J ST80 (mV) Ampiezza del segmento ST a 80 ms dopo il punto J T+ (mV) Ampiezza dell’onda T con andamento positivo T- (mV) Ampiezza dell’onda T con andamento negativo Q (ms) Tempo dell’onda Q R (ms) -
Page 59: Ecg Ad Alta Frequenza
Figura 6.2-2 Analisi della frequenza Il primo e il secondo elenco sul referto indicano la potenza dello Spettro di frequenza dell’ECG a 12 derivazioni. Il terzo elenco indica la correlazione tra le derivazioni II e V 6.3 ECG ad alta frequenza Figura 6.3-1 ECG ad alta frequenza Nell’angolo in basso a sinistra è... -
Page 60: Dispersione Qt
Nell’angolo in basso a destra è visualizzato il parere del medico. 6.4 Dispersione QT Figura 6.4-1 Dispersione QT All’estrema destra del referto QTD, i dati evidenziati dal rettangolo nero indicano il valore massimo del QT/ QTM. I dati evidenziati dal rettangolo bianco indicano il valore minimo del QT/QTM. QT: intervallo tra il punto Q e T end. -
Page 61: Ecg Orario
6.5 ECG orario Figura 6.5-1 ECG orario Tabella 6.5-1 Interpretazione della tabella dei dati Voce Descrizione SDNN Deviazione standard di intervalli da normale a normale. rMSSD Radice quadrata del valore quadratico medio della differenza di intervalli RR successivi. SDSD Deviazione standard della differenza di intervalli RR successivi. pNN10 Percentuale di intervalli RR con differenza >... -
Page 62: Ecg Mediato Del Segnale (Saecg)
6.6 ECG mediato del segnale (SAECG) Figura 6.6-1 ECG mediato del segnale Tabella 6.6-1 Interpretazione della tabella dei dati Voce Descrizione QRS std (ms) Deviazione standard di intervalli da normale a normale. QRS totale (ms) Radice quadrata del valore quadratico medio della differenza di intervalli RR successivi. Sotto 40 (ms) La durata del complesso QRS filtrato terminale rimane al di sotto dei 40 microvolt. -
Page 63: Ecg A Vettore
6.7 ECG a vettore Figura 6.7-1 ECG a vettore Dall’alto verso il basso sono mostrate le informazioni relative a Piano frontale, Piano orizzontale e Piano sag- gitale. Prendendo per esempio il Piano frontale, sulla sinistra sono indicate la sequenza QRS e la percentuale di area nei quattro quadranti. -
Page 64: Ecg A Vettore Cronometrato
6.8 ECG a vettore cronometrato Figura 6.8-1 ECG a vettore cronometrato La parte superiore della schermata mostra i tre canali ECG X, Y e Z. La parte centrale della schermata mostra l'ECG a vettore consecutivo sull’asse del tempo. La parte inferiore dello schermo mostra le sequenze del Pia- no frontale, del Piano orizzontale e del Piano saggitale destro. -
Page 65: Appendice
Appendice Appendice A: Procedura di base raccomandata per l’utilizzo del software ECG a riposo a 12 derivazioni. Al primo utilizzo del software ECG A RIPOSO A 12 DERIVAZIONI, si consiglia di eseguire le seguenti operazioni per facilitare l'esecuzione di nuovi esame e analisi del paziente. 1. - Page 66 3. Non immergere, bagnare né pulire con vapore il cavo paziente. 4. Il cavo paziente deve essere disinfettato con una soluzione di ipoclorito di sodio (candeggina) al 10% in acqua. Manutenzione della Scatola di Acquisizione Dati ECG 1. Mantenere la Scatola di Acquisizione Dati ECG pulita. 2.
- Page 67 La garanzia non è valida in caso di: riparazione effettuata da personale non autoriz- zato o con pezzi di ricambio non originali, avarie o vizi causati da negligenza, urti o uso improprio. GIMA non risponde di malfunzionamenti su apparecchiature elettroniche o software derivati da agenti esterni quali: sbalzi di tensione, campi elettromagnetici, interferenze radio, ecc.
- Page 68 Gima S.p.A. Via Marconi, 1 - 20060 Gessate (MI) Italy gima@gimaitaly.com - export@gimaitaly.com www.gimaitaly.com PROFESSIONAL MEDICAL PRODUCTS ECG ACQUISITION SYSTEM DMS 300-BTT02 User manual ATTENTION: The operators must carefully read and completely understand the present manual before using the product.
- Page 69 CONTENTS Preface ................................3 General Information ............................3 EMC Declaration ............................... 4 Chapter 1 Equipment Overview ........................7 1.1 Intended Use ............................... 7 1.2 Specifications .............................. 7 1.3 Hardware Connection ..........................8 1.4 System Requirements ..........................8 1.5 USB security key driver installation ......................9 1.6 Resting 12-Lead ECG Software Installation ....................
-
Page 70: Preface
PREFACE General Information • Welcome to the DMS 300-BTT02 ECG Acquisition System. This system Include DMS 300-BTT02 ECG Ac- quisition Box and Resting 12-Lead ECG Software. • In the following, we will introduce all the functions and uses of ECG Acquisition System specifically so that you can get familiar with it and grasp it quickly. -
Page 71: Emc Declaration
• The electrodes should be in accordance with the requirements of ANSI/AAMI EC12 and Directive 93/42/EEC. • The used electrodes should be disposed of in accordance with the requirements of environment pro- tection. • The equipment is used in accordance with the instructions given in this manual. •... - Page 72 Guidance and manufacturer’s declaration – electromagnetic emissions The ECG Acquisition System is intended for use in the electromagnetic environment specified below. The customer or the user of the ECG Acquisition System should assure that it is used in such an environment. Emissions test Compliance Electromagnetic environment –...
- Page 73 Guidance and manufacturer’s declaration – electromagnetic immunity The ECG Acquisition System is intended for use in the electromagnetic environment specified below. The customer or the user of the ECG Acquisition System should assure that it is used in such an electromagne- tic environment.
-
Page 74: Chapter 1 Equipment Overview
Recommended separation distances between portable and mobile RF communications equipment and the ECG Acquisition System The ECG Acquisition System is intended for use in an electromagnetic environment in which radiated RF disturbances are controlled. The customer or the user of the ECG Acquisition System can help prevent elec- tromagnetic interference by maintaining a minimum distance between portable and mobile RF communica- tions equipment (transmitters) and the ECG Acquisition System as recommended below, according to the maximum output power of the communications equipment. -
Page 75: Hardware Connection
500 - 1060hPa. Dimensions: Approximately 120 × 85 × 28 mm Weight: Approximately 190g Data Connector: 1.3 Hardware Connection Model: DMS 300-BTT02 Patient Cable Model: IEC10/L-15P-M Electrode Model: 01-3633 Connect to computer USB port Patient cable port Connect to patient cable 1.4 System Requirements... -
Page 76: Usb Security Key Driver Installation
You can change these settings in Windows XP/Vista/7 in display property. If you have other questions in chan- ging settings, please refer to Windows XP/Vista/7 help. The computer should meet the requirements of EN60950-1. The printer should meet the requirements of EN60950-1. The computer should be placed outside the PATIENT ENVIRONMENT. - Page 77 2. Make a checkmark in the option “I accept the terms in the license agreement”. Click “Next”. (Figure 1.5-3) Figure 1.5-3 Click “Next” to continue Figure 1.5-4 Click “Install” to continue...
-
Page 78: Resting 12-Lead Ecg Software Installation
Figure 1.5-5 3. Click “Finish”. Plug the security key into the USB port of PC. The operation system will automatically drive the security key. It does not need to restart computer. (Figure 1.5-6). Figure 1.5-6 1.6 Resting 12-Lead ECG Software Installation 1. - Page 79 Figure 1.6-1 Input password“dmsdms”,click “OK”, Click “Next”. (Figure 1.6-2) Figure 1.6-2 Input user name and organization. Click “Next”. (Figure 1.6-3). Figure 1.6-3...
- Page 80 3. If you want to make change of the patient data directory, click “Change” bar to select the desired directory. Click “Next”. (Figure 1.6-4). The default installation directory of the software is C:\ Resting12Lead. It is recommended to select the drive with bigger hard disk. If the windows system is installed on the C:\ drive, it is better to save the patient data on other drive.
-
Page 81: Chapter 2 System Settings
Chapter 2 SYSTEM SETTINGS 2.1 Launch the PC-ECG Software 2.1.1 Before You Begin Before start Resting 12-Lead ECG, please check the following things: • Check if the ECG acquisition devices have been correctly connected. • Check if the ground line has been properly connected. •... -
Page 82: System Settings
Table 2.2.1-1 Initial Screen Description Items Description Graph Button: include New Patient, Report, Tools and Exit. The new patient button include Standard ECG Collecting, Quick ECG Collecting, Multi-Hour ECG Monitoring, Simple Stress. Tools button include System setting, Leads Placement, Make Cardio Card, Import data from PDA, Output ECG data and Output VCG data. - Page 83 2.3.1 General Information Figure 2.3.1-1 General information It allows user to enter name, phone number, fax number and address of hospital. The hospital information will appear on the heading of the final report pages. It allows user to enter physician’s name, phone number and address. The information will appear on the hea- ding of the report pages.
- Page 84 2.3.3 Signal Processing In this window you are allowed to set software filter, sample time and COM port (Figure 2.3.3-1). Figure 2.3.3-1 Signal Processing Filter A software filter is designed to help eliminate noises from ECG waves. • Enable Main Filter: click the dropdown list and select 50Hz or 60 Hz. •...
- Page 85 2.3.4 Analysis Setting Figure 2.3.4-1 Analysis Setting Heart Rate Channel Select a lead for heart rate calculation. For Wilson Lead, select any channel from 12 leads. For Frank Lead, select any channel from X, Y and Z. It is recommended to select the lead with higher amplitude of “R wave” for heart rate calculation (Figure 2.3.4-1).
- Page 86 2.3.5 Report and Password Setting Figure 2.3.5-1 Report Setting Printer Type If the letters are reverse on the report, try to use another printer type. Print Color Select black or color to print corresponding report. ECG Report – Landscape (3*4+2) –...
-
Page 87: Chapter 3 Data Sampling
2.3.6 System Manager The icon of “System Manager” is in the Low Right of the interface of “System Setting”. Single click the icon with left mouse button. Figure 2.3.6-1 System Manager The password is “dms” User can make changes of the hardware gain setting when you enter into “System Manager”, the default set- ting is “100%”. - Page 88 2. Using standard 12-lead cables, follow the procedure below: For acquisition of the standard ECG leads 4 electrodes must be applied on the limbs and 6 on the chest. The limb electrodes should be placed above wrists and ankles. Each lead is marked as follows: Chest Electrode Locations Fourth intercostal space at the right border of the sternum Fourth intercostal space at the left border of the sternum...
-
Page 89: Start A New Patient Test
Also, check that the computer is plugged into a properly grounded socket. For extremely hairy chests, nestle the electrodes in the hair to maximize adhesion or shave the areas, or use adhesive tape over the electrodes. NOTE If the patient’s skin is dirty, first cleanse with 70% Ethyl Alcohol (Rubbing Alcohol) and dry the skin completely. - Page 90 If user select “12-lead Simultaneous ECG”, when sampling finishes, the ECG, FCG, HFECG, QTD, button will be lighted up. If user select “3-lead Simultaneous VCG”, SAECG, VCG and TVCG will be lighted up. 3.2.1 Input Patient Information Click “Next” to Patient Information. Figure 3.2.1-1 Patient Information In this screen, it allows user to enter some basic information such as name, age, weight, date etc.
- Page 91 Clear Click “Clear” to delete the previous information and type in the new one. Other Information Tab – Risk Factors – Symptom Class This information is only for doctor’s references and will not affect the analysis results. Figure 3.2.1-2 Other Information 3.2.2 12-lead Simultaneous ECG Sampling After filling in the patient information, single click “Next”...
- Page 92 Follow the wizard, connect patient cable to patient. Click “Next” to continue. Figure 3.2.2-2 ECG Sampling Screen ECG Sampling At the beginning of ECG sampling, the ECG strips are yellow color and are not recorded by computer. Ensure the heart rate is identified by the program. You have two methods to check with this. •...
- Page 93 Pausa Click “Pause” to stop sampling. Click “Restart” to start a new sampling if you find some noises or other unex- pected things happened such as electrodes loose. If you only sample “12-lead Simultaneous ECG”, after sampling finishes, it will go to “Set ECG Components” screen (See section 3.3 “Set ECG Components”).
-
Page 94: Set Ecg Components
Figure 3.2.3-2 VCG Data Sampling VCG Data Sampling At the beginning of the sampling the ECG strips are yellow color and not recorded by computer. Check if the heart rate has been identified by the program. You can check if the heart rate had been displayed or the beep sound can be heard with each beat. -
Page 95: Quick Ecg Collecting
Set ECG Components After acquisition of an ECG in the automatic mode, the global measurement points for • P1: P onset • P2: P offset • Q: QRS onset • S: QRS offset • T1: T onset • T2: T offset Can be adjusted manually. - Page 96 Next Click “Right” Key to choose the beat on the right of the present one. Previous Click “Left” Key to select the beat on the left of the present one. Edit Click “Edit” button to label the beat as VE, SVE, Pause, Normal, Paced, Artifact, Failure to Capture or Failure to Sense.
- Page 97 Edit Data Dictionary Point and click on the blank field and type in the description. After you finish typing in the description, click on the “Add” bar. The new label will be added to the list. Click “OK”. If you want to delete a label from list, simply click on the label you want to remove. It will be highlighted in blue. Click “Delete”...
- Page 98 Figure 4.1-3 Complex Complex Big Click complex big tab show you a single channel complex beat. Figure 4.1-4 Complex Page Scan Click Page Scan tab you can see a 90 seconds ECG data.
- Page 99 Figure 4.1-5 PageScan Interpretation Click Interpretation tab you can review the ECG parameter, and change the conclusion, print report. Figure 4.1-6 Interpretation...
-
Page 100: Fcg (Frequency Ecg) Analysis
4.2 FCG (Frequency ECG) Analysis 4.2.1 CAD Locating Diagnosis Single click “FCG” icon with left mouse button to enter into Frequency ECG analysis (Figure 4.2.1-1). Figure 4.2.1-1 Frequency Domain Cardiogram According to the distribution of the positive ECG power spectrum on 12 leads, CAD (Cardiac Artery Disease Locating Diagnosis) system will automatically give the location of CAD and myocardial ischemia. - Page 101 NOTE: If more than one of above conditions is met at the same time, select the one that comes first from above. If more than 10% heart beats are abnormalities, do not perform the FCG analysis. Because the abnor- mal beats will significantly affect the analysis results and the results are not reliable. Table 4.2.1-2 CAD Locating Diagnosis Screen Description Items Description...
- Page 102 PHS: Great deviation and fluctuation of phase shift. Poor conduction function of blood vessel. Change of blo- od dynamics. Cross-Correlation. Transfer function (Modulus). Coherence (CHR) These are the degree of mutual match of the electrical activity of different parts of the heart, the coherence of amplitude frequency and phase shift, and the characteristic quality or stability of the heart system.
- Page 103 To zoom out the picture, right click on any place of the screen. To zoom in the picture, left click on any place of the screen. 4.2.4 Index Table Figure 4.2.4-1 Index Table Index Table The indexes are independent of the conventional ECG and are unique because they are more sensitive. The patient with a normal conventional ECG may have some abnormal cardio spectrum index.
-
Page 104: High Frequency Ecg (Hfecg)
4.3 High Frequency ECG (HFECG) ECG signal visible on a conventional ECG have amplitudes of a millivolt and are characterized by frequencies less than 100Hz. The ordinarily invisible components have amplitudes in the microvolt range and are characte- rized by frequency from about 150Hz to about 250Hz. Deviation of these high frequency components from a normal pattern can be indicative of myocardial ischemia or myocardial infarction. -
Page 105: Qt Dispersion
Data dictionary: click on the arrow down button and select the term from list. Click “Insert” bar to add the selected term to the “Suggested Interpretation”. Click “Save” button. Click “Compute” bar to get the automatic analysis results. Click “Clear” bar to delete the results and enter again. Click “Prior”... -
Page 106: Signal Averaged Ecg (Saecg)
Set QT Components The results of QTD are the average value of the consecutive 5 waves. Use arrow up and down key on your keyboard to select the wave for QTD analysis. Mouse point on the channel you want to make settings. The waves become green color. There are three verti- cal lines on the selected wave. - Page 107 Single click “VE Chaos” icon with left mouse button to enter into Signal Averaged ECG analysis (Figure 4.5-1). Figure 4.5-1 Signal Averaged ECG Accept Placing the cursor on the rejected beats and clicking “Accept” can cause the beats to be accepted Reject Move the cursor to the desired vertical line on the R-R Interval graph, pointing and clicking “Reject”...
- Page 108 4.5.1 Recommended Procedure to Perform SAECG Test 1. Frank X, Y, Z lead hookup should be applied. 2. Require patient to rest, lying on his/her back for 10 minutes before putting hookups on patient. Patient must remain in the same position for testing without moving or talking. 3.
- Page 109 The calculation results are displayed in the data box on the right top of the screen. To exit, single click the Close with left mouse button at top right corner of the screen. 4.5.3 Frequency Domain Analysis Click on “Freq.” icon and the SAECG Frequency 3-D Graph will come up on your screen. View the Frequency Graph for Channel 1.
-
Page 110: Vector Ecg
4.6 Vector ECG (VCG) Single click “VCG” icon with left mouse button to enter into VCG analysis (Figure 4.6-1). Figure 4.6-1 Vector ECG Table 4.6-1 Vector ECG Screen Description Items Description Vector loops of Frontal Plane. Vector loops of Horizontal Plane. Vector loops of right Saggital Plane. - Page 111 Frontal Plane Figure 4.6-2 Frontal Plane In this screen you can see the animation play of the vector loops. To set the play speed, mouse point on the little bar of the play speed and drag to the desired location. Click on the down arrow and select gain. After you set the play speed and gain, click “Play”...
- Page 112 3D (Three Dimensional Vector Loops) This function allows you to observe the vector loops in three dimensions. You have three display styles which are line, fill and transparent. If there is a checkmark before the “Line” style, the other two selections will be- come grey and can’t be selected.
-
Page 113: Timed Vector Ecg (Tvcg)
4.7 Timed Vector ECG (TVCG) Figure 4.7-1 Timed Vector ECG With this function you can see the consecutive vector ECG on the time axis. The top half of the screen shows the X, Y, Z three channels ECG. The bottom half of the screen shows the “X-Y”, “X-Z”... -
Page 114: Chapter 5 Other Functions Of The Software
Chapter 5 OTHER FUNCTIONS OF THE SOFTWARE 5.1 Database Manager Figure 5.1-1 Patient Database Search You may search for any patient with many different query conditions such as directory, ID, name, sex, age, telephone number, record date, refer physician and hardware type. Clear Click “Clear Condition”... -
Page 115: Reanalysis
If you want to burn the data into CD, you must install special CD burning software. Burning the patient files to the CD. Import If you want to review the data you have exported to other directory or burned to CD, you must import these data back to the patient database. -
Page 116: Cardio Card
Set ECG Components In the reanalysis interface, user should set ECG components. You can set ECG components from single lead or all leads. • P1: P onset • P2: P offset • Q: QRS onset • S: QRS offset • T1: T onset •... -
Page 117: Report
Print Click “Print” to print the report. Preview Click “Preview” to preview the print. Save Setting Click “Save Setting” to save all of the settings you made. Exit Click “Exit” to close the function. 5.4 Report Figure 5.4-1 Report Click on the icon of “Report” on the main screen. Make a checkmark in the report you want to print out. -
Page 118: Exercise
5.5 Exercise This function is designed to work with the “Two-step Exercise Test”. Click on “Exercise” icon of the initial scre- en. The following picture will pop up. Figure 5.5-1 Input Patient Information Input patient Information Input patient information such as Name, ID, Age, Sex, and ECG sampling device type etc. There are four “Cu- stom Item”... - Page 119 Table 5.5-1 Exercise ECG Sampling Screen Description Items Description Display the resting ECG. The ECG of beginning several seconds will be selected as the re- sting ECG which will be displayed in 5 seconds after sampling starts. The present ECG waves. Make change of the ECG gain and speed by clicking on the “Gain” and “Speed”...
- Page 120 Recovery Make a mark at the beginning of the recovery stage. Usually Click on this icon after the target HR is arrived. Save During ECG sampling, you may save the present ECG strips by clicking “Save” icon. These ECG strips can be printed after sampling finished.
- Page 121 Print To preview and print ECG reports. Click “Print” button, it will pop up the following picture(Figure 5.5-6). Figure 5.5-6 Print Report The left half screen shows the settings made in the “Menu”. The right half screen shows the saved ECG strips. Click the magnifying glass icon to preview ECG strips.
-
Page 122: Chapter 6 Report Interpretation
Chapter 6 REPORT INTERPRETATION 6.1 12-lead Simultaneous ECG Figure 6.1-1 12-lead Simultaneous ECG On the top right of the picture, it shows the speed and gain which is 25mm/s and 10mm/s. - Page 123 On the far right of the picture, it shows PA, QA, SA, STM and TA which are described as follows: Table 6.1-1 Interpretation of Parameter Items Description P wave amplitude of the averaged ECG. Q wave amplitude of the averaged ECG. S wave amplitude of the averaged ECG.
- Page 124 Figure 6.1-3 12-lead Simultaneous ECG Table 6.1-2 Interpretation of Data Table Items Description P+(mV) The positive going P wave amplitude P-(mV) The negative going P wave amplitude Q (mV) Q wave amplitude R (mV) R wave amplitude S (mV) S wave amplitude R’...
-
Page 125: Frequency Ecg (Fcg)
Items Description ST60 (mV) ST segment amplitude at post J point 60ms ST80 (mV) ST segment amplitude at post J point 80ms T+ (mV) The positive going T wave amplitude T- (mV) The negative going T wave amplitude Q (ms) Q wave time R (ms) R wave time... -
Page 126: High Frequency Ecg
Figure 6.2-2 Frequency Analysis The first and second lists of the report are Frequency Spectrum power of 12-lead ECG. The third list is II and V5 dual lead correlation 6.3 High Frequency ECG Figure 6.3-1 High Frequency ECG On the left bottom corner shows the statistic table of the notches, slurs and beadings of each lead. -
Page 127: Qt Dispersion
On the right bottom corner shows the physician suggestion. 6.4 QT Dispersion Figure 6.4-1 QT Dispersion On the far right side of the QTD report, the data highlighted with black rectangle is the maximum value of the QT/QTM. The data highlighted with the white rectangle is the minimum value of the QT/QTM. QT: interval between Q point and T end. -
Page 128: Hour Ecg
6.5 Hour ECG Figure 6.5-1 Hour ECG Table 6.5-1 Interpretation of Data Table Items Description SDNN The standard deviation of normal to normal intervals. rMSSD The root-mean square of the difference of successive R-R intervals. SDSD The standard deviation of the difference of successive R-R intervals. pNN10 The percent of R-R intervals differing >... -
Page 129: Signal Averaged Ecg (Saecg)
6.6 Signal Averaged ECG (SAECG) Figure 6.6-1 Signal Averaged ECG Table 6.6-1 Interpretation of Data Table Items Description Std QRS (ms) The standard deviation of normal to normal intervals. Total QRS (ms) The root-mean square of the difference of successive R-R intervals. Under 40 (ms) Duration of the terminal filtered QRS complex remains below 40 microvolt. -
Page 130: Vector Ecg
6.7 Vector ECG Figure 6.7-1 Vector ECG Form the top to bottom shows the Frontal Plane, Horizontal Plane and Saggital Plane information. Take the Frontal Plane as an example, on the left shows the QRS loop and the area percentage in the four quadrants. In the middle shows the standard ECG as well as the gain and speed. -
Page 131: Timed Vector Ecg
6.8 Timed Vector ECG Figure 6.8-1 Timed Vector ECG The top screen shows the X, Y, Z three channels ECG. The middle screen shows consecutive vector ECG on the time axis. The bottom screen shows the loops of the Frontal Plane, Horizontal Plane and Right Saggital Plane. -
Page 132: Appendix
Appendix Appendix A: Recommended Basic Procedure of Using Resting 12-lead ECG Software. When it is the first time to use RESTING 12-LEAD ECG software, it is recommended to do according to fol- lowing steps which will help you easily perform a new patient test and analysis. 1. - Page 133 2. The devices should not work in humid environment. 3. Do not use acetone, ether, Freon, petroleum derivatives, or other solvents to clean the devices. 4. Do not let soap or water flow into the devices or come into contact with patient connector pins. 5.
- Page 134 The warranty is valid for 12 months from the date of supply of GIMA. During the period of validity of the warranty, GIMA will repair and/or replace free of charge all the defected parts due to production reasons.
Need help?
Do you have a question about the DMS 300-BTT02 and is the answer not in the manual?
Questions and answers