Sign In
Upload
Download
Table of Contents
Contents
Add to my manuals
Delete from my manuals
Share
URL of this page:
HTML Link:
Bookmark this page
Add
Manual will be automatically added to "My Manuals"
Print this page
×
Bookmark added
×
Added to my manuals
Manuals
Brands
Apogee Manuals
Measuring Instruments
PS-100
Owner's manual
Apogee PS-100 Owner's Manual
Hide thumbs
1
Table Of Contents
2
3
4
5
6
7
8
9
10
11
12
13
14
15
16
17
18
19
20
21
22
23
24
page
of
24
Go
/
24
Contents
Table of Contents
Bookmarks
Table of Contents
Table of Contents
Parts List
Setup Diagram
Order of Connections
Setup Instructions
USB2 Cable Installation
Integration Time
Specifications
Taking Measurements
Three Tips for Spectrawiz
Spectral Modes and Applications
Detailed Control Bar Descriptions
System Indicators
Menu Descriptions
Advertisement
Quick Links
Download this manual
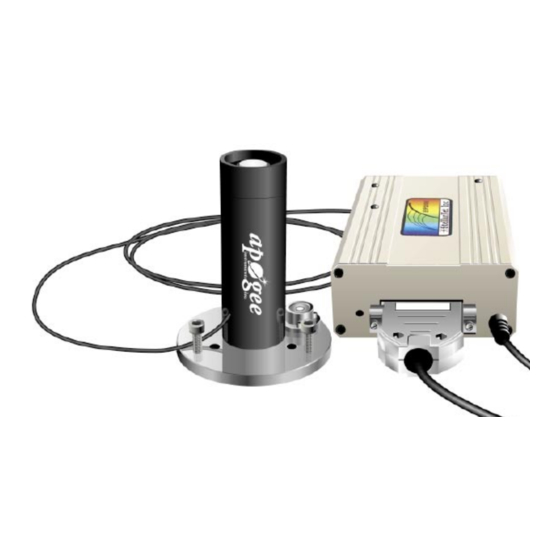
Spectroradiometer
Owners Manual
Models PS-100 & PS-200
1
Table of
Contents
Previous
Page
Next
Page
1
2
3
4
5
Advertisement
Table of Contents
Need help?
Do you have a question about the PS-100 and is the answer not in the manual?
Ask a question
Questions and answers
Related Manuals for Apogee PS-100
Measuring Instruments Apogee PS-200 Owner's Manual
(24 pages)
Measuring Instruments Apogee MC-100 Owner's Manual
Chlorophyll concentration meter (23 pages)
Measuring Instruments Apogee MQ-510 Owner's Manual
Underwater quantum meter (21 pages)
Measuring Instruments Apogee SI Series Owner's Manual
Research-grade infrared radiometer (21 pages)
Measuring Instruments Apogee MQ-100 Owner's Manual
Quantum meter (18 pages)
Measuring Instruments Apogee Quantum Manual
(12 pages)
Measuring Instruments Apogee MQX Series Owner's Manual
Quantum meter (22 pages)
Measuring Instruments Apogee SI-111 Owner's Manual
(21 pages)
Measuring Instruments Apogee SI-411 Owner's Manual
Infrared radiometer (20 pages)
Measuring Instruments Apogee MQ-500 Owner's Manual
Quantum meter (22 pages)
Measuring Instruments Apogee SS-110 Owner's Manual
Spectroradiometer (20 pages)
Measuring Instruments Apogee SIL-411 Owner's Manual
Commercial infrared radiometer (20 pages)
Measuring Instruments Apogee 2349 DLTM4 Instructions Manual
Data link test module (33 pages)
Measuring Instruments Apogee SP-110 Owner's Manual
Pyranometer (18 pages)
Measuring Instruments Apogee MC-100 Owner's Manual
Chlorophyll concentration meter (22 pages)
This manual is also suitable for:
Ps-200
Table of Contents
Print
Rename the bookmark
Delete bookmark?
Delete from my manuals?
Login
Sign In
OR
Sign in with Facebook
Sign in with Google
Upload manual
Upload from disk
Upload from URL


Need help?
Do you have a question about the PS-100 and is the answer not in the manual?
Questions and answers