Table of Contents
Advertisement
Advertisement
Table of Contents

Subscribe to Our Youtube Channel
Related Manuals for Komshine OTDR QX50


Summary of Contents for Komshine OTDR QX50
- Page 1 KomShine QX50 OTDR User Manual Optical Time Domain Reflectometer...
- Page 2 Fast Operation Instruction for Using Buttons ] Home page button: ● Escape from the current page and back to the home page directly. ● The button used together with button [ ] can realize in the OTDR home page "event, parameters, fiber link, AB cursor”...
- Page 3 trace graph area. ● In the menu dialog box, it serves as a Tab switching key role, that is, the function switch under each menu in the dialog box. ● On the home page of OTDR function module, the button used together with button [ can realize in the OTDR home page "event, parameters, fiber link, AB cursor”...
-
Page 4: Table Of Contents
Contents 1 Copyright Information ..............................5 2 Safety Information ................................6 3 Appearance Diagram of OTDR Product ........................8 3.1 Introduction to Electrical Interface of Instrument.....................9 3.2 Instruction of Optical Interface of Instrument ....................9 3.3 Instruction of Buttons on the Instrument......................10 4 Introduction to Home Page of OTDR .........................12 5 Introduction to Operation of VFL..........................13 6 Introduction to OTDR..............................14 6.1 Measuring Purpose of OTDR...........................14... - Page 5 8.1.1 Requirements to the Installation Environment..................35 8.1.2 Software Installation Steps........................35 8.1.3 Screen Resolution Ration Setting ......................35 8.2 Instruction of Interface of PC Terminal Software of OTDR................36 8.3 Instruction of Menu Bar Window of PC Terminal Software of OTDR............37 8.3.1 Instruction of Menu“File” ........................37 8.3.2 Instruction of Menu “Editing”...
-
Page 6: Copyright Information
1 Copyright Information Copyright © 2013 belongs to us. Without agreement and written permission in advance of us, any content in the manual couldn’t be copied, saved in retrieval system or spread by any way, including electronic or mechanical photocopying, recording or any other method. Guarantee Any change of the information in the manual won’t be notified. -
Page 7: Safety Information
2 Safety Information Safety Instruction When using the product, pay attention to the following safety measures. Any behavior not adopting these safe operation methods or not complying with special cautions stated at other places of the manual will violate the safe designing, manufacturing and using standard of the products. - Page 8 Cautions Battery: the battery of our company’s optical time-domain reflectometer adopts rechargeable lithium battery. When using the instrument after a long term lying aside, charge the battery firstly. If the instrument is laid aside for more than 1 month, charge the battery in time to maintain the electricity in the battery. Do no charge the battery over 8 hours.
-
Page 9: Appearance Diagram Of Otdr Product
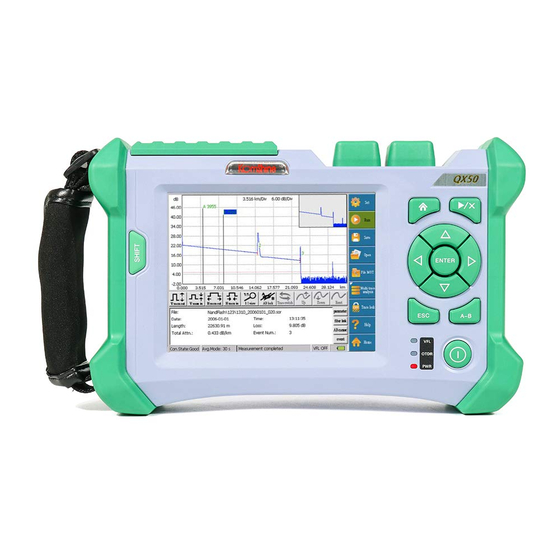
3 Appearance Diagram of OTDR Product Fig. 3-1 Appearance Diagram of OTDR... -
Page 10: Introduction To Electrical Interface Of Instrument
3.1 Introduction to Electrical Interface of Instrument ● DC12V/3A Power supply interface Requirement to power supply interface: input DC12V/3A, polarity: ● USB、SD Data Interfaces The instrument is matched with USB and SD card interfaces. SD card interface is matched with a 4G SD card. The SD card is the default data saving medium of the instrument’s trace files. To plug U disk (≤8G) into the USB interface can transfer the trace data saved in the instrument into the U disk, and then save the data into the computer from the U disk to conduct subsequent analysis;... -
Page 11: Instruction Of Buttons On The Instrument
3.3 Instruction of Buttons on the Instrument ] Home page button: ● Escape from the current page and back to the home page directly. ● The button used together with button [ ] can realize in the OTDR home page "event, parameters, fiber link, AB cursor”... - Page 12 trace graph area. ● In the menu dialog box, it serves as a Tab switching key role, that is, the function switch under each menu in the dialog box. ● On the home page of OTDR function module, the button used together with button [ can realize in the OTDR home page "event, parameters, fiber link, AB cursor”...
-
Page 13: Introduction To Home Page Of Otdr
4 Introduction to Home Page of OTDR The home page (home) of OTDR provides two module functions - OTDR (optical time-domain reflectometer) and VFL (visual fault location). Directly clicking OTDR or VFL can enter into the operation page of their functional modules. As shown in the following figure. 4-1. -
Page 14: Introduction To Operation Of Vfl
5 Introduction to Operation of VFL Click VFL functional module on the home page to enter VFL main operation interface directly. Fig. 5-1 Main Operation Interface Diagram of VFL VFL provides two kinds of using status--“bright permanently”, “twinkling”. Clicking the button “bright permanently”... -
Page 15: Introduction To Otdr
6 Introduction to OTDR 6.1 Measuring Purpose of OTDR OTDR displays the power of the returned signal related to distance. The information can be used to confirm the transmission quality of a fiber optic link. 6.1.1 Measuring Contents of OTDR ●... -
Page 16: Instruction Of Events Categories
Distance calculation formula of OTDR: Distance = (c/n) × (t/2) Among which: c= speed of light in vacuum (2.998 x 10⁸ m/s) t = Time delay between transmitted pulse and received pulse n = refractivity of optical fiber during testing process (nominated by manufacturer) When displaying the whole trace, each point on the trace graph represents the average value of several sampling points. -
Page 17: Non-Reflection Event
Fig.6-2 Reflection Event 6.3.4 Non-reflection Event Non-reflection event brings loss on the whole transmission link of optical fiber, but no light reflection. On the curve, non-reflection event is shown as drop of optical power, as shown in Fig.6-3. Fig.6-3 Non-reflection Event 6.3.5 Event Inspection OTDR sends optical pulse into the optical fiber that waited for inspection, then, begins to accept the returned optical signal immediately, and calculate the distance of “event”... -
Page 18: Introduction To Operation Of Otdr
7 Introduction to Operation of OTDR 7.1 Instruction of Home Page Screen of OTDR The trace displayed on the screen that measured by OTDR is shown in Fig.7-1. Fig.7-1. Interface Diagram Displayed on the Screen of OTDR... -
Page 19: Instruction Of Trace Graph Area On The Main Interface Of Otdr
7.1.1 Instruction of Trace graph Area on the Main Interface of OTDR The window displays the trace gained from the first measurement. Definition of trace: After the first measurement, reflection power diagram is displayed as distance function. The diagram is called trace. Trace of OTDR displays the measurement result by graphic mode on the screen. -
Page 20: Instruction Of Info Window Area Of The Main Interface Of Otdr
“Move downwards” indicates downward movement of measured trace. “Longitudinal reset” indicates longitudinal reset of measured trace. ● When measuring, except for the stop icon, functions of the other icons in the icon tool bar for trace operation are forbidden. 7.1.3 Instruction of Info Window Area of the Main Interface of OTDR Contents of info window include measurement parameter, event list, scale plate A/B, and analyzed parameter, etc. - Page 21 window. Contents of information of scale plate are shown in Fig.7-6: Fig.7-6 Info Window of Scale Plate Data displayed in the event list include: serial number, category, position, plug-in loss, attenuation coefficient, echo loss, and accumulate loss. “Serial number” indicates the information of the nth event that currently displayed on the trace graph;...
-
Page 22: Instruction Of Status Bar Area On The Main Interface Of Otdr
7.1.4 Instruction of Status Bar Area on the Main Interface of OTDR Fig.7-9 Schematic Diagram of Status Bar Information Status bar of OTDR separately provides status display of 5 categories of function: display of connection status, display of measurement model status, display of measuring progress status bar, display of VFL status, display of power status. -
Page 23: Instruction Of Menu Button "Set" Of Otdr
7.2 Instruction of Menu Button “Set” of OTDR “Set” menu shows three dialog boxes: file setting, parameter setting, and system setting. The data when starting up the instrument are the setting data of the former operation, as default. menu dialog box “Set” is shown in Fig7-10: Fig. - Page 24 fiber: 850nm, 1300nm; wave length of single mode fiber: 1310nm, 1550nm; wavelength of single mode fiber of PON network: 1490nm, 1625nm. According to the differences of models, users can simultaneously select 3 wavelengths at most to measure. This kind of measurement model is called “multi wavelength measurement model”.
-
Page 25: File Setting
7.2.2 File Setting Fig. 7-12 Interface Diagram of Menu“File Setting” File setting menu provides information of trace dialog box of “measuring location, SN of optical fiber, terminal position of optical fiber, category of optical fiber, operator, and note”. Operator can fill in the corresponding character information according to the condition of project. -
Page 26: System Setting
7.2.3 System Setting Fig.7-13 Interface Diagram of Menu“System Setting” Date: selected by user, select the date, month and year separately. The factory setting is the date manufactured. Time: selected by user, select the hour, minute and second separately. The factory setting is the current time. -
Page 27: Instruction Of Menu Button"Measurement"/"Stop"Of Otdr
7.3 Instruction of Menu Button“Measurement”/“Stop”of OTDR After entering interface of OTDR, click the button icon “measurement” . Firstly, it will inspect whether there is light in the optical fiber, then, it will inspect the connection status of instrument and the connector of optical fiber that waiting to measure. After the above two inspections finishing, it begins OTDR measurement. -
Page 28: Instruction Of Menu Button"Saving"Of Otdr
Fig.7-14 Interface Diagram of“Measurement”/“Stop”Menu 7.4 Instruction of Menu Button“Saving”of OTDR After entering interface of OTDR, click the button icon “saving”. Saving dialog box will eject, and the data information of the current trace will be saved. The saving format can be set in the “file setting”... - Page 29 unfolded subfolders function, through the "∨, ∧, enter" button on the folder options and confirming function. Fig.7-15 Interface Diagram of Menu“Saving”...
-
Page 30: Instruction Of Menu Button"Open"Of Otdr
7.5 Instruction of Menu Button“Open”of OTDR After entering interface of OTDR, click the button icon “open”. Page dialog box “open” will eject. In the key mode of operation, through the "SHIFT" button to achieve circular switching function for each window, through the "<, >" button to achieve the path choice of the folded or unfolded subfolders function, through the "∨, ∧, enter"... -
Page 31: Instruction Of Menu Button"File Management"Of Otdr
7.6 Instruction of Menu Button“File Management”of OTDR After entering interface of OTDR, click the button icon “file management” . Dialog box “File management” will eject, and the functions of “file/folder renaming”, “file/folder copying”, and “file/folder deletion” can be fulfilled. In the key mode of operation, through the "SHIFT" button to achieve circular switching function for each window, through the "<, >"... -
Page 32: Instruction Of Menu Button"Multi- Traces Analysis"Of Otdr
7.7 Instruction of Menu Button“Multi- traces Analysis”of OTDR After entering interface of OTDR, click the button icon “multi-traces analysis” to enter icon dialog box of lower menu of “multi-traces analysis” to realize difference contrast function of multi traces, i.e. 4 traces (non current measured and displayed trace) at most can be simultaneously displayed in the same trace window. -
Page 33: Instruction Of Button"Trace 1/2/3/4
Fig.7-19 Interface Diagram of Menu“Multi-traces Setting” 7.7.2 Instruction of Button“Trace 1/2/3/4” Button icons in the trace operation area are valid to all opened traces simultaneously. Current trace can be switched through the trace switching button or through clicking “trace 1” (or “trace 2”... -
Page 34: Instruction Of Menu Button "Trace Locking" Of Otdr
7.8 Instruction of Menu Button “Trace Locking” of OTDR After entering interface of OTDR, click the button icon “trace locking”, i.e. lock the current displayed trace in the trace graph area; when clicking the button “trace unlock”, the locking function is relieved. Trace locking function can lock one trace each time. -
Page 35: Instruction Of Menu Button"Help"Of Otdr
Fig.7-21 Interface Diagram of Menu “Trace Locking ON” 7.9 Instruction of Menu Button“Help”of OTDR After clicking the button “help”, the table of contents will eject. Contents looked over can be selected according the table of contents. 7.10 Instruction of Menu Button“Home Page”of OTDR Click the button “home page”... -
Page 36: Instruction Of Pc Terminal Software Of Otdr
8 Instruction of PC Terminal Software of OTDR The name of PC terminal software corresponding to OTDR is OTDR Traces Manager. The software is dedicated software for OTDR that developed by us. The trace files generated from measurement of OTDR can be opened through the software. It can provide user with convenient data management function. -
Page 37: Instruction Of Interface Of Pc Terminal Software Of Otdr
8.2 Instruction of Interface of PC Terminal Software of OTDR Main interface of PC terminal software of OTDR is composed of the following several parts: menu bar window, toolbar window, waveform window (including trace graph, multi-waveform displaying file list, measurement parameter, measurement result), event list window, the whole waveform window, as well as the status bar at the bottom of the window. -
Page 38: Instruction Of Menu Bar Window Of Pc Terminal Software Of Otdr
8.3 Instruction of Menu Bar Window of PC Terminal Software of OTDR Menu bar window of PC terminal software of OTDR Traces Manager includes 5 menu options: file, editing, view, help, and language. Fig.8-2. Interface Diagram of Menu Bar Window of PC Terminal Software of OTDR 8.3.1 Instruction of Menu“File”... - Page 39 Fig.8-4. Interface Diagram of Dialog Box“Open” 2) “Save the current curve, save all curves, save the current curve as”: When selecting “save the current modified curve” , “save all modified curve” ; and “save the current curve as another file”, the dialog box shown in Fig.8-5 will eject. Fig.8-5 Interface Diagram of Dialog Box“Saving”...
- Page 40 3) “Print option/print/print preview”: “Print option, print, and print preview”are corresponding to print mode“single trace in single page” . Setting items in “print option” include: “trace information, trace graph (including mesh, sign post, bundling threshold line, event point marks, thumbnail), parameter information, optical fiber link, and event list”.
- Page 41 4) “Batch Modifying” “Batch modifying” only allows batch modifying of information in trace file under the same file folder, as shown in Fig.8-7. Fig.8-7 Interface Diagram of Dialog Box“Batch Modifying”...
- Page 42 5) “Batch print/ multi traces print on single page/ display and print multi traces”: “Batch print/ multi traces print on single page/ display and print multi traces” only allows print mode of trace file under the same folder. (a) “Batch print” The print mode only allows print format of single trace in single page of trace file under the same folder, and the print format of the selected trace file are the same.
- Page 43 (b) “Multi traces print on single page” The print mode only allows multi traces print on single page of trace file under the same folder. When conducting “ Multi traces print on single page ” , print page setting “ 2 waveform/page, 4 waveform/page, 6 waveform/page, or 8 waveform/page”...
- Page 44 (c) “Display and print multi traces” The print mode only allows print of trace files less than 3 under the same folder. Select files according to the order 1, 2 and 3. When printing, trace files will display the corresponding figure and wave length information.
-
Page 45: Instruction Of Menu "Editing
8.3.2 Instruction of Menu “Editing” The menu“editing”is as shown in Fig.8-11. Functions can be realized in the menu “editing”include: trace information editing, event increasing, event modifying, and event deleting. Through “trace information editing” , one can realize trace information modifying of the trace file;... -
Page 46: Instruction Of Menu"View
8.3.3 Instruction of Menu“View” The menu“view”is as shown in Fig.8-12. Functions can be realized in the menu“view” include: displaying/concealing of toolbar window, displaying/concealing of status bar window, window rearranging, displaying/concealing of relevant tool buttons for trace operation (including transversal/longitudinal amplifying/reducing, whole trace displaying),... -
Page 47: Instruction Of Menu"Help
8.3.4 Instruction of Menu“Help” The menu“help”is as shown in Fig.8-13. Functions can be realized in the menu “help” include: user guidance (i.e. product instruction), edition information. Fig.8-13 Interface Diagram of Menu“Help” 8.4 Instruction of PC Terminal Software Toolbar Window of OTDR Fig.8-14 Interface Diagram of“Toolbar”Window The toolbar window is under the menu bar window. -
Page 48: Instruction Of Pc Terminal Software Traces Window Of Otdr
8.5 Instruction of PC Terminal Software Traces Window of OTDR Waveform window is divided into 4 displaying areas: trace graph, list of multi-waveform displaying file, measurement parameter, and measurement result, as shown in Fig.8-15. Fig.8-15 Interface Diagram of Traces Window 8.5.1 Displaying Area of“Trace graph”... -
Page 49: Displaying Area Of"List Of Multi-Traces Displaying File
8.5.2 Displaying Area of“List of Multi-traces Displaying File” After selecting “open” function, the opened trace file is displayed in the “list of multi- traces displaying file”. 8 trace files can be displayed at most. Through the button“multi- traces displaying”, these 8 trace files can be singly or wholly displayed in the trace graph area. In addition, these 8 trace files are displayed by different colors in the trace graph area. -
Page 50: Instruction Of Event List Window Of Pc Terminal Software Of Otdr
8.6 Instruction of Event List Window of PC Terminal Software of OTDR The data information displayed in the window “event list” conforms to that of the instrument terminal. Instructions of each column in the event list are as follows: Serial Number: indicating the sequence that the event point appears on the optical fiber link;... -
Page 51: Otdr Products Maintenance And Service
9 OTDR Products Maintenance and Service 9.1 Operation Note of OTDR Product Always clean the connector of the optical interface before using. Avoid the equipment being contaminated by dust. Please clean the shell and the front panel with slightly wet cotton cloth. Store the equipment in clean and dry places under room temperature and keep it away from sunlight. -
Page 52: Maintenance And Changing Of Battery
the other end (rotating clockwise is good for cleaning). 4) Gently rotate the cleaning rod for a circle, and keep rotating it when drawing it out. 5) Use a dry cleaning rod to do the action in step 3 and 4. Note: do not touch the soft end of the cleaning rod. -
Page 53: Service And Guarantee
9.5 Service and Guarantee 9.5.1 General Information We promises to maintain the defects of OTDR caused by material or technology within one year since the original delivery date. We meanwhile promises that the equipment complies with the applicable regulations under normal using status. Within the guarantee period, We has right to maintain or change any products with problems, this regulation also suitable for checking or adjusting the products waiting for maintenance, or re-checking or re-adjusting the products wrongly calibrated before. -
Page 54: Maintenance
9.5.4 Maintenance If you need to maintain our products, please call our service hotline: 4008-240-648, our personnel will help you determine if your equipment needs technology service, maintenance or calibration. If your product needs maintenance, please attach the failure phenomenon report and repairing address along with the product when mailing back to the manufacturer. -
Page 55: Common Failure Diagnosis Of Otdr Product
10 Common Failure Diagnosis of OTDR product Common problems Problem 1: Blank screen or cannot start up. Possible reason: Electricity is used up. Solving method: Charge the battery. Use AD-DC adapter to connect the equipment with external power supply. Problem 2: Button can’t work properly. Possible reason: The button is damaged. - Page 56 Problem 5: if the measured trace is as shown in Fig. 10-2: Fig. 10-2 Possible reasons: Solving method: ① Improper connection ① Reconnect ②Inclined connector para-position ② Change the connector ③ Misaligned dowel pin Testing setting problem Problem 6: The trace curve is too short, and the measurement time is too long. Possible reason: The set testing distance is too long.
-
Page 57: Appendix Technical Parameters Of Otdr
Appendix Technical Parameters of OTDR Technical Specifications Wavelength (nm) 850/1300 1310/1550 1310/1490/1550 1625 Dynamic range (dB) 21/23 32/30 38/36 32/30/30 20、 40、 80、 160、 Pulse width (ns) 5、10、20、40、80、160、320、640、1280、2560、5120、10240、20480 320、640、1280 Event blind zone (m) Attenuation blind zone (m) Displaying screen 5.6’ touch screen 640*480 Linearity (dB/dB) ±0.05 dB/ dB Loss threshold (dB) - Page 58 Contact Information: KomShine Technologies Limited Add: 1F Building#2 Huashen Technology Park,Yuhua district, Nanjing, JS, 210012, P.R. China Call us: +86 25 8687 1288 Fax us: +86 25 8687 1388 e-mail: sales@komshine.com Website: www.komshine.com...
Need help?
Do you have a question about the OTDR QX50 and is the answer not in the manual?
Questions and answers