Table of Contents
Advertisement
Advertisement
Table of Contents

Related Manuals for Middle Atlantic Products Premium+ RackLink RLNK-P420


Summary of Contents for Middle Atlantic Products Premium+ RackLink RLNK-P420
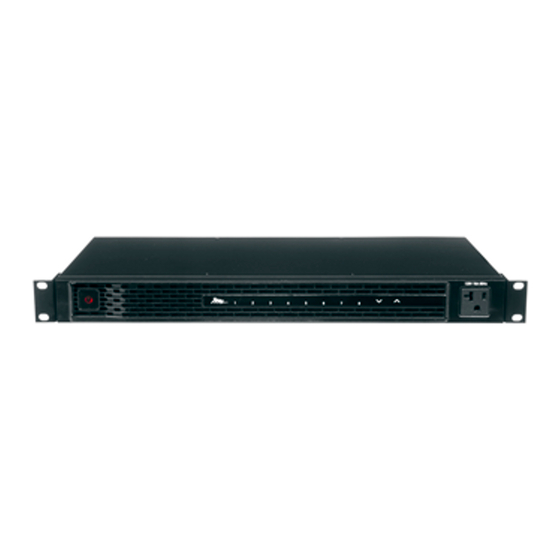
- Page 1 User Manual Premium+ PDU with RackLink™ Monitor | Control | Alert | Report | Analyze (Model RLNK-P915R Shown) THANK YOU Thank you for purchasing a Premium+ PDU with RackLink™ product. Please read these instructions thoroughly before installing or assembling this product. I-00826 Rev B...
-
Page 2: Table Of Contents
Contents Chapter 1: Introduction Before You Begin ......................... 10 Where to Find Your IP Address ....................10 Panel Components ........................11 Power Button and Inlet ...................... 11 Outlets ..........................12 Front Panel (Rackmount PDUs Only) ................13 I/O Panel ..........................15 Reset Button ........................ - Page 3 Contents Alerted Sensors ......................... 30 Inlet Power Status ......................31 Outlets ..........................32 Peripherals ........................... 56 Managing One Sensor or Dry Contact ................59 Managing Multiple Sensors/Dry Contacts ................. 60 Configuring Default Threshold Settings ................61 Turning ON or OFF Dry Contacts ..................62 Yellow- or Red-Highlighted Sensors ..................
- Page 4 Contents Monitoring Component Reachability ................159 Front Panel Settings (Rackmount PDUs Only) ............... 163 Maintenance ..........................164 Device Information ......................164 Viewing Connected Users ....................165 Viewing or Clearing the Local Event Log................. 166 Updating the PDU Firmware .................... 167 Viewing Firmware Update History ...................
- Page 5 Contents Appendix A: Specifications Dimensions ..........................199 Weight ............................199 Maximum Ambient Operating Temperature ................199 Electrical Specifications ......................199 Serial RS-232 "RJ-45" Port Pinouts ................... 200 RJ45-to-DB9 Cable Requirements for Computer Connections ..........201 Sensor RJ-45 Port Pinouts ......................201 Expansion RJ-45 Port Pinouts ....................
- Page 6 IMPORTANT SAFETY INSTRUCTIONS Read these instructions. Heed all warnings. Clean only with dry cloth. • • • Keep these instructions. Follow all instructions. Only use attachments/accessories specified by the • • • manufacturer. DANGER HAZARDOUS VOLTAGE: The lightning flash with the arrowhead symbol, within an equilateral triangle is intended to alert the user to the presence of uninsulated dangerous voltage within the product’s enclosure that may be of sufficient magnitude to constitute a risk of electric shock to persons.
- Page 7 Important Safety Instructions Safety Instructions: Rack Mount Elevated Operating Ambient: If installed in a closed or multi-unit rack assembly, the operating ambient temperature of the rack environment may be greater than room ambient. Therefore, consideration should be given to installing the equipment in an environment compatible with the maximum ambient temperature (Tma) specified by the manufacturer.
- Page 8 INSTRUCTIONS IMPORTANTES SUR LA SÉCURITÉ Lire ces instructions. Respectez tous les Nettoyer uniquement avec un chiffon sec. • • • Conservez ces avertissements. N'utilisez que des accessoires spécifiés par le fabricant. • • instructions. Suivez toutes les instructions. • DANGER TENSION DANGEREUSE: Le symbole de la pointe de flèche, dans un triangle équilatéral, est destiné à alerter l'utilisateur sur la présence de tension dangereuse non isolée dans l'enceinte du produit qui peut être d'une ampleur suffisante pour constituer un risque d'électrocution.
- Page 9 Instructions Importantes sur la Sécurité Consignes de sécurité: montage en rack Température de fonctionnement: Si installé dans un rack fermé ou à unités multiples , la température ambiante de fonctionnement de l'environnement du rack peut être supérieure à ambiante de la pièce. Par conséquent, il faudrait envisager d'installer l'équipement dans un environnement compatible avec la température ambiante maximale (Tma) spécifiée par le constructeur.
-
Page 10: Chapter 1: Introduction
Chapter 1: Introduction Thank you for purchasing Middle Atlantic Products Premium+ PDU with RackLink (referred to in this document as PDU). The complete set of instructions for your PDU is available from www.middleatlantic.com/resources/power-downloads.aspx and includes the following documents: The Quick Start Guide (I-00827 for Rackmount Units, I-00864 for Compact Units) •... -
Page 11: Panel Components
Chapter 1: Introduction Panel Components All PDU models come with the following components on the outer panels. Power Button (Rackmount PDUs Only) • Inlet • Outlets • Front Panel Display (Rackmount PDUs Only) • I/O Panel • Reset button • Power Button and Inlet Note: A power button is only provided on the Rackmount PDU. -
Page 12: Outlets
Chapter 1: Introduction Outlets A small LED adjacent to each outlet indicates the outlet or PDU state. The PDU is shipped from the factory with all outlets turned ON. Rackmount PDU Outlet LEDs Compact PDU Outlet LEDs The table below explains how to interpret different outlet LED states. LED state Outlet status What it means... -
Page 13: Front Panel (Rackmount Pdus Only)
Chapter 1: Introduction Front Panel (Rackmount PDUs Only) The following diagram shows the front panel layout. Outlet Buttons and LEDs Control Buttons Display Area You can use the front panel to view PDU information and even switch an outlet. It consists of: (8x) outlet buttons •... - Page 14 Chapter 1: Introduction Retrieving the IP Address and Other Information From the Front Panel: 1. Press both control buttons and hold for 5 seconds. 2. The front panel display shows the DEVICE MENU which includes the following measurements in this specific order: a.
-
Page 15: I/O Panel
Chapter 1: Introduction I/O Panel The I/O panel is the same on rackmount and compact PDUs and looks like the following image. Ethernet ports (1 and 2) • Reset button • (2x) USB-A port • USB-B port • Feature port •... - Page 16 Chapter 1: Introduction Port Used for... ETH 10/100/1000, The PDU has two Ethernet ports. ETH 10/100 ETH 10/100/1000 supports up to 1000 Mbps. This is "ETH1". • ETH 10/100 supports up to 100 Mbps. This is "ETH2". • You can use either Ethernet port for your network connection. Note: The yellow LED of the ETH 10/100 port has NO function so it will not be lit regardless of the communication status.
-
Page 17: Reset Button
Chapter 1: Introduction Reset Button The reset button is located inside the small hole above the the label on the PDU. Appendix B: The PDU can be reset to its factory default values using this button when a serial connection is available. See Resetting to Factory Defaults (on page 204). - Page 18 Chapter 1: Introduction Compact PDU 2. If the breaker is tripped, the button resembles the following image: 3. Examine your PDU and the connected equipment to remove or resolve the cause that results in the overload or short circuit. This step is required, or you cannot proceed with the next step. 4.
-
Page 19: Chapter 2: Connecting Your Pdu
Chapter 2: Connecting Your PDU This chapter explains how to connect your PDU. Connecting the PDU to a Power Source 1. Connect the power cable to an appropriately rated branch circuit. 2. Rackmount PDUs Only: Press the power button on the front left (facing) of your PDU. 3. -
Page 20: Making A Wireless Connection With The Usb Wifi Dongle
Chapter 2: Connecting Your PDU CAUTION: Accidentally plugging an RS-232 RJ-45 connector into the ETHERNET port can cause permanent damages to the Ethernet hardware. ATTENTION: Le branchement accidentel d'un connecteur RJ-45 RS-232 dans le port ETHERNET peut causer des dommages permanents au matériel Ethernet. Making a Wireless Connection With The USB WIFI Dongle To make a wireless connection with the USB WIFI Dongle: Do one of the following:... -
Page 21: Chapter 3: Using The Web Interface
Chapter 3: Using the Web Interface This chapter explains how to use the web interface to administer your PDU. Supported Web Browsers Internet Explorer • ® Windows Edge • Firefox 25 and later • ® Safari (Mac) • ® Google Chrome 52 and later •... -
Page 22: Login
Chapter 3: Using the Web Interface Login To log in to the web interface: 1. Open a browser and type the IP address of the PDU. pdu.local APIPA and If the link-local addressing has been enabled, you can type instead of the IP address. Refer to •... -
Page 23: Remembering User Names And Passwords
Chapter 3: Using the Web Interface Editing or Deleting Users You must have Administrator Privileges to change other users' passwords. See (on page 75). Changing Your Password For more information about passwords, see (on page 78). Password change request on first login: first login , if you have both the Change Local User Management and Change Security Settings permissions, you can choose to either change your password or ignore it. -
Page 24: Logout
Chapter 3: Using the Web Interface Logout After finishing your tasks, you should log out to prevent others from accessing the web interface. To log out without closing the web browser: Click "Logout" on the top-right corner. • -- OR -- Close the tab while there are other tabs available in the browser. - Page 25 Chapter 3: Using the Web Interface 4. To return to the main menu and the Dashboard page, click on the top-left corner. Number Web interface element Left side: • PDU name Note: To customize the device name, see PDU (on page 182). Right side: •...
-
Page 26: Menu
Chapter 3: Using the Web Interface Number Web interface element From top to bottom: Your PDU model • Current firmware version • Date and time of your user account's last login • Click Last Login to view your login history. ... -
Page 27: Quick Access To A Specific Page
Chapter 3: Using the Web Interface Quick Access to a Specific Page If you often visit a specific page in the web interface, you can note its URL or bookmark it with your web browser. Next time, you can simply enter its URL in the address bar of the browser prior to login. After login, the PDU immediately shows the desired page rather than the Dashboard page. -
Page 28: Dashboard
Chapter 3: Using the Web Interface 5. The arrow now appears adjacent to the selected column header, indicating the list is sorted in the ascending order based on that column. Dashboard The Dashboard page contains four sections. However, the Alarms and Alerted Sensors sections only appear when applicable. -
Page 29: Alarms
Chapter 3: Using the Web Interface Number Section Information shown Alarms This section can show data only after you have set event rules requiring users to • take the acknowledgment action. When there are no unacknowledged events, this section shows the message •... -
Page 30: Alerted Sensors
Chapter 3: Using the Web Interface Only users with the Acknowledge Alarms permission can manually acknowledge an alarm. To acknowledge an alarm: Click Acknowledge, and that alarm then disappears from the Alarms section. • This table explains the display fields shown with an alarm. Field Description Name... -
Page 31: Inlet Power Status
Chapter 3: Using the Web Interface To view detailed information or configure each alerted sensor, you can click each sensor's tile to go to individual sensor Individual Sensor/Dry Contact Pages pages. See (on page 66). Summary in the section title: Information in parentheses adjacent to the title is the total number of alerted sensors. -
Page 32: Outlets
Chapter 3: Using the Web Interface Gauge Overview The current sensor’s reading value is displayed on clockwise color indicators Number Description Gauge title Minimum displayable gauge value. Gauge reading with threshold color indication. For assigning threshold values and gauge color indicators, see Sensor Threshold Settings (on page 50). - Page 33 Chapter 3: Using the Web Interface Outlets Overview Number Description Selecting Multiple Outlets Select Multiple Outlets checkbox. See (on page 40). Outlet buttons perform the following functions: Power On. • Power Off. • Power Cycle. Power cycling the outlet(s) turns the outlet(s) off and then back on. •...
- Page 34 Chapter 3: Using the Web Interface Number Description Click the ellipsis to access the following additional outlet functions: Reset Active Energy: Resets active energy readings of selected outlets. • Only users with the "Admin" role assigned can reset active energy readings. Threshold Bulk Setup Threshold Bulk Setup: Configures thresholds for all outlets.
- Page 35 Chapter 3: Using the Web Interface 3. Use the checkboxes to select one or multiple outlets. To select ALL outlets, select the topmost checkbox in the header row. • 4. Click Edit Thresholds. 5. Make changes as needed. To enable any threshold, select the corresponding checkbox. •...
- Page 36 Chapter 3: Using the Web Interface Note: The next time the PDU power cycles, it will turn on all outlets based on the new outlet order. • The new order also applies when performing the power-on or power-cycling operation on partial outlets. •...
- Page 37 Chapter 3: Using the Web Interface When load shedding is activated, the PDU turns off all non-critical outlets. When load shedding is deactivated, the PDU turns back on all non-critical outlets that were ON before entering the load shedding mode. Activation of load shedding can be accomplished using the web interface, SNMP or CLI, or triggered by the contact closure sensors.
- Page 38 Chapter 3: Using the Web Interface 2. Click Activate on the confirmation message. In the load shedding mode: The lock icon appears for all non-critical outlets on the Outlets page. • On, Off, and Cycle options are disabled for non-critical outlets when load shedding mode is activated. •...
- Page 39 Chapter 3: Using the Web Interface Outlet Controls Outlets are displayed on square tiles. Each tile contains information about the outlet as follows: Number Description Outlet Number Outlet Configuration Page Click the configuration icon and the outlet configuration page appears. See page 41).
- Page 40 Chapter 3: Using the Web Interface Outlet Color States The Outlet status is marked using one of the following colors. Icon Outlet status Outlet turned on 15 Amp 20 Amp Outlet turned off 15 Amp 20 Amp Intermediate State – Shows the outlet is in the off state durng a cycle event. 15 Amp 20 Amp Selecting Multiple Outlets...
- Page 41 Chapter 3: Using the Web Interface Individual Outlet Controls To power control or reset the active energy readings of multiple outlets: You can switch any outlet regardless of its current power state. That is, you can turn on any outlet that is already turned on, or turn off any outlet that is already turned off.
- Page 42 Chapter 3: Using the Web Interface Viewing Detailed Information on Outlet Pages The individual outlet's page shows this outlet's detailed information. See page 43). In addition, you can perform the following operations on this outlet page. Power Controlling a Selected Outlet To power control a selected outlet: 1.
- Page 43 Chapter 3: Using the Web Interface 2. You can go to the associated Inlet's data page by clicking the Inlet link in the Details section. Viewing Detailed Information on Outlet Pages Each outlet's data page has a Details section for showing general outlet information and Sensors section for showing the outlet sensor status.
- Page 44 Chapter 3: Using the Web Interface The following page appears. 2. Click the Edit AutoPing button. 3. Select the checkbox labeled “Enable AutoPing monitoring for this component.” Note: The AutoPing Server Status is a display field showing one of the following component status connections: Monitored •...
- Page 45 Chapter 3: Using the Web Interface 2. View or edit the following fields in the Reachability Settings section. Note: All fields are required on this section. Field Description AutoPing Status Display field showing one of the following component status connections: Monitored •...
- Page 46 Chapter 3: Using the Web Interface Field Description Select which action to take on AutoPing state Use the drop-down to select from the following options: change Turn Outlet ON • Turn Outlet ON until Recovery • Turn Outlet OFF • Turn Outlet OFF until Recovery •...
- Page 47 Chapter 3: Using the Web Interface The sensors page appears. 2. The following values are shown: RMS current (A) • RMS voltage (V) • Active power (W) • Active energy (Wh) • Apparent power (VA) • Power Factor • Oulet Settings To view and edit outlet settings: 1.
- Page 48 Chapter 3: Using the Web Interface Field Description State on device startup Click this field to select this outlet's initial power state after the PDU powers up. last known PDU defined Options for Outlet State on Options: . See • Startup (on page 187).
- Page 49 Chapter 3: Using the Web Interface 2. The Outlet's power waveform, or Outlet History is shown. 3. The power waveform for the outlet helps you observe whether there were abnormal events within the past tens of minutes. The default is to show the outlet's active power data. 4.
- Page 50 Chapter 3: Using the Web Interface 2. Click the desired sensor (required), and then click Edit Thresholds. 3. Make changes as desired. To enable any threshold, select the corresponding checkbox. • Type a new value in the accompanying text box. •...
- Page 51 Chapter 3: Using the Web Interface In the following table, "R" represents any numeric sensor's reading. The symbol <= means “less than” or "equal to." Sensor status Color States shown in the interface Description Unknown Transparent unavailable Sensor state or readings cannot be detected. Managed vs.
- Page 52 Chapter 3: Using the Web Interface Range of each available sensor state: The value of each enabled threshold determines the reading range of each available sensor state. For details, refer to Sensor Threshold Settings (on page 50). Asserting A State If multiple sensor states are available for a specific sensor, the PDU asserts a state for it whenever a bad state change occurs.
- Page 53 Chapter 3: Using the Web Interface 2. Click the desired sensor (required), and then click Edit Thresholds. The Edit Thresholds page appears. 3. Modify the Assertion Timeout field as desired. In the threshold settings, the Assertion Timeout field postpones or even cancels the "assertion" action. It determines how long a sensor must be in the "worse"...
- Page 54 Chapter 3: Using the Web Interface Assertion Timeout Example for Temperature Sensors Assumption: Upper Warning threshold is enabled. Upper Warning = 25 (degrees Celsius) Assertion Timeout = 5 samples (that is, 5 seconds) When a temperature sensor's reading exceeds 25 degrees Celsius, moving from the "normal" range to the "above upper warning"...
- Page 55 Chapter 3: Using the Web Interface Deassertion Hysteresis: In the threshold settings, the Deassertion Hysteresis field determines a new level to trigger the "deassertion" action. This function is similar to a thermostat, which instructs the air conditioner to turn on the cooling system when the temperature exceeds a pre-determined level.
-
Page 56: Peripherals
Chapter 3: Using the Web Interface When the PDU detects that a temperature sensor's reading drops below 20 degrees Celsius, moving from the "above upper warning" range to the "normal" range, either of the following may occur: If the temperature falls between 20 and 17 degrees Celsius, the PDU does NOT perform the "deassertion" action. •... - Page 57 Chapter 3: Using the Web Interface Perform actions on multiple sensors/dry contacts by using the control/action icons on the top-right corner. • Note: On and Off buttons only appear when dry contacts are selected. Go to an individual sensor's or dry contact's data/setup page by clicking its name. •...
- Page 58 Chapter 3: Using the Web Interface Sensor/dry contact overview on this page: Yellow- or Red-Highlighted Sensors If any sensor enters the alarmed state, it is highlighted in yellow or red. See (on page 62). An dry contact is never highlighted. Column Description Name...
-
Page 59: Managing One Sensor Or Dry Contact
Chapter 3: Using the Web Interface 3. Select "managed" sensors/actuators. See Sensor/Dry Contact States (on page 63). 4. Click > Release. 5. Now released sensors/actuators become "unmanaged." Managing One Sensor or Dry Contact If you are managing only one sensor or dry contact, you can assign the desired ID number to it. Note that you cannot assign ID numbers when you are managing multiple sensors/dry contacts at a time. -
Page 60: Managing Multiple Sensors/Dry Contacts
Chapter 3: Using the Web Interface To let the PDU randomly assign an ID number to it, select "Automatically assign a sensor number." • This method does not release any managed sensor or dry contact. To assign the desired ID number to it, select "Manually select a sensor number." Then click to select an ID •... -
Page 61: Configuring Default Threshold Settings
Chapter 3: Using the Web Interface 4. Click Peripherals > > Manage. The management action triggers a "Manage peripheral device" dialog. Simply click Manage if you are managing • multiple sensors/actuators. If you are managing only sensor/actuator, you can choose to assign an ID number by selecting "Manually •... -
Page 62: Turning On Or Off Dry Contacts
Chapter 3: Using the Web Interface 6. Click Save. Tip: To customize the threshold settings on a per-sensor basis, see Individual Sensor/Dry Contact Pages (on page 66). Turning ON or OFF Dry Contacts To turn on or off dry contact(s): 1. -
Page 63: Understanding Unmanaged Sensors/Dry Contacts
Chapter 3: Using the Web Interface They have an ID number as illustrated below. • Sensor/Dry Contact States They show one of the managed states. See (on page 63). • For managed 'numeric' sensors, their readings are retrieved and displayed. If any numeric sensor is disconnected or its •... - Page 64 Chapter 3: Using the Web Interface Managed sensor states: In the following table, "R" represents any numeric sensor's reading. The symbol <= means "less than" or "equal to." State Description For numeric sensors, it means the readings are within the normal range. •...
-
Page 65: Finding The Sensor's Serial Number
Chapter 3: Using the Web Interface Note: Unmanaged sensors or dry contacts will disappear from the web interface after they are no longer physically connected to the PDU. To manage a sensor/dry contact, see Peripherals (on page 56). Finding the Sensor's Serial Number A RLNK-TEMP or RLNK-CONT sensor package has a serial number tag attached to its underside. -
Page 66: Understanding Sensor/Dry Contact Position
Chapter 3: Using the Web Interface Understanding Sensor/Dry Contact Position Sensor/dry contact position examples: Example Physical position Port 1 Connected to the sensor port #1. Port 1, Channel 2 Connected to the sensor port #1. • The sensor/dry contact is the 2nd channel of the sensor package. •... - Page 67 Chapter 3: Using the Web Interface 2. Select or deselect Use Default Thresholds according to your needs. To have this sensor follow the default threshold settings configured for its sensor type, select the Use Default • Thresholds checkbox. Peripherals The default threshold settings are configured on the page of (on page 56).
- Page 68 Chapter 3: Using the Web Interface 2. Make changes to available fields, and then click Save. Fields Description Binary Sensor This field is available for a contact closure sensor only. Subtype Determine the sensor type of your contact closure detector. Contact Closure detects the door lock or door open/closed status.
- Page 69 Chapter 3: Using the Web Interface Turning On or Off an Dry Contact From the Sensor/Dry Contact Page To turn on or off a dry conctact from the sensor/dry contact page: 1. Click the desired control button. : Turn ON. •...
-
Page 70: Sensor/Dry Contact Location Example
Chapter 3: Using the Web Interface Sensor/Dry Contact Location Example Use the X, Y and Z coordinates to describe each sensor's or dry contact's physical location in the data center. See Individual Sensor/Dry Contact Pages (on page 66). The X, Y and Z values act as additional attributes and are not tied to any specific measurement scheme. Therefore, you can use non-measurement values. -
Page 71: Creating Users
Chapter 3: Using the Web Interface Creating Users All users must have a user account, containing the login name and password. Multiple users can log in simultaneously using the same login name. To create users: 1. Select User Management > Users > The New User page appears. - Page 72 Chapter 3: Using the Web Interface Field or Setting Description Force password change on next When selected, a password change request automatically appears when next time the login user logs in. Changing Your Password on First Login For details, see (on page 22).
- Page 73 Chapter 3: Using the Web Interface 8. The Privacy Password section is configurable only when SNMPv3 is enabled and 'Authentication & Privacy' is selected as the Security Level above. Field or Setting Description Same as Authentication Password Select this checkbox if the privacy password is identical to the authentication password.
-
Page 74: Viewing Enabled Or Disabled Users
Chapter 3: Using the Web Interface 11. In the Roles section, select one or multiple roles to determine the user's permissions. Tip: To select all roles, select the top-most checkbox in the header row.. Creating Roles If the built-in roles do not satisfy your needs, add new roles by clicking . -
Page 75: Editing Or Deleting Users
Chapter 3: Using the Web Interface Editing or Deleting Users To edit or delete a user account: 1. Select User Management > Users to open the Users page, which lists all user accounts. 2. Click the desired user. The Edit User page for that user appears. 3. - Page 76 Chapter 3: Using the Web Interface Built-in role Description Admin Provide full permissions. Operator Provide frequently used permissions, including: Acknowledge Alarms • Change Own Password • Change PDU, Inlet, Outlet & Overcurrent Protector Configuration • Switch Outlets • View Event Settings •...
-
Page 77: Editing Or Deleting Roles
Chapter 3: Using the Web Interface For example, on an outlet-switching capable model, you can specify the outlets that are allowed to be switched • on/off for the 'Switch Outlet' privilege as shown below. 6. Click Save. Creating Users Editing or Deleting Users Now you can assign the role to any user. -
Page 78: Changing Your Password
Chapter 3: Using the Web Interface Deleting Roles To delete any roles: 1. Select User Management > Roles. The Roles page appears and lists all the defined roles. 2. Click to make checkboxes appear in front of roles. Tip: To delete only one role, you can simply click that user without making the checkboxes appear. See the above procedure. -
Page 79: Setting Default Measurement Units
Chapter 3: Using the Web Interface Measurement unit changes only apply to the web interface and command line interface. Setting Default Measurement Units Setting your own preferences does not change the default measurement units. See page 79). To select your preferred measurement units in User Preferences: 1. -
Page 80: Device Settings
Chapter 3: Using the Web Interface Field Description Pressure Unit Preferred units for pressure -- Pascal or Psi. • Pascal = one newton per square meter • Psi = pounds per square inch 3. Click Save. User Interfaces Showing Default Units Default measurement units will apply to the following user interfaces or information: Web interface for "newly created"... - Page 81 Chapter 3: Using the Web Interface You can enable both wired and wireless networking on the PDU so that it has multiple IP addresses -- wired and wireless IP. For example, you can obtain one IPv4 and/or IPv6 address by enabling one Ethernet interface, and obtain one more IPv4 and/or IPv6 address by enabling/configuring the wireless interface.
- Page 82 Chapter 3: Using the Web Interface Configuring Wired Network Settings To configure wired network settings: 1. Select Device Settings > Network. The Network page appears. 2. Select Wired from the Network Interface drop-down to configure IPv4/IPv6 settings. 3. Configure IPv4 or IPv6 settings as follows: IPv4 settings: Field or Setting Description...
- Page 83 Chapter 3: Using the Web Interface Example: fd07:2fa:6cff:1111::0/128 Common Network Settings DNS Settings are OPTIONAL, not required. Therefore, leave them unchanged if there are no specific local networking requirements. 1. Select Device Settings > Network. The Network page appears. 2. Click the Common Network Settings title bar as shown. 3.
- Page 84 Chapter 3: Using the Web Interface d. Select Gateway or Interface from the drop-down and provide the following additional information: If you select Gateway, enter a gateway address in the adjacent text box. If you select Interface, select from BRIDGE, ETH1, ETH2, and WIRELESS options in the adjacent drop-down ...
- Page 85 Chapter 3: Using the Web Interface 3. Configure settings as follows: Field Description Speed Select a LAN speed. Auto: System determines the optimum LAN speed through auto-negotiation. • 10 MBit/s: Speed is always 10 Mbps. • 100 MBit/s: Speed is always 100 Mbps. •...
- Page 86 Chapter 3: Using the Web Interface 5. Configure IPv6 settings as follows: a. Select the Enable IPv6 checkbox to enable the interface. This checkbox is selected by default. b. In the IP Auto Configuration drop-down select DHCP or Static and provide the following additional information: If you selected DHCP, enter a Preferred Hostname in the text box provided.
- Page 87 Chapter 3: Using the Web Interface Field or Setting Description Authentication Select an authentication method. No Authentication: No authentication data is required. • PSK: A Pre-Shared Key is required. • EAP - PEAP: Use Protected Extensible Authentication Protocol. Only MSCHAPv2 •...
- Page 88 Chapter 3: Using the Web Interface Field or Setting Description Select this checkbox to make the authentication succeed regardless of the • Allow expired and not yet valid certificate's validity period. certificates After deselecting this checkbox, the authentication fails whenever any certificate in •...
- Page 89 Chapter 3: Using the Web Interface Cannot begin or end with a hyphen − Cannot contain more than 63 characters − Cannot contain punctuation marks, spaces, and other symbols − If you selected Static, enter a valid IPv6 address with a prefix length in the text box provided. The address ...
-
Page 90: Configuring Network Services
Chapter 3: Using the Web Interface 8. If desired, you can cliear the diagnostic log by clicking > in the top-right corner. 9. Click Clear Log in the confirmation message. Configuring Network Services The PDU supports all of the network communication services contained in this portion of the interface. HTTPS and HTTP enable the access to the web interface. - Page 91 Chapter 3: Using the Web Interface By default, any access to the PDU via HTTP is automatically redirected to HTTPS. You can disable this redirection if needed. To change HTTP or HTTPS port settings: 1. Choose Device Settings > Network Services > HTTP. 2.
- Page 92 Chapter 3: Using the Web Interface sysLocation - the location of the system • 4. To configure SNMP notifications: c. Select the Enable SNMP Notifications checkbox. d. Select a notification type -- SNMPv2c Trap, SNMPv2c Inform, SNMPv3 Trap, and SNMPv3 Inform. e.
- Page 93 Chapter 3: Using the Web Interface Field Description Port Type the port number. Default is 25 • Sender Email Address Type an email address for the sender. Number of Sending Retries Type the number of email retries. Default is 2 retries •...
- Page 94 Chapter 3: Using the Web Interface 5. Click Save. Regarding AES ciphers: The PDU’s SSL/TLS-based protocols, including SMTP over StartTLS, support AES 128- and 256-bit ciphers. The exact cipher to use is negotiated between the PDU and the client (such as a web browser), which is impacted by the cipher priority of the PDU and the client's cipher availability/settings.
-
Page 95: Configuring Security Settings
Chapter 3: Using the Web Interface 4. Click Save. Changing Modbus Settings You can enable or disable the Modbus/TCP access to your PDU, set it to the read-only mode, or change the TCP port. To change the Modbus/TCP settings: 1. Choose Device Settings > Network Services > Modbus. 2. - Page 96 Chapter 3: Using the Web Interface This product supports the SHA-2 certificate. Tip: To force all HTTP accesses to the PDU to be redirected to HTTPS, see Changing HTTP(S) Settings (on page 90). Creating IP Access Control Rules IP access control rules (firewall rules) determine whether to accept or discard traffic to/from the PDU, based on the IP address of the host sending or receiving the traffic.
- Page 97 Chapter 3: Using the Web Interface Inbound rules control the data sent to the PDU. • Outbound rules control the data sent from the PDU. • 4. Determine the IPv4 default policy. Accept: Accepts traffic from all IPv4 addresses. • Drop: Discards traffic from all IPv4 addresses, without sending any failure notification to the source host.
- Page 98 Chapter 3: Using the Web Interface To configure IPv6 access control rules: 1. On the same page, select the Enable IPv6 Access Control checkbox to enable IPv6 access control rules. 2. Follow the same procedure as the above IPv4 rule setup to create IPv6 rules. 3.
- Page 99 Chapter 3: Using the Web Interface To create IPv4 role-based access control rules: 1. Choose Device Settings > Security > Role Access Control. 2. Select the "Enable Role Based Access Control for IPv4" checkbox to enable IPv4 access control rules. 3.
- Page 100 Chapter 3: Using the Web Interface 7. The rules are applied. To configure IPv6 access control rules: 1. On the same page, select the "Enable Role Based Access Control for IPv6" checkbox to enable IPv6 access control rules. 2. Follow the same procedure as the above IPv4 rule setup to create IPv6 rules. 3.
- Page 101 Chapter 3: Using the Web Interface To obtain a new CA-signed SSL certificate: Creating a New SSL Certificate Signing Request (CSR) 1. Create a Certificate Signing Request (CSR) on the PDU. See (on page 101). 2. Submit it to a certificate authority (CA). After the CA processes the information in the CSR, it provides you with a certificate.
- Page 102 Chapter 3: Using the Web Interface Field Description Common Name The fully qualified domain name (FQDN) of your PDU. Email Address An email address where you or another administrative user can be reached. Important: If you generate a CSR without values entered in the required fields, you cannot obtain third-party certificates. 4.
- Page 103 Chapter 3: Using the Web Interface 8. To store the newly created private key on your computer, click Download Key in the New SSL Certificate section. Note: The Download Key button in the Active SSL Certificate section is for downloading the private key of the currently installed certificate rather than the newly created one.
- Page 104 Chapter 3: Using the Web Interface Creating a Self-Signed Certificate When appropriate certificate and key files for the PDU are unavailable, the alternative, other than submitting a CSR to the CA, is to generate a self-signed certificate. Note: You must enter information in the fields showing the message 'required.' To create and install a self-signed certificate: 1.
- Page 105 Chapter 3: Using the Web Interface 3. Click Create New SSL Key to create both the self-signed certificate and private key. This may take several minutes to complete. 4. Once complete, do the following: a. Double check the data shown in the New SSL Certificate section. If correct, click "Install Key and Certificate"...
- Page 106 Chapter 3: Using the Web Interface Note: If you are using a certificate that is part of a chain of certificates, each part of the chain is signed during the validation process. To download active key and certificate files from the PDU: 1.
- Page 107 Chapter 3: Using the Web Interface Configuring Authentication Important: The PDU uses TLS instead of SSL 3.0 due to published security vulnerabilities in SSL 3.0. Make sure your network infrastructure, such as LDAP and mail services, uses TLS rather than SSL 3.0. For security purposes, users attempting to log in to the PDU must be authenticated.
- Page 108 Chapter 3: Using the Web Interface Tip: If intending to force the PDU to use a specific AES cipher, refer to your client's user documentation for information on configuring AES settings. Gathering LDAP/Radius Information It requires knowledge of your AAA server settings to configure the PDU for external authentication. If you are not familiar with these settings, consult your AAA server administrator for help.
- Page 109 Chapter 3: Using the Web Interface Configuring Authentication Settings To configure authentication settings: 1. Choose Device Settings > Security > Authentication. 2. In the Authentication Type drop-down, select one of the following options: Local (selecting Local disables external authentication) • LDAP •...
- Page 110 Chapter 3: Using the Web Interface Field or Setting Description Type of LDAP Server Choose one of the following options: OpenLDAP • Microsoft Active Directory. Active Directory is an implementation of LDAP/LDAPS • directory services by Microsoft for use in Windows environments. Security Determine whether you would like to use Transport Layer Security (TLS) encryption, which allows the PDU to communicate securely with the LDAPS server.
- Page 111 Chapter 3: Using the Web Interface Field or Setting Description Bind DN Required after deselecting the Anonymous Bind checkbox. Distinguished Name (DN) of the user who is permitted to search the LDAP directory in the defined search base. Bind Password, Required after deselecting the Anonymous Bind checkbox.
- Page 112 Chapter 3: Using the Web Interface Duplicating LDAP Server Settings If you have added any LDAP/LDAPS server to the PDU, and the server you will add shares identical settings with an existing one, the most convenient way is to duplicate that LDAP/LDAPS server's data and then revise the IP address/host name.
- Page 113 Chapter 3: Using the Web Interface Field or Setting Description Authentication Port, The default are standard ports -- 1812 and 1813. Accounting Port To use non-standard ports, type a new port number. Timeout This sets the maximum amount of time to establish contact with the Radius server before timing out.
- Page 114 Chapter 3: Using the Web Interface 2. Select a server from either LDAP or RADIUS lists. 3. Perform the desired action. Adding Click Edit to edit its settings, and click Modify Server to save changes. For information on each field, see •...
- Page 115 Chapter 3: Using the Web Interface 4. In the "Maximum number of failed logins" field, type a number. This is the maximum number of login failure the user is permitted before the user is blocked from accessing the PDU. 5. Click Save. Tip: If any user blocking event occurs, you can unblock that user manually by using the "unblock"...
- Page 116 Chapter 3: Using the Web Interface 4. In the Password Aging Interval field, type a value or click to select a time option. This setting determines how often users are requested to change their passwords. Time Units If you type a value, the value must be followed by a time unit, such as '10 d.' See (on page 187).
-
Page 117: Setting The Date And Time
Chapter 3: Using the Web Interface Users must accept the agreement, or they cannot log in. Default Log Messages An event notifying you if a user has accepted or declined the agreement can be generated. See page 124). To enable the service agreement: 1. - Page 118 Chapter 3: Using the Web Interface 4. Select the method for setting the date and time. Customize the date and time Select User Specified Time. • Type values in the Date field using the yyyy-mm-dd format, or click to select a date. •...
-
Page 119: Event Rules And Actions
Chapter 3: Using the Web Interface Event Rules and Actions A benefit of the product's intelligence is its ability to notify you of or react to a change in conditions. This event notification or reaction is an "event rule." An event rule consists of two parts: Event: This is the situation where the PDU or a device connected to it meets a certain condition. - Page 120 Chapter 3: Using the Web Interface Creating a Scheduled Action To create a scheduled action: 1. If the needed action is not available yet, create it by clicking . See above. Note: When creating scheduled actions, available actions are less than usual because it is meaningless to schedule certain actions like "Alarm,"...
- Page 121 Chapter 3: Using the Web Interface <Any Numeric Sensor> means all numeric sensors of the PDU, including internal and environmental sensors. • <Any Numeric Sensor> is especially useful if you want to receive the notifications when any numeric sensor's readings pass through a specific threshold. 3.
- Page 122 Chapter 3: Using the Web Interface Understanding Radio Button Selections for Different Events Radio buttons for different events: According to the event you select, the "Trigger condition" field containing three radio buttons may or may not appear. Event types Radio buttons Numeric sensor threshold-crossing Available radio buttons include "Asserted,"...
- Page 123 Chapter 3: Using the Web Interface Event types Radio buttons Enabled: The PDU takes the action only when the chosen function is enabled. Function enabled or disabled • Disabled: The PDU takes the action only when the chosen function is disabled. •...
- Page 124 Chapter 3: Using the Web Interface Default Log Messages Following are default log messages recorded internally and emailed to specified recipients when PDU events occur (are Send Email TRUE) or, in some cases, stop or become unavailable (are FALSE). See (on page 136) for information configuring email messages to be sent when specified events occur.
- Page 125 Chapter 3: Using the Web Interface Event/context Default message when the event = TRUE Default message when the event = FALSE Device > Data push failed Data push to URL [DATAPUSH_URL] failed. [ERRORDESC]. Device > Event log cleared Event log cleared by user '[USERNAME]' from host '[USERIP]'.
- Page 126 Chapter 3: Using the Web Interface Event/context Default message when the event = TRUE Default message when the event = FALSE Device > USB slave connected USB slave connected. USB slave disconnected. Device > WLAN authentication over Established connection to wireless network TLS with incorrect system clock '[SSID]' via Access Point with BSSID '[BSSID]' using '[AUTHPROTO]'...
- Page 127 Chapter 3: Using the Web Interface Event/context Default message when the event = TRUE Default message when the event = FALSE Peripheral Device Slot > * > State Peripheral device '[EXTSENSORNAME]' in Peripheral device Sensor/Dry Contact > slot [EXTSENSORSLOT] is '[EXTSENSORNAME]' in slot Alarmed/Open/On [SENSORSTATENAME].
- Page 128 Chapter 3: Using the Web Interface Event/context Default message when the event = TRUE Default message when the event = FALSE Outlet > * > Sensor > * > Sensor '[OUTLETSENSOR]' on outlet Sensor '[OUTLETSENSOR]' on outlet Unavailable '[OUTLET]' unavailable. '[OUTLET]' available.
- Page 129 Chapter 3: Using the Web Interface Event/context Default message when the event = TRUE Default message when the event = FALSE Outlet > * > Pole > * > Sensor > Sensor '[POLESENSOR]' on pole Sensor '[POLESENSOR]' on pole Below lower warning threshold '[OUTLETPOLE]' of outlet '[OUTLET]' '[OUTLETPOLE]' of outlet '[OUTLET]' asserted 'below lower warning'.
- Page 130 Chapter 3: Using the Web Interface Event/context Default message when the event = TRUE Default message when the event = FALSE User Activity > * > User blocked User '[USERNAME]' from host '[USERIP]' was blocked. User Activity > * > Session timeout Session of user '[USERNAME]' from host '[USERIP]' timed out.
- Page 131 Chapter 3: Using the Web Interface Available Actions The PDU comes with four built-in actions, which cannot be deleted. You can create additional actions for responding to different events. Built-in actions: System Event Log Action: • This action records the selected event in the internal log when the event occurs. System SNMP Notification Action: •...
- Page 132 Chapter 3: Using the Web Interface Action Function Push out sensor readings Sends internal sensor log, environmental sensor log or asset management strip Push Out Sensor data to a remote server using HTTP POST requests. See Readings (on page 135). Send Email Send email Emails a textual message.
- Page 133 Chapter 3: Using the Web Interface 2. Select Alarm from the Action list. 3. In the Alarm Notifications list box, specify one or multiple ways to issue the alert notifications. Available methods vary, depending on how many notification-based actions have been created. Notification-based action types include: Syslog message •...
- Page 134 Chapter 3: Using the Web Interface b. In the Selected field, click any method's to remove unnecessary ones, or click Deselect All. 8. Click Create. Change Load Shedding State The "Change load shedding state" action is available only when your PDU is able to control outlet power. Use this action to Load activate or deactivate the load shedding mode for responding to a specific event.
- Page 135 Chapter 3: Using the Web Interface 2. Select "Execute an action group" from the Action list. 3. To select any action(s), select them one by one from the Available Actions list. To select all available actions, click Select All. • 4.
- Page 136 Chapter 3: Using the Web Interface Before creating this action, make sure that you have properly defined the destination servers and the data to be sent on the Configuring Data Push Settings Data Push page. See (on page 158). Tip: To send the data at a regular interval, schedule this action. See Scheduling an Action (on page 147). To create a push out sensor reading action: 1.
- Page 137 Chapter 3: Using the Web Interface 2. Select "Send email" from the Action list. 3. In the "Recipient Email Addresses" field, specify the email address(es) of the recipient(s). Use a comma to separate multiple email addresses. 4. To use the SMTP server specified on the SMTP Server page, make sure the "Use custom SMTP Server" radio button is NOT selected.
- Page 138 Chapter 3: Using the Web Interface Outlet sensors, including RMS current, RMS voltage, active power, apparent power, power factor, active energy and • outlet state (for outlet-switching capable PDUs only). Overcurrent protector sensors, including RMS current and tripping state. • Peripheral device sensors, which can be any environmental sensor packages connected to the PDU, such as •...
- Page 139 Chapter 3: Using the Web Interface Available Actions a. If no messaging actions are available, create them now. See (on page 131). b. To select any methods, select them one by one in the Available field. To add all available methods, simply click Select All. c.
- Page 140 Chapter 3: Using the Web Interface 10. To remove any sensor from the Report Sensors list box, select it and click . To make multiple selections, press Ctrl+click or Shift+click to highlight multiple ones. 11. To immediately send out the sensor report, click Send Report Now. Tip: When intending to send a sensor report using custom messages, use the placeholder [SENSORREPORT] to report sensor readings.
- Page 141 Chapter 3: Using the Web Interface 4. Select the Use Custom Log Message checkbox, and then create a custom message in the provided text box. 5. When clicking anywhere inside the text box, the Event Context Information displays, showing a list of placeholders and Email and SMS Message Placeholders their definitions.
- Page 142 Chapter 3: Using the Web Interface 5. In the Host fields, enter the IP address of the device(s) you want to access. This is the address to which notifications are sent by the SNMP system agent. 6. In the Port fields, enter the port number used to access the device(s). 7.
- Page 143 Chapter 3: Using the Web Interface 5. For SNMP INFORM communications, leave the resend settings at their default or do the following: a. In the Timeout field, specify the interval of time, in seconds, after which a new inform communication is resent if the first is not received.
- Page 144 Chapter 3: Using the Web Interface 2. Select "Switch outlets" from the Action list. 3. In the Operation field, select an operation for the selected outlet(s). 4. Turn Outlet On: Turns on the selected outlet(s). 5. Turn Outlet Off: Turns off the selected outlet(s). 6.
- Page 145 Chapter 3: Using the Web Interface To create a switch peripheral dry contact action: 1. Choose Device Settings > Event Rules > 2. Select "Switch peripheral actuator" from the Action list. 3. In the Operation field, select an operation for the selected actuator(s). 4.
- Page 146 Chapter 3: Using the Web Interface 2. Select "Syslog message" from the Action list. 3. In the Syslog Server field, specify the IP address to which the syslog is forwarded. 4. In the Transport Protocol field, select one of the syslog protocols: TCP, UDP or TCP+TLS. The default is UDP. Transport Next steps protocols...
- Page 147 Chapter 3: Using the Web Interface Scheduling an Action An action can be regularly performed at a preset time interval instead of being triggered by a specific event. For example, you can make the PDU report the reading or state of a specific sensor regularly by scheduling the "Send Sensor Report" action.
- Page 148 Chapter 3: Using the Web Interface Execution time Frequency settings Daily Type values or click The time is measured in 12-hour format so you must correctly specify AM or PM by clicking the AM/PM button. For example, if you specify 01:30PM, the action is performed at 13:30 pm every day. Weekly Both the day and time must be specified for the weekly option.
- Page 149 Chapter 3: Using the Web Interface To create a send sensor report example: 1. Click to create a 'Send email' action that sends an email to the desired recipient(s). For details, see Send Email (on page 136). Email a Sensor Report 2.
- Page 150 Chapter 3: Using the Web Interface Placeholder Definition [CIRCUITNAME] The circuit name [CIRCUITPOLE] The circuit power line identifier [CIRCUITSENSOR] The circuit sensor name [CIRCUIT] The circuit identifier [CARDREADERPRODUCT] The product name of a card reader [CARDREADERSERIALNUMBER] The serial number of a card reader [COMPONENTID] The ID of a hardware component [CONFIGPARAM]...
- Page 151 Chapter 3: Using the Web Interface Placeholder Definition [LOGMESSAGE] The original log message [MONITOREDHOST] The name or IP address of a monitored host [OLDVERSION] The firmware version the device is being upgraded from [OUTLETNAME] The outlet name Note: If any outlet does not have a name, neither an outlet name nor an outlet number will be shown in the custom message for it.
- Page 152 Chapter 3: Using the Web Interface Placeholder Definition [SENSORSTATENAME] The human readable state of a sensor [SMTPRECIPIENTS] The list of recipients, an SMTP message was sent to [SMTPSERVER] The name or IP address of an SMTP server [SYSCONTACT] SysContact as configured for SNMP [SYSLOCATION] SysLocation as configured for SNMP [SYSNAME]...
- Page 153 Chapter 3: Using the Web Interface 4. To modify settings, make necessary changes and then click Save. 5. To delete it, click on the top-right corner. Then click Delete on the confirmation message. Sample Event Rules Sample PDU-Level Event Rule In this example, we want the PDU to record the firmware upgrade failure in the internal log when it happens.
- Page 154 Chapter 3: Using the Web Interface Then the SNMP notifications are sent when: 6. Any numeric sensor's reading enters the warning or critical range. 7. Any sensor reading or state returns to normal. 8. Any sensor becomes unavailable. 9. The active energy sensor is reset. 10.
- Page 155 Chapter 3: Using the Web Interface Sample Environmental-Sensor-Level Event Rule In this example, we want the PDU to activate the load shedding function when a contact closure sensor enters the alarmed state. This event rule requires creating a new action before creating the rule. Step 1: create a new action for activating the load shedding 1.
- Page 156 Chapter 3: Using the Web Interface A Note about Infinite Loop You should avoid building an infinite loop when creating event rules. The infinite loop refers to a condition where the PDU keeps busy because the action or one of the actions taken for a certain event triggers an identical or similar event which will result in an action triggering one more event.
-
Page 157: Setting Data Logging
Chapter 3: Using the Web Interface Setting Data Logging The PDU can store 120 measurements for each sensor in a memory buffer. This memory buffer is known as the data log. Sensor readings in the data log can be retrieved using SNMP. You can configure how often measurements are written into the data log using the Measurements Per Log Entry field. -
Page 158: Configuring Data Push Settings
Chapter 3: Using the Web Interface Configuring Data Push Settings You can push the sensor data to a remote server for data synchronization. The data will be sent in JSON format using HTTP POST requests. You need to set up the destination and authentication for data push on the PDU. After configuring the destination and authentication settings, do either or both of the following: To perform the data push after the occurrence of a certain event, create the data push action and assign it to an event •... -
Page 159: Monitoring Component Reachability
Chapter 3: Using the Web Interface 2. Perform either action below. 3. To modify settings, make necessary changes and then click Save. 4. To delete it, click , and then confirm it on the confirmation message. Monitoring Component Reachability You can monitor whether specific devices are alive by having the PDU continuously ping them. A device's successful response to the ping commands indicates that the device is still alive and can be remotely accessed. - Page 160 Chapter 3: Using the Web Interface Field Description Wait time after unsuccessful ping The wait time before sending the next ping if the previous ping was not responded. Valid range is 3 to 600 (seconds). Number of consecutive unsuccessful The number of consecutive pings without any response before the monitored pings for failure equipment is declared "Unreachable."...
- Page 161 Chapter 3: Using the Web Interface Editing or Deleting Ping Monitoring Settings You can edit the ping monitoring settings of any IT device or delete it if it’s no longer needed. To modify or delete any monitored IT device: 1. Choose Device Settings > Component Reachability. 2.
- Page 162 Chapter 3: Using the Web Interface Field Data entered Wait time after successful ping 7. To make the PDU declare the inaccessibility of the monitored PDU when that PDU becomes inaccessible for around 12 seconds (4 seconds * 3 pings), enter the following data. Field Data entered Wait time after unsuccessful ping...
-
Page 163: Front Panel Settings (Rackmount Pdus Only)
Chapter 3: Using the Web Interface Front Panel Settings (Rackmount PDUs Only) You can make various settings to the outlet buttons and front panel display area on the front panel of your Rackmount PDU. To configure the front panel settings: 1. -
Page 164: Maintenance
Chapter 3: Using the Web Interface Maintenance Menu Click 'Maintenance' in the (on page 26), and the following submenu appears. Device Information Using the web interface, you can retrieve hardware and software information of components or peripheral devices connected to your PDU. Tip: If the information shown on this page does not match the latest status, press F5 to reload it. -
Page 165: Viewing Connected Users
Chapter 3: Using the Web Interface The number of available sections is model dependent. Section title Information shown Information General device information, such as model name, serial number, firmware version, hardware revision, MIB download link(s) and so on. Network The network information, such as the current networking mode, IPv4 and/or IPv6 addresses. -
Page 166: Viewing Or Clearing The Local Event Log
Chapter 3: Using the Web Interface Column Description Client Type The interface through which the user is being connected to the PDU. Web GUI: Refers to the web interface. • CLI: Refers to the command line interface (CLI). • The information in parentheses following "CLI" indicates how this user is ... -
Page 167: Updating The Pdu Firmware
Chapter 3: Using the Web Interface 3. Click the Clear Log button to delete the current log data from the Event Log page and your PDU. 4. To view specific type of events only, select the desired event type in the Filter Event Class field. 5. - Page 168 Chapter 3: Using the Web Interface Note: Performing a firware upgrade on some mobile devices, such as an iPad, often require the installation and use of a file manager application. Important: Do not perform the firmware upgrade over a wireless network connection. To update the firmware: 1.
-
Page 169: Viewing Firmware Update History
Chapter 3: Using the Web Interface Bulk Configuration or Firmware Upgrade via DHCP/TFTP in the Premium+ PDU With RackLink Advanced User • Manual at www.middleatlantic.com/resources/power-downloads.aspx. Firmware Upgrade via USB in the Premium+ PDU With RackLink Advanced User Manual at • www.middleatlantic.com/resources/power-downloads.aspx. -
Page 170: Bulk Configuration
Chapter 3: Using the Web Interface Update firmware version • Update result • Sorting a List 2. If desired, you can sort the list by clicking the desired column header. See (on page 27). Bulk Configuration The Bulk Configuration feature lets you save generic settings of a configured PDU to your computer. You can use this Bulk Configuration configuration file to copy common settings to other PDUs of the same model and firmware version. - Page 171 Chapter 3: Using the Web Interface 4. Click Save. Adding a Bulk Profile To add a bulk profile: 1. Choose Maintenance > Bulk Configuration. The Bulk Profiles and Bulk Configuation page appears. 2. Click The New Bulk Profile screen appears. Sorting a List If desired, you can sort the list by clicking the desired column header.
- Page 172 Chapter 3: Using the Web Interface 1. Log in to the PDU whose settings you want to copy from. 2. Choose Maintenance > Bulk Configuration. The Bulk Profiles and Bulk Configuation page appears. 3. Use the drop-down to select whether you want your bulk configuration file encrypted or stored as clear text. 4.
- Page 173 Chapter 3: Using the Web Interface A second message appears notifying you that your PDU will reset and you’ll be take to the login page. 6. Wait until the PDU resets and the login page re-appears. Note: On startup, the PDU performs all of its functions, including event rules and logs, based on the new configuration you have copied instead of the previous configuration prior to the device reset.
-
Page 174: Backup And Restore Of Device Settings
Chapter 3: Using the Web Interface Bulk Configuration Restrictions A source device is the PDU where the bulk configuration file is downloaded/saved. A target device is the PDU that loads this bulk configuration file. Restrictions for bulk configuration: The target device must be running the same firmware version as the source device. •... - Page 175 Chapter 3: Using the Web Interface Saving Device Settings To save device settings: Creating You must have the Administrator Privileges or "Unrestricted View Privileges" to download a backup file. See Roles (on page 75). 1. Choose Maintenance > Backup/Restore. The Backup/Restore page appears. 2.
- Page 176 Chapter 3: Using the Web Interface 4. Enter the admin password, then click Restore. A device settins pop-up appears. 5. Wait until the PDU resets and the Login page re-appears, indicating that the restore is complete. Note: On startup, the PDU performs all of its functions, including event rules and logs, based on the new configuration you have copied instead of the previous configuration prior to the device reset.
-
Page 177: Network Diagnostics
Chapter 3: Using the Web Interface Network Diagnostics The PDU provides the following tools in the web interface for diagnosing potential networking issues. Ping: The tool is useful for checking whether a host is accessible through the network or Internet. •... -
Page 178: Downloading Diagnostic Information
Chapter 3: Using the Web Interface Field or Setting Description Use ICMP Packets Select this checkbox to use the Internet Control Message Protocol (ICMP) packets to perform the trace route command. 3. Click Run. 4. The Trace Route results then appear in a pop-up. Listing TCP Connections To list TCP Connections: 1. -
Page 179: Viewing Hardware Failures
Chapter 3: Using the Web Interface 3. The system prompts you to save or open the file. Click Save. 4. Email this file as instructed by Technical Support. Viewing Hardware Failures Using the web interface, you can view any hardware issues your PDU has detected, including current and past occurrences. - Page 180 Chapter 3: Using the Web Interface During and after the reboot, outlets that have been powered on prior to the reboot remain powered on, and outlets that have been powered off remain powered off. Rebooting the PDU To reboot the PDU: 1.
- Page 181 Chapter 3: Using the Web Interface Resetting All Settings to Factory Defaults You must have the Administrator Privileges to reset all settings of the PDU to factory defaults. Important: Exercise caution before resetting the PDU to its factory defaults. This erases existing information and customized settings, such as user profiles, threshold values, and other settings.
-
Page 182: Retrieving Software Package Information Via About Pdu
Chapter 3: Using the Web Interface Understanding Alternative Reset Methods Reset method alternatives: There are two more methods to reset the device to factory defaults. Use the "mechanical" reset button • Perform the CLI command • For details, see Appendix B: Resetting to Factory Defaults (on page 204). Retrieving Software Package Information via About PDU You can check the current firmware version and the information of all open source packages embedded in the PDU through the web interface. - Page 183 Chapter 3: Using the Web Interface The About PDU page appears. 2. Click Edit Settings. 3. Now you can configure the fields. 4. Click to select an option. 5. Select or deselect the checkbox. 6. Adjust the numeric values. 7. For time-related fields, if option selection using is not preferred, the value must include a time unit, such as '50 s'.
- Page 184 Chapter 3: Using the Web Interface Field Function Note After removing power from the PDU, you Outlet state on device Determines the initial power state of ALL outlets • must wait for a minimum of 10 seconds startup after the PDU powers up. before powering it up again.
- Page 185 Chapter 3: Using the Web Interface Field Function Note Rack Units: The height of the Z coordinate Peripheral Device Z Determines how to describe the vertical • is measured in standard rack units. When Coordinate Format locations (Z coordinates) of environmental this is selected, you can type a numeric sensor packages.
- Page 186 Chapter 3: Using the Web Interface A pop-up appears confirming the reset. 4. Click Reset. 5. All active energy readings on this PDU are reset to zero. Tip: You can choose to reset the active energy reading of an individual inlet or outlet. See Inlet (on page 188) or Outlet Configuration Page (on page 41).
- Page 187 Chapter 3: Using the Web Interface Options for Outlet State on Startup PDU-level outlet initialization delay on startup: See (on page 187). Options for Outlet State on Startup The following are available options for initial power states of outlets after powering up the PDU. Option Function Turns on the outlet(s).
-
Page 188: Viewing Pdu Sensor Power Information
Chapter 3: Using the Web Interface Time units: Unit Time millisecond(s) second(s) minute(s) hour(s) day(s) Viewing PDU Sensor Power Information To view PDU sensor power information: 1. Choose PDU The About PDU page appears. 2. Click the Sensors title bar to display sensor power information as follows: 3. -
Page 189: Inlet Overview
Chapter 3: Using the Web Interface Inlet Overview Generic inlet overview information shown: 1. Choose Inlet. The Inlet page appears. The left side of the Overview section of the screen lists the following data: • Active power (kW or W) ... -
Page 190: Inlet Sensors
Chapter 3: Using the Web Interface Note: The "below lower warning" and "below lower critical" states also show yellow and red colors respectively. However, it is not meaningful to enable these two thresholds for current levels. Inlet Sensors To view inlet sensor information: 1. - Page 191 Chapter 3: Using the Web Interface 4. Type a name for the inlet. For example, you can name it to identify the power source. 5. Click Save. 6. The inlet's custom name is displayed on the Inlet or Dashboard page, followed by its label in parentheses. To reset the inlet's active energy counter: Only users with the "Admin"...
-
Page 192: Inlet History
Chapter 3: Using the Web Interface Icons Sensor states For numeric sensors: above upper critical • below lower critical • For state sensors: alarmed state • Sensor/Dry Contact States For details, see (on page 63). Inlet History The Inlet history section behaves in the same manner as the outlets; however, the readings pertain to the total system Oulet History power usage. -
Page 193: Chapter 4: Using Snmp
Chapter 4: Using SNMP This SNMP section helps you set up the PDU for use with an SNMP manager. The PDU can be configured to send traps or informs to an SNMP manager, as well as receive GET and SET commands in order to retrieve status and configure some basic settings. -
Page 194: Snmpv2C Notifications
Chapter 4: Using SNMP SNMPv3 Notifications (on page 194). Note: Any changes made to the 'SNMP Notifications' section on the SNMP page will update the settings of the System SNMP Notification Action, and vice versa. See Available Actions (on page 131). SNMPv2c Notifications 1. -
Page 195: Downloading Snmp Mib
Chapter 4: Using SNMP 5. For SNMP TRAPs, the engine ID is prepopulated. 6. Type values in the following fields. Field Description Host The IP address of the device(s) you want to access. This is the address to which notifications are sent by the SNMP agent. Port The port number used to access the device(s). -
Page 196: Snmp Gets And Sets
Chapter 4: Using SNMP MIB downloaded from the current firmware of your PDU. You can download the MIBs from two different pages of the web interface. MIB download via the SNMP page: 1. Choose Device Settings > Network Services > SNMP. 2. - Page 197 Chapter 4: Using SNMP Layout Opening the MIB reveals the custom objects that describe the system at the unit level as well as at the individual outlet level. As standard, these objects are first presented at the beginning of the file, listed under their parent group. The objects then appear again individually, defined and described in detail.
-
Page 198: Retrieving Energy Usage
Chapter 4: Using SNMP Configuring NTP Server Settings Using SNMP, you can change the following NTP server-related settings in the unitConfigurationTable: Enable or disable synchronization of the device's date and time with NTP servers (synchronizeWithNTPServer) • Enable or disable the use of DHCP-assigned NTP servers if synchronization with NTP servers is enabled •... -
Page 199: Appendix A: Specifications
Appendix A: Specifications Dimensions Model Length, Width, Height Rackmount 20.75” x 15.25” x 3.50” (527mm x 387mm x 89mm) (RLNK-P915R, RLNK-P915R-SP, RLNK-P920R, RLNK-P920R-SP) Compact 14” x 9.75” x 4.75” (356mm x 248mm x 121mm) (RLNK-P415, RLNK-P420) Weight Model Weight Rackmount 13.2 lbs. -
Page 200: Serial Rs-232 "Rj-45" Port Pinouts
Appendix A: Specifications Specification Measurement Current Continuous 12 – 16 A Idle Power Consumption <10 W *VPR for Series Surge Protection 330V L-N *VPR for MOV 600V L-N MOV P Current 36,000 A MOV Joule Rating 634 Joules Filter Specifications for Roll Off Series Surge Protection Cutoff Frequency: 19kHz, -40dB/Decade (-28dB@100kHz) Filter Specifications for Roll Off MOV Cutoff Frequency: 50kHz, -20dB/decade (-28dB@1MHz) -
Page 201: Rj45-To-Db9 Cable Requirements For Computer Connections
Appendix A: Specifications RJ45-to-DB9 Cable Requirements for Computer Connections An RJ45-to-DB9 adapter/cable is required for connecting the PDU to a computer, if the use of a USB cable is not intended. A third party RJ45-to-DB9 adapter/cable needs to meet the following requirements. RJ-45 to "DB9 female"... -
Page 202: Expansion Rj-45 Port Pinouts
Appendix A: Specifications RJ-45 Pin/signal definition RS485_DN bi-directional Data Negative of the RS-485 bus ― Signal Ground 1-wire ― Used for Feature Port ― Signal Ground Note: A maximum of 500mA power is permitted for both pin 1 and pin 2 altogether. Expansion RJ-45 Port Pinouts RJ-45 Pin/signal definition Pin No. - Page 203 Receive Data (Data in) +12V ― WARNING: Pin 6 is only intended for use with Middle Atlantic Products devices. Do not connect. AVERTISSEMENT: La broche 6 est uniquement destinée à être utilisée avec les appareils Middle Atlantic Products. Ne branchez pas.
-
Page 204: Appendix B: Resetting To Factory Defaults
Appendix B: Resetting to Factory Defaults You can use either the reset button or the command line interface (CLI) to reset the PDU. For information about the CLI, refer to the Premium+ PDU With RackLink Advanced User Manual at www.middleatlantic.com/resources/power-downloads.aspx. Important: Exercise caution before resetting the PDU to its factory defaults. -
Page 205: Using The Cli Command
Appendix B: Resetting to Factory Defaults The reset button location: Note: HyperTerminal is available on Windows operating systems prior to Windows Vista. For Windows Vista or later versions, you may use PuTTY, which is a free program you can download from the Internet. See PuTTY's documentation for details on configuration. - Page 206 Appendix B: Resetting to Factory Defaults 6. Wait until the Username prompt appears, indicating the reset is complete. To reset to factory defaults without logging in to the CLI: The PDU provides an easier way to reset the product to factory defaults in the CLI prior to login. 1.
-
Page 207: Interface
Appendix C: Installing the Device Discovery Software and Accessing a Connected PDU’s Web Interface Installing the RackLink Device Discovery Software on a PC: To install RackLink Device Discovery software on a PC: 1. Access www.middleatlantic.com/downloads. 2. Download and run the RackLink Device Discovery setup.exe file. The Device Discovery Setup dialog box appears. - Page 208 Appendix C: Installing the Device Discovery Software and Accessing a Connected PDU’s Web Interface Additional installation options appear. 4. Click Browse if you wish to change the software installation folder. 5. If desired, select whether you want to install RackLink Discovery for everyone, or just the current user. 6.
-
Page 209: Installing The Racklink Device Discovery Software On A Mac
Appendix C: Installing the Device Discovery Software and Accessing a Connected PDU’s Web Interface The installer indicates that RackLink Discovery has been successfully installed and provides a default check box selection to Launch RackLink Discovery after closing the installer. 8. Click Close. Installing the RackLink Device Discovery Software on a MAC: To install RackLink Device Discovery software on a MAC: 1. - Page 210 Appendix C: Installing the Device Discovery Software and Accessing a Connected PDU’s Web Interface The Device Discovery Setup dialog box appears. 3. Click the disk and modify the location if you wish to change the software installation folder. 4. Click Continue.
- Page 211 Appendix C: Installing the Device Discovery Software and Accessing a Connected PDU’s Web Interface The Installation Type screen appears. 5. Click Change Install Location if you wish to change the software installation folder. 6. Click Install. The installer indicates that the installation was completed successfully. 7.
-
Page 212: Using Device Discovery
Appendix C: Installing the Device Discovery Software and Accessing a Connected PDU’s Web Interface 8. Click Applications in the Finder to locate the RackLink Discovery application. Using Device Discovery To use device discovery: 1. After launching your RackLink Device Discovery program, the tool automatically discovers all RackLink devices on the subnet to which you are connected. - Page 213 Appendix C: Installing the Device Discovery Software and Accessing a Connected PDU’s Web Interface 4. The system prompts you for a username and password. Note: To log in with the administrator account, the default credentials are Username: , Password: . To log in admin admin with the user account, the default credentials are Username:...
- Page 214 Factory Distribution United States: New Jersey, California, Illinois - Canada: Ontario - The Netherlands: Weert At Middle Atlantic Products we are always listening. Your comments are welcome. Middle Atlantic Products is an ISO 9001 and ISO 14001 Registered Company.
Need help?
Do you have a question about the Premium+ RackLink RLNK-P420 and is the answer not in the manual?
Questions and answers