netAlly ETHERSCOPE nXG User Manual
Hide thumbs
Also See for ETHERSCOPE nXG:
- User manual (820 pages) ,
- Quick start manual (2 pages) ,
- Quick start manual (2 pages)
Table of Contents
Advertisement
E
THER
Tap a
link
to go directly to the app's chapter.
Search
Scroll down to view the full list of Contents.
NetAlly Network Testing Apps
AutoTest
Capture
Wi-Fi
Performance
Link-Live
Software v1.0 Published August 22, 2019
S
User Guide
this PDF for a specific term or phrase.
COPE
Ping/TCP
Discovery
Path Analysis
iPerf
Cable
®
nXG
Advertisement
Table of Contents

Subscribe to Our Youtube Channel
Related Manuals for netAlly ETHERSCOPE nXG


Summary of Contents for netAlly ETHERSCOPE nXG
- Page 1 User Guide Tap a link to go directly to the app's chapter. Search this PDF for a specific term or phrase. Scroll down to view the full list of Contents. NetAlly Network Testing Apps AutoTest Ping/TCP Capture Discovery Wi-Fi Path Analysis...
-
Page 2: Table Of Contents
Contents Contact Us Introduction How to Use this Guide The PDF Reader App Buttons and Ports Charging and Power PoE Charging Safety and Maintenance Legal Notification Home and Android Interface Home Screen Navigating the Android System Android Status Bar and Notifications Notification Panel Apps Screen and Store Device Settings... - Page 3 Sharing a Text String Comment to Link-Live Saving a Screenshot EtherScope nXG Settings and Tools Navigation Drawer About Screen Exporting Logs EtherScope nXG General Settings Wi-Fi Management Test and Management Ports Configuring the Ports Connection and Scanning Notifications Test Port Notifications...
- Page 4 Using a USB Type-C to USB Cable Updating Software Remote Access Resetting App Defaults Saving a Default App Settings Configuration Restoring Factory Defaults EtherScope nXG Testing Applications AutoTest App and Profiles AutoTest Overview Managing Profiles and Profile Groups Factory Default Profiles Adding New Profiles...
- Page 5 Using the Main AutoTest Screen Wired AutoTest Profiles Wired Profile Results PoE Test Results Wired Link Test Results Switch Test Results Wired Profile FAB Wired Profile Settings PoE Test Settings Wired Connection Settings HTTP Proxy Wi-Fi AutoTest Profiles Wi-Fi Profile Test Results Wi-Fi Link Test Results Connect Log Channel Test Results...
- Page 6 HTTP Proxy DHCP, DNS, and Gateway Tests for Wired and Wi-Fi AutoTests DHCP or Static IP Test DNS Test Gateway Test Test Targets for Wired and Wi-Fi AutoTests Adding and Managing Test Targets Target Test Results Screens AutoTest Ping Test AutoTest TCP Connect Test HTTP Test FTP Test...
- Page 7 Manually Running Ping/TCP Tests Capture App Capture Settings Running and Viewing Captures Discovery App Introduction to Discovery Using the Main Discovery List Screen Filtering the Discovery List Sorting the Discovery List Refreshing Discovery Uploading Discovery Results to Link- Live Discovery Details Screens Top Details Card Lower Cards in Device Details Problems...
- Page 8 SSIDs Using the Discovery FAB Device Types Routers Switches Unknown Switches Network Servers Hypervisors Virtual Machines Wi-Fi Controllers Access Points (APs) Wi-Fi Clients VoIP Phones Printers SNMP Agents NetAlly Tools Hosts/Clients Discovery Settings SNMP Configuration Active Discovery Ports Extended Ranges...
- Page 9 Devices Discovered Through Other Devices Device Health Interval Problem Settings Wi-Fi Analysis App Wi-Fi Analysis and Discovery Using the Wi-Fi App Screens Wi-Fi App List Screens Filtering in the Wi-Fi App Sorting in the Wi-Fi App Uploading Wi-Fi Results to Link-Live Wi-Fi Details Screens Wi-Fi Problems Screen RF and Traffic Statistics Overview...
- Page 10 AP Details BSSIDs BSSID Details Clients Client Details Interferers Interferer Details Path Analysis App Introduction to Path Analysis Path Analysis Settings Populating Path Analysis from Another App Configuring Path Analysis Manually Running Path Analysis Path Analysis Results and Source EtherScope Cards Layer 3 Hops Layer 2 Devices Uploading Path Analysis Results to...
- Page 11 Performance Test Settings Saving Custom Performance Tests Configuring the Source EtherScope Configuring Performance Endpoints OneTouch 10G Performance Peer LinkRunner G2 Reflector LinkRunner AT Reflector NPT Reflector Software Running a Performance Test Performance Test Results Performance Service Detailed Results Uploading Performance Results to Link-Live Running EtherScope as a Performance Peer...
- Page 12 Running an iPerf Test Uploading iPerf Results to Link-Live Link-Live Cloud Service Getting Started in Link-Live Cloud Service Uploading Test Results Unclaiming Using the Link-Live App Job Comment Link-Live and Testing Apps Cable Test App Cable Test Settings Running Cable Test Open Cable TDR Testing Terminated WireView Testing Using the Tone Function...
-
Page 13: Contact Us
Colorado Springs, CO 80920 For additional product resources, visit NetAlly.com/Products/EtherScope. For customer support, visit NetAlly.com/Support. Register your EtherScope nXG Registering your product with NetAlly gives you access to valuable information on product updates, troubleshooting procedures, and other services. To register, go to NetAlly.com/Registration. -
Page 14: Introduction
Back to Title and Contents EtherScope nXG User Guide Introduction The EtherScope nXG Portable Network Export is a rugged, hand-held tool for testing and analyzing copper, fiber, and Wi-Fi networks. It features applications developed by NetAlly for network discovery, measurement, and... -
Page 15: How To Use This Guide
The guide is meant for users who are know- ledgeable about network operations, tests, and measurements. The EtherScope nXG may also be referred to as just "EtherScope" or the "unit" in this guide. The PDF Reader App A PDF reader application is pre-installed on... - Page 16 Introduction Once you enter a term and search, the term appears at the top of the PDF reader screen. Touch the left and right arrows to search forwards and backwards in the guide for the term. In the image below, the user has searched "problems."...
- Page 17 Introduction Touch and hold the page number tab to open a dialog that allows you to return to the previous page you were viewing. NOTE: You cannot touch the back buttons, , to go back to your previous place in a PDF. To browse the PDF Contents or Bookmarks, touch the action overflow icon in the upper tool bar.
- Page 18 Introduction Select Contents to view the list of chapters and choose a section to read.
- Page 19 Tap the screen twice to zoom in or out. To download this guide onto your PC, you can transfer the PDF file using one of the methods described in the Managing Files section, or go to NetAlly.com/products/EtherScope. Back to Title and Contents...
-
Page 20: Buttons And Ports
Introduction Buttons and Ports Button and port functions on your EtherScope unit are described below. External 1G/10G Fiber Port Antenna Port USB Type-A RJ-45 Ethernet Port Port with Link and Activity LEDs RJ-45 Cable Test and Management Camera Volume Port Buttons Flash Touchscreen... - Page 21 Introduction EATURE ESCRIPTION Connects to an SFP adapter Fiber Port and fiber cable for network testing. NOTE: 100FX SFPs are 1G/10GBASE-X not supported. RJ-45 LAN Port Connects to a copper Ethernet cable for network testing 10M/100M/1G/ 2.5G/5G/10G- Charges the unit if PoE Class 4 BASE-T or higher is available Green LED lit: Linked...
- Page 22 Introduction EATURE ESCRIPTION Used for removable storage Micro SD Card expansion (See Inserting a Slot Micro SD Card below.) Increase or decrease the Volume Buttons audio volume Speaker Produces audio Test and Management Ports for detailed explanations of the port functions. Refer to the product Specifications if needed.
- Page 23 Introduction The card should slide in easily when properly oriented. You may need a paperclip or thumbnail to carefully push the SD card in far enough to engage the spring mechanism for insertion and removal. Using a Kensington Lock The Kensington Lock slot is the right, front vent hole on the bottom of the unit, as shown below.
-
Page 24: Charging And Power
Introduction Charging and Power Your EtherScope nXG includes a USB-C 15V/3A power adapter. CAUTION: Only the NetAlly-supplied power adapter is supported. To begin charging the internal Lithium Ion battery, plug the included power adapter into the USB-C charging port on the left side of the unit and an AC outlet. - Page 25 Buttons and Ports for port locations and descriptions. Powering On Hold the power button on the front of the unit for approximately one second to start it up. The Power LED turns green when the EtherScope nXG is powered on.
- Page 26 Introduction When the display goes into Sleep mode, the power LED remains on. Touch the power button briefly to wake up the display. Set the timing for display sleep and auto power off in the Device Settings. To shut down, hold the power button for one second until the “Power off”...
-
Page 27: Safety And Maintenance
Introduction Safety and Maintenance Observe the following safety information: Use only the Adapter provided or Power over Ethernet to charge the battery. Ensure that the Adapter is easily accessible. Use the proper terminals and cables for all connections. CAUTION: To avoid possible electric shock or personal injury, follow these guidelines: Do not use the product if it is damaged. - Page 28 Introduction If this product is used in a manner not specified by the manufacturer, the pro- tection provided by the product may be impaired. Safety Symbols Warning or Caution: Risk of damage to or destruction of equipment or software. Warning: Risk of electrical shock. Not for connection to a public telephone system.
- Page 29 Introduction toothpaste to water onto the affected surface with a stiff-bristled brush. CAUTION: Do not use solvents or abrasive materials that may damage the product.
-
Page 30: Legal Notification
NetAlly will make available open- source code components of this product, if any, at Link-Live.com/OpenSource. NetAlly reserves the right, at its sole discretion, to make changes at any time in its technical information, specifications, service, and support programs. -
Page 31: Home And Android Interface
This chapter explains how to use the features of the Android Home screen and user interface to navigate and organize your device. The EtherScope nXG interface supports many of the operations typical of any Android swiping device. Use dragging and... -
Page 32: Home Screen
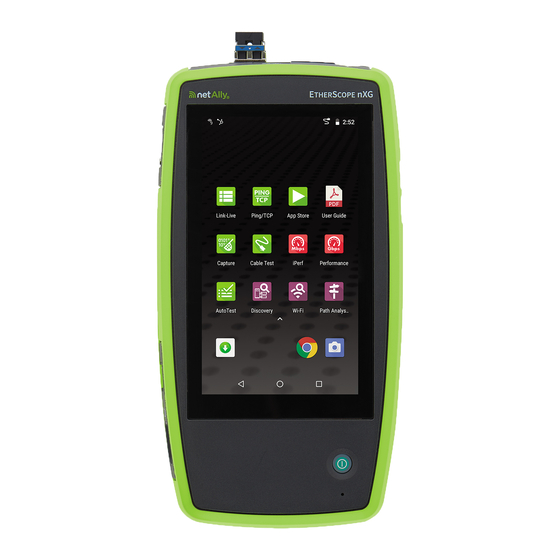
Home and Android Interface Home Screen... - Page 33 Home and Android Interface Like other Android devices, your EtherScope nXG Home screen is customizable. The image above shows the default configuration, but you can add, remove, and reorganize app icons and widgets to serve your purposes. You can also create more Home pages by touching, holding, and dragging an app icon to the right from the main Home screen.
-
Page 34: Navigating The Android System
Navigating the Android System The navigation actions you can perform to move through screens and panels in EtherScope nXG are the same as those you would use to navigate an Android phone or tablet. The main device navigation buttons appear at the bottom of the touch screen. - Page 35 Home and Android Interface Swiping Touch and drag your finger or "swipe" up, down, left, and right to move through pages of Home screen and applications, scroll up or down, and pull out navigation drawers and panels. Long Pressing Touch and hold or "long press" files or application icons to reveal additional operations.
- Page 36 Home and Android Interface TIP: You can use this feature to attach a text string, as a comment, to test results uploaded to Link-Live. Back to Title and Contents...
-
Page 37: Android Status Bar And Notifications
Android Status Bar and Notifications The Status Bar across the top of the screen displays notification icons from the Android system as well as EtherScope nXG specific icons related to your network connections and test statuses. Connection and Scanning Notifications... - Page 38 Home and Android Interface Swipe (touch and drag) downwards on the Status Bar at very top of the screen to slide down the Notification Panel.
- Page 39 Home and Android Interface Touch the title and down arrow on a notification (or swipe down on it) to expand the box and view more details or options. Touch the middle of a notification to open the related app, image, or device settings or to perform other related actions.
-
Page 40: Apps Screen And Store
Home and Android Interface Apps Screen and Store To access the apps that are not shown on the Home screen, swipe up on the Home screen or touch the up arrow icon... - Page 41 App Store From the Home Screen or APPS Screen, open the NetAlly App Store to download third- party Android applications to use on your EtherScope nXG. NOTE: Your unit must be "claimed" to Link- Live Cloud Service Link-Live.com access the App Store.
- Page 42 Home and Android Interface Touch the search icon to search for an App. To request that an App be added to the App Store, visit the Apps page at Link-Live.com, and select the Floating Action Button (FAB) at the lower right corner to Request an App.
-
Page 43: Device Settings
Home and Android Interface Device Settings To access the Android system device settings, touch the Settings icon at the bottom of Home screen. -
Page 44: Quick Settings Panel
Home and Android Interface Use the device Settings screen to adjust the display, sound, and date/time; view installed applications and memory devices; connect to Wi-Fi; or reset to factory defaults. Quick Settings Panel You can also access some of the most common device settings, like Wi-Fi, from the Quick Settings Panel by swiping down from the Status Bar... - Page 45 Home and Android Interface Touch and drag the slider control at the top of the panel to adjust the screen's bright- ness. Tap an icon in the panel to enable or disable the corresponding feature. For example, you can turn the unit's Wi-Fi or screen Auto-rotate options on or off from the quick settings.
- Page 46 Home and Android Interface Touch and hold an icon to open the relevant device setting screen if there is one. For example, touch and hold the Wi-Fi icon to open Android's Wi-Fi settings or the Auto-Rotate icon to open Display settings.
- Page 47 Home and Android Interface Similarly, you can adjust the setting that controls when the display goes into Sleep mode from the Display settings screen. Back to Title and Contents...
-
Page 48: Connecting To Wi-Fi
Home and Android Interface Connecting to Wi-Fi To access the internet via Wi-Fi, set up the Android device Wi-Fi connection. The Wi-Fi Management Port connects via the main Android Wi-Fi function. NOTE: While Wi-Fi AutoTest profiles connect to Wi-Fi networks for testing, those Wi-Fi Test Port connections do not perform the functions of the main device Wi-Fi access. - Page 49 Home and Android Interface and touching and holding (long pressing) the Wi-Fi icon. Either path opens the Wi-Fi settings screen. 1. Ensure the Wi-Fi feature is On.
- Page 50 Home and Android Interface 2. Touch a discovered Wi-Fi network from the list. 3. Enter the network's credentials. Most networks only require a password, but depending on the security settings, some may also require a company username, EAP type, Authentication type, certificate, or other credentials.
- Page 51 Home and Android Interface Status Bar displays the Wi-Fi status icon at the top right of the screen. Back to Title and Contents...
-
Page 52: Sharing
Home and Android Interface Sharing EtherScope nXG allows you to “share” images and files like you would on a smart phone. When you see the Share icon , touch it to view your configured sharing options. For example, the image below shows an... -
Page 53: Sharing Files To Link-Live
Home and Android Interface Sharing Files to Link-Live From the “Share with” dialog box (and other screens on the EtherScope), touch the Link-Live option to share a file to Link-Live Cloud Service. Depending on the file type, files can be uploaded along with your last test result, analysis data, or individually to the Uploaded Files page in Link-Live. - Page 54 Home and Android Interface See the Link-Live chapter for more information on using Link-Live with your EtherScope nXG.
-
Page 55: Sharing A Text String Comment To Link-Live
Home and Android Interface Sharing a Text String Comment to Link-Live Attaching a text comment to test results sent to Link-Live will help you organize and search through your test data later. 1. Long press a text string to select it. 2. - Page 56 Home and Android Interface 3. Touch SHARE. 4. Select the Link-Live icon to open the Link- Live sharing screen.
- Page 57 Home and Android Interface 5. Format your comments as needed, and then touch SAVE TO LAST TEST RESULT. TIP: Add a forward slash (/) to the front of the Comment to automatically create a Folder in...
-
Page 58: Saving A Screenshot
Link-Live and store the test result in the new folder. Saving a Screenshot On the EtherScope nXG, press and hold the Power button and the Volume Down button at the same time for one second to save a screenshot of the current screen. (See... -
Page 59: Etherscope Nxg Settings And Tools
Back to Title and Contents EtherScope nXG User Guide EtherScope nXG Settings and Tools The EtherScope nXG features a common set of tools and General Settings that apply to multiple Apps and testing behavior throughout the unit. This chapter covers settings, icons, and notifications specific to EtherScope nXG. -
Page 60: Navigation Drawer
General Settings and Tools Navigation Drawer Each test app contains additional settings, tools, and information in a "navigation drawer" that slides out from the left side of the screen. To open the navigation drawer: Touch the menu icon at the top left of the testing application screens. - Page 61 General Settings and Tools As an example, the AutoTest navigation drawer (above) provides access to the AutoTest profiles, AutoTest Settings, General Settings, and the About screen. Settings for each specific app are described in the chapter for the app.
-
Page 62: About Screen
About Screen The About screen displays the serial number, MAC addresses, software versions, and SFP details for your EtherScope nXG. This screen also contains the Export Logs functions, which allows you to save your unit's logs for analysis by NetAlly's technical support team. -
Page 63: Exporting Logs
General Settings and Tools Exporting Logs Touch the EXPORT LOGS link on the About screen to download a .tgz file to the Downloads folder on your unit. Open the Files app to transfer the file using email or another method. (See Managing Files.) -
Page 64: Etherscope Nxg General Settings
General Settings and Tools EtherScope nXG General Settings The General Settings listed below control test and management-related connections that affect multiple test apps, including AutoTest, Discovery, and Wi-Fi. Access the General Settings from the left-side navigation drawer in the apps listed above. -
Page 65: Wi-Fi
General Settings and Tools Wi-Fi Use Wi-Fi test ports: Enable or disable Wi-Fi tests, connections, and measurements in the testing apps, including AutoTest Wi-Fi Profiles and the Wi-Fi analysis app. NOTE: This setting does not disable the main Android device Wi-Fi function, which controls the Wi-Fi Management port con- nection. -
Page 66: Poe
General Settings and Tools Test PoE before Link: By default, an AutoTest Wired Profile performs the Link test before the PoE test is able to complete. Enable this setting to tell EtherScope to complete the PoE test before the Link test. Enabling this setting forces POE negotiation to be completed before estab- lishing link, improving compatibility with some switches. -
Page 67: Management
General Settings and Tools Charge Battery via PoE: This setting is enabled by default. If you do not want your EtherScope unit to charge when connected to a switch with PoE, touch the toggle button to disable. An AutoTest Wired Profile must run to detect PoE availability before the unit can use it for charging. - Page 68 General Settings and Tools Allow VNC Connections: Touch the toggle button to enable or disable the remote connections from VNC clients. Port number: Touch to enter a port number other than the default. Password: Touch to enter a password, which the VNC user must enter to access the EtherScope interface remotely.
- Page 69 General Settings and Tools Web viewer: Touch the toggle to enable to disable web viewer access. Web viewer port: Touch to enter a port number other than the default. Ethernet DHCP: This settings controls IP address assignment of the RJ-45 Wired Management Port on the left side of the EtherScope.
-
Page 70: Test And Management Ports
General Settings and Tools Test and Management Ports The EtherScope nXG has two wired RJ-45 copper ports, a fiber port, and two Wi-Fi radios, each with specific test or management functions described in this section. Configuring the Ports General Settings... - Page 71 General Settings and Tools Refer to Buttons and Ports and the technical Specifications if needed. Test Ports EtherScope runs Wired and Wi-Fi AutoTests, connection tests, Discovery, and com- prehensive network analyses over the test ports. You must run an AutoTest Wired or Wi-Fi Profile in order to establish a link on the Wired or Wi- Fi test ports.
- Page 72 General Settings and Tools copper link in the top Wired Test Port. Both Wired Fiber connections and Wi-Fi Profiles must be started manually in the AutoTest app. If both the top fiber and copper ports are connected to an active network, the EtherScope uses the fiber link as the Wired Test Port connection.
- Page 73 General Settings and Tools captures, link speed, or other advanced connection tests. The Management Ports provide a more stable network connection than the Test Ports, as the Test Ports may frequently drop link and reconnect or resume scanning. Wired Management Port: The wired management port is the RJ-45 port on the left side of the unit.
-
Page 74: Connection And Scanning Notifications
General Settings and Tools Connection and Scanning Notifications EtherScope nXG shows notifications from the NetAlly testing apps and ports in the top Status Bar and drop-down Notification Panel. Swipe down on the Status Bar to view the noti- fications. On each notification, you can touch the title and down arrow to expand the box and view more details or options. - Page 75 General Settings and Tools NOTE: If both the fiber and top copper ports are connected to an active network, the EtherScope uses the fiber link as the "Wired Port" for testing. The Wi-Fi Test Port status displays with the wireless channel number under a Wi-Fi or Link icon.
-
Page 76: Management Port Notifications
General Settings and Tools When the EtherScope unit is connected to an AP on a Wi-Fi channel, the channel number is static and the Link icon displays above it. Management Port Notifications A Management Port connection is established through the left-side RJ-45 Management port and/or the main Android Wi-... -
Page 77: Poe And Vnc
General Settings and Tools A Wired Management Port connection is established through the left-side RJ-45 Management port. Its details are displayed under the Management Port notification. A Wi-Fi Management Port connection is established via the main Android Wi-Fi adapter. Its details are displayed under the Management Port notification. -
Page 78: Etherscope Nxg Icons
General Settings and Tools EtherScope nXG Icons The icons below appear in multiple NetAlly test and Android apps. Menu Icon - opens the left navigation drawer or other menus Refresh Icon - restarts testing and measuring on the current screen... -
Page 79: Floating Action Button (Fab) And Menu
General Settings and Tools Floating Action Button (FAB) and Menu Many Android applications, including NetAlly's AutoTest and Discovery apps, feature a Floating Action Button or "FAB" that opens a Floating Action Menu with more options for analysis. The FAB on the main AutoTest app screen allows you to add new testing Profiles. - Page 80 General Settings and Tools Floating action menus that appear in the testing applications are described more spe- cifically in the relevant chapters. For example, Using the Discovery FAB in the Discovery app chapter for a more detailed illustration.
-
Page 81: Common Tools
General Settings and Tools Common Tools Web Browser/Chrome Some of the testing apps, like Ping/TCP and Discovery, give you the option to Browse to internet addresses using your preferred web browser application. EtherScope has Google Chrome pre-installed. Camera and Flashlight The camera lens and flash are located on the back of the unit. - Page 82 General Settings and Tools The Flashlight feature can be accessed from the Quick Settings Panel by swiping down twice from the top of the screen.
-
Page 83: Software Management
Back to Title and Contents EtherScope nXG User Guide Software Management This chapter explains how to save and transfer files, reset app and device defaults, update your software, and remotely access your EtherScope nXG. Tap a link below to skip to your desired... -
Page 84: Managing Files
Software Management Managing Files In EtherScope nXG's Android operating system, images, documents, and other files live in a folder hierarchy, where you can copy, move, and paste them between folders or to external storage locations. See also Navigating EtherScope nXG. - Page 85 Software Management Tap a folder or file to open it. Long press on folders or files to view addi- tional file management operations. Tap the action overflow icon in the Files app to see even more actions, such as to create a new folder, move a file, or delete an item.
- Page 86 Software Management Open the left-side navigation drawer to easily navigate through the different folders. To Move or Copy a file in the Files app, follow this process: 1. Long press on a file to select it. You can then select more files as needed by tapping them.
-
Page 87: Using A Micro-Sd Card
Using a Micro-SD Card To use a Micro-SD card for storage, insert it into the Micro-SD card slot on the left side of your EtherScope nXG. See Inserting a Micro SD card. A Micro-SD card icon appears in the Status... -
Page 88: Using A Usb Drive
Software Management Notification Panel to reveal the SD card noti- fication. The SD card storage location is also available from the Files application. CAUTION: As with any Android device, use the EJECT function before physically removing your Micro-SD card from the USB port to avoid potential corruption of your storage device's file system. -
Page 89: Ejecting Storage Media
Software Management The USB storage location is now available from Files application. CAUTION: As with any Android device, use the EJECT function before physically removing your USB drive from the USB port to avoid potential corruption of your storage device's file system. -
Page 90: Using A Usb Type-C To Usb Cable
Software Management Using a USB Type-C to USB Cable 1. Plug a USB-C cable into the USB-C port on the left side of the EtherScope, and connect to a PC or tablet. 2. On the EtherScope Unit, open the Android device settings by tapping the Settings icon at the bottom of the Home... - Page 91 Software Management NOTE: EtherScope does not charge through a USB cable connected to a PC. 6. On your PC or tablet, navigate to the Ether- Scope nXG folder if it does not pop up auto- matically. From there, you can move, copy, and paste files to and from the EtherScope nXG's file system.
-
Page 92: Updating Software
Link-Live Cloud Service for the EtherScope to find and download software updates. See Getting Started in Link-Live. The first time you claim your EtherScope nXG to Link-Live, a software update may be available. If so, an update icon appears in the Status Bar. - Page 93 Software Management 2. In the Link-Live App, touch the menu icon or swipe right to open the left-side Nav- igation Drawer. 3. Touch Software Update. The Software Update screen opens and displays the version number of any available updates.
- Page 94 4. If both an Android and an Application Update are available, install the Android update first. 5. Touch Download + Install to update the Android operating system or the NetAlly Applications. Each update must be installed separately. The files download and install. When finished,...
-
Page 95: Remote Access
Software Management Remote Access Remotely access the EtherScope nXG using a VNC client connection. While you can establish a VNC connection over the Wired or Wi-Fi Test Ports, the Management Ports provide more stable links. (See Test and Management Ports.) The top notifications are the quickest way to find assigned IP addresses for your EtherScope. - Page 96 Software Management settings configured to connect to a wireless network. General Settings > VNC to configure VNC connections. To connect to EtherScope using a VNC client: 1. Get the IP address of a connected port by swiping down from the Status Bar at the top of the screen to view the notification panel.
-
Page 97: Resetting App Defaults
Software Management Resetting App Defaults Once you have adjusted settings in the NetAlly apps, at some point, you may need to reset all settings to the defaults. The following process resets all app-specific settings to the factory defaults. CAUTION: This operation will delete all saved settings, Profiles, and other saved application data. - Page 98 Software Management 3. Select Storage. (You can also access the App Storage screen from Device Settings > Storage > Internal shared storage > Other apps.) 4. On the Storage screen for the app you selected, touch CLEAR DATA.
- Page 99 Software Management 5. When the "Delete app data?" dialog appears, tap OK. All of the app's settings are reset to factory defaults.
-
Page 100: Saving A Default App Settings Configuration
NetAlly testing apps. Loading a saved default configuration in an app is faster than accessing the main device settings. This strategy would be most useful for... -
Page 101: Restoring Factory Defaults
Software Management Restoring Factory Defaults CAUTION: This operation will delete all test results, user-installed applications, testing app settings, and saved files, and reset device settings to the factory default state. Make sure back up any files you desire to keep. 1. - Page 102 Software Management 6. The unit may ask you to confirm a final time before resetting. Touch the final con- firmation button to reset your Ether- Scope's defaults. The device restarts with factory default settings.
-
Page 103: Etherscope Nxg Testing Applications
EtherScope nXG Testing Applications This section of the User Guide describes the NetAlly-developed network testing apps. Each app is specially designed for fast analysis and intuitive operation to enhance and simplify your network tasks. Open the testing apps by selecting their icons... -
Page 104: Autotest App And Profiles
EtherScope nXG User Guide AutoTest App and Profiles AutoTest is the most comprehensive NetAlly testing application on EtherScope nXG. It allows you to quickly run a variety of test types and save their configurations and network credentials for access whenever you need them. - Page 105 AutoTest App and Profiles AutoTest Chapter Contents This chapter describes AutoTest Profiles, screens, settings, and test results. AutoTest Overview Managing Profiles and Profile Groups Wired AutoTest Profiles Wi-Fi AutoTest Profiles DHCP, DNS, and Gateway Test for Wired and Wi-Fi Profiles Test Targets for Wired and Wi-Fi Profiles...
-
Page 106: Autotest Overview
AutoTest App and Profiles AutoTest Overview AutoTest consists of three distinct testing levels: Test Targets, Profiles, and Profile Groups. At the bottom level is a set of individual Test Targets that connect to network services, such as a web app or FTP site. A Test Target defines parameters including type, target URL/IP address, port number, and Pass/Fail thresholds. - Page 107 AutoTest App and Profiles A Test Target can be added to and used in any number of Profiles. A Profile contains a series of individual network tests. There are three different Profile types: Wired, Wi-Fi, and Air Quality. The Wired and Wi- Fi Profiles include connection tests and credentials for a Wi-Fi network or Wired VLAN.
- Page 108 AutoTest App and Profiles Testing multiple Wi-Fi SSIDs from a single location. Testing both wired and Wi-Fi access from a conference room. The graphic below illustrates each of these scenarios. Note how Test Targets can be included in any number of Profiles, and Profiles can be included in any number of Profile Groups.
- Page 109 AutoTest App and Profiles You can create as many Profile Groups, Profiles, and Test Targets as you want. Back to Title and Contents...
-
Page 110: Managing Profiles And Profile Groups
Managing Profiles and Profile Groups Profiles are a series, or suite, of tests designed to analyze the different characteristics of your networks. The EtherScope nXG AutoTest app features three types of test profiles: Wired Profiles test copper and fiber connections. - Page 111 AutoTest App and Profiles To customize each Profile with the required network settings and a custom name, touch the Profile name first, and then select the settings icon. NOTE: Touching the settings icon on the main AutoTest screen (shown above) opens Profile Groups screen, not the indi- vidual Profile settings.
-
Page 112: Adding New Profiles
AutoTest App and Profiles NOTE: The default Wired Profile does not run automatically over a fiber link. You must touch START in AutoTest to run a Wired Profile on a fiber connection. The default Air Quality Profile runs when you touch START on the main AutoTest screen or the Air Quality screen. - Page 113 AutoTest App and Profiles The profile's configuration screen appears after you select the type of profile you want to add. See the topic for each profile type for a description of its settings. Once you have configured the profile's settings, tap the back button at the bottom of the screen to open and run the new test profile.
- Page 114 AutoTest App and Profiles 1. Open the Wi-Fi app from the Home screen. 2. Tap the menu button to select the SSIDs or BSSIDs list screen. 3. Touch an SSID or BSSID's card to open its Details screen. 4. Touch the FAB (Floating Action Button) to open the Floating Action Menu.
- Page 115 AutoTest App and Profiles 5. In the Floating Action Menu, touch Connect. A Wi-Fi Profile called "Connect to [SSID/BSSID]" is created in AutoTest.
- Page 116 AutoTest App and Profiles The SSID, BSSID (if applicable), and Authentication Type are auto-populated in Wi-Fi Connection settings for the new profile. 6. Tap YES in the pop-up dialog to review and configure additional credentials.
- Page 117 AutoTest App and Profiles 7. Enter any additional credentials (like the network Password), and touch the back button to return to and run the Profile.
-
Page 118: Profile Groups
AutoTest App and Profiles Profile Groups EtherScope nXG also allows you to save Profile Groups. Profile Groups are simply the included list of test Profiles and the order in which they run when you start an AutoTest. You can configure and select Profiles and Profile Groups for different locations, jobs, networks, or other purposes. - Page 119 AutoTest App and Profiles The Profile Group screen opens. On the Profile Group screen, you can perform these actions: Check or uncheck the boxes to include or exclude a test Profile from the currently active Profile Group.
- Page 120 AutoTest App and Profiles Tap the up and down arrows reorder the saved test Profiles on this and the main AutoTest screen for the Profile Group. Touch the action overflow icon Duplicate or Delete a Profile. CAUTION: When you delete a Profile, it is deleted from all Profile Groups.
- Page 121 AutoTest App and Profiles Custom Profile Group Names By default, the AutoTest app screen shows "AutoTest" in the header, and the Profile Group screen shows "Profile Group." Once you save a custom Profile Group name, the name of the Profile Group displays in the AutoTest app header and in the Profile Group screen header.
-
Page 122: Creating New Profile Groups
AutoTest App and Profiles Creating New Profile Groups To create a new Profile Group, follow these steps: 1. Go to the Profile Group screen by touching on the main AutoTest screen. 2. Uncheck the boxes for any Profiles you do not want included in the new Profile Group. - Page 123 AutoTest App and Profiles will run. Unchecked profiles will auto- matically move to the bottom of the list once you save the Profile Group. 5. Tap , and select Save As. A dialog box opens, where you can enter the new name. 6.
- Page 124 AutoTest App and Profiles When running the "Boulder Campus" Profile Group shown above, AutoTest will first run the Wired Profile over the Ethernet connection, next scan the wireless channels for Air Quality results, and then connect to "The Office Network #1" and remain connected to that...
- Page 125 AutoTest App and Profiles network. This Profile Group will not connect to or test the "HOME..." or "Lobo" networks. Back to Title and Contents...
-
Page 126: Using The Main Autotest Screen
AutoTest App and Profiles Using the Main AutoTest Screen To open the AutoTest app, touch the AutoTest icon on the Home screen. Touch the START button on the main AutoTest screen to run all the Profiles in the currently active Profile Group. - Page 127 AutoTest App and Profiles Green indicates a successful test or meas- urement within the set threshold. Yellow indicates a Warning condition. indicates test Failure. The number of warnings or failures within each test profile is also displayed in a colored circle to the right of each profile card: Warnings, 1 Failure).
-
Page 128: Wired Autotest Profiles
AutoTest App and Profiles Wired AutoTest Profiles A Wired Profile runs a series of tests over your copper or fiber network connection. - Page 129 AutoTest App and Profiles Like the main AutoTest screen, Wired Profile tests are summarized on cards. Touch a card to view individual test screens. Each test icon (except the switch) displays green, yellow, or red to indicate the status of the completed test step: Success/Warning/Fail.
- Page 130 AutoTest App and Profiles Port linkage is indicated in the top Status Bar with this notification icon: Wired-Profile-Specific Tests The tests that are specific to a Wired Profile include PoE, Wired Link, and Switch. PoE, Wired Link, and Switch Results are described next.
-
Page 131: Wired Profile Results
AutoTest App and Profiles Wired Profile Results The image below shows a completed AutoTest Wired Profile. - Page 132 AutoTest App and Profiles On the Wired Profile screens, you can perform these actions: Touch any of the test result cards to view additional test information. Open the settings from any individual test screen, like PoE or Link, to go directly to the settings for the current test.
-
Page 133: Poe Test Results
AutoTest App and Profiles need to rerun the Profile to re-establish link and enable additional actions. PoE Test Results The card for the Power over Ethernet (PoE) test displays the measured Voltage, Class, and Wattage. Refer to PoE Settings if needed. Touch the card to open the PoE results screen. - Page 134 AutoTest App and Profiles PoE Test Results Screen In addition to the information from the PoE card, the PoE test screen shows these results: Class Requested Class: Class selected in the PoE test settings Received Class: Class acknowledgment received from the switch...
- Page 135 AutoTest App and Profiles TruePower™ Power: Measured wattage with load. NOTE: The PoE card displays additional TruePower™ results only if TruePower is enabled in the Wired Profile Settings. Voltage Unloaded: Measured voltage without load TruePower™ Voltage: Measured voltage with load Positive: Positive PoE cable pair IDs Negative: Negative PoE cable pair IDs PSE Type: Switch's advertised Power Sourcing...
-
Page 136: Wired Link Test Results
AutoTest App and Profiles Wired Link Test Results The Wired Link card indicates whether you can connect to an active network switch. The Link test card for a copper Ethernet connection displays the advertised speed and duplex capabilities in grey text and the detected speed and duplex in black... - Page 137 The Wired Link test screen shows the following: Speed Advertised Speed: Speed capability as reported by the switch Actual Speed: Link speed as measured by EtherScope nXG Duplex Advertised Duplex: Duplex capabilities reported by the switch Actual Duplex: Duplex in use as detected by...
-
Page 138: Switch Test Results
AutoTest App and Profiles RJ-45 Details (Copper) Rx Pair: Link receive pair SFP Details (Fiber) Rx Power: Link receive power Wavelength: Wavelength (in nm) at which the fiber connection is operating Results Codes: Final status of the test (Success or Failure) Switch Test Results The results available for the Switch Test are based on Discovery Protocol advertisements... - Page 139 AutoTest App and Profiles and SNMP system group information and statistics. See Discovery Settings information about SNMP configuration. The Switch test card displays the discovered switch name and the port name. The Switch test is not graded, so the icon remains black. If the EtherScope was unable to identify the nearest switch, "Nearest Switch Not Found"...
- Page 140 AutoTest App and Profiles Switch Test Results Screen If the EtherScope was unable to obtain switch information from an AutoTest run, touch REFRESH to capture and display the next port advertisement. The switch results screen shows the following:...
- Page 141 AutoTest App and Profiles Switch Name: Name advertised by the switch IP and MAC Addresses: Discovered switch addresses Type: Discovery Protocol - CDP, LLDP, EDP, SNMP, or FDP Port: Detected Port name VLAN ID: Discovered VLAN ID number Voice VLAN: Discovered Voice VLAN ID number Switch Model: Discovered switch model name and number...
-
Page 142: Wired Profile Fab
AutoTest App and Profiles DHCP, DNS, and Gateway Results Results for these tests operate the same in both Wired and Wi-Fi profiles. DHCP, DNS, and Gateway Tests for Wired and Wi-Fi. Target Tests See the Test Targets topic for information on target test results. - Page 143 AutoTest App and Profiles When you touch Add Comments, the Link-Live sharing screen opens. Touch the fields to enter your desired comments, and tap SAVE TO LAST TEST RESULT to upload them. When you touch Add Picture, EtherScope lets you open the Gallery or Camera app to select or take a photo that is then uploaded and attached to your most recent test results.
- Page 144 AutoTest App and Profiles HTTP, and FTP target tests to the current profile. Back to Title and Contents...
-
Page 145: Wired Profile Settings
AutoTest App and Profiles Wired Profile Settings These settings control the wired test connection, PoE test, the thresholds for Success/Warning/Fail results, and any user- added test targets. Touch the settings icon on the Wired profile screen, or add a new Wired profile, to configure the profile's settings. - Page 146 AutoTest App and Profiles On the Wired Profile settings screen, touch each field described below as needed to configure the profile. Changed settings are auto- matically applied. When you finish configuring, tap the back button to return to the profile.
-
Page 147: Poe Test Settings
AutoTest App and Profiles Name Touch the Name field to enter a custom name for the profile. This name appears on the main AutoTest screen profile card and the Wired Profile screen header. PoE Test Settings Open PoE Test settings to enable or disable PoE and configure the PD Class. - Page 148 AutoTest App and Profiles Powered Device Class Touch to select a PoE class setting to match your switch's (or PoE injector's) available class. EtherScope supports these classes: 802.3af Classes 0-3 802.3 at PoE+ Class 4 Cisco's UPOE, which can provide up to 51 W 802.3bt Classes 5-8 Select the PoE Injector option if you are using a non-IEEE injector.
- Page 149 AutoTest App and Profiles LLDP negotiation will fail, but it will not affect the rest of the test. Requested Power (W) This setting appears if UPOE or PoE Injector are selected in the Powered Device Class setting shown above. Touch to enter a Requested Power other than the default, if needed.
-
Page 150: Wired Connection Settings
AutoTest App and Profiles Powered Device (PD). Tap the toggle button to enable the TruePower feature. PoE General Settings See the PoE section in General Settings descriptions of the Test PoE before Link and Charge Battery via PoE settings, which also affect the PoE Test. - Page 151 AutoTest App and Profiles Speed/Duplex Touch to select the speed and duplex option that you want to test your network against. The default is Auto negotiation. When speed is set to Auto, EtherScope auto- negotiates to the highest possible speed/duplex supported by the link partner.
-
Page 152: Http Proxy
AutoTest App and Profiles DHCP, DNS, and Gateway Settings Settings for these tests operate the same in both Wired and Wi-Fi profiles. DHCP, DNS, and Gateway Tests for Wired and Wi-Fi. Test Targets Touch the Test Targets field to open the Test Targets screen and add custom Ping, TCP Connect, HTTP, or FTP Tests to your AutoTest profile. - Page 153 AutoTest App and Profiles Touch each field to open a pop-up keyboard and enter the appropriate Address, Port, Username, and Password. Touch OK to save your entries. Back to Title and Contents...
-
Page 154: Wi-Fi Autotest Profiles
AutoTest App and Profiles Wi-Fi AutoTest Profiles A Wi-Fi Profile runs a series of tests by connecting to a selected wireless network. - Page 155 AP test is not graded, so the icon stays black. Wi-Fi Profiles do not run automatically. After connecting to a network during a Wi-Fi connection test, EtherScope nXG remains connected until you run another Wi-Fi or Quality Profile or open the Wi-Fi app.
- Page 156 AutoTest App and Profiles The link and channel cards update in real time to display the connection measurements for as long as EtherScope remains connected to the wireless network. Unlike the Wired Profile, the factory default Wi- Fi Profile cannot run until you have configured an SSID with the proper credentials.
-
Page 157: Wi-Fi Profile Test Results
AutoTest App and Profiles Wi-Fi Profile Test Results The image below shows a completed AutoTest Wi-Fi Profile. - Page 158 AutoTest App and Profiles This Profile connects to SSID "The Office Network #1." The Profile is displaying one Warning condition from a timeout of the second Gateway ping. On the Wi-Fi Profile screen, you can perform these actions: Touch any of the test result cards to view additional test information.
-
Page 159: Wi-Fi Link Test Results
AutoTest App and Profiles Wi-Fi Link Test Results The Wi-Fi link test card indicates whether you can connect to the configured network at your current location. The Wi-Fi Link card displays the SSID, current signal strength (dBm), link speed (Mbps), and number of roams. Refer to Wi-Fi Connection Settings if needed. - Page 160 AutoTest App and Profiles Wi-Fi Link Test Screen The Wi-Fi Link test screen shows these results:...
- Page 161 AutoTest App and Profiles SSID Security: Security protocol in use on the network Roams: Number of times the unit has dis- connected from the previous AP and connected to a different AP with a better signal strength. This behavior is partly con- trolled by the Roam Threshold in the Wi-Fi Connection...
- Page 162 AutoTest App and Profiles This image shows an example Link test screen with roaming information. Last Roam From: If the EtherScope has roamed to a new AP, the previous AP's name, BSSID, and Channel display. Periodic Scans: Number of times the EtherScope has scanned for a new AP supporting the same SSID.
- Page 163 AutoTest App and Profiles Signal, Utilization, Retries, and TX Rate Graphs Results: These graphs, described below, update in real time for as long as the unit is still connected to the network and you are still viewing this screen. You can touch and drag (or swipe) left and right on each graph to move...
- Page 164 AutoTest App and Profiles backward and forward in time and view the recorded measurements. The graphs save and display data for up to 24 hours in the past if the unit stays linked. Under each graph, a legend table displays the Current, Minimum, Maximum, and Average measurements.
- Page 165 AutoTest App and Profiles Signal (dBm) graph: Plots the signal strength in dBm of the connected AP Signal - The AP's signal strength in dBm Noise - The noise level in dBm on the channel used SNR - The network's signal-to-noise ratio, a measure of signal strength relative to noise, measured in decibels (dB)
- Page 166 AutoTest App and Profiles Utilization (%) graph: Plots percentage of the connected channel's capacity being used by 802.11 devices and by non-802.11 interference Retries (% of packets) graph: Plots per- centage of transmitted packets that are retry packets Retry Rate % - The AP's signal strength in dBm Retry Pkts - The number of retry packets seen in the current sample cycle...
- Page 167 AutoTest App and Profiles TX Rate (Mbps) graph: Plots the physical transmission rate. The green horizontal dotted line indicates the AP's maximum TX rate. Results Codes: Final status of the test (Success or Failure) Tap the blue link at the bottom of the link test screen to view the CONNECT LOG or run a Wi-Fi packet CAPTURE...
-
Page 168: Connect Log
AutoTest App and Profiles Connect Log The Connect Log shows the Wi-Fi connection log, including driver activity, supplicant, and the DHCP process. The Connect Log can be especially helpful for identifying linking or roaming problems. -
Page 169: Channel Test Results
AutoTest App and Profiles Channel Test Results The Channel card shows the channel on which the AP is operating and the current 802.11 and Non-802.11 utilization. Refer to Channel Test Settings if needed. - Page 170 AutoTest App and Profiles Channel Test Screen The Channel Test results screen indicates the Center Frequency and Frequency Range of the connected channel along with a real-time Utilization graph. Results: The channel Utilization (%) graph updates in real time for as long as the unit is...
- Page 171 AutoTest App and Profiles still connected to the network. Swipe left and right on the Utilization graph to move backward and forward in time and view the recorded measurements. The graph saves and displays data for up to 24 hours in the past if the unit stays linked.
- Page 172 AutoTest App and Profiles Tap the blue links at the bottom of the channel test results to open the Wi-Fi app's CHANNEL DETAILS CHANNELS MAP screens, or to run a Wi-Fi packet CAPTURE on the connected channel.
-
Page 173: Ap (Access Point) Test
AutoTest App and Profiles AP (Access Point) Test The AP card shows the AP's name and the SSID of the network it is supporting. The AP name shown is based on what the EtherScope is able to gather from the device. The AP test is not graded, so the icon remains black. - Page 174 AutoTest App and Profiles AP Test Screen In addition to the AP name and SSID, the AP test screen shows the following: Device Name: AP's name IP Address: The AP's assigned IP address. If none could be determined, the field displays dashes --.
- Page 175 AutoTest App and Profiles Roams: Number of times the unit has roamed and connected to a different AP 802.11 Channel(s): Channel or channels the AP is operating on. If the BSSID is on multiple channels, the bold channel number indicates the primary channel. Type: 802.11 type in use on the current link Supported Types: 802.11 types that the BSSID supports...
-
Page 176: Wi-Fi Profile Fab
AutoTest App and Profiles DHCP, DNS, and Gateway Results Results for these tests operate the same in both Wired and Wi-Fi profiles. DHCP, DNS, and Gateway Tests for Wired and Wi-Fi. Target Tests See the Test Targets topic for information on target test results. - Page 177 AutoTest App and Profiles When you touch Add Comments, the Link-Live sharing screen opens. Touch the fields to enter your desired comments, and tap SAVE TO LAST TEST RESULT to upload them. When you touch Add Picture, EtherScope lets you open the Gallery or Camera app to select or take a photo that is then uploaded and attached to your most recent test results.
- Page 178 AutoTest App and Profiles HTTP, and FTP target tests to the current profile. Back to Title and Contents...
-
Page 179: Wi-Fi Profile Settings
AutoTest App and Profiles Wi-Fi Profile Settings These settings control which network is tested, how the EtherScope nXG connects, thresholds Success/Warning/Fail results, and any user- added test targets. To configure the profile settings, touch the settings icon on the Wi-Fi Profile screen, or... - Page 180 AutoTest App and Profiles On the Wi-Fi Profile settings screen, touch each field described below as needed to configure the profile. Changed settings are automatically applied.
-
Page 181: Wi-Fi Connection Settings
AutoTest App and Profiles NOTE: If you add a new Wi-Fi profile from Wi-Fi Analysis app, the Profile Name, SSID, and Authentication type are auto- populated. See Creating a Wi-Fi Profile from the Wi-Fi Analysis App. When you finish configuring, tap the back button to return to the profile. - Page 182 AutoTest App and Profiles SSID Enter an SSID or select from the list of discovered SSIDs. Authentication Open the Authentication screen to select the correct security type for the network, and enter all necessary authentication credentials for the...
-
Page 183: Advanced (Wi-Fi Connection)
AutoTest App and Profiles network, such as Encryption Type, Keys, EAP Type, Username, Certificates, and/or Password. Encryption Touch to select an encryption type if needed. The default is "Auto." Password Touch the Password field to enter the network password. Advanced (Wi-Fi Connection) - Page 184 AutoTest App and Profiles BSSID Enter or select a specific BSSID for the Wi-Fi Profile to prevent the EtherScope from roaming to a new AP while linked. Roam Threshold This threshold controls the Signal Strength (in dBm) at which EtherScope disconnects from the linked AP and attempts to connect to another AP on the network with a stronger signal.
- Page 185 AutoTest App and Profiles Touch each field to select a new value or enter a custom one. Each threshold also has a toggle button that allows you to disable grading based on that measurement entirely.
-
Page 186: Channel Test Settings
AutoTest App and Profiles Signal Level Thresholds: Measured signal from the AP Signal-to-Noise (SNR) Thresholds: Ratio of measured AP signal to noise level detected on the channel Retries Thresholds: Retry frames as a percentage of total transmitted frames Transmit Rate (TX) Thresholds: Measured rate as a percentage of the AP's maximum throughput rate Alternate ID... - Page 187 AutoTest App and Profiles 802.11 Utilization Threshold (%) This threshold controls the Success/Warning/Fail gradings for the percentage of the connected channel's capacity being used by 802.11 devices.
- Page 188 AutoTest App and Profiles Touch the toggle button to enable or disable test grading based on 802.11 util- ization. Touch Warning or Failure to select or enter custom percentage values for Warning or Failure results. Non-802.11 Utilization Threshold (%) This threshold controls the Success/Warning/Fail gradings for the percentage of the connected channel's capacity...
-
Page 189: Http Proxy
AutoTest App and Profiles Test Targets Touch the Test Targets field to open the Test Targets screen and add custom Ping, TCP Connect, HTTP, or FTP Teststo your AutoTest profile. See Test Targets to learn more. HTTP Proxy The Proxy control lets you specify a proxy server through which the connection will be established. - Page 190 AutoTest App and Profiles Touch each field to open a pop-up keyboard and enter the appropriate Address, Port, Username, and Password. Touch OK to save your entries. Back to Title and Contents...
-
Page 191: Wired And Wi-Fi Autotests
AutoTest App and Profiles DHCP, DNS, and Gateway Tests for Wired and Wi-Fi AutoTests These tests are included in both Wired AutoTest Profiles, and the settings and results fields are the same for each Profile type. Access AutoTest's DHCP, DNS, and Gateway settings from either the Wired or Wi-Fi Profile settings screens, or by touching the settings button... -
Page 192: Dhcp Or Static Ip Test
AutoTest App and Profiles DHCP or Static IP Test The DHCP (Dynamic Host Configuration Protocol) test indicates whether the EtherScope receives an IP address assignment from the DHCP server. DHCP Settings – IP Configuration Access the DHCP test settings from the Wired or Wi-Fi Profile settings or by tapping the settings button on the DHCP test results screen. - Page 193 AutoTest App and Profiles addresses. (DHCP only) Response Time Threshold This field only appears if DHCP is enabled. The Response Time Threshold controls how long the EtherScope waits for a DHCP server response before failing the Link and DHCP tests. Static IP Address...
- Page 194 AutoTest App and Profiles The Static IP address fields for Subnet Mask, Default Gateway, and Primary and Secondary DNS Servers only appear if DHCP is disabled. Touch each field to open a pop-up number pad and enter the static addresses as needed. Touch OK to save your entries.
- Page 195 AutoTest App and Profiles DHCP Test Results Screen Device Name: The discovered name of the Switch (Wired) or AP (Wi-Fi), or, if no name could be discovered, the IP address IPv4 Address: IP address of the server...
- Page 196 AutoTest App and Profiles MAC Address: Server's MAC address. Two dashes -- indicate that no MAC address was provided from the server. Results Offered: IP address offered by the DHCP server Accepted: IP address accepted by the Ether- Scope Subnet Mask: IP address of the subnet where EtherScope is testing Subnet: Combination of the subnet mask and the offered IP address...
- Page 197 AutoTest App and Profiles End User Response Time table and graph: Breakdown of the times for the process of acquiring a DHCP IP address Offer: Time between when the EtherScope sent the discovery and received an address offer from the DHCP server...
- Page 198 AutoTest App and Profiles Acknowledge: Time between EtherScope sending the request and receiving the acknowledgment from the DHCP server Total Time: Total amount of time consumed by the DHCP process Threshold: The DHCP Response Time Threshold from the DHCP test settings, which controls how long the EtherScope waits for a DHCP server response before failing the DHCP test.
- Page 199 AutoTest App and Profiles The additional actions available on the DHCP test screen include opening the Path Analysis,Ping/TCP, or Capture app populated with the DHCP server address or browsing to the address in the web browser. Static IP Test Results If DHCP is disabled, the DHCP test becomes a "Static IP"...
- Page 200 AutoTest App and Profiles Touch the card to open the test results screen. The Static IP test screen displays the configured addresses. Subnet: Combination of the subnet mask and the offered IP address Subnet Mask: IP address of the subnet where EtherScope is testing Gateway: Name of the Gateway server IP Address: IP address of the Gateway server...
- Page 201 AutoTest App and Profiles DNS (1 and 2): Names and IP addresses of Primary and Secondary DNS servers IPv6 Addresses: Addresses obtained via router advertisement Results Codes: Final status of the test (Success or Failure) Duplicate IP Address The DHCP and Static IP tests also detect and report the presence of a device using the same IP address (duplicate IP).
-
Page 202: Dns Test
AutoTest App and Profiles DNS Test The DNS (Domain Name System) server test checks the performance of DNS servers resolving the specified URL. The EtherScope obtains DNS addresses through DHCP or static address configuration. DNS Test Settings Lookup Name This is the URL the DNS server(s) will attempt to resolve. - Page 203 AutoTest App and Profiles IP Protocol Version Touch the field to switch between IPv4 and IPv6. Lookup Time Threshold This threshold controls how long the EtherScope waits for a response from the DNS server(s) before the test is failed. The default is 1 second.
- Page 204 AutoTest App and Profiles DNS Test Results Screen Lookup Name: Name resolved by the DNS servers Threshold: Lookup Time Threshold from the DNS test settings DNS #: Name of the listed DNS server Lookup IP: Resolved IP address...
- Page 205 AutoTest App and Profiles Lookup Time: Time to receive the IP address after the lookup request sent Results Codes: Final status of the test (Success or Failure) for each DNS server Touch blue links or the blue action overflow icon at the bottom of the test results...
- Page 206 AutoTest App and Profiles screens to run the DNS Test Again, open another testing app populated with the name and IP address of DNS 1, or Browse to the Primary DNS server in your web browser. Back to Title and Contents...
-
Page 207: Gateway Test
AutoTest App and Profiles Gateway Test This test indicates whether the default Gateway could be successfully pinged and identifies the address of the current IPv4 and IPv6 routers. Gateway Timeout Threshold The only setting for the Gateway Test is the timeout threshold, which indicates how long the EtherScope will wait for a response from... - Page 208 AutoTest App and Profiles the gateway server before grading the test as a fail. Select one of the value options, or enter a custom value. Gateway Test Results EtherScope gets the Gateway's IP address from DHCP or the static IP configuration, and uses SNMP to acquire system group information and statistics for the port that services the Ether- Scope's subnet.
- Page 209 AutoTest App and Profiles Gateway Test Results Screen IPv4 Gateway Name: Resolved hostname of the Gateway server, or IP address if no name could be discovered IPv4 Address: Internal IPv4 address of the Gateway server...
- Page 210 AutoTest App and Profiles MAC Address: Server's MAC address. Two dashes -- indicate that no MAC address was provided from the server. IPv6 Address: Router's IPv6 address (if available) IPv6 Gateway Name: Name advertised by the IPv6 router (if available) Protocols: Routing protocols the EtherScope used to obtain the Gateway data Ping Results...
- Page 211 AutoTest App and Profiles Touch blue links or the blue action overflow icon at the bottom of the test results screens to run the Gateway TEST AGAIN, open another testing app, or Browse to the Gateway's IPv4 Address in your web browser. Back to Title and Contents...
-
Page 212: Test Targets For Wired And Wi-Fi Autotests
Test Targets for Wired and Wi-Fi AutoTests AutoTest Target tests are user-assignable endpoints to which EtherScope nXG attempts to connect each time the AutoTest profile runs. These tests ensure availability of internal or external websites, servers, and devices to users of your network. -
Page 213: Adding And Managing Test Targets
AutoTest App and Profiles Adding and Managing Test Targets To add test targets to AutoTest profiles and manage your saved targets, open the Test Targets screen from either the Wired Wi-Fi Profile Settings or by touching the FAB on the Wired Wi-Fi Profile results screens. - Page 214 AutoTest App and Profiles On the Test Targets screen, you can perform these actions: Select the checkboxes for each Target you want to include in the current Wired or Wi- Fi profile. Tap the up and down arrows reorder the saved Test Targets on this...
- Page 215 AutoTest App and Profiles screen and the main AutoTest Profile screen. Touch the action overflow icon Duplicate or Delete a target test. CAUTION: When you delete a Test Target, you delete it from all Profiles. To remove a Test Target from the current profile, simply uncheck it.
- Page 216 AutoTest App and Profiles Touch any target's name, or add a new target, to open the test's settings, where you can enter a custom test name, target address, and thresholds.
-
Page 217: Target Test Results Screens
AutoTest App and Profiles Target Test Results Screens The Target Test type icons display green, yellow, or red to indicate the status (or grade) of the completed test portions: Success/Warning/Fail. As an example, in the Ping test image below, the entire Ping test is graded with a Warning because the third Ping was not returned within the Timeout Threshold configured in the settings. - Page 218 AutoTest App and Profiles under the Results heading, the yellow dot points out the third Response Time as the reason for the Warning. Additionally, the third Result Code lists "Timout error" as the reason for the Warning. Additional Target Test Actions After the Target test has completed, touch any of the blue links to perform additional actions, including opening other testing apps.
- Page 219 AutoTest App and Profiles pre-populated, for example: ⸰ Open the Ping/TCP app with the current target address. ⸰ Run a packet Capture on traffic from the test target. ⸰ Browse to the target URL on the internet with your web browser app.
-
Page 220: Autotest Ping Test
AutoTest App and Profiles AutoTest Ping Test A Ping test sends an ICMP echo request to the selected target to determine whether the server or client can be reached and how long it takes to respond. The AutoTest Target Ping Test sends three Pings to the target and reports the response times. - Page 221 AutoTest App and Profiles Ping Test Settings Name: This field allows you to assign a custom name to the test. The name appears on the target test card in the profile. Device Name: Enter the IP address or URL of the server you want to ping.
- Page 222 AutoTest App and Profiles address, the DNS lookup portion of the test is skipped. IP Protocol Version: IPv4 is used by default. Touch the field to switch between IPv4 and IPv6. Frame Size (bytes): This setting specifies the total size of the payload and the header sent. Valid sizes are 64 bytes to 1518 bytes.
- Page 223 AutoTest App and Profiles The Ping card shows the Ping test name entered in the Ping test settings and the three Ping response times from the target. Touch the card to open the Ping results screen. AutoTest Ping Results Screen Device Name: Hostname or address of the target device IPv4 or IPv6 Address: IP address of the...
- Page 224 AutoTest App and Profiles MAC Address: Target device's MAC address. The two dashes -- indicate that no MAC address was provided from the server. Results Lookup Time: How long it took to resolve the URL into an IP address Response Times: How long it took for the EtherScope to receive a response from the target after sending each of the three Pings Threshold: The Timeout Threshold...
- Page 225 AutoTest App and Profiles Touch blue links or the blue action overflow icon at the bottom of the test results screens to run the Ping TEST AGAIN, open another testing app, or Browse to the Ping target address in your web browser.
-
Page 226: Autotest Tcp Connect Test
AutoTest App and Profiles AutoTest TCP Connect Test A TCP Connect test opens a TCP connection with the selected target to test for port avail- ability using a 3-way handshake (SYN, SYN/ACK, ACK). The AutoTest Target TCP Connect test runs three connection tests and reports the response times. - Page 227 AutoTest App and Profiles Name: This field allows you to assign a custom name to the test. The name appears on the target test card in the profile. Device Name: Enter the IP address or URL of the target you want to test. If you enter an IP address, the DNS lookup portion of the test will be skipped.
- Page 228 AutoTest App and Profiles AutoTest TCP Results Screen Device Name: DNS name of the device tested IPv4 or IPv6 Address: IP address of the target device MAC Address: Device's MAC address. The two dashes -- indicate that no MAC address was provided.
- Page 229 AutoTest App and Profiles Results Lookup Time: How long it took to resolve the URL into an IP address Response Times: How long it took for the EtherScope to receive a response from the server for each of the three connect tests Threshold: The Timeout Threshold indicated in the test's settings Results Codes: Final status of the test (Success...
-
Page 230: Http Test
AutoTest App and Profiles HTTP Test The HTTP test performs a comprehensive end user response time (EURT) measurement when downloading the specified web page. The target can be an IPv4 address, IPv6 address, or URL. HTTP Test Settings HTTP settings allow test grading criteria based on responses and return code in addition to the time threshold. - Page 231 AutoTest App and Profiles Name This field allows you to assign a custom name to the test. The name appears on the target test card in the profile.
- Page 232 AutoTest App and Profiles Enter a target address. To reach web servers that operate on a non-default port, enter a colon (:) and specify the port number after the URL. IP Protocol Version IPv4 is used by default. Touch the field to switch between IPv4 and IPv6.
- Page 233 AutoTest App and Profiles Response Must Contain Text entered here functions as pass/fail test criteria based on the presence of the text string on a specified server or URL. To construct a text string, enter a word or several words with exact spacing.
- Page 234 AutoTest App and Profiles Response Must Not Contain Like the setting above, except text entered here functions as pass/fail test criteria based on the absence of the text string on a specified server or URL. The test passes if the text string is not found.
- Page 235 AutoTest App and Profiles HTTP Test Results The HTTP card shows the test name entered in the test settings and response time from the target.
- Page 236 AutoTest App and Profiles HTTP Test Results Screen Device Name: DNS name of the server tested IPv4 or IPv6 Address: IP address of the server...
- Page 237 AutoTest App and Profiles MAC Address: Server's MAC address. The two dashes -- indicate that no MAC address was provided from the server. URL: The target URL Results Ping: A ping test runs simultaneously with the HTTP test, and this result field displays the Ping response time.
- Page 238 AutoTest App and Profiles Total Time: The end user response time (EURT), which is the total time it took to download the web page. It is the sum of DNS lookup, TCP connect, data start, and data transfer time. If the Total Time exceeds the Response Time Threshold in the settings, test will fail.
- Page 239 AutoTest App and Profiles End User Response Time graph: Pie chart of the times for each phase of the test (DNS, Lookup, TCP Connect, Data Start, and Data Transfer) Results Codes: Final status of the test (Success or Failure) The HTTP test also shows the Return Code from the website server.
- Page 240 AutoTest App and Profiles Touch blue links or the blue action overflow icon at the bottom of the test results screens to run the HTTP TEST AGAIN, open another testing app, or Browse to the target address in your web browser. Captive Portal Connections The HTTP test supports connections through a network with a captive portal requirement.
- Page 241 AutoTest App and Profiles To connect to the Captive Portal, while still connected to the SSID and channel, tap the action overflow icon on the HTTP test screen, and then select Browse. A window opens in your default browser and allows you to enter the required credentials for the network.
-
Page 242: Ftp Test
AutoTest App and Profiles FTP Test The FTP test performs a file upload to or download from an FTP server, allowing veri- fication of server and network performance. The target can be an IPv4 address, IPv6 address, or URL. The results provide a complete breakdown of the overall file transfer time into its component parts. - Page 243 AutoTest App and Profiles Name This field allows you to assign a custom name to the test. The name appears on the target test card in the profile.
- Page 244 AutoTest App and Profiles FTP Server Enter the IPv4 address or URL of the FTP server you want to test. If you enter an IP address, the DNS Lookup portion of the test is skipped. IP Protocol Version IPv4 is used by default. Touch the field to switch between IPv4 and IPv6.
- Page 245 AutoTest App and Profiles Specifying a transfer size that is greater than file being retrieved does not cause the test to fail. The test stops when the file has finished downloading. When the Direction setting is Put, the default transfer size of ALL causes the Ether- Scope to create and upload a file that is 10 MB.
- Page 246 AutoTest App and Profiles the EtherScope, and the test string is repeated to produce the set file size. Response Time Threshold This threshold controls how long the EtherScope waits for a response from the FTP server before failing the test. Touch the field to change the value.
- Page 247 AutoTest App and Profiles HTTP Proxy The Proxy control in target test settings utilizes the server address and port specified in the main profile settings. See Wired Profile Settings Wi-Fi Profile Settings. FTP Test Results The FTP card shows the test name entered in the test settings and response time from the target.
- Page 248 AutoTest App and Profiles FTP Test Results Screen Device Name: Hostname of the server tested IPv4 or IPv6 Address: IP address of the server MAC Address: Server's MAC address. The two dashes -- indicate that no MAC address was provided from the server.
- Page 249 AutoTest App and Profiles Get File: File path and name entered in the settings that was transferred to or from the FTP server. Results Ping: A ping test runs simultaneously with the FTP test, and this result field displays the Ping response time.
- Page 250 AutoTest App and Profiles web page. It is the sum of DNS lookup, TCP connect, data start, and data transfer time. If the Total Time exceeds the Response Time Threshold in the settings, the test will fail. If the Response Time Threshold is exceeded during a step in the test, the current phase of the test (DNS, Lookup, TCP Connect, Data Start, or Data Transfer) is denoted with a red...
- Page 251 AutoTest App and Profiles End User Response Time graph: Pie chart of the times for each phase of the test (DNS, Lookup, TCP Connect, Data Start, and Data Transfer) Results Codes: Final status of the test (Success or Failure) The FTP test also shows the Return Code from the server.
- Page 252 AutoTest App and Profiles another testing app, or Browse to the FTP server in your web browser. Back to Title and Contents...
-
Page 253: Air Quality Autotest Profiles
AutoTest App and Profiles Air Quality AutoTest Profiles Air Quality Profiles perform a single scan of the channels in your wireless network to measure channel utilization and interference. Each table on the Air Quality results screen shows the top four channels in each band with the highest utilization or co-channel inter- ference, along with the number of APs operating on the channel. - Page 254 AutoTest App and Profiles First, EtherScope scans the 2.4-GHz band and displays results and then does the same for the 5-GHz band. Channel usage depends on the number of clients connected to the network and the...
-
Page 255: Air Quality Profile Settings
AutoTest App and Profiles amount of interference from devices like microwaves or smartphones using Bluetooth. Very high utilization or interference can affect network performance. Air Quality Profile Settings To configure the profile settings, touch the settings icon on the Air Quality Profile screen, or add a new Air Quality Profile to AutoTest. - Page 256 AutoTest App and Profiles The settings for Air Quality are thresholds for grading the channel utilization and inter- ference.
- Page 257 AutoTest App and Profiles On the Air Quality Profile settings screen, touch each field described below as needed to configure the profile. Changed settings are auto- matically applied. When you finish configuring, tap the back button to return to the profile. Name Touch the Name field to enter a custom name for the profile.
-
Page 258: Air Quality Profile Results
AutoTest App and Profiles the number of APs operating on the same channel. Co-channel Interference AP Signal Level This setting designates the minimum signal level at which an AP must be measured to be counted in Co-Channel Interference meas- urements. Touch the field to select a new value or enter a custom one. - Page 259 AutoTest App and Profiles Failures indicated by the yellow and red dots next to the corresponding measurements. Air Quality test gradings are based on the Thresholds configured in the Profile's settings.
- Page 260 AutoTest App and Profiles In the case shown here, the Warnings and Failures occurred because of high Utilization and Co-channel Interference caused by the number of APs active on the top three 2.4 GHz channels: 1, 6, and 11. 802.11 Utilization %: Percentage of the displayed channel's capacity being used by all 802.11 WLAN devices Non-802.11 Utilization %: Percentage of the...
- Page 261 AutoTest App and Profiles Two dashes -- indicate that no Utilization was detected on the Channels shown. Co-channel Interference: Interference caused by multiple APs operating on the same channel...
- Page 262 AutoTest App and Profiles that exceed the minimum Co-channel Inter- ference AP Signal Level threshold in the settings. This measurement accounts for 40- MHz and 80-MHz channels in the 5-GHz band by counting an AP on its primary and each secondary channel.
-
Page 263: Ping/Tcp Test App
Back to Title and Contents EtherScope nXG User Guide Ping/TCP Test The Ping/TCP test app runs a continuous Ping or TCP Connect test to your chosen target, allowing you to monitor connectivity changes. A Ping test sends an ICMP echo request to... -
Page 264: Ping/Tcp Settings
Ping/TCP Test App Ping/TCP Settings To configure a test, you can manually enter a hostname or IP address in the settings, or you can select Ping or TCP Connect from another testing app's device screen. Populating Ping/TCP from Another When you open the Ping/TCP app from another app, the address is pre-populated as the Ping or TCP target device. - Page 265 Ping/TCP Test App If the Ping/TCP app is opened from this screen, the IPv4 address from the Discovery app is already configured as the Ping/TCP target.
- Page 266 Ping/TCP Test App...
-
Page 267: Configuring Ping/Tcp Settings
Ping/TCP Test App Configuring Ping/TCP Settings Manually To configure the target and settings manually, open the app's settings... - Page 268 Ping/TCP Test App Device Name: Enter the IP address or DNS name of the target. IP Protocol Version: IPv4 is used by default. Touch the field to enable IPv6 instead. Interface: This setting determines the EtherScope port from which the test runs. Touch the field to select Any, Wired or Wi-Fi Test Port, or Wired or Wi-Fi Management Port.
- Page 269 Ping/TCP Test App Port: This setting only appears if the TCP Connect Protocol is selected. It indicates the port number EtherScope will use to connect to the target address for a TCP Port Open test. If needed, touch the Port field to open a pop-up number pad and enter a new port number.
-
Page 270: Running Ping/Tcp Tests
Ping/TCP Test App Running Ping/TCP Tests Your unit must be connected to an active wired or Wi-Fi network (Test or Management Port) to run Ping and TCP Connect tests. Icons in the top Status Bar indicate whether and how your EtherScope is connected. - Page 271 Ping/TCP Test App Device Name: Hostname or address of the target device IPv4 or IPv6 Address: IP address of the target...
- Page 272 Ping/TCP Test App device MAC Address: Target device's MAC address. The two dashes -- indicate that no MAC address was provided from the device. Port: The port number used for the TCP Connect test. This field does not appear in Ping test results.
- Page 273 Ping/TCP Test App time and view the recorded measurements. The graph saves and displays data for up to 24 hours in the past if the unit stays linked. Response: This table displays the Current, Minimum, Maximum, and Average response time measurements. Limit: This is the Timeout Threshold from the Ping/TCP app's settings.
-
Page 274: Capture App
Back to Title and Contents EtherScope nXG User Guide Capture Packet capture is the process of recording network traffic in the form of packets as data streams back and forth over Wi-Fi or wired connections. Packet captures can help you... -
Page 275: Capture Settings
Wi-Fi capture saves the packets seen on channel 1. If you open the Capture app from another NetAlly test app's details screens, Capture filters are automatically applied. Filters that can be applied from other apps include Wired IP and MAC or Wi-Fi Channel, Channel Width, and... - Page 276 Capture App For example, the Wi-Fi app's BSSID details screen shown below contains the option to start a Wi-Fi Capture.
- Page 277 Capture App When the Capture app opens, filters are already set with the BSSID, Channel, and Channel Width from the Wi-Fi app. The Capture settings are saved until you clear the filters or open the app with new filters applied. Touch the settings icon in the Capture screen to configure capture settings.
- Page 278 Capture App File Size Limit: Touch this field to specify a size for the capture file. The default size is 1 MB, and largest size allowed is 1000 MB. The capture stops when the captured file reaches this size. When capture is running, the capture screen displays the current file size as data is captured.
- Page 279 Capture App Slice Size: Touch this field to select a specific frame slice size or enter a custom value. The Slice Size setting limits how much of each packet is captured. A smaller slice size is useful when you are interested in the packet’s header but do not need to see all the payload data.
- Page 280 Capture App Port: Specify a port number to capture only traffic from that UDP or TCP port. For example, select port 80 to capture HTTP traffic only. NOT: Touch the toggle to enable this setting, which directs the EtherScope NOT to capture the values you have entered in the filters above.
- Page 281 Capture App default. Tap the toggle button for each frame type to disable its capture. Back to Title and Contents...
-
Page 282: Running And Viewing Captures
Capture App Running and Viewing Captures To start Capturing, tap START at the top of the app screen. The current Status of the capture and any applied filters are shown under the capture type (Wired or Wi-Fi). The image above indicates that the app will only capture traffic for IP 10.200.72.19. - Page 283 Capture App The Wired graph plots the type and number of packets being captured during the time the capture is running. By default, wired captures include Unicast, Broadcast, and Multicast packet types. Like other time-based graphs on the EtherScope, you can swipe left and right on the Captured Packets/sec graph to move backward and forward in time.
- Page 284 Capture App Wi-Fi captures graph the Management, Control, and Data Frame Types. In this image, the app is capturing all three Wi- Fi Frame Types on channel 6 with the BSSID shown. The Total measurements in the table below the graph represent all frames seen,...
- Page 285 Capture App while the Captured frames are those that fall within the filter parameters. Once a capture is completed, the Save Capture dialog appears automatically. Tap the Save icon to reopen this dialog.
- Page 286 Capture App Captures are saved as .pcap files. Touch any of the fields in the dialog to enter changes. File Name: Capture files are automatically named using the date and time. Touch this field to enter a custom name. Save to: By default, capture files are saved in the Downloads folder in the EtherScope file system, but you can also save them to a Micro SD card or USB storage device or chose a...
-
Page 287: Discovery App
Back to Title and Contents EtherScope nXG User Guide Discovery The EtherScope nXG Discovery application creates an inventory of the devices on your networks along with their attributes: device types, names, addresses, interfaces, VLANs, resources, and other connected or associated devices. The app allows you to... - Page 288 Discovery App Discovery Chapter Contents This chapter describes how the Discovery process and app screens work, shows examples of Discovery data, and details the Discovery settings. Introduction to Discovery Using the Main Discovery List Screen Discovery Details Screens Device Types Discovery Settings Problem Settings...
-
Page 289: Introduction To Discovery
Discovery App Introduction to Discovery Discovery finds, classifies, and displays— through Ethernet, fiber, and Wi-Fi—the details of network components. Information provided by Discovery can include the following: IP, BSSID, and MAC addresses Device Names Device Connectivity SNMP Data Network Problems Interface Details and Statistics Devices are discovered via ARP and Ping sweeps;... - Page 290 Discovery App scanning notification at the top of the screen indicates that the EtherScope is scanning Wi-Fi channels to discover devices on the wireless network. Once a wired network connection (test or management) is available, wired discovery begins. The Discovery app consistently monitors network traffic, but the device discovery process reruns every 90 minutes by default.
-
Page 291: Using The Main Discovery List Screen
Discovery App Using the Main Discovery List Screen The main Discovery screen lists all the devices the EtherScope has discovered. - Page 292 Discovery App Like in AutoTest and other EtherScope screens, the icons in Discovery change color to indicate Warning Failure condition. Discovery also displays device icons in Blue to indicate...
- Page 293 Discovery App Problem-related information that does not constitute a warning or failure, and Green indicate that a previous Problem has been resolved. (See the Problem Settings to adjust enabled Problems and thresholds.) From the main Discovery screen, you can filter and sort the listed devices, open the left side navigation drawer to configure settings, and touch a device's card to view its details.
- Page 294 Discovery App The information displayed on each device card varies depending on the selected Sort element...
-
Page 295: Filtering The Discovery List
Discovery App and the data the EtherScope was able to discover. The lower left field displays the characteristic by which the Discovery list is currently sorted. In the image above, the list is sorted by MAC address. See Discovery Sorts in this topic for more about sorting. - Page 296 Discovery App The Filters screen displays the number of devices or domains discovered for each category. Touch a category name to select filters by checking the boxes. The main Discovery screen will show only those devices or IDs that fall under your chosen filter parameters.
- Page 297 Discovery App × Tap the button to the right of each filter to clear it. Touch the clear filter icon at the top right to clear all filters. Once you have selected a filter, the Filters screen is also filtered for that characteristic. For example, in the image above, the user has selected the "Network Tools"...
- Page 298 Discovery App result, only those subnets, addresses, Wi-Fi bands, etc. with a discovered Network Tool remain selectable in the filters list. Back on the main Discovery screen, the screen title shows the number of filtered devices out of the total discovered devices (in the image above, 152 filtered devices out of 1308 total).
-
Page 299: Sorting The Discovery List
Discovery App Sorting the Discovery List Tap the Sort bar or down arrow to open the Sort drop-down menu. Select a Sort option to order the devices based on your selected characteristic. - Page 300 Discovery App The selected Sort option displays in the Sort bar above the device list, and the sort char- acteristic for each device is shown under the device type icon. In the image above, all the devices associated with the "NSVisitor" SSID are sorted together.
-
Page 301: Refreshing Discovery
Discovery App devices within the groups but does not change the order of the groups. Refreshing Discovery Touch the action overflow icon at the top right of the main Discovery screen, and select Refresh Discovery to refresh the Discovery process for both the Discovery and Wi-Fi apps. REFRESH DISCOVERY restarts the discovery process without clearing the already discovered devices. -
Page 302: Uploading Discovery Results To Link-Live
Discovery App Uploading Discovery Results to Link-Live Touch the action overflow icon at the top right of the main Discovery screen, and select Upload to Link-Live to send the current Discovery results to the Analysis page Link-Live.com. - Page 303 Discovery App See the Link-Live chapter for more information. Back to Title and Contents...
-
Page 304: Discovery Details Screens
Discovery App Discovery Details Screens Tap any of the device cards on the main Discovery list screen to view Device Details. The example below calls out a Router card and its Details screen. The available data and actions on the Details screens vary significantly depending on the device type, connections, and data the EtherScope was able to discover. - Page 305 Discovery App For the Switch screen shown above, Discovery was able to find an IP address but not a name for the switch.
-
Page 306: Top Details Card
Discovery App Each Details screen shows additional information about the selected device, any Problems detected by the EtherScope, and counts for other connected or corresponding network elements. Device Types for specifics about the different devices the EtherScope can discover. Top Details Card The top card on the Details screen summarizes the discovered data for the selected device. - Page 307 Discovery App The top of the card shows the device type and icon (a Wi-Fi Controller with a Failure or Error status in the example image above). The rest of the fields that appear on the top Details screen card depend on the device type and what the EtherScope can discover about the device.
- Page 308 Discovery App The linked and underlined Cisco MAC address in the screen image above opens the Wi-Fi app's AP Details screen, where you can view the other wireless attributes associated with the Lightweight AP. The Nearest Switch and Wi-Fi Controller links open a Discovery app Details screen for those devices.
- Page 309 Discovery App Data Fields on the Top Details Card The following fields may appear on the top card on a Device Details screen, depending on the device type and the information EtherScope was able to discover: Name: Discovered hostname(s) of the device. This section can display DNS, mDNS, SNMP, NetBIOS, AP, and Virtual Machine names if available.
- Page 310 Discovery App VLAN ID: ID of the VLAN the device is on Protocols: Routing protocols, discovered via packet analysis, operating on the device or network Services: Network services provided by this device, such as DHCP or DNS Attributes: Other discovered attributes about the device Wi-Fi Controller: Name and address of the Wi-Fi Controller for a Lightweight AP...
- Page 311 Discovery App Last Seen: Time at which EtherScope most recently detected the device Back to Title and Contents...
-
Page 312: Lower Cards In Device Details
Discovery App Lower Cards in Device Details Tap any of the lower cards on a Device Details screen to view more discovered characteristics and "drill down" to specific Problems, Addresses, Interfaces, etc. for the selected device. Screens with a list, such as Addresses shown below, also offer Sort options. - Page 313 Discovery App The rest of this topic provides examples of each type of Details screen and options for additional analysis. Remember, you can touch any card with a right pointing arrow to open a new screen with more information about the device or char- acteristic.
-
Page 314: Problems
Discovery App Problems The Problems card shows the icon color of the highest severity problem, and the number of detected Warning, Failure or Error, Information, and Resolved conditions for the device or network component. Tap the Problems card to view the Problems list screen (unless only 1 Problem is detected, in which case, the detailed Problem description opens, skipping the list screen). -
Page 315: Addresses
Discovery App Tap the sort field to sort the list by Severity or by the time when the problem was First Detected. On the Problems list screen, touch a Problem's row to read a detailed description. Touch the action overflow button at the top right of the Problem list or description screen to Clear Problems. -
Page 316: Interfaces
Discovery App The Addresses card displays the number of each type of address discovered: IPv4, IPv6, MAC, and/or BSSID. Tap to view the addresses and related information. From the Addresses list screen, you can sort the list order and tap any of the discovered addresses to investigate the address further. - Page 317 Discovery App The Interfaces card shows the number of Up and Down interfaces and the total number of Interfaces to the right. Tap the card to view the list of Interfaces. Like other Discovery list screens, the Interfaces list provides a number of Sort options, and the selected sort option affects the type of information displayed.
- Page 318 Discovery App image below shows Interfaces sorted by MAC Address, so each Interface's MAC address is displayed. Touching an Interface row opens a new Discovery Details screen for the selected Interface.
- Page 319 Discovery App The Interface Details screen contains a description of the interface and information about its Status, Connected Device and Port, and Address. MTU: Maximum Transmission Unit, the maximum packet frame size configured on the interface port...
- Page 320 Discovery App From this screen, you can touch the lower cards to review any discovery VLANS and Devices for the Interface as well as graphs of the Interface Statistics. The Statistics screen displays real time Utilization, Packet Discards, Packet Errors, and...
- Page 321 Discovery App a pie chart breakdown of Packet transfers to and from the Interface.
-
Page 322: Snmp
Discovery App SNMP This card shows device details gathered via SNMP and SNMP connectivity to the device. The SNMP card displays the SNMP Uptime. Touch the card for SNMP Details. - Page 323 Discovery App SNMP System Group: These data fields are gathered from the system group and other key device version information. SNMP: SNMP versions the device supports, Engine ID (for v3), and how the EtherScope is currently communicating with the device,...
-
Page 324: Connected Devices
Discovery App along with credentials, including the Community String in use Connected Devices The Connected Devices card appears on the Details screen for Unknown Switches. While the EtherScope may be unable to directly identify the connected switch, the devices connected to it provide clues about where the switch is operating. -
Page 325: Resources
Discovery App Resources The Resources card shows the percentages of CPU, memory, and storage usage on the device. This information is gathered via SNMP. Touch the card to view current and maximum resource utilization measurements. -
Page 326: Vlans
Discovery App By default, EtherScope displays a Warning condition if CPU, Memory, or Storage utilization is above 90%. You can adjust problem detection and thresholds in the Wired Problem Settings accessed from the Discovery navigation drawer. VLANS The VLANs card displays the VLAN IDs this device is using or for which it is configured. -
Page 327: Ssids
Discovery App The VLANs Details screen also shows the description with each VLAN ID. SSIDs The SSIDs card appears in the Details for Wi-Fi Controllers. This information is gathered via SNMP. - Page 328 Discovery App This card shows the number of SSIDs gathered from SNMP. Tap the card to view the list of SSIDs. On the SSIDs screen, each SSID is shown with its Security type(s) and any VLANs. SSIDs with a checkmark to the left are enabled, and those ×...
-
Page 329: Using The Discovery Fab
Discovery App Using the Discovery FAB The Floating Action Button (FAB) on Device Details screens offers additional actions depending on the device type and connection available. Opening other apps, such as Path Analysis, Ping/TCP, or Capture, from a Discovery Details screen will auto-populate the app you open with the address and other device characteristics. - Page 330 Discovery App screen below has multiple IPv4 and MAC addresses (which can be viewed by touching the Addresses card).
- Page 331 Discovery App When a user opens the FAB and selects a different app, such as Path Analysis, only the address and name listed at the top will be populated in the Path Analysis app.
- Page 332 Discovery App To open another screen or app with a different address, the user can touch the Addresses card, and select another address to view its Details screen. Back to Title and Contents...
-
Page 333: Device Types
Discovery App Device Types The Discovery app lists and analyzes the types of devices explained in this section. Different data may be available to the EtherScope depending on the device type, how it was discovered, and your configured settings. Discovery Settings SNMP Configuration Devices Discovered Through Other Devices options. -
Page 334: Switches
Discovery App Switches Switches are also discovered by monitoring traffic and querying hosts. -
Page 335: Unknown Switches
Discovery App Unknown Switches Unknown switches are detected indirectly based on analysis of the traffic going through surrounding switches. Though the EtherScope... - Page 336 Discovery App cannot identify the switch itself, it can sense where a switch is active on the network via the device MAC addresses in that space. Unknown Switches are numbered by the EtherScope as they are discovered. These numbers may change the next time the discovery process runs.
-
Page 337: Network Servers
Discovery App Network Servers Network servers include NetBIOS, DHCP, and DNS servers. -
Page 338: Hypervisors
Discovery App Hypervisors VMware hypervisors are discovered via SNMP. The hypervisor's SNMP agent must be enabled for the EtherScope to discover it and classify it as a hypervisor. -
Page 339: Virtual Machines
Discovery App Virtual Machines VMware virtual machines are discovered by examining the VMware client table in VMware hypervisors that are SNMP enabled. Devices are also classified as Virtual Machines if they have a VMware MAC. -
Page 340: Wi-Fi Controllers
Discovery App Wi-Fi Controllers EtherScope can discover SNMP enabled Wi-Fi controllers, including Cisco and Aruba Wi-Fi Controllers. -
Page 341: Access Points (Aps)
Discovery App Access Points (APs) The EtherScope discovers APs through wireless packet analysis and SNMP queries via the wired side of the network. -
Page 342: Wi-Fi Clients
Discovery App See also APs in the Wi-Fi analysis app. Wi-Fi Clients Wireless clients are discovered through wireless packet analysis and SNMP queries via the wired side of the network. -
Page 343: Voip Phones
Discovery App See also Clients in the Wi-Fi analysis app. VoIP Phones VoIP discovery provides visibility into the VoIP and layer 2/3 configuration of the network. -
Page 344: Printers
Discovery App Printers The EtherScope identifies IP printers via the SNMP Printer MIB and IPX printers via diagnostic requests and queries. -
Page 345: Snmp Agents
Discovery App SNMP Agents SNMP agents are discovered using SNMP queries. See SNMP Configuration. -
Page 346: Netally Tools
SNMP agents on your devices, they may be connected to another subnet, like a man- agement subnet. Solve this issue by adding the subnet to Extended Ranges. See also SNMP Details. NetAlly Tools The EtherScope can also identify other NetAlly network testers, including EtherScope nXGs,... - Page 347 Discovery App AirCheck G2s, OneTouches, LinkRunners (AT and G2), and Test Accessories. The image below shows several NetAlly tools as they appear in the main Discovery list. EtherScope displays all the information it can gather about each tool on the Details screen.
-
Page 348: Hosts/Clients
Discovery App Hosts/Clients Other hosts and clients are discovered by traffic monitoring and querying. If a host cannot be identified as belonging to one of the other categories (Switch, Router, VoIP device, etc.) then it is categorized as Host/Client. - Page 349 Discovery App Back to Title and Contents...
-
Page 350: Discovery Settings
Discovery App Discovery Settings Discovery configurations include SNMP settings, Community Strings and the order in which they are used, Credential Sets, Ports, Extended Ranges, and process intervals. Access the Discovery settings screen by sliding out the left-side navigation drawer or tapping the menu icon , and selecting Discovery Settings. - Page 351 Discovery App To adjust Discovery Settings, follow these steps: 1. On the Discovery Settings screen, touch each field described in this topic, as needed, to select or enter your required configuration elements.
- Page 352 Discovery App 2. When you finish configuring, tap the back button to return to the main Discovery List screen. 3. Then, Refresh Discovery from the action overflow menu to apply the new con- figuration. You can save configured Discovery settings by touching the save button on this screen.
-
Page 353: Snmp Configuration
Discovery App SNMP Configuration The MIB (Management Information Base) of SNMP managed devices contains information such as device configuration, interface con- figuration and statistics, SNMP tables (like host resource and route tables) and VLAN details. Through the Discovery process, the EtherScope interrogates MIBs to determine the device type, ports, connected subnets, and other data. - Page 354 Discovery App EtherScope uses to communicate with those devices. SNMPv1/v2 Touch the toggle button to enable or disable SNMPv1 and v2 queries. This setting is enabled by default and uses the Community Strings configured in the next setting. Community Strings Touch this field to open the Community String screen and add, edit, or remove community strings.
- Page 355 Discovery App The EtherScope uses the checked strings in the order shown on this screen. If it does not receive a response from the queried device using one string, it sends the next string. NOTE: This screen and others in the Discovery settings operate much like the AutoTest Profile Group screen.
- Page 356 Discovery App On the Community Strings screen, you can perform these actions: Check or uncheck the boxes to include or exclude a string from use in the current Discovery configuration. Tap the up and down arrows change the order in which the EtherScope uses the strings to query a device.
- Page 357 Discovery App can also arrange the community strings in the order they are used most. SNMPv3 Touch the toggle button to enable or disable SNMPv3 queries. This setting is enabled by default and uses the Credentials configured in the next setting. NOTE: If this setting is enabled, but no SNMPv3 credentials are configured, the EtherScope will discover the engine IDs of...
- Page 358 Discovery App This screen interface works like the Community Strings screen above. EtherScope uses the Credentials in the order shown. Check or uncheck the boxes to include or exclude a set of Credentials from use in the current Discovery configuration. Touch a row to edit its credentials.
- Page 359 Discovery App Touch the FAB to add new credentials. On the Credentials Sets screen, tap each field to select or enter the credentials required. Name Touch the Name field to enter a custom name for the Credential Set.
- Page 360 Discovery App Username Touch to enter the SNMPv3 username. Authorization Type and Password EtherScope Discovery supports two SNMPv3 Authorization types: HMAC-SHA and HMAC- MD5. If Authorization is required, enter the appropriate password. Privacy Type and Password EtherScope Discovery supports four Privacy Types: CBC-DES, AES-128, AES-192, AND AES- 256.
-
Page 361: Active Discovery Ports
Discovery App Active Discovery Ports Touch Active Discovery Ports to select the port Discovery uses to gather data. Discovery only runs through the enabled ports if an active network link is available. -
Page 362: Extended Ranges
Discovery App Discovery uses all of the ports by default. Uncheck them to limit which ports are used. NOTE: The top two Wired and Wi-Fi Ports refer to the Test ports. An AutoTest Wired Wi-Fi Profile must run to establish test port links. - Page 363 Discovery App you want the Discovery process to run. Discovery sweeps all of the enabled Extended Ranges for devices, whether directly connected or off-net. The EtherScope performs Ping sweeps on subnets that are not directly connected and ARP sweeps on connected subnets.
- Page 364 Discovery App Check or uncheck the boxes to include or exclude an extended range from the current Discovery configuration. Unchecked Extended Ranges do not affect the default Discovery behavior in the current con- figuration, but they may be used in other Discovery configurations (like Community Strings and Credentials).
- Page 365 Discovery App Touch any Extended Range's row to edit its address and subnet. Touch the FAB to add new extended ranges. Active vs. Restricted Subnets For each configured Extended Range, you can tap the toggle button to switch from Active to Restricted.
- Page 366 Discovery App Restricted Ranges take precedence regard- less of the order in which they are listed on the Extended Ranges screen. You can Restrict a part of a configured Active Extended Range. You can also restrict a single device, whether it is part of an Active Range or not. To enter a single device that you do not want discovered, enter its IP address in the Address field, and set the Subnet Mask field...
-
Page 367: Devices Discovered Through Other Devices
Discovery App Tap the drop-down menu to select a previously Discovered Subnet. The Address field will be automatically populated with your selection. Subnet Mask Touch this field to select a subnet mask. If you select an already Discovered Subnet, the Subnet Mask is also pre-populated. - Page 368 Discovery App from SNMP tables of the device types listed here, you can uncheck their boxes. Routers and Subnets When the Routers and Subnets checkbox is enabled, any discovered routers are included in discovery results. In addition, if Discovery has SNMP access to a discovered router, its routing tables are read, and the next hop routers are added to the Discovery list.
- Page 369 Discovery App also added to the Subnets list. This process continues until all the available SNMP credentials are tried for the added routers. NOTES: Discovery does not sweep every dis- covered subnet; discovered subnets are only added to the subnets list. To perform discovery in a specific subnet, see Extended Ranges above.
- Page 370 Discovery App For example, when EtherScope is reading the CDP and LLDP caches of one switch, it will contain other switches. If this option is enabled, the EtherScope adds those other switches, even if they are not in discovery ranges. NOTE: To Discover switches at another site, add one of the switches of that site to Discovery Extended Ranges.
- Page 371 Discovery App Switches provides best chance of finding all Wi- Fi clients. NOTES: Enabling Wi-Fi Clients here may cause wi-fi devices to show in Discovery that do not appear in the Wi-Fi analysis app because Wi-Fi analysis only shows what it detects on wirelessly transmitted packets.
- Page 372 Discovery App Refresh Interval This setting controls the time between runs of the Discovery process. By default, Discovery runs every 90 minutes. Touch the Refresh Interval field to select a different interval, up to 8 hours.
-
Page 373: Device Health Interval
Discovery App The Manual option turns off regular automatic Discovery, and the process will only refresh if you select Refresh Discovery from the main Discovery list screen. Device Health Interval Discovery automatically runs a set of network health tests to search for network Problems,... - Page 374 Discovery App such as high utilization, discards, or errors on all discovered interfaces and device resources. The selected time Refresh Interval is the minimum time between each run of the Device Health tests. Touch the field to disable Device Health testing or to change the interval from the default of 10 minutes to 30 or 60 minutes.
- Page 375 Discovery App ARP Sweep Rate Touch the ARP Sweep Rate field to select a rate between 5 and 100 ARP requests per second. This setting can prevent the EtherScope from shutting down ports that sense too many ARPs are being sent.
- Page 376 Discovery App SNMP Query Delay This function controls how long your EtherScope waits between SNMP queries to key tables that can cause CPU spikes in the SNMP agents, including the ARP cache, IP address table, routing tables, and FDB tables. The default SNMP Query delay is No Delay.
-
Page 377: Problem Settings
Discovery App Problem Settings The Problem settings determine which issues are detected and displayed by both the Discovery and Wi-Fi Analysis apps as well as the thresholds for enabled problems, such as Packet Discards and Utilization. Access the Problem Settings screen by sliding out the left-side navigation drawer or tapping the menu icon in the Discovery app, and... - Page 378 Discovery App Problems are categorized as Wired or Wi-Fi. NOTE: The Wi-Fi Problems configured here also control the Problems detected and displayed in the Wi-Fi Analysis app. As with Discovery Settings, you can save configured Problem Settings by touching the save button on this screen.
- Page 379 Discovery App Problems are categorized as Wired or Wi-Fi. Tap the row for each to enable or disable the problem types and set thresholds where applicable.
- Page 380 Discovery App All Problem types are enabled by default. Tap the toggle button to the right to disable each one. Touch the red , yellow , or blue information icons to the right of each Problem to read a detailed description and recommended actions.
-
Page 381: Wi-Fi Analysis App
Back to Title and Contents EtherScope nXG User Guide Wi-Fi Analysis The Wi-Fi Analysis app scans the wireless channels in your environment to discover and gather data about the devices and traffic on your Wi-Fi networks. Wi-Fi discovery begins when you power on the EtherScope, and measurements update with each channel scan cycle. - Page 382 Wi-Fi Analysis App The Wi-Fi app features separate screens that list and display characteristics of the different devices and elements of your wireless environment. Tap a link below to go directly to the description of the screen listed: Channels Map Utilization Overlap –...
-
Page 383: Wi-Fi Analysis And Discovery
Wi-Fi Analysis App Wi-Fi Analysis and Discovery Wi-Fi Analysis utilizes the Wi-Fi Test Port scan the channels and acquire information about your wireless networks. If the Wi-Fi Test Port is linked (for instance after running a Wi-Fi AutoTest Profile), the port unlinks and resumes scanning when you open the Wi-Fi Analysis app. -
Page 384: Using The Wi-Fi App Screens
Wi-Fi Analysis App Using the Wi-Fi App Screens To switch between the different Wi-Fi app screens, tap the menu icon (or swipe right) to open the left-side navigation drawer. -
Page 385: Wi-Fi App List Screens
Wi-Fi Analysis App The Wi-Fi app's navigation drawer displays a real-time count (in parentheses) of each wireless component EtherScope has detected. Tap an option to open the corresponding screen. NOTE: The General Settings for Wi-Fi control which channels and bands are scanned to populate the Wi-Fi screens. - Page 386 Wi-Fi Analysis App Like in AutoTest and other EtherScope screens, the icons in Wi-Fi analysis change color to indicate a Warning Failure condition. The app also displays icons in Blue to indicate Problem-related information that does not constitute a warning or failure, and Green indicate that a previous Problem has been resolved.
- Page 387 Wi-Fi Analysis App side navigation drawer. Problem Settings in the Discovery app are also applied to the Wi-Fi Analysis app. The information displayed on each card varies depending on the selected Sort characteristic and the data the EtherScope was able to discover.
-
Page 388: Filtering In The Wi-Fi App
Wi-Fi Analysis App Filtering in the Wi-Fi App Each Wi-Fi Analysis screen has different Filter options that are appropriate for the network component type you are analyzing. Touch the filter button near the top left of the Wi-Fi screens to set filters that control which network components are displayed. - Page 389 Wi-Fi Analysis App characteristics detected (for example, number of active Channels or detected Security types). Touch a category to select filters by tapping the checkboxes or radio buttons. Under each category, the number of discovered APs is shown for each characteristic. (In the image above, there are 3 Security types detected and 9 APs using the WPA2-P Security type.)
- Page 390 Wi-Fi Analysis App When filters are selected, those active filters are displayed at the top of the Filters screen. × Tap the button to the right of each filter to clear it. Touch the clear filter icon at the top right to clear all filters.
- Page 391 Wi-Fi Analysis App If the screen is a list, like the APs screen below, the screen title shows the number of filtered devices out of the total discovered devices (5 filtered devices out of 16 total).
-
Page 392: Sorting In The Wi-Fi App
Wi-Fi Analysis App Sorting in the Wi-Fi App Tap the Sort bar or down arrow to open the Sort drop-down menu. The APs screen Sort options are shown below as an example. Select a Sort option to order the list based on your selected characteristic. - Page 393 Wi-Fi Analysis App The selected Sort option displays in the Sort bar above the list, and the sort characteristic for each item is shown under the type icon and name. In the image above, the discovered APs are sorted by SSID Count, which is shown below each AP icon.
- Page 394 Wi-Fi Analysis App reverses the devices within the groups but does not change the order of the groups. Refreshing Discovery Touch the action overflow icon at the top right of the screen, and select Refresh Discovery to refresh the Discovery process for both the Wi-Fi and Discovery apps.
-
Page 395: Uploading Wi-Fi Results To Link-Live
Wi-Fi Analysis App Uploading Wi-Fi Results to Link- Live Touch the action overflow icon at the top right of the main Wi-Fi app screen, and select Upload to Link-Live to send the current Wi-Fi results to the Analysis page on Link- Live.com. - Page 396 Wi-Fi Analysis App See the Link-Live chapter for more information. Back to Title and Contents...
-
Page 397: Wi-Fi Details Screens
Wi-Fi Analysis App Wi-Fi Details Screens Tapping any card on a list screen (Channels, SSIDs, APs, BSSIDs, Clients, and Interferers) opens the Details screen for that device or network ID. The example below calls out a Client card and its Details screen. On the Wi-Fi Details screens, you can touch any blue linked name or address to open a... - Page 398 Wi-Fi Analysis App NOTE: Non-underlined links open in the same app (in this case Wi-Fi), and under- lined links open in a different app (in this case Discovery). Each Details screen shows additional information about the selected item, any Problems detected by the EtherScope, and counts for other connected network devices or IDs.
- Page 399 Wi-Fi Analysis App The Channel Details screen above shows how many SSIDs, APs, BSSIDs, Clients, and Interferers are detected on Channel 64. Touch the lower cards in Wi-Fi Details to open a list...
-
Page 400: Wi-Fi Problems Screen
Wi-Fi Analysis App screen that is filtered for the network component you are examining. If the user selects BSSIDs on the Details screen for Channel 64, the BSSIDs screen opens and filters for BSSIDs found on Channel 64 only. See the topics for each Wi-Fi app screen type (SSIDs, APs, etc.) for more discussion of the cor- responding Details screen. - Page 401 Wi-Fi Analysis App The Problems card shows the icon color of the highest severity problem, and the number of detected Warning , Failure, Information, and Resolved conditions for the device or network component. Touch the card to open the Problems screen.
-
Page 402: Rf And Traffic Statistics Overview
Wi-Fi Analysis App On the Problems list screen, touch a Problem's row to read a detailed description. You can also tap the sort field to sort the list by Severity or by the time when the problem was First Detected. Touch the action overflow button at the top right to Clear Problems. - Page 403 Wi-Fi Analysis App This section describes the common elements of the RF and Traffic Statistics screen. See the topic for each type of Details screen for differences. The RF and Traffic Statistics card shows the Channel number or the Signal strength of the strongest AP on the channel and the channel's Utilization percentage.
- Page 404 Wi-Fi Analysis App Strongest AP: The AP on the channel with the strongest signal The graphs update in real time. You can touch and drag (or swipe) left and right on each graph...
- Page 405 Wi-Fi Analysis App to move backward and forward in time and view the recorded measurements. The graphs save and display data for up to 24 hours in the past. Under each graph, a legend table displays the Current, Minimum, Maximum, and Average measurements.
- Page 406 Wi-Fi Analysis App Utilization (%) graph: Plots percentage of the channel capacity being used by 802.11 devices and by non-802.11 interference Retries (% of packets) graph: Plots percentage of transmitted packets that are retry packets Retry Rate % - The AP's signal strength in Retry Pkts - The number of retry packets Total Pkts - The total number of trans- mitted packets...
-
Page 407: Channels Map
Wi-Fi Analysis App Channels Map The Channels Map screens provide graphical rep- resentations of channel utilization, AP coverage, and overlap. The Channels Map features two tabs: Utilization and Overlap. Touch the tab names to switch between the two screen types. -
Page 408: Channels Utilization
Wi-Fi Analysis App Channels Utilization The Channels Utilization screen displays a bar graph of 802.11 and Non-802.11 utilization, retry percentage, and the number of APs and clients for each channel. - Page 409 Wi-Fi Analysis App The vertical light and dark blue bars show how much of the channel's capacity is being used by 802.11 devices and non-802.11 interference, with channel numbers on the x-axis and Utilization percentage on the y-axis. APs are shown on their primary channel. Channels that do not have APs can still show 802.11 utilization because of overlap from adjacent channels.
- Page 410 Wi-Fi Analysis App From the Channel Details screen, you can examine the addresses and devices operating on the channel and perform a deeper analysis. Channel Details for more about this screen.
-
Page 411: Channels Overlap
Wi-Fi Analysis App Channels Overlap The Channels Overlap screen provides a visu- alization of access point deployment with respect to channel, coverage, and overlap, allowing you to spot potential coverage issues. Each discovered AP is shown as a colored trapezoid and plotted on the graph based on its channel coverage (on the x-axis) and signal strength in dBm (on the y-axis). - Page 412 Wi-Fi Analysis App Touch an AP on the graph to select it and its primary channel. In the image above, the AP named "Zyxel:5c6a..." on channel 7 is selected.
- Page 413 Wi-Fi Analysis App Touch the blue channel range selectors at the bottom to view a different channel range on the graph.
- Page 414 Wi-Fi Analysis App Touch the action overflow button open the AP Details Channel Details screens for the selected AP or Channel. Filtering in the Wi-Fi App for an explanation of the Overlap screen's filtering options.
-
Page 415: Channels
Wi-Fi Analysis App Channels The Channels list screen displays the char- acteristics of the wireless Channels as they are scanned in your location. Refer to Using the Wi-Fi App Screens if needed. - Page 416 Wi-Fi Analysis App By default, Channels are ordered by channel number, and each card shows the channel frequency, number of APs, and total Utilization percent. Touch a Channel card to open the Channel Details screen.
-
Page 417: Channel Details
Wi-Fi Analysis App Channel Details The Channel Details screen displays the channel's Center Frequency under the icon,... - Page 418 Wi-Fi Analysis App along with the Frequency Range, Width, and Band. Dynamic Frequency Selection (DFS) channels also display an Attributes field that indicates DFS. Channel RF and Traffic Statistics The RF and Traffic Statistics card appears when there is an active AP and Utilization on the channel.
-
Page 419: Ssids
Wi-Fi Analysis App SSIDs The SSIDs list screen shows all the network SSIDs the EtherScope has discovered. Refer to Using the Wi-Fi App Screens if needed. - Page 420 Wi-Fi Analysis App By default, SSIDs are ordered by Signal strength, and each card shows the network security status and number of APs on the network. The security status icons have the following meanings: Green closed lock: All APs on the network use secure protocols, like WPA2 or WPA3.
-
Page 421: Ssid Details
Wi-Fi Analysis App SSID Details In addition to the Signal and Security Type, the SSID Details displays the AP on the network with the strongest signal, 802.11 Types that the... - Page 422 Wi-Fi Analysis App APs in the network support, and the time the EtherScope last detected activity on the network (Last Seen). EtherScope nXG can detect and display 802.11 types a/b/g/n/ac/ax. SSID FAB Tap the on the SSID Details screen to Connect to the network.
- Page 423 Wi-Fi Analysis App Creating a Wi-Fi Profile from the Wi-Fi Analysis App in the AutoTest chapter for a more detailed description of this process. Back to Title and Contents...
-
Page 424: Aps
Wi-Fi Analysis App The APs list screen displays all the Access Points discovered operating on your wireless networks. - Page 425 Wi-Fi Analysis App Use the Filter and Sort functions to determine which APs are shown and their order in the list. Refer to Using the Wi-Fi App Screens if needed. By default, APs are ordered by Signal strength, and each card shows the Signal strength in dBm and the AP's manufacturer prefix.
-
Page 426: Ap Details
Wi-Fi Analysis App AP Details The AP Details screen shows the 802.11 Types the AP supports, the AP's Security Type, and... - Page 427 Wi-Fi Analysis App the time the AP was last detected (Last Seen) by the EtherScope. Touch the lower cards to view the network IDs, Channels, and Clients associated with the AP. Wi-Fi Problems for more information about the Problems card. Back to Title and Contents...
-
Page 428: Bssids
Wi-Fi Analysis App BSSIDs The BSSIDs list screen shows the BSSID addresses discovered in your wireless environment. Refer to Using the Wi-Fi App Screens if needed. - Page 429 Wi-Fi Analysis App By default, the BSSIDs are ordered by Signal strength, and each card shows the Signal strength, SSID, and channel number on which the BSSID is operating. Touch an BSSID's card to open the Details screen.
-
Page 430: Bssid Details
Wi-Fi Analysis App BSSID Details In addition to the characteristics on the BSSID cards, the Details screen displays supported 802.11 Types, a Signal-to-Noise ratio (SNR) - Page 431 Wi-Fi Analysis App measurement, the active Security Type, and the time activity was Last Seen on the BSSID. BSSID Details can also include Rates and Cap- abilities and RF and Traffic Statistics. Rates and Capabilities Touch the Rates and Capabilities card to open the Details screen.
- Page 432 Wi-Fi Analysis App This screen shows advanced information about the transmit and receive rates and 802.11 cap- abilities reported by the beacon.
- Page 433 802.11ac capabilities are gathered from VHT capabilities in the beacon. 802.11ax capabilities are gathered from HE capabilities in the beacon. 802.11ax Rates and Capabilities EtherScope nXG can also report Advanced 802.11ax (Wi-Fi 6) capabilities it sees in the beacon.
- Page 434 Wi-Fi Analysis App BSSID RF and Traffic Statistics RF and Traffic Statistics Overview in the Wi- Fi Details Screens topic for an explanation of the common elements of this screen.
- Page 435 Wi-Fi Analysis App The RF and Traffic Statistics screen for BSSIDs displays the BSSID and the channel number at the top of the screen.
- Page 436 Wi-Fi Analysis App The Utilization graph shows separate meas- urements for Channel Utilization, BSSID Utilization, and Non-802.11 interference using different colors. The screen also displays separate graphs for Channel Retries and BSSID Retries.
- Page 437 Wi-Fi Analysis App BSSID FAB The FAB on the BSSID screen lets you Connect to the BSSID or record a packet Capture of the network traffic with the current BSSID on the connected channel. Touching Connect opens the AutoTest app and creates a new Wi-Fi profile called "Connect to...
- Page 438 Wi-Fi Analysis App Selecting Capture opens the Capture app populated with the Channel and BSSID. Back to Title and Contents...
-
Page 439: Clients
Wi-Fi Analysis App Clients The Clients list screen displays the wireless clients the EtherScope has discovered connected to your wireless networks. - Page 440 If a Client is probing, two dashes -- display where the SSID would appear. The Clients screen also show specific icons for NetAlly testers, like the EtherScope icon shown in the image above. Touch a Client's card to open the Details screen.
-
Page 441: Client Details
Wi-Fi Analysis App Client Details The top Client Details card for a connected Client displays the following information:... - Page 442 Wi-Fi Analysis App Client's MAC address Supported 802.11 media Types Signal-to-Noise ratio (SNR) measurement Name of the AP to which the Client is connected SSID of the network to which the Client is connected BSSID on which the Client is operating Security type of the network Time the Client was Last Seen by the Ether- Scope...
- Page 443 Wi-Fi Analysis App Client RF and Traffic Statistics RF and Traffic Statistics Overview in the Wi- Fi Details Screens topic for an explanation of the common elements of this screen. The RF and Traffic Statistics screen for Clients displays the Client's MAC or IP address and the channel number at the top of the screen.
- Page 444 Wi-Fi Analysis App The Utilization graph for Clients shows separate measurements for Channel (CH) Utilization and Client Utilization, using different colors. The breaks in the Client RF and Traffic graphs occur because the Client is not consistently...
- Page 445 Wi-Fi Analysis App transmitting, so there is no data for EtherScope to display during those times. The Clients RF and Traffic Statistics screen also displays a graph of Transfer (Tx) and Receive (Rx) Rates in Mbps, number of Tx Streams, and Tx Channel Width in MHz.
- Page 446 Wi-Fi Analysis App Clients FAB Tap the on the Client Details screen to open the Capture app and record a packet capture of traffic going to and from the client. When you open Capture from the Client Details FAB, the Capture app will be populated with the Channel number and MAC address of the client.
-
Page 447: Interferers
Wi-Fi Analysis App Interferers The Interferers screen displays devices detected by the EtherScope that may be interfering on your networks. By default, Interferers are ordered by the time they were most recently detected by the... - Page 448 Wi-Fi Analysis App EtherScope. Each card shows the Last Seen time, the device's Power measurement in dBm, the frequency band on which it was detected, and its Utilization. Refer to Using the Wi-Fi App Screens if needed. EtherScope can detect and display the following potential Interfering devices types: Baby Monitor Bluetooth...
-
Page 449: Interferer Details
Wi-Fi Analysis App Video camera Touch an Interferer card to open the Details screen. Interferer Details Power: The most recently observed power output from the device Utilization: The percentage of time, during the most recent sample, for which the interferer was detected Affected Channels: The bands and channels on which EtherScope detects the intefering device... - Page 450 Wi-Fi Analysis App Duration: Amount of time EtherScope detected the device and when it was first and last detected Event Count: Number of separate instances of detected transmission from the interferer Back to Title and Contents...
-
Page 451: Path Analysis App
EtherScope nXG User Guide Path Analysis Path Analysis traces the connection points, including intermediate routers and switches, between the EtherScope nXG and a destination URL or IP address. You can use Path Analysis to identify issues such as overloaded interfaces, overloaded device resources, and interface errors. -
Page 452: Introduction To Path Analysis
Path Analysis App Introduction to Path Analysis Path Analysis combines Layer 3 and Layer 2 measurements. The Layer 3 measurement combines the classic Layer 3 IP (UDP, ICMP, or TCP) traceroute measurement with a view of the path through the Layer 2 switches. The Layer 2 measurement discovers switches between the router hops by looking for the routers' MAC addresses in the switch... -
Page 453: Path Analysis Settings
Path Analysis App Path Analysis Settings The Path Analysis source device is always your EtherScope nXG. The default destination is www.google.com. Populating Path Analysis from Another App Like other EtherScope testing apps, when you open Path Analysis from another app, like... - Page 454 Path Analysis App On the Path Analysis Settings screen, touch each field as needed to configure your target: Device Name: Touch to enter the IP address or DNS name of the Path destination. The default is www.google.com. Interface: This setting determines the EtherScope port from which the test runs.
- Page 455 Path Analysis App EtherScope must have an active network link on the selected port to run a Path Analysis. If Any Port is selected, available links are used in the order shown in the Interface dialog above. Test and Management Ports for explan- ations of the different ports and how to link.
- Page 456 Path Analysis App enter the port number over which you want to run Path Analysis. You may need to enter a specific port number because routes can vary based on the port number and/or may be blocked by firewalls. Back to Title and Contents...
-
Page 457: Running Path Analysis
Path Analysis App Running Path Analysis Touch the START button at the top of the app screen to begin a Path Analysis. NOTE: EtherScope must be linked on the Interface (Port) selected in the app's settings. See Test and Management Ports help. - Page 458 Path Analysis App Like AutoTest, Path Analysis results are presented on cards. The top card shows the main test details, the second card shows information for the source device (your EtherScope nXG), and the following cards show...
-
Page 459: Path Analysis Results And Source Etherscope Cards
Path Analysis App the Layer 2 and Layer 3 Hops in the path, which are sequentially ordered. Touch any blue linked name or address in the Path Analysis results screens to open the Discovery Wi-Fi app and further examine the linked element. - Page 460 Path Analysis App Device Name: Resolved DNS name or IP address of the destination entered in the settings IP Address: IPv4 address of the target des- tination Interface: The Interface option selected in the settings Protocol: The Protocol selected in the settings (TCP, Ping, or Echo) TCP Port: The port number used for a TCP Connect Protocol.
- Page 461 Path Analysis App Source EtherScope Card The source This EtherScope card displays the port from which the Path Analysis ran. For Wired Test or Management port analyses (shown above), this card displays con- nection speed and duplex. For Wi-Fi port analyses, the card displays the SSID and channel number.
- Page 462 Path Analysis App The example image above shows the SSID, Channel, and other Wi-Fi information the EtherScope can display after running a Path Analysis over Wi-Fi. The image below shows the source EtherScope card from a Wired Path Analysis, which displays the link speed and duplex.
-
Page 463: Layer 3 Hops
Path Analysis App Beneath the EtherScope source card, the Hop cards show Layer 2 and Layer 3 devices determined to be in the Path. Layer 3 Hops Each Layer 3 Hop card displays the device type icon, DNS name (if discovered), and IP address. Beneath the name (or IP), the response times for each Connect (TCP), Ping (ICMP), or Echo (UDP/7) display in milliseconds. - Page 464 Path Analysis App Touch the card to view the hop Details screen. No Reply Sometimes Path Analysis displays Hop cards with "No Reply" (as shown below). This result means that the device in that portion of the path did not send an ICMP TTL timeout response.
- Page 465 Path Analysis App Split Route Path Analyses may obtain a "Split Route" result (as shown above), meaning that two or three...
- Page 466 Path Analysis App different routers within the same hop responded to the the three requests. Tap a Split Route card to view the DNS names and IP addresses of the responding routers. Layer 3 Interfaces and Statistics Statistics for Interfaces on Layer 3 devices may be identified and measured if the EtherScope has SNMP access.
- Page 467 Path Analysis App Touch a Hop card to see a summary of Interface Details and Statistics, if they are available. See also Layer 2 Switch Interfaces and Statistics below. Network Problems in Path Analysis The Hop cards can also show detected Problems based on the Problem Settings in the...
-
Page 468: Layer 2 Devices
Path Analysis App Tapping the blue linked switch name will open Discovery details screen for the switch, where the user can investigate the cause of the Warning. Layer 2 Devices Layer 2 devices can be switches or APs. Layer 2 Switches The image below displays an example of a Path Analysis to a device on the local broadcast domain with two switches in the Layer 2... - Page 469 Path Analysis App The EtherScope is able to identify these Layer 2 switches and their interfaces because it has configured SNMP access to the switches.
- Page 470 Path Analysis App The switch cards display the In and Out Interface IDs, VLAN ID, and the link speed and duplex (if detected) of the interfaces. Touching a Layer 2 card opens a Details screen for the device. A Layer 2 Details screen displays the device name and IP address at the top.
- Page 471 Path Analysis App NOTE: The yellow switch icon in the image above indicates a Warning status. See Network Problems in Path Analysis later in this topic. Layer 2 Switch Interfaces and Statistics Layer 2 Switch Details screens in Path Analysis display a summary of the Interface Statistics (described below).
- Page 472 Path Analysis App Errors: Percentage of packets containing errors Layer 2 APs If the Layer 2 path starts or ends with a Wi-Fi device, its AP is shown as a Layer 2 device in the path. A Layer 2 AP card indicates the connected network SSID, channel, and 802.11 type in use.
- Page 473 Path Analysis App No layer 2 devices discovered In some cases, the EtherScope does not discover Layer 2 devices between Layer 3 devices. There may not be any Layer 2 devices, or EtherScope might not have SNMP access to those switches. The Layer 2 card may also display a result of "No switches found,"...
-
Page 474: Uploading Path Analysis Results To Link-Live
Path Analysis App Discovery has not found any switches with SNMP access to determine if the switches are in the path. If this is an unexpected result, check and verify your SNMP Configuration Extended Ranges in the Discovery app settings. Uploading Path Analysis Results to Link-Live Touching the UPLOAD TO LINK-LIVE link on the... - Page 475 Path Analysis App Path Analysis results are uploaded to the Analysis page on Link-Live. Back to Title and Contents...
-
Page 476: Performance Test App
Back to Title and Contents EtherScope nXG User Guide Performance Test The EtherScope nXG's line rate Performance Test provides point-to-point performance testing of a traffic stream across wired IPv4 network infrastructure. This test quantifies network performance in terms of target rate, loss, latency, and jitter. - Page 477 Performance Test App The Performance Test runs from the Wired Test Port (top RJ-45 or Fiber port), and an AutoTest Wired Profile must connect successfully to establish link on the port. When you start up the EtherScope, the last Wired Profile in your saved AutoTest profiles runs automatically if an active Ethernet connection is detected on the top RJ-45 port.
-
Page 478: Introduction To Performance Testing
Separate upstream and downstream traffic meas- urements are not possible. The EtherScope nXG can act as the controlling Source for the performance test or as a Peer for a test conducted by different source device, such as another EtherScope nXG or a OneTouch AT 10G. - Page 479 LinkRunner AT and LinkRunner G2 each have a Reflector feature for exchanging Per- formance test traffic. (NetAlly.com/products/LinkRunner NetAlly's Network Performance Test (NPT) Reflector PC application can also act as the reflector for a Performance test. Download the NPT Reflector software from NetAlly.com/support/downloads.
-
Page 480: Performance Test Settings
Performance Test App Performance Test Settings The Performance app has both Performance settings that apply when the EtherScope is acting as the test source, and Peer settings that control the unit when it is acting as the test Peer. Access the settings by touching the settings button on the Performance Test screen or Performance Peer... -
Page 481: Saving Custom Performance Tests
EtherScope is the source. Peer Settings control the EtherScope Performance Peer when another device is the source. See Running EtherScope nXG as a Performance Peer. Saving Custom Performance Tests The Performance app allows you to save two... - Page 482 Performance Test App with different bandwidths. A user can also create multiple Services with different QoS priorities (using the Layer 3 options) to verify that loss does not occur over the higher priority stream. Saved Performance Tests and their Services work much like AutoTest Profile Groups, Profiles, and Test Targets.
- Page 483 Performance Test App In the example images here, the user has saved a custom Performance Test called "Ally Office Network." Once you save a Performance Test con- figuration, the custom name you entered appears at the top of the Performance Settings screen (above) and main Performance Test screen (below).
- Page 484 Performance Test App...
-
Page 485: Configuring The Source Etherscope Nxg
Performance Test App Configuring the Source EtherScope Open the Performance Settings screen from the main Performance results screen or the left- side navigation drawer Touch each field to enter or revise selections as needed. Changed settings are automatically applied. When you finish configuring, tap the back button to return to the Performance test screen. - Page 486 Performance Test App Services A Service is a configured traffic flow that simulates application traffic. You can run up to four unidirectional or bidirectional services sim- ultaneously to emulate and test the QoS levels on your network. The Services configurations include the Endpoints, Frame Size, Bandwidth, Thresholds, and Options the EtherScope uses to measure and grade performance.
- Page 487 Performance Test App On the Services screen, you can perform the following actions: Check or uncheck the boxes to include or exclude a Service from the currently active Performance Test.
- Page 488 Performance Test App NOTE: Only four services can be tested at once. If you select more than four services, the Performance Test will fail. Touch the action overflow icon Duplicate , Move Up/Down, or Delete a con- figured Service. CAUTION: When you delete a Service, you delete it from all Performance Test con- figurations.
- Page 489 Performance Test App Service Name Touch the Service Name field to enter a custom name for the endpoint and associated...
- Page 490 Address, Type, and Traffic Flow. IPv4 Address: Tap the field to enter the IPv4 address of your endpoint device. Communication UDP Port: If needed, touch to enter a different UDP Port number. The default NetAlly performance test port is 3842.
- Page 491 Performance Test App NOTE: The UDP port number entered here must match the port number used by your Peer endpoint device. Endpoint Type: Select Peer or Reflector depending on the type of endpoint you are using for the performance test. Traffic Flow: This setting only appears when Endpoint Type is set to Peer.
- Page 492 Performance Test App NOTE: If the Performance Test runs on a VLAN (configured in the Wired AutoTest Profile or the Performance Layer 2 options shown below), the frame sizes will be four bytes longer. You do not need to account for this frame size increase in the settings.
- Page 493 Performance Test App For a Peer with an Asymmetrical Traffic Flow configuration, you can select a different Upstream and Downstream Target Rate for each direction. Touch the Target Rate field(s) to select or enter a new rate. The default is 1 Mbps. Target Rate: The requested rate of round-trip traffic Upstream Target Rate: This is the requested...
- Page 494 Performance Test App NOTE: The 99.98 Mbps and similar values provided in the Target Rate options are meant to test the maximum, worst case throughput on an Ethernet link. Though greater rates are possible under perfect con- ditions, the limitation of 99.98% of the link rate results from asynchronous clocks in Ethernet.
- Page 495 Performance Test App direction. For a Peer with an Asymmetrical Traffic Flow configuration, you can select different Upstream and Downstream thresholds. Tap each Threshold field to select or enter the maximum value allowed. If a measured value exceeds the threshold value, the test fails. Frame Loss Threshold: The Frame Loss Threshold is the percentage of frames that can...
- Page 496 Performance Test App be lost before the test fails. The default is 0.3%. Tap the field to select or enter a new threshold or to disable grading based on frame loss altogether. Jitter Threshold: Jitter is a measure of the variation in frame-to-frame latency in mil- liseconds.
- Page 497 Performance Test App Open Layer 2 Options in the Performance app settings to override the VLAN settings from AutoTest. Override VLAN ID: Touch to select or enter a VLAN ID number. The Override VLAN ID function tags frames with a particular VLAN (for example, a VLAN used for voice, video, or data).
- Page 498 Performance Test App is set to Best Effort (0). Use this setting to simulate a traffic stream of a certain type. If Override VLAN Priority is not enabled, the VLAN priority is set to the value used for the Wired Test port.
- Page 499 Performance Test App QoS: Select the methodology used on your network: TOS with DSCP (Type of Service with Differentiated Services Code Point or TOS with IP Precedence (legacy). Then, configure the priority using the settings below. DSCP: This field is only available when TOS with DSCP is selected in the setting above.
- Page 500 Performance Test App field to select an IP Precedence other than the default of Routine (0). IP Precedence Type: This field is also only available when TOS with IP Precedence is selected. Touch the field to select an IP Precedence Type other than the default of Normal (0).
-
Page 501: Configuring Performance Endpoints
Performance Test App Configuring Performance Endpoints EtherScope nXG can run a Performance Test to any of the following Endpoints: Another EtherScope nXG (Peer) A OneTouch AT 10G (Peer) A LinkRunner G2 or LinkRunner AT (Reflector) NPT Reflector Software (Reflector) See our website NetAlly.com... -
Page 502: Onetouch 10G Performance Peer
Performance Test App OneTouch 10G Performance Peer Follow these steps to set up a OneTouch 10G Performance Peer: 1. Ensure the OneTouch is connected to an active network via the top RJ-45 or Fiber test port and is plugged into AC power. - Page 503 Performance Test App 2. With the unit powered on, touch the TOOLS icon on the Home screen. 3. In the TOOLS menu, select Testing Tools > Performance Peer. 4. Select the appropriate UDP Port number if other than the default of 3842. NOTE: The port number set on your endpoint must match the port number used by your source EtherScope.
-
Page 504: Linkrunner G2 Reflector
1. Ensure the LinkRunner is connected to an active network via the top RJ-45 or Fiber test port and is plugged into AC power. 2. Start the LinkRunner G2 testing application by touching the NetAlly logo at the bottom of the screen. - Page 505 4. Select Reflector 5. Configure the Packet Type and Swap settings as required. The default settings, Packet Type: MAC + NetAlly and Swap: MAC + IP, are recommended to avoid any undesired traffic on your network. 6. Once the LinkRunner G2 Reflector has...
-
Page 506: Linkrunner At Reflector
Performance Test App LinkRunner AT Reflector Follow these steps to set up a LinkRunner AT (2000) Reflector: 1. Ensure the LinkRunner is connected to an active network via the RJ-45 or Fiber test port and is plugged into AC power. 2. - Page 507 5. On the Reflector Screen, Configure the Packet Type and Swap settings as required. The default settings, Packet Type: MAC + NetAlly and Swap: MAC + IP, are recom- mended to avoid any undesired traffic on your network. 6. Select Save to apply any changed settings.
-
Page 508: Npt Reflector Software
NPT Reflector Software Follow these steps to set up the NPT Reflector PC application: 1. Download the software from NetAlly.com/support/downloads. 2. Install the Reflector on your PC by running the .exe file. 3. Open the Reflector application. Once open, the application automatically detects available network interfaces and their link status. - Page 509 6. Enter IP addresses for the interfaces you want to test against on the Endpoint Device screen in the EtherScope nXG's Per- formance Test Services settings. Refer to the Help in the NPT Reflector software for additional information. Back to Title and Contents...
-
Page 510: Running A Performance Test
Performance Test App Running a Performance Test Note the following before running: The Performance Test can only run from the Wired Test Port (top RJ-45 or Fiber port), and an AutoTest Wired Profile must connect successfully to establish link on the port. If you receive a Status message such as "The wired test port is not linked"... -
Page 511: Performance Test Results
Performance Test App Newly configured Services may not display on the main Performance Test screen until you touch START. To run your configured Performance Test, touch START on the main Performance screen. Performance Test Results... - Page 512 Performance Test App The Performance Test results update every 30 seconds, unless you are running a 10 second test, in which case, all results display after 10 seconds. Performance Test results are presented on cards. The top card shows the test duration and status.
-
Page 513: Performance Service Detailed Results
Performance Test App Performance Service Detailed Results The Service results screen displays detailed test characteristics and graphs of performance. - Page 514 Performance Test App Address: IP address of the endpoint Endpoint Type: Peer or Reflector Status: Current status of the test, including any error messages Loss, Latency, and Jitter Graphs The graphs described in this section update in real time for as long as the test is running. The graphs save and display data for the entire test duration, with a max duration of 24 hours.
- Page 515 Performance Test App columns contain measurements from the last interval. Performance test intervals are typically 30 seconds, unless you are running a 10-second test; then, there is only one interval of 10 seconds. The Min, Max, and Avg columns show cumulative measurements gathered during the test duration.
- Page 516 Performance Test App Frames Lost (Up/Down) (at Target Rate): Frame loss is quantified by the number of frames received subtracted from the number of frames sent. The Target Rate from the Performance Settings is shown in parentheses next to the Frames Lost heading.
- Page 517 Performance Test App newer, faster data links with less noise margin. These events could include static from a user's clothing or interference from electrical appliances or motorized equipment. When running a full 10G line rate test, ESD and EFT events can cause periodic spikes or a spike that then resolves on the Frame Loss graph.
- Page 518 Performance Test App by averaging the thousands of latencies measured during each interval. The one-way latency measurements are actually round trip measurements, divided by two. Peak Latency: The highest measured latency. The Current column shows Peak Latency from the last test interval, and Max shows the highest latency measured during the entire test.
-
Page 519: Uploading Performance Results To Link-Live
Performance Test App Jitter (Up/Down): Jitter is a measure of the variation in frame-to-frame latency in mil- liseconds. Peak Jitter: The highest measured Jitter. The Current column shows Peak Jitter from the last test interval, and Max shows the highest Jitter measured during the entire test. - Page 520 Performance Test App See the Link-Live chapter for more information. Back to Title and Contents...
-
Page 521: Running Etherscope As A Performance Peer
Running EtherScope as a Performance Peer In addition to running a Performance Test as the controlling source device, EtherScope nXG can also act as a Peer for another EtherScope nXG or a OneTouch AT 10G acting as the source and controller. - Page 522 Communication UDP Port. Touch the settings button on the Performance Peer screen to change the port number. The default NetAlly performance test port is 3842. NOTE: The UDP port number entered here must match the port number used by your source device.
- Page 523 Performance Test App The screen displays real-time status, utilization, and rates for as long as the test is running. Status: The current status of the peer Utilization Rx: Receive percentage of the link speed Tx: Transmit percentage of the link speed...
- Page 524 Performance Test App Address Link: Link speed and duplex of the estab- lished Wired Test Port connection IP Address: Address of the EtherScope to be entered into the controlling source device Port: UDP Communication port in use by the peer MAC: The EtherScope's MAC address Connections Last Peer: Address of the previous peer that...
-
Page 525: Iperf Test App
Test iPerf is a standardized network performance tool used to measure UDP or TCP capacity and throughput. The iPerf App runs an iPerf3 performance test using a NetAlly Test Accessory or an iPerf server endpoint installed on a PC. - Page 526 Link-Live Cloud Service, and acts as an iPerf server endpoint for iPerf tests run by other NetAlly handheld testers. Learn more about the Test Accessory from NetAlly.com/products/TestAccessory. If you are using an iPerf server installed on a PC or other device as an endpoint, iPerf version 3 is required to run the EtherScope iPerf test.
-
Page 527: Iperf Settings
To run an iPerf test, you must configure your EtherScope unit to communicate with your iPerf endpoint. You can manually enter its address or select a NetAlly Test Accessory from Discovery app if the unit is discoverable. Saving Custom iPerf Settings... - Page 528 iPerf Test App the iPerf settings and results screens. In the example images here, the user has saved a custom iPerf configuration called "Server Room Endpoint."...
-
Page 529: Populating A Test Accessory Address From Discovery
iPerf Test App Populating a Test Accessory Address from Discovery 1. Open the Discovery app, and select an active Test Accessory from the main Discovery list to open the device details screen. 2. Open the Floating Action Button (FAB) menu. - Page 530 iPerf Test App 3. Then, select the iPerf app button. The iPerf app opens with the IP address populated from the Test Accessory selected in Discovery.
- Page 531 iPerf Test App...
-
Page 532: Configuring Iperf Settings Manually
iPerf Test App Configuring iPerf Settings Manually To configure the iPerf test settings manually, open the settings on the iPerf screen. - Page 533 If needed, consult the Test Accessory User Guide (NetAlly.com/products/TestAccessory). Duration: This setting is the length of time for one direction, Upstream or Downstream, of the iPerf test. If the Direction setting below is set...
- Page 534 iPerf Test App to both Upstream/Downstream, the total test time will be twice the value set here. Tap the field to select a new duration or enter a custom value. The default is 10 seconds. Protocol: TCP is the default protocol. Tap the UDP selector to switch to UDP.
- Page 535 iPerf Test App 10 Mbps. Tap the threshold fields to select a different value or enter a custom one. Back to Title and Contents...
-
Page 536: Running An Iperf Test
iPerf Test App Running an iPerf Test Ensure that you have an active link on the Interface (Test or Management Port) from which you are running the iPerf test. Wired and Wi-Fi test ports require that an AutoTest Wired or Wi-Fi Profile has run to establish link. The AutoTest Wired Profile runs automatically, but you must open the AutoTest app to run a Wi-Fi Profile and link on the Wi-Fi test port. - Page 537 iPerf Test App Test characteristics and status are displayed at the top of the iPerf results screen while the lower part of the screen displays a real time graph of the TCP or UDP Upload and/or Download speed.
- Page 538 iPerf Test App Device Name: Hostname or address of the iPerf server/Test Accessory IP Address: IPv4 address of the iPerf server Interface: The EtherScope Test or Management Port from which the test is running Results Duration: Configured Duration from the iPerf settings Started: Time the test started Status: Success or failure status of the test...
-
Page 539: Uploading Iperf Results To Link-Live
iPerf Test App The table below each graph displays the Current, Minimum, Maximum, and Average rates. Limit: This is the Threshold from the iPerf app's settings. The threshold value is also displayed on the graph as a red dotted line. Uploading iPerf Results to Link- Live To send your iPerf results to the Link-Live... - Page 540 iPerf Test App The Link-Live sharing screen opens and allows you to revise the auto-generated filename and attach comments to the iPerf result, which will be displayed on the Results page on Link- Live.
- Page 541 iPerf Test App See the Link-Live chapter for more information.
-
Page 542: Link-Live Cloud Service
Back to Title and Contents EtherScope nXG User Guide Link-Live Cloud Service Link-Live Cloud Service is a free, online system for collecting, tracking, organizing, analyzing, and reporting your test results, which are automatically uploaded once your EtherScope nXG is claimed. - Page 543 Link-Live Cloud Service The comprehensive EtherScope nXG offers more features for analyzing your network in Link-Live than previous testers. Claim your EtherScope to Link-Live to access these functions: Check for software updates and update your EtherScope nXG software. Download third-party applications from the...
-
Page 544: Getting Started In Link-Live Cloud Service
Units page from the left side navigation drawer, and click the Claim Unit button at the lower right corner of the screen. 2. Then, select the EtherScope nXG image, and follow the claiming instructions on the Link-Live website. On the EtherScope nXG Unit 1. -
Page 545: Uploading Test Results
3. When prompted by the instructions on the Link-Live website, enter the MAC address. After you claim your EtherScope nXG to Link- Live, a software update may be available. If so, a notification appears in the Status Bar. Open... -
Page 546: Unclaiming
Link-Live Cloud Service picture with your test results using the AutoTest Wired Wi-Fi Profile's Floating Action Buttons (FABs) and automatically sort your results into folders in Link-Live using test comments. If your EtherScope is not connected to an active network, any test results, comments, or images are stored in memory (buffered) and uploaded once a connection is established. - Page 547 Link-Live Cloud Service Back to Title and Contents...
-
Page 548: Using The Link-Live App
Link-Live Cloud Service Using the Link-Live App The main Link-Live app screen on your EtherScope nXG facilitates the claiming process, displays Link-Live related information, and allows you to enable or disable Link-Live uploads as needed. Link-Live App Screen Details The "(# buffered)" in the Link-Live screen... - Page 549 Link-Live Cloud Service upload to Link-Live once your EtherScope is connected to an active network. The EtherScope unit's name that displays in Link-Live is shown to the right of the Link-Live icon . You can change this name on the Link-Live Units page.
-
Page 550: Job Comment
Link-Live Cloud Service Job Comment left-side navigation drawer for the Link-Live app lets you enter or change the Job Comment. The Job Comment attaches to all test results and files uploaded to Link-Live, until you change or delete it. In contrast, other Comments, like those attached to Wired AutoTest profiles or... -
Page 551: Link-Live And Testing Apps
Link-Live Cloud Service 2. Touch the Job: field. 3. Enter a comment in the dialog box. 4. Touch SAVE. Note that the Job Comment field appears in other Link-Live sharing screens, allowing you to change it from multiple locations on the EtherScope. - Page 552 Link-Live Cloud Service links and buttons for uploading to Link-Live in the testing apps will not appear. Link-Live Sharing Screens Whenever you select a button or link, like those above, to Upload, Save, or Share to Link-Live, a Link-Live sharing screen appears with the appropriate options for the data type.
- Page 553 Link-Live Cloud Service The Link-Live sharing screen for a screenshot or other image allows you to attach it to the most recent test result on the Results page or just to the Uploaded Files page on Link- Live.com.
- Page 554 Link-Live Cloud Service Remember, the regular Comment field uploads only to the current result or file, while the Job Comment field uploads with all results and files until you change it.
-
Page 555: Cable Test App
Back to Title and Contents EtherScope nXG User Guide Cable Test EtherScope nXG's Cable Test can help you determine cable length and fault status, verify wiremapping of patch and structured cabling, and locate cable connections using toning. The cable testing port is the RJ-45 port on the left side of the EtherScope unit. -
Page 556: Cable Test Settings
Cable Test App Cable Test Settings The settings for the Cable Test app are simply Distance Unit settings: Feet or Meters. To change Cable Test settings, touch the menu icon on the Cable Test app screen, and select Cable Test Settings. Tap the Distance Unit field, and select either Feet or Meter as needed, then touch OK. -
Page 557: Running Cable Test
EtherScope nXG cannot perform a cable test on a cable that is connected to a switch; however, you can still use the toning... -
Page 558: Open Cable Tdr Testing
To start the cable test, tap START at the top right of the Cable Test app screen. Open Cable TDR Testing EtherScope nXG can measure the length of a cable and detect some faults by measuring the electrical reflections of the cable using Time Domain Reflectometry (TDR). - Page 559 Cable Test App When a cable has no detected faults, "good" is shown next to each pair above the length measurement. Cable tests that detect a "split" or "open" in the cable also display the cor- responding words.
- Page 560 Cable Test App This unterminated cable test image shows a shorted cable between pins 4, 5, and 7.
-
Page 561: Terminated Wireview Testing
Terminated WireView Testing Using a WireView accessory provides more detailed, per-wire results. A WireView #1 is included with your EtherScope nXG. Additional WireViews 2-6 are available for purchase. To run a terminated cable test, connect the left side RJ-45 port to a cable terminated with an external WireView Cable ID accessory. - Page 562 Cable Test App The image above indicates a crossover between pairs 1, 2 and 3, 6 and a WireView accessory number 5.
-
Page 563: Using The Tone Function
Cable Test App The last row of WireView results indicates whether the cable is shielded: an unbroken line between sh means a shielded cable is detected. Using the Tone Function You can also trace a cable using a Fluke Networks* IntelliTone™ Probe, or any analog probe, and the Tone function. -
Page 564: Specifications And Compliance
Back to Title and Contents EtherScope nXG User Guide Specifications and Compliance Required compliance information is contained in this chapter. -
Page 565: Specifications
Specifications and Compliance Specifications General 4.05 in x 7.67 in x 2.16 in Dimensions (10.3 cm x 19.5 cm x 5.5 cm) Weight 1.677 lbs (0.76 kg) Rechargeable lithium-ion battery Battery pack (7.2 V, 6.4 Ah, 46 Wh) Typical operating life is 3-4 hours Battery (infinite on PoE). -
Page 566: Wireless
Generator LEDS 2 LEDs (Activity and Link Indicators) Wireless EtherScope nXG has two internal Wi-Fi Radios: Wi-Fi Testing – 4x4 Dual-band 802.11ac Wave 2 wireless radio Android System Wi-Fi, Bluetooth, and Man- agement – 1x1 Dual-band 802.11ac Wave 2 + Bluetooth 5.0 and BLE wireless radio... - Page 567 Specifications and Compliance 4x4 Wi-Fi Radio for Testing Applicant's Name NetAlly Model Number BCM43465 LITE-ON Technology Cor- Manufacturer poration Manufacture Date 2017 Country of Origin Taiwan 64/128-Bit WEP Key, WPA, Security WPA2, 802.1X (TKIP, AES) Regulatory World Mode Domain 1.1 dBi peak in the 2.4-GHz Antenna Gain band;...
- Page 568 : 65, 130, 260, 390, 520, 585, 650, 780, 867 Mbps Operating Frequencies The EtherScope nXG receives on all of the fre- quencies in every country, but transmits only on the frequencies and channels allowed in the country for which it is currently configured in General Set- tings.
- Page 569 VHT20 MCS 8 : -63 dBm VHT40 MCS 9 : -60 dBm VHT80 MCS 9 : -57 dBm Android 1x1 Wi-Fi/Bluetooth Adapter for Management Applicant's Name NetAlly Model BLUE bean Manufacturer 8devices Manufacture Date 2019 Country of Origin United States...
- Page 570 : 32.5, 65, 97.5, 130, 195, 260, 292.5, 325, 390, 433.3 Mbps Operating Frequencies The EtherScope nXG receives on all of the fre- quencies in every country, but transmits only on the frequencies and channels allowed in the country for which it is currently configured in General Set- tings.
- Page 571 Specifications and Compliance 112, 116, 120, 124, 128, 132, 136, 140, 144, 149, 153, 157, 161, 165) Modulation 802.11a : BPSK (6 and 9 Mbps), QPSK (12 and 18 Mbps), 16 QAM (24 and 36 Mbps), 64 QAM (48 and 54 Mbps), OFDM 802.11n/ac : BPSK (MCS0), QPSK (MCS1 and MCS2), 16 QAM (MCS3 and MCS4), 64 QAM (MCS5,...
-
Page 572: Environmental Specifications
Specifications and Compliance Antenna frequency range: 2.4 – 2.5 and 4.9 – 5.9 GHz External antenna port is receive-only (no transmit). Environmental Specifications 32ºF to 113ºF (0ºC to +45ºC) NOTE: The battery will not Operating charge if the internal tem- Temperature perature of the unit is above 113ºF (45ºC). -
Page 573: Certifications And Compliance
Specifications and Compliance Certifications and Compliance CAUTION: Changes or modifications not expressly approved by the party responsible for compliance could void the user's authority to operate the equipment. Conforms to relevant European Union directives. Conforms to relevant Australian Safety and EMC standards. Complies with 47 CFR Part 15 require- Ž... - Page 574 Specifications and Compliance U-NII devices operating in the 5.25-5.35 GHz and 5.47-5.725 GHz band, without radar detection are restricted to use indoors. Contains WA7-43465, WA7-9377 FCC IDs Contains 6627C-43465, 6627C-9377 IC IDs This device complies with part 15 of the FCC Rules. Operation is subject to the following two conditions: (1) This device may not cause harmful interference, and (2) this device must accept any interference received,...
- Page 575 Specifications and Compliance Absorption Rate (SAR) information: This device meets the government's requirements for exposure to radio waves. The guidelines are based on standards that were developed by independent scientific organizations through periodic and thorough evaluation of scientific studies. The standards include a substantial safety margin designed to assure the safety of all persons regard- less of age or health.
- Page 576 Specifications and Compliance IEC 61326-1:2013: Basic Elec- tromagnetic Environment; CISPR 11: Group 1, Class A Group 1: Equipment has intentionally generated and/or uses conductively-coupled radio frequency energy that is necessary for the internal function of the equipment itself. Class A: Equipment is suitable for use in all estab- lishments other than domestic and those directly connected to a low-voltage power supply network that supplies buildings used for domestic purposes.
Need help?
Do you have a question about the ETHERSCOPE nXG and is the answer not in the manual?
Questions and answers