Rigol DS6104 How-To Manual
Oscilloscope signal analysis using ffts
Hide thumbs
Also See for DS6104:
- Performance verification manual (43 pages) ,
- User manual (298 pages) ,
- Quick manual (41 pages)
Table of Contents

Related Manuals for Rigol DS6104


Summary of Contents for Rigol DS6104
- Page 1 IGOL ECHNOLOGIES USA 877-4-RIGOL-1 How-To Guide info@rigol.com www.rigolna.com Oscilloscope Signal Analysis Using FFTs Application Notes Comparison Guides FAQs How-To Guides Programming Manuals Quick Start Guides Support Information User’s Guides...
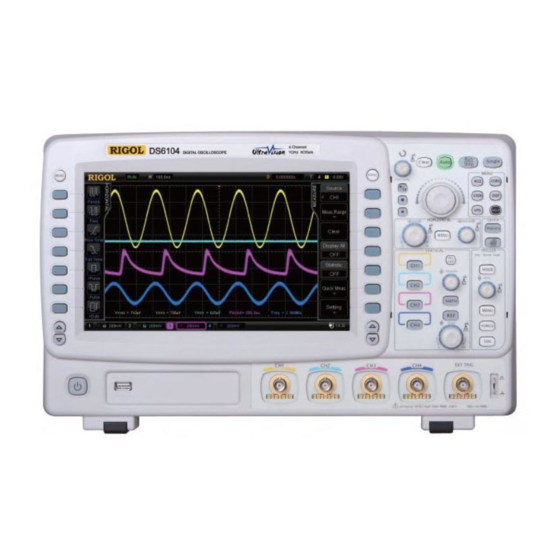
- Page 2 IGOL ECHNOLOGIES USA 877-4-RIGOL-1 How-To Guide info@rigol.com www.rigolna.com Fast Fourier Transforms with Rigol Oscilloscopes FFT (Fast Fourier Transform) is a process which converts a time‐domain signal into its frequency domain equivalent. Common applications for usage of FFT waveforms are: Measuring harmonic content and distortion in systems Characterizing noise in DC power supplies Analyzing vibration How to obtain a waveform's FFT? In this example an FFT will be generated for the 1 KHz square wave acquired on Channel 1 as seen below. This signal can be duplicated on any Rigol scope by attaching the probe to the square wave generator port on the front of the instrument. Once you do that, push AUTO then you will see this: ...
- Page 3 IGOL ECHNOLOGIES USA 877-4-RIGOL-1 How-To Guide info@rigol.com www.rigolna.com Press the “MATH” button, a menu will appear on the side, then select FFT and set the source to Channel 1: A Fast Fourier Transform of the current signal on Channel 1 will appear in the Purple color below the square wave. ...
- Page 4 IGOL ECHNOLOGIES USA 877-4-RIGOL-1 How-To Guide info@rigol.com www.rigolna.com The FFT can be displayed full screen with the channel as well by adjusting the WINDOW setting. However, you like to view it take notice of the separate VERT/div and HORIZ/div settings shown in purple. You can adjust these by pushing the MATH button and then using the horizontal and vertical scale knobs. If the FFT isn’t shown on the screen, move the VERTICAL position knob until you see the zero point and then the signal. There are two options for vertical units on the FFT: mVrms and dBVrms. When looking to view small signals along with much larger signals dBVrms is beneficial because it provides a log scale. For those not used to logarithmic scaling look at the screenshot above. In the split screen mode shown there are 8 vertical divisions dedicated to the FFT. Here are the values at the top of each division given the 200 mVrms/div setting and the position of the zero marker on the left at the top of the bottom division: Divisions down from top of FFT Value at top of that division screen 0 (top of purple display) 1.4 Vrms 1 1.2 Vrms 2 1 Vrms 3 800 mVrms 4 600 mVrms 5 ...
- Page 5 IGOL ECHNOLOGIES USA 877-4-RIGOL-1 How-To Guide info@rigol.com www.rigolna.com If you change the units to dBVrms, here are the values: When the settings are 20dBVrms/div and the reference is moved to one division down from the top of the FFT display: Divisions down from top dBVrms from position Value at top of that of FFT screen marker division 0 +10 dBVrms 3.16 Vrms 1 0 dBVrms 1 Vrms (at the position marker) 2 ‐10 dBVrms .316 Vrms 3 ‐20 dBVrms .1 Vrms 4 ‐30 dBVrms .0316 Vrms 5 ‐40 dBVrms .01 Vrms ...
- Page 6 IGOL ECHNOLOGIES USA 877-4-RIGOL-1 How-To Guide info@rigol.com www.rigolna.com So in this case every 20 dB is a factor of 10x the voltage. Usually, dB is used in terms of Watts or milliWatts (dBm) in which case every 10 dB is a factor of 10x the power, but because of the relationship between power and voltage note that 20 dB is a factor of 10 on your scopes display. The horizontal units per division of the FFT are always in frequency. The above screen shot shows 1.25 KHz per division. In this display, the left side of the screen is always at DC or 0 Hz. Each division to the right then marks the set value. In this case the divisions would be 0 Hz, 1.25 KHz, 2.5 KHz, 3.75 KHz, 5 KHz, and so on. How to save a waveform's FFT? To save an FFT to the scope or a USB drive, the FFT must be saved as a reference wave “REF” as in the following procedure: Press the “REF” button. When the side menu appears, set the source to be the FFT. Then use the “Save” option in the menu to save locally or externally. ...
- Page 7 IGOL ECHNOLOGIES USA 877-4-RIGOL-1 How-To Guide info@rigol.com www.rigolna.com To save the waveform, select save. To save the FFT waveform to a USB drive press the “Location” button the Location now switches to “External” as in the figure below: Upon selecting “Save” select the file to save the waveform to and then exit upon completion. Reference waveforms can then be recalled at a later time to compare signals. ...
- Page 8 IGOL ECHNOLOGIES USA 877-4-RIGOL-1 How-To Guide info@rigol.com www.rigolna.com In summary, while not as accurate as a spectrum analyzer or with as much range, the FFT function of the oscilloscope can be used to view the frequency domain information for a signal. With a variety of capabilities to change ranges, units, and display mode as well as saving and recalling waveforms, Rigol oscilloscopes can make frequency measurements easily and quickly using the included FFT function. For more information or questions contact us directly at: Rigol Technologies USA 7401 First Place Suite N Oakwood Village, OH 44146 You can reach us directly at: (440) 232‐4488 877‐4‐RIGOL‐1 info@rigol.com www.rigolna.com (Rigol North America website) ...
Need help?
Do you have a question about the DS6104 and is the answer not in the manual?
Questions and answers