biodex ATOMLAB 500 Operation And Service Manual
Dose calibrator
Hide thumbs
Also See for ATOMLAB 500:
- Operation and service manual (248 pages) ,
- Installation manual (16 pages) ,
- Quick reference procedures (4 pages)

Related Manuals for biodex ATOMLAB 500


Summary of Contents for biodex ATOMLAB 500
- Page 1 ATOMLAB™ 500 DOSE CALIBRATOR OPERATION AND SERVICE MANUAL 086-330 086-332 FN: 17-355 9/17...
- Page 2 Atomlab™ 500 Dose Calibrator This manual covers operation procedures for the following products: #086-330 Atomlab™ 500 Dose Calibrator...
-
Page 3: Table Of Contents
The Display Unit Carton ....................13 The Detector Unit Carton ....................13 Save the Packing Material ....................13 Biodex Warranty ..........................14 Introduction ........................16 Intended Use ........................16 Indications for Use ......................16 ... - Page 4 Save the Packing Material ....................25 Maintenance ........................25 Passcode Protection ......................25 Atomlab 500 Home Screen ....................26 Basic Key Functions ......................26 Atomlab 500 Utilities ......................28 System Configuration ......................28 ...
- Page 5 Appendix E: Calibration Values ....................180 Appendix F: Atomlab Dose Calibrator Calibration and Traceability ..........187 Appendix G: Atomlab 500 and 500Plus Serial Communications Interface ........188 Appendix H: Atomlab 500 Isotope Index ..................195 Appendix I: Atomlab 500 Dose Calibrator Replacement Parts ............199 ...
-
Page 6: Definition Of Symbols
Definition of Symbols The following symbols and their associated definitions are used and implied throughout this manual. Symbol Definition Carefully read these instructions prior to use Caution General Warning General Mandatory Action Dangerous Voltage “On” Power “Off” Power Earth (ground) Alternating Current Fuse USB Connector/Cable... -
Page 7: Before Proceeding
Atomlab 500 Dose Calibrator properly and safely. Specific Cautions: Allow only qualified, trained personnel to operate or service the Atomlab 500. • If the equipment is used in a manner other than specified in this operation •... - Page 8 Sauf lorsque en utilisant le Bouclier de Moly, Bien le Paquebot et le Cincle • doivent être utilisés pour tous Atomlab 500 Dose mesures de Calibrator. Le Bouclier de Moly est utilisé avec le bouclier en métal fourni pour le •...
- Page 9 CAUTION: The Atomlab Dose Calibrator is intended to measure the activity of a radioactive source of a known isotope. This measurement may be for purposes of determining or verifying a radiopharmaceutical dose for nuclear imaging or nuclear medicine. This measurement may also be for the purpose of determining the radioactivity of a sample for dose calibrator constancy and Accuracy Testing or to measure other non- medical radioactive samples.
-
Page 10: Product Certifications And Classifications
Product Certifications and Classifications This product has received the following certifications and falls within the following classifications: • ETL Listed Electrical Equipment, Laboratory Use; Part 1, General Requirements for Safety conforms to UL 60601-1, CAN/CSA C22.2 No: 601-1-M90, IEC 60601-1, IEC 60601-1-4 and IEC 60601-1-2 and CE Marked. -
Page 11: Important Safety Information
Important Safety Information CAUTION: Federal Law restricts this device to sale by or on the order of a physician, sonographer or other licensed professional. ATTENTION: La Loi Fédérale restreint cet artifice à la vente par ou sur l'ordre d'un docteur, sonographer ou d'autre professionnel agréé. Follow the unpacking and assembly instructions document. - Page 12 CAUTION: To avoid risk of electric shock, this equipment must only be connected to supply mains with protective earth. ATTENTION: Pour éviter le risque de choc électrique, cet équipement doit uniquement être connecté à un approvisionnement conduites avec la terre protectrice.
-
Page 13: Unpacking Instructions
Unpacking Instructions Shipping Cartons The Atomlab 500 Dose Calibrator and its respective components are carefully packed in two cartons. One carton contains the display unit and accessories; the other carton contains the detector unit. Both are shipped in an over-pack. -
Page 14: Biodex Warranty
1. Check to see that the problem occurs more than once. 2. Refer to the instruction manual and operations procedure. If you still think you have a service problem, call BIODEX MEDICAL SYSTEMS, INC., Service Department at (800) 224-6339 and select product service as prompted. - Page 15 6. After analyzing the problem, we will decide if the unit can be repaired on site, or replacement parts will be sent. 7. If the unit must be returned, Biodex will provide a return materials authorization number (R.M.A. #.) Pack the table in the carton that it was originally shipped in. It is the customer's responsibility for any damage that occurs during shipping.
-
Page 16: Introduction
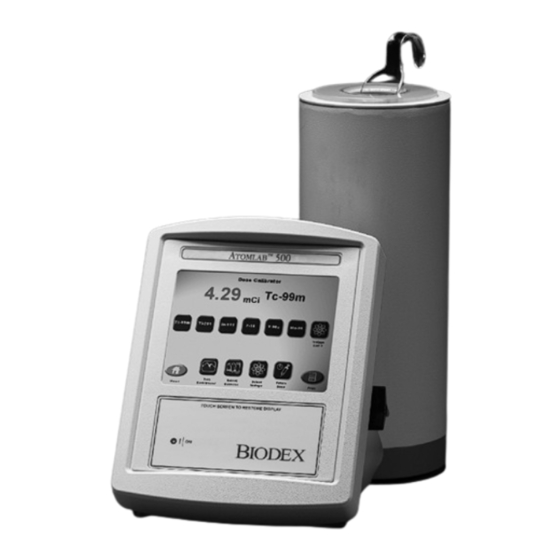
Additionally, there are advanced, but easy-to-use programs for Nuclear Pharmacy. Figure 1.1. The Atomlab 500 features large, easy to read icons, prompts and values on a touch-screen display. The system consists of a low pressure ionization chamber, electrometer with extraordinary linearity, and an auto-ranging touch-screen color display. -
Page 17: Description
This is necessary, for example, when measuring syringe doses when the volume is unimportant. The detector has electronics and the calibration built into it (the calibrator is built into the detector.) Therefore, any Atomlab 500 display can be connected to a detector and have a calibrated system. -
Page 18: Response
Institute of Standards & Technology. The Display Unit The Atomlab 500 Dose Calibrator display unit consists of a tablet that allows the user to make activity measurements. A built-in microprocessor executes commands input via the touch panel and computes activity values from detector data. -
Page 19: Display Units
GBq indicated, the activity is 2,360,000,000 becquerels. Routine Isotopes The routine radioisotope (isotope selection) keys for the Atomlab 500 include: Tc-99m, TI-201, I-123, I-131, Cs-137, Co-57, Xe-133, Ga-67, In-111, F-18, Y-90s, and Ba-133. The Co-57, Ba-133 and Cs-137 buttons are primarily used for accuracy and constancy tests. -
Page 20: Installation
2. Installation Operating Requirements Prior to installing the equipment, plan a layout for the Atomlab unit that will ensure it is convenient for measuring radionuclides and will not cause undue radiation exposure because of extra handling of high activity sources. There should be ample room to place a vial shield on the work surface (preferably behind an l-Block shield), open the shield and remove the vial using tongs, quickly place the vial into the sample holder and place both into the detector well. -
Page 21: Positioning
Temperature: 10 to 30°C Humidity: 0 to 90% rh, non-condensing For optimum performance, the Atomlab 500 Dose Calibrator should be operated in a normal laboratory environment where the temperature and humidity are maintained for normal human comfort and the ambient radiation level is low and constant. -
Page 22: Cable Connections
Cable Connections Figure 2.1. The Atomlab 500 cable connections (on back of unit.) Figure 2.2. The Atomlab 500 Display connected to a detector, label printer and printer. -
Page 23: Power Up And System Test
ON once the cord is plugged into the wall. The system will power-up and run a self-test. NOTE: As long as the Atomlab 500 is plugged in and power turned ON, the system will be functioning. Depending on the Backlight Time setting, the display screen will eventually turn OFF. - Page 24 Figure 2.2. The Atomlab 500 System Test screen. Connect the power cable to the back of the display unit and plug the power supply into a wall socket. Toggle the power switch, located on back of the display, to the “ON” (I) position. The green power on led on the display will light and the system automatically performs a background count and system-test as part of the power-up process.
-
Page 25: Save The Packing Material
Once the system check is completed, touch <Accept> to advance to the Atomlab 500 Home screen. Save the Packing Material Once the Atomlab dose calibrator has been set up and everything is intact and functioning, repack the packing material. This material was especially designed for safe shipment of the Atomlab dose calibrator and should be considered part of the instrument. -
Page 26: Atomlab 500 Home Screen
Figure 3.2: The Home Screen When a Wipe Counter is added to the Atomlab 500 Easy to read and intuitive to use, the Atomlab 500 touch screen display prompts users to Advance effortlessly and logically though the Dose Calibrator Quality Assurance Testing (Chapter 6), the Dose Calibrator Operation (Chapter 4), Nuclear Pharmacy (Chapter 7), and Utilities (Chapter 3). - Page 27 < > Exits from the system. • NOTE: When a Wipe Test Counter (#086-331) is added to the Atomlab 500, the system automatically recognizes the additional detector and displays the Home screen for both the detector and the wipe counter.
-
Page 28: Atomlab 500 Utilities
4. Atomlab 500 Utilities Figure 4.1. The Utilities Menu Selecting <Utilities> from the Home screen displays the Utilities menu as illustrated above in Figure 4.1. Touch the appropriate screen icon to select the desired function. Utilities Menu Options Include: System Configuration •... - Page 29 To Change the Passcode: 1. Touch anywhere in the Passcode field to highlight the field and the keypad. 2. Enter the current passcode on the keypad and touch <Accept>. 3. Enter the new passcode on the keypad and touch <Accept>. 4.
- Page 30 Figure 4.3. The Facility Information Screen This option allows the user to enter or change the facility name and address. The user can enter up to four lines of text for this parameter as illustrated in Figure 4.3 above. The facility name and address entered will appear on some printed reports.
- Page 31 The Staff Members List allows a specific staff member to be associated with any Atomlab 500 QA test. New staff may be added to the list and staff members may also be removed. Staff can also be added to the Staff Members List as part of the save procedure after performing any QA test.
- Page 32 5. Select the Staff Type by touching the appropriate radio box. 6. Touch <Accept> to record the selection and return to the System Configuration screen or <Cancel> to return to the System Configuration screen without adding a new name to the Staff Members List.
- Page 33 To Delete A Person From The Staff Members List: Figure 4.9. Delete Staff Member Screen Message 1. On the Staff Members List screen, touch to highlight the line containing the name of the person to be deleted. If necessary, use the <▲> and <▼> arrows to scroll up and down the Staff Members List until the desired person is displayed.
- Page 34 Select Printer – Touch the down arrow to display a list of available printers. Select the • desired printer by touching the name. Copies – Select the number of copies to print by using the <▲> and <▼> arrows to •...
- Page 35 desired regional format, and the UTC time zone format. To Set Date/Time: 1. Touch <Regional Date/Time Settings> on the System Configuration screen. Figure 4.13. System Configuration Screen 2. The Regional Set Date/Time Settings screen is displayed (see Figure 4.12 ). 3.
- Page 36 Figure 4.15. Time Format Selection Note: The Region format and the Time Zone do not have to be equivalent. For example, a user who normally operates in Israel can be working in the US and select Hebrew (Israel) as the Region Format, but display the Time Zone as US time.
-
Page 37: Dose Calibrator Configuration
Touch <Accept> to return to System Configuration screen with the new time/date, or <Cancel> to exit without updating the date/time entry. Dose Calibrator Configuration Figure 4.18. The Dose Calibrator Configuration Screen The Dose Calibrator Configuration screen options allow the user to update isotope information, set acceptance variances, access the Sealed Source List, set Label Printing Preferences, set-up inventory isotopes, set the low activity response, and select the Volume Decimal Digits. - Page 38 Select Current Isotope Figure 4.20. The Select Current Isotope Screen.0 To Select Any Isotope From The Full Isotope Lists: 1. From the <Home> screen, select <Utilities>. The Utilities screen is displayed. 2. Select <Dose Calibrator Configuration>. The Dose Calibrator Configuration screen is displayed.
- Page 39 Figure 4.22. Dose Calibration Measure Screen Illustrating Isotope List Setup Button Isotopes Figure 4.23. The Setup Button Isotope Screen Setup Button Isotopes allows the user to assign any selected isotope to the buttons on the isotope list that is displayed on the Measure screen. 1.
- Page 40 3. Touch the button to which the isotope should be assigned. The isotope currently assigned to the button is removed and the new isotope is now displayed on that button. Figure 4.25. Setup Button Isotopes Screen after Isotope is Assigned to Button NOTE: If changes are made and <Cancel>...
- Page 41 Figure 4.27. Factory Defaults Prompt Touch <Yes> to revert to the factory defaults, or <No> to return to the Setup Button Isotopes screen without resetting any isotope button changes to the factory defaults. Add Isotope Figure 4.28. The Add Isotope to List Screen Add Isotope allows the user to add isotopes to the “new isotopes”...
- Page 42 Figure 4.29. Keypad with Symbol Entered 3. Touch <Accept>. 4. Touch the keypad icon to the right of the <Isotope Name> field. Use the displayed keypad to enter the isotope name: Figure 4.30. Keypad with Isotope Name Entered If the isotope name entered matches a name currently on the list, the following message is displayed.
- Page 43 5. Touch <Dial Setting>. Enter the dial value for the isotope. 6. Touch <Half Life>. Enter the half life for the isotope. 7. Touch the desired radio box in the <Half Life Units> field: seconds, minutes, hours, days, or years. 8.
- Page 44 displayed. Touch to highlight the isotope to be removed. Figure 4.34. Remove Isotope from List with Isotope Highlighted 3. Touch the <Delete> icon. The following prompt is displayed: Figure 4.35. Remove Isotope Prompt Touch <Accept> to remove the selected isotope, or <Cancel> to retain the selected isotope and return to the Remove Isotope from List screen.
- Page 45 Press <No> to keep the changes, followed by <Accept> on the Setup Button Isotope screen. Press <Yes> to exit to the Isotope List screen without saving any changes. NOTE: Only new isotopes added to the system by the user can be removed. Factory isotopes cannot be deleted.
- Page 46 Figure 4.38. The Change Dial Values Screen 7. Use the <▲> or <▼> keys to scroll through the list until the desired isotope is displayed. 8. Touch the desired isotope to highlight the selection. 9. Touch the <Change Dial Value> icon at the bottom of the screen to display the dial setting entry screen.
- Page 47 Figure 4.40. Isotope List – Dial Values Report. <Accept> to return to the Isotope List screen with the new entry selected. • <Cancel> to return to the Isotope List screen without making a new selection. • NOTE: After restoring factory dial values, scroll the Isotope List and verify that no new dial values are listed.
- Page 48 Regulatory Limits Figure 4.41. The Regulatory Limits Screen Regulatory limits are used to program allowable variances for each of the Individual QA tests. To Set Regulatory Limits: 1. From the Dose Calibrator Configuration screen, touch <Regulatory Limits>. 2. The Regulatory Limits screen is displayed. 3.
- Page 49 Figure 4.43. Restore Factory Settings Prompt Touch <Accept> to revert to the factory defaults, or <Cancel> to return to the Regulatory Limits screen without resetting any limits to the factory defaults. Sealed Sources Setup Figure 4.44. The Sealed Source List. The Sealed Sources List screen is used to enter data to add to sealed sources.
- Page 50 To Enter A Sealed Source: Figure 4.45. Sealed Source Screen 1. From the Sealed Sources List screen, touch <Add> to access the Sealed Source Setup screen. 2. Touch <Sealed Source>. The Select Isotope screen is displayed. Figure 4.46. Select Isotope Screen 3.
- Page 51 4. Touch <Calibration Activity>. The Calibration Activity screen is now displayed. Figure 4.48. Calibration Activity Screen Using the displayed keypad, enter the activity for the date of calibration for the source and touch <Accept>. Once the calibration activity has been entered, the user can increase or decrease the amount by touching the <▲>...
- Page 52 Figure 4.50. Calibration Date Screen The user can accept the default date or enter a new date by touching the month, day, and/or year fields and using the <▲> or <▼> keys to scroll to locate the desired date. Touch <Accept>. 7.
- Page 53 9. Enter the Source ID and touch <Accept> to redisplay to the Sealed Source screen containing the Source ID. Figure 4.53. Sealed Source Screen with Sealed Source, Calibration Activity, Calibration Date, and Source ID Displayed. 10. The Expanded Constancy List is used when the Expanded Constancy Test is executed (see Chapter 6) to measure and record an activity reading using the selected sealed source for each of the isotopes selected.
- Page 54 Touch <Delete Isotope>. • The isotope is deleted from the list. • 11. When information has been entered into all of the fields, touch <Save>. 12. The following message is displayed: Figure 4.55. Saved Message 13. Touch <Accept> to save the isotope(s) entered in the Expanded Constancy List. 14.
- Page 55 Figure 4.57. Sealed Source Screen with Isotope to be Edited 3. Touch to highlight each field to edit on the Sealed Source Setup screen. 4. Make the appropriate edits, touching <Accept> to save each one. When all the required edits have been made, touch <Save >. The system saves the changes made and displays a note stating that sealed source changes have been saved.
- Page 56 2. Touch <Back> to return to the Dose Calibrator Configuration screen. To Print A List Of Sealed Sources: 1. At the Sealed Sources List screen, touch <Print>. The entire Technologist List will print to the currently selected printer. 2. Touch <Back> to return to the Sealed Source List. Figure 4.59.
- Page 57 Figure 4.61. Set Background Time Screen The background counting time used for the dose calibrator and Zero Background can be set for 30, 60 or 100 seconds. This background counting time is used for the dose calibrator Zero Background and Moly Assay Background counting time. Adjusting The Background Counting Time: 1.
- Page 58 These labels feature the radiation warning symbol and the word caution printed in the left corner. The 2 up label can be replaced with a 1 up label (not supplied by Biodex). The small strip label can be used to label syringes, syringe shields, etc. Both the large and small label styles print different information depending on the record from which the print function is selected.
- Page 59 Figure 4.63. Label Printing Preferences Screen. Touch <YES> to return to the Dose Calibration Configuration screen without updating the Label Printing Preferences or <NO> to remain on the Label Printing Preferences screen. Source Detection Threshold Figure 4.64. Source Detection Threshold Screen The Source Threshold value determines the system’s response time.
- Page 60 Figure 4.65. Threshold Value – (2-302) Screen Enter a threshold value by touching the desired buttons on the keypad, or use the <▲> and <▼> arrows to increase or decrease the threshold number or touch <Clear> to empty the field and enter a new value using the keypad. Touch <Accept>...
-
Page 61: Systems Maintenance
Volume Decimal Digits This setting is used to determine the number of decimals points, one or two, displayed in volume readings. To Select Volume Decimal Digit Settings: 1. At the Dose Calibrator Configuration screen, touch the Volume Decimal Digits radio buttons to select either 1 or 2 decimal digits. - Page 62 Figure 4.68. The Data Management Screen The Data Management screen offers functions to export and import data from a USB thumb drive for a selected detector or all detectors. The user can also select to delete the results of QA tests as follows: All tests •...
- Page 63 Note: A .csv (Comma Separated Value) file refers to a file in which the fields are separated by commas. A .biodata file is a compressed binary formatted file proprietary to Biodex. Data must be exported in this format if it will be input at a later date. A .csv file cannot be input.
- Page 64 4. Touch <Delete> again to delete the tests. System Backup and Restore To Backup The Atomlab 500 QA Data: 1. Insert a thumb drive into one of the USB ports on the back panel of the display. 2. At the System Backup/Restore screen, touch <Backup to USB>. A message will display noting that the backup is in progress.
- Page 65 The system will prompt to confirm before proceeding with this function. This function allows the user to restore all Atomlab 500 files from a thumb drive backup. NOTE: Restoring the data will overwrite all current stored data, settings, event log, and firmware information.
- Page 66 This shows all events recorded in the dose calibrator for use in determining problems encountered with the system. If needed, this function will be explained by a Biodex Service Representative. Detector Status A screen similar to the following example is displayed when <Detector Status> is touched:...
-
Page 67: Dose Calibrator Operation
5. Dose Calibrator Operation Figure 5.1. Dose Calibrator Measure Screen The Dose Calibrator Program From the Home screen, touch <Dose Calibrator> to access the Dose Calibrator Measure screen. At this screen the system operates as a dose calibrator. A list of isotopes is displayed along with time, date, detector #, measured activity, and Activity Units. -
Page 68: Changing The Selected Isotope
Figure 4.66). Isotope Response Time The Atomlab 500 normally settles within three seconds as long as the minimum threshold level is exceeded. When the source is first lowered into the well, the activity value quickly jumps to the final value. For a few seconds, the value may fluctuate, but the value will settle down to a small variation. -
Page 69: Zero Background
To Adjust The Dial Value: 1. From the measurement screen, touch the displayed isotope name next to the activity measurement. The dial value adjustment screen is displayed. 2. Place the known activity isotope sample into the detector. The activity is displayed on the screen. - Page 70 The Zero Background feature is used to zero the background reading before performing a measurement. The Zero Background screen is accessed by simply pressing <Zero Background> on the display. The isotope displayed is always the last one selected or Tc-99m if no isotope has been selected.
-
Page 71: Select Isotope
Figure 5.8. Dose Calculation Screen The Atomlab 500 allows quick and easy calculation of doses by entering the dose ordered, activity required, and the administration time. If the user has a dose concentration for the vial from which the dose will be drawn, the program also calculates the volume to draw. When the... - Page 72 1. To change the Isotope, touch the name of the isotope displayed in the upper left of the screen. The Choose an Isotope screen is displayed. Figure 5.9. Choose an Isotope Screen. Select any of the displayed isotopes by touching the appropriate button. 2.
- Page 73 9. Touch <Dose Concentration>. The Dose Concentration screen is displayed. Figure 5.10. Dose Concentration Screen The user can perform any of the following functions on this screen: Note: When making entries on the screen and a mistake is made, touch <Clear> on the keypad to remove the data and re-enter the information.
- Page 74 Figure 5.11. Dose Concentration Screen – Resultant Equation after entering the Activity and Volume and Touching <Dose Concentration> Note: Even though the system automatically calculates the Dose Concentration, the user can change the displayed amount. 10. Touch <Accept> to return to the Dose Calculation screen. The <Volume To Draw> for the dose ordered and activity required is displayed as a result of the previous calculation.
-
Page 75: Dose Calibrator Quality Assurance
Each detector must be checked individually. The Atomlab 500 allows entry of the sealed sources into inventory and decay-corrects these sources for time. These sources are used for the testing of the dose calibrator chambers. - Page 76 Cs-137, 200 µCi, is strongly recommended because the 30-year half-life will ensure use of the same source throughout the life of the calibrator and the Cs-137 source is readily available. The Cs-137 source should be replaced at 100 µCi. Figure 6.2. The Daily Constancy Test Screen To Perform A Daily Constancy Test: 1.
- Page 77 Figure 6.4. Zero Background from Constancy Test Screen 4. Place the selected sealed source into the dipper and into the detector. Allow the reading to settle as illustrated in the current activity section of the screen. 5. Touch <Record Reading> to enter the reading. The variance from the decayed calculated standard is shown.
- Page 78 listed staff member. Touch <Accept> to select the staff member and return to the Save Results screen. NOTE: A staff member name must be selected to save the constancy test. 9. Touch <Accept> to save the test results. Figure 6.7. Constancy Screen illustrating Test Results Saved Touch <Measure>...
-
Page 79: Constancy Test History
Constancy Test History Figure 6.9. The Constancy Test History Screen To View Options: 1. Touch <View Options>. The Expanded Constancy Test History View Options screen is displayed. Figure 6.10. Expanded Constancy Test History View Options Screen. 2. Select the sealed source from the drop-down menu. 3. - Page 80 To Delete Data: Use the <▲> and <▼> arrows to scroll to the test to delete. Touch <Delete>. The Delete Stored Test Data screen is displayed. Touch <Accept> to delete the test and return to the Constancy Test History screen. Touch <Cancel> to return to the Constancy Test History screen without deleting the test.
- Page 81 To View Activity Plots: Figure 6.13. The Constancy Activity Plots Screen Touch <Select Activity Plots> to advance to the Constancy Activity Plots screen. A plot of the constancy readings by month is displayed. Use the <▲> and <▼> to toggle between dates. Touch <Print>...
- Page 82 Summary Report: Figure 6.15. Constancy Test Summary Report Detailed History Report: Figure 6.16. Constancy Detailed History Report...
-
Page 83: Geometry Test
From either report, the user has the ability to: Export the data in PDF format. • Print the data to the system assigned or local printer. • To Print Constancy Data Without The Plot: 1. Touch <Print>. The Test data will be printed without the plot. The user can select the starting and ending date for the report. - Page 84 Figure 6.18. Select Isotope Screen 3. Touch <Set Test Parameters>. The Set Test Parameters screen is now displayed. Figure 6.19. The Geometry Set Test Parameters screen. 4. Set the Container Description by touching the <Type>, <Size>, and <Material> icons. <Type> adjusts syringe or vial, <Size> adjusts from 1 to 30 ml, <Material> is glass or plastic.
- Page 85 Figure 6.20. A Geometry Test with data. NOTE: The normalized volume reading is the volume used as the starting point for the calculations. The calculated activity matches the measured activity for the normalized volume and is displayed. The correction factor is 1. All future calculated activity uses this as a start point.
- Page 86 Figure 6.21. Save Results Screen Touch <Staff Member>. The Staff Member List is displayed. Figure 6.22. Select Staff Member Screen Touch to highlight any listed person. (If only one staff member is on the list, the system will default to that person on the Save Geometry Test Data screen.) Touch <Accept>...
-
Page 87: Geometry Test History
the message Test Saved at the bottom. Figure 6.24. Geometry Test Screen with Test Saved Message Touch <Back> to return to the Dose Calibrator Quality Assurance menu. Touch <New Test> to begin a new Geometry Test. Geometry Test History Figure 6.25. The Geometry Test History Screen The Geometry Test History screen displays the Geometry Tests performed on the dose calibrator. - Page 88 Figure 6.26. Delete Stored Test Data Screen To View Details: 1. Touch to highlight and select an Isotope on the Geometry Test History screen. 2. Touch <View Details>. The Geometry Test View Details screen is displayed listing the volume, activity, and container description for the selected isotope. Figure 6.27.
- Page 89 Figure 6.28. A Geometry Test Reports Screen.
- Page 90 2. Touch <Summary History>. Figure 6.29. Geometry Test Summary Report 3. Touch <Detail History>. Figure 6.30. Geometry Test Detail History Report From either report, the user has the ability to: Export the data in PDF format. • Print the data to the system assigned or local printer. •...
-
Page 91: Accuracy Test
Accuracy Test For the Accuracy Test, three readings are completed and averaged. Accuracy means a determination of the dose calibrator’s absolute error resulting from a measurement of a suitable NIST - traceable radionuclide activity. Traceable sources are available from NIST and from many radioisotope suppliers. - Page 92 4. Place the sealed source in the dipper and position it in the dose calibrator detector. When the reading stabilizes, press <Record Reading>. 5. Remove the source from the dose calibrator. Insert the source into the detector again. Press <Record Reading> after the reading has stabilized. 6.
- Page 93 Figure 6.35. Accuracy Test after Test is Saved. 9. Touch <Measure> to go to the Measure screen. 10. Touch <New Test> to perform a New Accuracy Test. 11. Touch <Back> to return to the Accuracy Test screen without saving. 12. Touch <Back> a second time to return to the Dose Calibrator Quality Assurance screen.
-
Page 94: Accuracy Test History
Accuracy Test History The Accuracy Data screen displays the Accuracy Tests performed on the dose calibrator. The data is stored for the detector connected to the system. The display shows all the isotopes for which Accuracy Tests have been completed by the date performed. Any Accuracy Test outside the acceptable variance is shown in red. - Page 95 Figure 6.37. Delete Stored Test Data Screen. Touch <Accept> to delete and return to the Accuracy Test View Details screen, or touch <Cancel> to return to the Accuracy Test data screen. To View Details: 6. Touch <View Details>. The Accuracy Test View Details screen is displayed listing the reading, activity, calculated standard and variance for the selected isotope.
- Page 96 Figure 6.39. Accuracy Test Reports Screen. 2. Touch <Summary History>. Figure 6.40. Accuracy Test Summary Report...
- Page 97 3. Touch <Detail History>. Figure 6.41. Accuracy Test Detail History Report From either report, the user has the ability to: Export the data in PDF format. • Print the data to the system assigned or local printer. •...
-
Page 98: Linearity Testing
The user can change from 30 hours to another time point and perform a normalized calculation from that time point. The Atomlab 500 automated linearity test uses 30 hours as the default method. The average decay method described decay corrects each reading, averages these calculated activities, and divides the average by the time corrected reading to determine a correction factor. -
Page 99: Manual Decay Test
To Access the Linearity Testing Menu: From the QA Dose Calibrator screen touch <Linearity Testing>. The Linearity Testing screen is displayed. Figure 6.43. The Linearity Testing Screen. Select a function from the menu by touching the desired test button. Manual Decay Test Figure 6.44. - Page 100 Figure 6.45. The Manual Decay Test Parameters Screen. Select the variance calculation method, either <Use a Normalized Reading> or <Averaging Method>. If the user selects <Use a Normalized Reading>, the normalized reading is selected at the end of the test. However, if the user selects <Averaging Method>, the system performs the averaging calculation once the test is ended.
- Page 101 • Touch <Set Test Parameters> to select setup options. • Touch <Zero Background> to zero the background reading if necessary. Touch <Start Test> to begin the manual decay test. The Manual Decay Test screen is displayed. Figure 6.47. The Manual Decay Test Screen after Start Test is Selected. Place the source to be used into a dipper and place the dipper with the source into the chamber.
- Page 102 Figure 6.49. Select Normalized Reading Screen. Touch <Accept> to return to the Manual Decay Test screen. Touch <Select Normalized Reading>. The Select Normalized Reading screen is displayed. Figure 6.50. The Manual Decay Test Screen with Test Ended message and data displayed.
-
Page 103: Semi-Automated Manual Decay Test
12. Touch <Measure>to advance to the Dose Calibrator Measure screen. 13. Touch <Back> to return to the Manual Decay Test screen. 14. Touch <Back> a second time to return to the Linearity Testing screen. Semi-Automated Manual Decay Test Figure 6.51. The Semi-Automated Decay Test Screen. The Semi-Automated Decay Test allows the user to begin a linearity test using the automated test method while the activity level is high and switch to the manual test method to complete the test. - Page 104 From the semi-automated decay setup options screen, the user can perform the test using any of several methods including: Normalized reading by hours: allows the user to set the reading interval at a set • number of hours and set the time to be used for the normalized reading. As an example using Tc99m, an appropriate number of hours for a normalized reading would be 30 hours.
- Page 105 Place the Tc-99m, or another short half-life isotope, into the dipper and place the dipper with the source into the detector to perform the linearity test. Touch <Start Test> to record the first reading. The Semi-Automated Switchover to Manual Mode Screen. Figure 6.54.
- Page 106 NOTE: Touch <Pause> at any time during the automated portion to pause the test and allow use of the dose calibrator for counting and other functions, such as choosing <Measure> to return to standard DOSE CALIBRATOR OPERATION. NOTE: When in the manual portion of the test, the user can press <Measure> to display the Measure screen and use the system as a Dose Calibrator.
- Page 107 Automated Decay Test Figure 6.58. The Automated Decay Test Screen. The Automated Decay Test allows the user to set the number of counting points and the interval for each count that will be automatically taken. Once started, the Automated Decay Test will take readings without intervention.
- Page 108 number of hours and set the time to be used for the normalized reading. Normalized reading by half-life of the isotope selected: allows the user to set the • reading interval by half-life and select what half-life reading will be used as the normalized reading.
- Page 109 Figure 6.60. Automated Decay Test Screen displaying Readings. Touch <Measure> to advance to the Measure screen and use the system as a standard dose calibrator. Touch <Return to Decay Test> on the Measure screen to return to the automated decay test. Touch <Resume Test> to resume the Automated Decay Test. NOTE: Remember to place the source back into the detector before selecting <Resume Test>.
-
Page 110: Linearity Automated Decay Test
Figure 6.62. The Save Automated Decay Test Screen. The user can highlight to change what will be used for the normalized reading by touching to highlight a different reading. Touch <Accept> to accept the reading and return to the Automated Decay Test screen. The screen displays a “Test Complete” message. If <Back> is touched, a prompt is displayed noting that recorded data will be lost. -
Page 111: Lineator Initial Test
The first time the Lineator is used with this dose calibrator, initial factors for the Lineator function must be set and the Atomlab 500 must be calibrated for the specific Lineator package using the initial procedure described below. The Atomlab 500 will store the initial factors and print them in the initial factor column of the results table. - Page 112 NOTE: The user must perform a traditional linearity test at the time the initial Lineator Test is performed to prove the calibration is linear. If the initial Lineator Test is performed before the traditional test, the user can perform both tests with one source. To Perform An Initial Lineator Test: From the QA Dose Calibrator menu, touch <Linearity Testing>.
-
Page 113: Lineator Test
Touch <Record Reading> to record the reading for Tube 1 & 2. Continue taking readings by touching <Record Reading> after each new tube or set of tubes is placed in the detector. Touch <End Test> to end the test at any time. Figure 6.66. - Page 114 The Lineator Test should be performed at installation and at least quarterly thereafter. The Atomlab 500 system allows recording of two linearity tests, one less than 55 mCi and one greater than 55 mCi; linearity should be within + or - 5%.
- Page 115 Figure 6.69. Lineator Test – Record Reading Touched. 5. Touch <Record Reading> to record the reading for Tube 1 & 2. 6. Continue taking readings by touching <Record Reading> after each new tube or set of tubes is placed in the detector. 7.
-
Page 116: Calicheck Initial Test
(Also Known As Calicheck Calibration Factor) Figure 6.72. The Calicheck Initial Test Screen. The first time the Calicheck is used with Atomlab 500, calibrator factors for the Calicheck function must be set and the Atomlab 500 must be calibrated for the specific Calicheck package using the initial procedure described below. - Page 117 To Perform An Initial Calicheck Test: From the QA Dose Calibrator menu, touch <Calicheck Initial Test>. The Calicheck Initial Test screen is displayed (see Figure 6.72 ). Touch <Back> to return to the Linearity Testing screen. • Touch <Zero Background> to zero the background reading if necessary. •...
-
Page 118: Calicheck Test
Figure 6.75. Calicheck Initial Test Screen – Test Complete. Touch <Save>. If the appropriate staff member is not displayed, touch <Staff>. Touch any line on the display to highlight the staff member. Touch <Accept> to return to the Save Results screen. - Page 119 thereafter. To Perform A Calicheck Linearity Test: From the QA Dose Calibrator menu, touch <Linearity Testing>. The Linearity Testing screen is displayed. Touch <Calicheck Test>. The Calicheck Test screen is displayed. • Touch <Back> to return to the Linearity Testing screen. •...
-
Page 120: Linearity Test History
NOTE: Make sure the correct tube combination has been selected, as highlighted on the display. Touch <Save>. If the appropriate staff member is not displayed, touch <Staff>. Touch any line on the display to highlight the staff member. Touch <Accept> to return to the Save Results screen. - Page 121 Figure 6.80. Decay Test History Screen. Touch <Back> to return to the Linearity History screen. To View the Decay Options: 1. Touch <View Options> from the Decay Test History screen. The Decay Test View Options screen is displayed: Figure 6.81. Decay Test History View Options Screen. 2.
- Page 122 3. Touch <Back> to return to the Linearity History screen. To Delete Data: Touch <Delete Data>. The Delete Stored Test Data confirmation screen is displayed: Figure 6.83. Delete Stored Test Data Screen. Touch <Accept> to delete the current test. Touch <Cancel> to return to the Decay Test History screen. To View Details: 1.
- Page 123 To View Decay Plots: 1. Touch <View Decay Plots> to advance to the Linearity Decay Plots screen. A plot of the selected linearity test will be displayed. Figure 6.85. Linearity Decay Plots Screen. 2. Use the <▲> and <▼> to toggle between dates. 3.
- Page 124 To View Reports: 2. Touch <Reports> to view the tests desired. The Decay Test Reports screen is displayed. Figure 6.87. Decay Test Reports Screen. The user has the option to view either a Summary or a Detailed History report. Summary Report Figure 6.88.
-
Page 125: Lineator T E S T History
Detailed Report Figure 6.89. Decay Test Detail History Report. From either report, the user has the ability to: Export the data in PDF format. • Print the data to the system assigned or local printer. • Lineator T e s t History Figure 6.90. - Page 126 To View the Linearity Test Options: 1. Touch <View Options> from the Linearity Test History screen. The Linearity Test View Options screen is displayed: Figure 6.91. Linearity Test History View Options Screen. 2. Select an entry from the Date Range field: Touch <Cancel>...
- Page 127 Figure 6.93. Delete Stored Test Data Screen. Touch <Accept> to delete the current test. Touch <Cancel> to return to the Decay Test History screen. To View Details: 1. Touch a specific line on the Linearity Test History screen to highlight the information. 2.
- Page 128 Figure 6.95. Decay Test Reports Screen. The user has the option to view either a Summary or a Detailed History report. Summary Report Figure 6.96. Linearity Test Summary Report.
- Page 129 Detailed Report Figure 6.97. Linearity Test Detail History Report. From either report, the user has the ability to: Export the data in PDF format. • Print the data to the system assigned or local printer. •...
-
Page 130: Calicheck Test History
Calicheck Test History Figure 6.98. The Calicheck Test History Screen. The Calicheck Test data screen displays the Calicheck Linearity Tests performed on the dose calibrator. The Calicheck Test data screen displays the tests performed on the dose calibrator. The display lists individual tests with the most recent test as the default. - Page 131 Touch <Cancel> to return to the Decay Test History screen without making any changes. 4. Touch <Accept> to change the view options and return to the Calicheck Test History screen. Figure 6.100. Calicheck Test History Screen – Updated View Options. 5.
- Page 132 To View Details: 1. Touch a specific line on the Calicheck Test History screen to highlight the information. 2. Touch <View Details>. The Calicheck Test View Details screen is displayed. Figure 6.102. Calicheck Test View Details Screen. 3. Touch <Print> in the upper right of the screen to print the displayed test details. 4.
- Page 133 Summary Report Figure 6.104. Calicheck Test Summary Report. Detailed Report Figure 6.105. Calicheck Test Detail History Report. From either report, the user has the ability to: Export the data in PDF format. • Print the data to the system assigned or local printer. •...
-
Page 134: Nuclear Pharmacy
Nuclear pharmacy, also known as radiopharmacy, involves preparation of radioactive materials for patient administration that will be used to diagnose and treat specific diseases in nuclear medicine. The Atomlab 500 system is used to verify the radioactivity of a radionuclide before administration to the patient. - Page 135 Figure 7.3. The Moly Assay Zero Background reading. To Perform A Moly Assay: At the Home screen, touch <Nuclear Pharmacy>. The Nuclear Pharmacy screen is displayed (see Figure 7.1). Touch <Moly Assay>. The Moly Assay Zero Background Reading screen is displayed (see Figure 7.3).
- Page 136 Figure 7.5. Background Time Screen. Three radio buttons are displayed on the screen; one for 30, one for 60, and one for 100 seconds. Touch the desired time to highlight it and touch <Accept>. The Moly Assay screen will be displayed with the new background counting time. NOTE: When the background counting time is changed, it changes the Moly Background Time and the Dose Calibrator background counting time.
- Page 137 Figure 7.7. Moly Assay Screen with Record Reading Option Displayed. 10. Press <Accept> to return to the Moly Assay screen to count the vial or syringe of Tc-99m without the Moly Shield. Figure 7.8. Moly Assay Screen with Record Reading Complete Message. NOTE: To recount the Moly, touch <Record Reading>...
-
Page 138: Half Life Verification
Figure 7.9. Moly Assay with Remove Moly Shield from Detector Message. 12. Touch <Record Reading> to record the Tc-99m activity. The Moly Assay Results screen is now displayed giving the Moly concentration of µCi Mo/mCi Tc-99m. Figure 7.10. Moly Assay with Concentration Displayed. NOTE: You must manually record this information. - Page 139 the system-listed isotope Half Life. It is the user’s responsibility to determine if this variance is acceptable. Half Life Verification Application The Half Life Verification Application allows the user to select the isotope, set test parameters; select either two or three readings, and set the elapsed time between the readings. The time can be set between 1 minute and 60 minutes.
- Page 140 5. To select the isotope use the scroll arrows to locate the desired isotope, touch the isotope name to highlight it, and touch <Accept>. The selected isotope is displayed on the Half Life Verification screen including the system defined Half Life. Figure 7.13.
- Page 141 Figure 7.15. Half Life Verification Screen Ready for Test. 11. If desired, touch <Zero Background> along the bottom menu. The Zero Background screen is displayed. Figure 7.16. Zero Background Screen. Touch <Zero Background> and the background count will begin. If there has been no activity in the chamber, a “Completed”...
- Page 142 Figure 7.18. Half Life Verification Screen – Test Aborted Message. A new test can be started by touching <New Test>. The system returns to the Half Life Verification screen. The test parameters or isotope can be changed at this point. 15.
- Page 143 Figure 7.20. Message Displayed when Back is Touched. Touch <Cancel> not to exit; select <Accept> to exit and lose the test data. 18. If another Half Life Verification is started, the user must select <Set Test Parameters>, review the parameters, make any required changes, and touch <Accept>. After this has been performed, another test can be started.
- Page 144 Figure 7.22. Save Results Screen. 21. If the appropriate staff member is not displayed, touch <Staff>. The Select Staff Member List is displayed. Figure 7.23. Select Staff Member Screen. Touch any line on the display to highlight the staff member. If a staff member has previously been selected, the system will default to that person.
- Page 145 Figure 7.25. Dose Calibrator Measure Screen. 23. Touch <Back> to return to the Nuclear Pharmacy screen. 24. Touch <Home> to return to the Main Atomlab Menu.
-
Page 146: Half Life Verification History
Half Life Verification History Figure 7.26. Half Life Verification History. The Half Life Verification History screen displays the Half Life Verification Tests performed on the dose calibrator. The display lists individual tests with the most recent test as the default. Use the <▲> and <▼> to scroll to view the test results desired. Touch <Back>... - Page 147 4. Touch <Accept> to record the selected criteria or <Cancel> to return to the Half Life Verification History screen without recording the criteria. To Delete Data: Touch <Delete>. The Delete Stored Test Data confirmation screen is displayed: Figure 7.28. Delete Stored Test Data Screen. Touch <Accept>...
- Page 148 Formulas for Calculating Half Life d = measurement d start = starting measurement d end = ending measurement !"# !" !.!" × ! !"#$ Calculate Half Life = !"# !" ! !"#$" ÷ ! !"# Example for F-18: Starting measurement: 4122 Ending measurement:...
- Page 149 To Print the Report: 1. Touch the print icon at the top, right of the screen. The print screen is displayed. From the screen, the user has the ability to: Export the data in PDF format. • Print the data to the system assigned or local printer. •...
- Page 150 Future Dose Calculation Figure 7.31. The Future Dose Calculation screen. The Atomlab 500 allows quick and easy calculation of future doses by entering the dose ordered and the administration time. If the user has a dose concentration for the vial from which the dose will be drawn, the program also calculates the volume to draw.
- Page 151 3. Touch <Dose Ordered> to display a keypad to enter the Dose Ordered activity screen. Figure 7.33. Dose Ordered Screen. Enter the desired activity of the dose at the time it is to be administered. Touch <Accept> to return to the Future Dose Calculation with the administered dose activity displayed. 4.
- Page 152 Figure 7.34. Dose Concentration Screen. The user can perform any of the following functions on this screen: a. Units of Concentration: Touch the appropriate radio button to change the unit of activity. b. Date: Touch any of the fields (Month, Day, Year) and use either the keypad at the right of the screen or the <▲>...
- Page 153 Figure 7.35. Dose Concentration Screen – Resultant Equation after entering the Activity and Volume and Touching <Dose Concentration>. Note: Even though the system automatically calculates the Dose Concentration, the user can change the displayed amount and the system will readjust the Activity Required and the Volume to Draw on the Future Dose Calculation screen to reflect that change as illustrated below.
- Page 154 Figure 7.38. Future Dose Calculation Screen Illustrating Result of User Entering the Dose Concentration. 9. Touch <Accept> to return to the Future Dose Calculation screen. 10. Place the drawn dose into the detector to confirm the activity drawn in the syringe. 11.
- Page 155 To Print Labels: 1. Touch <Print Labels> icon in the upper right of the Future Dose Calculation screen to generate a label if a label printer is connected. Figure 7.39. Future dose labels showing Dose Ordered, volume to draw and measured activity.
-
Page 156: Specifications
8. Specifications All-In-One Flat Panel Display: 10.8" Color Touch-Screen, Windows 10 Operating System and USB connectivity. Dimensions: 11" w x .375" depth x 7" (28 x 1 x 18 cm) Line Voltage: 100 to 240 VAC, auto selectable by the power supply Line Frequency: 50/60 Hz, detachable line cord, built-in EMI filter and transient suppression Auxiliary Port: Two USB ports, one RS-232 port Isotope Selection Keys: Twelve pre-programmed –... -
Page 157: Electromagnetic Compatibility
The Atomlab 500 should not be used adjacent to or stacked with other equipment. If the ● Atomlab 500 is used while positioned adjacent to other equipment, it should be observed to verify normal operation in the configuration in which it will be used. - Page 158 Manufacturer’s Declaration Electromagnetic Emissions The Atomlab 500 is intended for use in the electromagnetic environment specified below. The customer or the user of the Atomlab 500 must ensure that it is used in such an environment. Table 9.3. Emission Test Table.
- Page 159 UT) for 5 cycle it is recommended that the power supply 70% UT (30% of dip 70% UT (30% of dip Atomlab 500 is powered from input lines in UT) for 25 cycle in UT) for 25 cycle an uninterruptible power IEC 61000-4-11 <...
- Page 160 If the measured field strength in the location in which the Atomlab 500 is used exceeds the applicable RF compliance levels above, the Atomlab 500 should be observed to verify normal operation. If abnormal performance is observed, additional measures may be necessary, such as reorienting or relocating the Atomlab 500.
- Page 161 RF communication equipment (transmitters) and the Atomlab 500 as recommended below, according to the maximum output power of the communication equipment. Table 9.5 Separation Distance Table Rated Maximum Separation Distance According to Frequency of Transmitter [m] Output Power of 150 kHz to 80 MHz 80 MHz to 800 MHz 800 MHz to 2.5 GHz...
-
Page 162: Parts And Assembly Instructions
10. Parts and Assembly Instructions TBD. -
Page 163: Appendix A: Troubleshooting Procedures
The power pack converts wall power from 100V to 230V to the correct voltage for the dose calibrator. If the system still does not power up, call the Biodex Customer Service Department. Fluctuations in Activity Measurements: When the system is displaying activity for the more common isotopes, the electrometer continuously averages the data it receives from the detector. - Page 164 value of 37.1) is approximately ±0.05 µCi. For an isotope requiring a calibration value of 500 (for P-32, it is 530), the fluctuation is ±0.5 µCi or more. Mo-99 Fluctuations: The Atomlab Dose Calibrator begins averaging display data the moment the Moly Assay screen is touched.
-
Page 165: Appendix B: Atomlab Display Diagnostics
Appendix B: Atomlab Display Diagnostics Overview The new generation Atomlab 500 has real-time monitoring of the detector statuses. The detectors have real-time self-tests; the results of which are reported back to the display approximately once per second. Dose calibrator detectors and well counters are the two types of detectors supported. - Page 166 Table B.1. Error Codes, Error Class Descriptions, and Class Definitions Pass/Warning/Fail Code Class Description Definition Pass No Reported Problems – no errors in effect, ready for measuring activity. Fail Firmware Checksum The chamber’s firmware has a checksum pre- calculated and stored, and it is verified during chamber power up.
- Page 167 Dose Calculator Status Displays The following table contains a list of the Status Displays for Dose Calibrators: Table B.2. Dose Calculator Status Display Table Display Description Warming Up The detector is in a power warm-up state. Count down: Initializing Initial background reading •...
-
Page 168: Appendix C: Atomlab 500 Dose Calibrator Specifications
Appendix C: Atomlab 500 Dose Calibrator Specifications Overview Appendix C provides the physical and operating specifications of the Atomlab 500. Measurement Range: For Tc-99m, 0.01 µCi to 100 curies, auto-ranging or 25 curies of F-18. Display Ranges: Units are user selectable: Table C.1. - Page 169 Note: Intercomparison of calibrated sources and the Atomlab 500 requires combining the uncertainties of both the Atomlab 500 and the calibrated source to determine expected agreement. Detector Linearity: Within 1% or 0.2 µCi, whichever is greater. Electrometer Linearity: Within 1% or 0.2 µCi, whichever is greater, up to 40 curies of Tc-99m, ± 1.5% up to 100curies of Tc-99m.
- Page 170 Temperature: 10 - 30°C. Humidity: 0 to 90% rh, non-condensing. For optimum performance, the Atomlab 500 should be operated in a normal laboratory environment where the temperature and humidity are maintained for normal human comfort and the ambient radiation level is low and constant.
- Page 171 Detector Cable Length: Standard: 3 ft (.9 m). Custom: Custom cable lengths up to 20 meters are available. Conductors: There are six in total; two for power, two for chassis ground, two for serial data. Connectors: RJ-12. Auxiliary Port: RS-232 Connector USB Ports (3).
-
Page 172: Appendix D: Decay Calculations
Appendix D: Decay Calculations Appendix D has three distinct sections. The first section provides two methods of performing Decay Calculations, the second section contains the Decay Factor Chart, and the third section explains how the procedures from the first section and the Decay Factor Chart from the second are generated. - Page 173 ! !/! �� = �� × 2 !!.!!"" �� = 43 ������ × 2 !.!!" !!.!"#$"% �� = 43 ������ × 2 �� = 43 ������ ×0.903 �� = 38.83 ������ Alternate Decay Calculation Method When using a calculator with a Y function:...
- Page 174 Replace the equation with following: A = A (0.8833/6.007) A = 43 mCi / 2 (0.1470451) A = 43 mCi / 2 43 mCi / 1.1072992 A = 38.83 mCi Decay Factor Method The following method is used to perform radioisotope decay calculations using a calculator without the e function: 1.
- Page 175 Table D.1. e Function Calculations !�� �� �� = �� �� 0.25 0.125 0.0625 0.03125 0.01563 0.007813 0.003906 0.001953 0.000977...
- Page 176 Table D.2. Decay Factor Chart Decay Factor Chart (R), where R = t ÷ T (0.000 to 0.499) .000 .001 .002 .003 .004 .005 .006 .007 .008 .009 1.00000 0.99931 0.99861 0.99792 0.99723 0.99654 0.99585 0.99516 0.99447 0.99378 0.99309 0.99240 0.99172 0.99103 0.99034...
- Page 177 Decay Factor Chart (R), where R = t ÷ T (0.500 to 1.0) .000 .001 .002 .003 .004 .005 .006 .007 .008 .009 0.70711 0.70662 0.70613 0.70613 0.70564 0.70515 0.70466 0.70417 0.70368 0.70320 0.70222 0.70174 0.70125 0.70125 0.70076 0.70028 0.69979 0.69931 0.69882 0.69834...
- Page 178 Decay Calculation Methods – An Explanation Calculator Method The radioactivity of an isotope can be calculated as it decays using the following expression: !" �� Where: = final activity at the end of the decay time; = initial activity measured at the specified starting time; t = net decay time in units inverse to ��, and ��...
- Page 179 Given: t = 32.5 hours, and T = 6.007 hours; t ÷ T = 32.5 ÷ 6.007 = 5.410 Solving for N and R: N = 5 R = 0.410. To simplify the calculations, the above relation can be written as: !!"...
-
Page 180: Appendix E: Calibration Values
Appendix E: Calibration Values Table E.1. Calibration Value Chart DIAL V ALUE L IST F OR 5 00 C HAMBERS -‐ 8 /31/2017 Nuclide Dial Decay Avg B eta Half-‐Life Expected ... - Page 181 DIAL V ALUE L IST F OR 5 00 C HAMBERS -‐ 8 /31/2017 Nuclide Dial Decay Avg B eta Half-‐Life Expected Cont. Notes Value Scheme Energy Uncertainty (keV) Eu-‐152...
- Page 182 DIAL V ALUE L IST F OR 5 00 C HAMBERS -‐ 8 /31/2017 Nuclide Dial Decay Avg B eta Half-‐Life Expected Cont. Notes Value Scheme Energy Uncertainty (keV) Mo-‐99...
- Page 183 DIAL V ALUE L IST F OR 5 00 C HAMBERS -‐ 8 /31/2017 Nuclide Dial Decay Avg B eta Half-‐Life Expected Cont. Notes Value Scheme Energy Uncertainty (keV) Sr-‐85...
- Page 184 Dial Value Settings and Source Containers (Glass Vial, Glass Syringe, etc.) The Atomlab Dial Value (DV) settings enable the software to convert ion chamber current into a displayed activity value for the isotope corresponding to the DV selected. The displayed activity value is directly proportional to the DV.
- Page 185 As stated. Dial Settings for Y-90 The typical Atomlab 500 Dose Calibrator dial setting for Y-90 activity in a 10 cc plastic syringe is 350. This value can be used as a starting point for initial measurements. However, it is recommended that the dial setting used for clinical measurements is determined from the first dose of Zevalin received from the radiopharmacy as outlined below.
- Page 186 (CCPE). If the sum of the errors is in the range of -2% to +2%, use the new dial value. If not, contact Biodex Technical Support. The user may also want to contact the radiopharmacy to determine if a calibration error may have occurred.
-
Page 187: Appendix F: Atomlab Dose Calibrator Calibration And Traceability
Appendix F: Atomlab Dose Calibrator Calibration and Traceability This appendix describes the calibration procedures performed on the Atomlab Dose Calibrator and the traceability to the National Institute of Standards & Technology. Calibration & Traceability The calibration of the Atomlab Dose Calibrators is directly traceable to the National Institute of Standards &... -
Page 188: Appendix G: Atomlab 500 And 500Plus Serial Communications Interface
Appendix G: Atomlab 500 and 500Plus Serial Communications Interface The Atomlab 500 has the ability to be controlled and monitored, with limitations, via the DiN RS-232 serial port. Connection Details Cable: RS-232 DiN/Female for connection to a standard PC COM port. - Page 189 When this command is received, the Zero Background screen is displayed. DCNT Display the number of active, connected detectors. It should be 1 for an Atomlab 500 or Wipe Test Counter, 2 for an Atomlab 500Plus, or 0 if no detectors were found to be connected.
- Page 190 HELP Same as the ? command. It displays all available commands with a brief description. Available commands are: Command Description BAUD # Set the BAUD Rate, where: 1 = 19K • 2 = 38K • 3 = 56K • 4 = 115K. •...
- Page 191 Note: Reference the Isotope Index # Table for programming. MODEL Displays the abbreviated model name as follows: Atomlab 500 = 500 • Atomlab 500Plus = 500W • Wipe Test Counter = WIPE.
- Page 192 REQDATA {QAType} {Locationtype} {Date Range} This command requests stored QA test results by filtering on the type and date range. It can be used for backup or archival purposes. The filtering parameters are: 1. QA Type: • Daily and Expanded Constancy •...
- Page 193 WideWindow, Cs-137, 40 DPM, 20000 DPM, Ok, 35.24, 25-800 keV Where: Cs-137 = the isotope name assigned for the wide window. 40 DPM = the wide window net count in DPM. 14.0 = the wide window net count in CPM. 1039 DPM = Background CPM for the wide window.
- Page 194 STAT {1/0} This is for more advanced detector status viewing. The command will turn on an on-screen display of detector status on the <Measure> function; (1=Set On, 0=Turn Off). If no parameter is given, a detailed state of the current connected detectors is displayed. Displays the Atomlab Display Unit’s application software version.
-
Page 195: Appendix H: Atomlab 500 Isotope Index
Appendix H: Atomlab 500 Isotope Index Index Symbol Index Symbol C-11 Sb-124 N-13 I-125 O-15 Xe-127 F-18 I-131 Na-22 Ba-133 P-32 Xe-133 K-38 Cs-134 K-43 Cs-137 Sc-46 La-140 Cr-51 Ce/Pr-144 Fe-52 Pm-149 Fe/Mn-52 Eu-152 Co-55 Gd-153 Co-57 Sm-153 Co-58 Sm-156... - Page 196 Determining Dial Values Because the dose calibrator is not inherently capable of detecting what radioisotope has been inserted in the re-entrant detector, the user must select the isotope currently being measured. Each radioisotope selection has a corresponding calibration value (also referred to as a dial value for historical reasons).
- Page 197 Figure G.1. Atomlab Photon Sensitivity Curve. The accuracy for dial value calculation depends upon not only the accuracy of the sensitivity curve and the photon emission intensity data, but also upon the sample configuration, due to low energy photon absorption. The photon sensitivity curve displayed in Figure G.1 is for sources with configurations similar to the NIST ampoule configuration discussed above.
- Page 198 susceptible to errors caused by low energy photon absorption. In cases where a container has a wall thickness or material significantly different from the NIST standards used above, it is recommended that a correction factor or corrected dial value be used to correct for the difference in absorption between the NIST configuration and the configuration used in clinical practice.
-
Page 199: Appendix I: Atomlab 500 Dose Calibrator Replacement Parts
Appendix I: Atomlab 500 Dose Calibrator Replacement Parts Part Number Part Description C13116 Power Supply C11789 Cord Set 086-241 Well Insert 086-242 Well Vial/Syringe Dipper 086-330-E705 Chamber Cable C8187 Bumpons, Self Adhesive, Grey... -
Page 200: Appendix J: Quality Assurance Testing Of Atomlab Calibrators (Manufacturer's * Instructions)
Instructions) Introduction The following procedures are the manufacturer’s instructions for qualifying Atomlab 500 and Atomlab 500Plus Dose Calibrators in accordance with NRC regulation 10 CFR 35.60 of 1 January, 2016 (or applicable agreement State Regulation). Use of these instructions outside of the United States may require modification in order to satisfy local regulations. - Page 201 Constancy Constancy means reproducibility in measuring the same source over a period of time with decay correction. Assay a relatively long-lived source (such as Cs-137) each day before using the calibrator. Cs-137 100 µCi minimum activity is strongly recommended because the 30-year half life will assure use of the same source throughout the life of the calibrator, and it is readily available.
- Page 202 3. Assay the container with the isotope source material and record the result as (Container Activity). 4. Assay the partial or empty plastic syringe for residual activity and record the result as (Plastic Syringe Activity) 5. Calculate the Container Dial Value for the type of container used with the isotope assayed in that type of container as follows: ������...
- Page 203 The time can be changed from 30 hours to another and the normalized calculation can be performed from that time point. Note: The Atomlab 500 automated linearity test uses 30 hours as the default normalized reading.
- Page 204 ) without including failing values from low (M) M0-99 contamination. 5. If ���� < 0.90 or > 1.10, contact Biodex technical support and provide full details including all linearity decay data. Attenuation Tube Method or Sleeve Test Method: If it is decided to use a set of sleeves of various thicknesses or a combination of sleeves to test for linearity, it is necessary to first use the Decay Method to ensure the calibrator is linear.
- Page 205 Atomlab Dose Calibrator Linearity Test, Model: Serial Number: Date Time Activity Measured, M Hours elapsed, t = Avg/M Accept if 0.95 < Avg / M < 1.05 Figure J.1. Sample Dose Calibrator Linearity Data Collection Form.
- Page 206 Geometry Geometry Independence means that the indicated activity does not change with volume or configuration of the source material. The test is performed using a syringe that is normally used for injections. The following test assumes injections are performed with 3ml plastic syringes and radio pharmaceutical kits are made in 30 ml glass vials.
- Page 207 make sure the table is labeled syringe geometry dependence and note the date of the test as well as the model number and serial number of the dose calibrator. Example of a 10 ml Vial Test: 1. To test the geometry dependence for a 10 ml glass vial, draw 1.0 ml of Tc-99m solution (between 1 and 10 mCi/ml) into a syringe and inject it into the vial.
- Page 208 Atomlab Dose Calibrator Geometry Test, Model: Serial Number: Decay correct if test not completed in 10 min. Syringe: Type Volume Volume cf = Avg/ Volume cf = Time Volume (Activity) (Activity) Normalized (Activity) Avg: Atomlab Dose Calibrator Geometry Test, Model: Serial Number: Decay correct if test not completed in 10 min.
- Page 209 Accuracy Accuracy is defined as a determination of the dose calibrator’s absolute error resulting from a measurement of a suitable NIST-traceable radionuclide activity. Traceable sources are available from NIST and from many radioisotope suppliers. At least two sources with different principal photon energies (such as Co-57, Co-60, Cs-137, or Ba-133) should be used.
- Page 210 Note: The Dial Value check is used to verify that no one has accidently changed the Dial Value from the factory setting or the appropriately determined facility setting. Repair or Replacement Consider repair or replacement if the dose calibrator falls outside the suggested tolerances. If repair or replacement is required, contact Biodex Medical Systems, Inc. for instructions.
Need help?
Do you have a question about the ATOMLAB 500 and is the answer not in the manual?
Questions and answers