Table of Contents
Advertisement
Quick Links
Advertisement
Table of Contents
Troubleshooting

Related Manuals for Tektronix DPO75902S


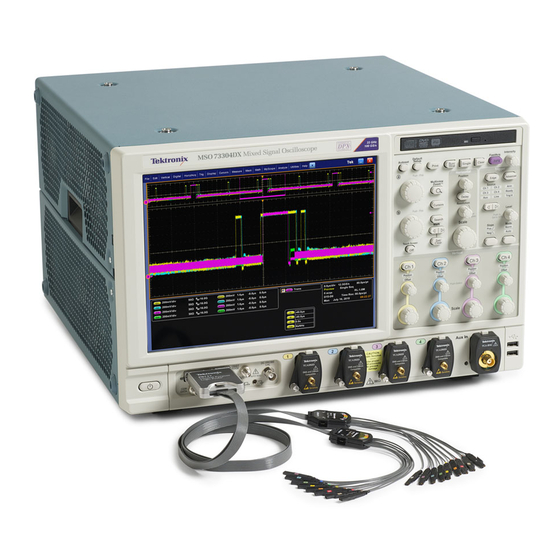
Summary of Contents for Tektronix DPO75902S
- Page 1 Tektronix Digital Phosphor Oscilloscopes Printable Help *P077006219* 077-0062-19...
- Page 3 Tektronix Digital Phosphor Oscilloscopes Printable Help www.tek.com 077-0062-19...
- Page 4 Tektronix. All rights reserved. Licensed software products are owned by Tektronix or its subsidiaries or suppliers, and are protected by national copyright laws and international treaty provisions. Tektronix products are covered by U.S. and foreign patents, issued and pending. Information in this publication supersedes that in all previously published material. Specifications and price change privileges reserved.
-
Page 5: Table Of Contents
Support information ..........................TekScope recovery report utility ......................Feedback ..............................Analysis and connectivity support ......................About TekScope ............................. Working with your Tektronix oscilloscope ....................Windows environment ..........................Oscilloscope interface ..........................Basic operations ............................. Multi-instrument configuration ........................ DPO7AFP Auxiliary Front Panel (optional) .................... - Page 6 Table of Contents Cursor setups Cursor setup control window (YT display format) ..................Cursor type control window .......................... Cursor sources (YT display) ......................... Cursor style ..............................Cursor position control window ........................Horizontal bar cursors ..........................Vertical bar cursors ............................Waveform cursors ............................
- Page 7 Table of Contents Set up a custom serial bus ......................... Set up a PCIe serial bus ..........................Set up a CAN serial bus ..........................Set up a LIN serial bus ..........................Set up a FLEXRAY serial bus ........................Set up a MIL-1553 serial bus ........................
- Page 8 Table of Contents Opening a bus symbol table file ......................... MagniVu setup Using MagniVu ............................Display setups Display control window (Appearance tab) ....................Display control window (Screen text tab) ....................Text properties control window ........................Display control window (Objects tab) ......................
- Page 9 Table of Contents FastFrame control windows ........................Set up zoom ............................... Error detector setups Use the serial error detector ........................Set up the serial error detector ........................Set error detector advanced settings ......................Specify the error detector test pattern ......................Set the error detector stop condition ......................
- Page 10 Table of Contents Set the mask polarity ..........................Set mask test repeat controls ....................... Fail results setup ............................Mask testing control window (Pass-Fail results tab) ................View the mask test summary ....................... View the mask hits per segment ......................Start or reset a mask test ........................
- Page 11 Table of Contents Eliminate aliasing ..........................Math equation editor ..........................Math equation editor control window ....................Math equation editor (Time tab) ......................Math equation editor (Spectral tab) ...................... Math equation editor (Var tab) ......................Math equation editor (Meas tab) ......................Math equation editor (Filter tab) ......................
- Page 12 Table of Contents View search marks ............................. Set the search mode ..........................Use search and mark controls ........................Control user marks in table ........................Change mark display digits ........................Export a mark table ............................ View mark counts ............................Set up a visual search ..........................
- Page 13 Table of Contents Set up the trigger holdoff ..........................Set to 50 ..............................A event triggers ............................Set up a parallel bus trigger ......................... Set up an 8B10B bus trigger ........................ Set up an I2C bus trigger ........................Set up an SPI bus trigger ........................
- Page 14 Table of Contents B event trigger ............................Set up trigger controls (B event tab) ..................... Visual triggering ............................Visual trigger ............................Create a visual trigger area ........................Control visual triggering ........................Define an area ............................Edit expression logic ..........................Set up visual trigger expression ......................
- Page 15 Table of Contents Probe setup control window (Probe tip selection) ..................Probe setup control window (Probe deskew) ..................... Probe setup control window (Probe attenuation) ..................Probe controls window ..........................Probe properties ............................Probe setup control window (Probe status) ....................Signal path compensation ..........................
- Page 16 Table of Contents Print setups ..............................Print setups ............................Saving ................................ Save as dialog box (Histogram) ......................Save as dialog box (Instrument setup) ....................Save as dialog box (Measurement) ...................... Save as dialog box (Screen capture) ....................Save as dialog box (User mask) ......................
- Page 17 Table of Contents How to ? Calibrating and using probes ........................Compensate the signal path ......................... Compensate active probes ........................Compensate passive probes ........................ Low frequency compensate a probe ....................Deskew ..............................Acquiring analog signals ..........................Setting up analog channels ........................
- Page 18 Table of Contents Editing MyScope control windows ......................Taking measurements ..........................Select cursor sources ........................... Taking cursor measurements ....................... Taking automatic measurements ......................Take automatic measurements ......................Localize a measurement ........................Save measurements ..........................Creating and using math waveforms ......................Using math waveforms .........................
- Page 19 Table of Contents Using roll mode ............................Set up roll mode ........................... Using roll mode ............................ Triggering ..............................Checking trigger status ......................... Set up triggering from the front panel ....................Set up triggering from the trigger setup window ................... Trigger on a sequence .........................
- Page 20 Table of Contents Delete instrument setups ........................Using the programmer online guide ......................Programmer online help ........................Using application software ......................... Oscilloscope applications software ...................... Add a software application to the instrument ..................Setting up a dual display ..........................Set up a dual display ..........................
- Page 21 Table of Contents Trigger function ............................Triggering concepts ..........................Trigger sources ............................ Trigger types ............................Trigger modes ............................Trigger holdoff ............................Trigger coupling ............................ Trigger slope and level ......................... Horizontal trigger position ........................Delayed trigger system ......................... Advanced triggering ..........................Bus trigger ............................
- Page 22 Table of Contents Measurement variables ........................Measurement algorithms ........................Measurements on envelope waveforms ....................Missing or out-of-range samples ......................Measurement warnings ........................Measurement errors ..........................Cursor types ............................Histograms ............................Typical math waveforms ........................Math waveforms ........................... Math waveform differentiation ......................
- Page 23 Table of Contents Output ................................ Saving and recalling setups ......................... Saving and recalling waveforms ......................Saving and copying waveform data ..................... Miscellaneous ............................ACos ..............................Acquisition interval ..........................Acquisition window ..........................Active probes ............................Amplitude ............................. Analog oscilloscope sweeps ........................ Area ..............................
- Page 24 Table of Contents Data threshold ............................Dead time between acquisitions ......................Delay edges ............................Delay ..............................Trigger delay ............................Trigger events ............................Select digital input iCapture ........................Set up trigger path alignment ....................... Set logic properties ..........................Set the logic thresholds ........................
- Page 25 Table of Contents Histogram box limits - horizontal ......................Histogram box limits - vertical ......................Histogram box location - horizontal ...................... Histogram box location - vertical ......................Histogram max ............................. Histogram mean ........................... Histogram min ............................Hits in box ............................. Maximum ..............................
- Page 26 Table of Contents Logic pattern ............................Logic pattern inputs ..........................Logic pattern trigger criteria ........................Logic pattern and state pattern editor (bus tab) ................... Logic pattern and state pattern editor (digital tab) ................Logic clock inputs ..........................Logic pattern format ..........................
- Page 27 Table of Contents Set the FastFrame analyze tab controls ....................Set up FastFrame setup tab controls ....................Set up FastFrame view tab controls ..................... Select waveform save options ......................CSV text format ............................ Set mask test controls .......................... Set up a delay measurement .......................
- Page 28 Table of Contents Scallop loss ............................Selecting a spectral window ......................... Selected waveform versus deselected waveform ................Sequence triggering (horizontal delay on) .................... Change the serial bit rate ........................Select the serial clock source ....................... Select the serial coding standard ......................
- Page 29 Table of Contents Trigger holdoff (Time) ........................... Set the trigger level ..........................Select the trigger on options ......................... Select the bus trigger on data ......................Select the glitch trigger polarity ......................Set the trigger qualification ........................Set the trigger occurs and qualification ....................
- Page 30 Table of Contents Set the parallel bus pattern ........................Bus pattern editor (Bus tab) ......................... Bus pattern editor (Bus tab) ......................... Bus pattern editor (Logic tab on MSO series) ..................Bus pattern editor (Live tab) ......................... Bus pattern format ..........................Bus trigger on selections ........................
-
Page 31: Introduction
Introduction This Tektronix oscilloscope provides the performance, simplicity, and connectivity needed for the ever-changing electronics, computer, and communications industries. The easy-to-use interface includes a large display and a touch-screen interface on a Microsoft Windows platform. Choose the methods of controlling oscilloscope operations that are most convenient for you: ■... - Page 32 Introduction xxviii DPO70000SX, MSO/DPO70000DX, MSO/DPO70000C, DPO7000C, and MSO/DPO5000B Series...
-
Page 33: About Tektronix Oscilloscopes
About Tektronix oscilloscopes Product description This online help supports the following series of Tektronix Digital Phosphor oscilloscopes: ■ DPO70000SX Series ■ MSO70000DX and DPO70000DX Series ■ MSO70000C and DPO70000C Series ■ DPO7000C Series ■ MSO5000B and DPO5000B Series NOTE. The features and options that are documented in this online help are available for several instrument models. Your instrument may not have every feature discussed. - Page 34 About Tektronix oscilloscopes DPO7054C, DPO7104C, DPO7254C, and DPO7354C: 500 MHz, 1 GHz, 2.5 GHz, 3.5 GHz models with up to 20 GS/s ■ real-time sampling rate on two channels DPO5034B, MSO5034B, DPO5054B, MSO5054B, DPO5104B, MSO5104B, DPO5204B, and MSO5204B: 350 MHz, ■...
-
Page 35: Signal Processing Features
About Tektronix oscilloscopes Signal processing features Waveform math. using the basic arithmetic functions, including FFT, or create more advanced ■ Set up math waveforms math waveforms using the math expression editor. Waveform expressions can contain measurement results and other math waveforms. -
Page 36: Product Software
Order the latest versions of DPO77002SX instrument software from Tektronix. Firmware upgrade Tektronix may offer firmware upgrade kits for this instrument. Contact your local Tektronix distributor or sales office for more information. Options and accessories Recommended accessories The following accessories are recommended for your instrument. - Page 37 About Tektronix oscilloscopes ■ Mini keyboard, 119-7275-XX ■ Service manual as a PDF, 077-0076-XX ■ Programmer manual as a PDF, 077-0010-XX ■ Specifications and Performance Verification manual as a PDF, 077-0063-XX DPO7000C ■ Oscilloscope cart, order K420 ■ Power deskew fixture, order 067-1478-XX ■...
- Page 38 2.5 kV 800 MHz TekVPI high-voltage passive probe TPP500, TPP1000 10X Passive Probes are compact with 10X attenuation, designed for use with Tektronix MSO/DPO4000B and MSO/DPO5000B Series instruments. The bandwidth (–3 dB) for TPP500 is 500 MHz. The bandwidth (–3 dB) for TPP1000 is 1 GHz.
- Page 39 About Tektronix oscilloscopes TekProbe component Description P6158 20X low-capacitance probe, 3 GHz P6243 Active probe, 1 GHz P6245 Active probe, 1.5 GHz P6246 Differential probe, 400 MHz P6247 Differential probe, 1 GHz P6248 Differential probe, 1.5 GHz P6701B Converter, optical-to-electrical (multi-mode)
- Page 40 About Tektronix oscilloscopes Logic component Description P6717A 16 data and 1 clock channel logic probe with accessories P6780 16 data and 1 clock channel differential logic probe with accessories that you solder in ■ TekConnect TekConnect component Description P7260 Low-capacitance active voltage probe, 6 GHz P7313, P7313SMA Differential probe, 12.5 GHz...
- Page 41 About Tektronix oscilloscopes TekProbe component Description P6245 Active probe, 1.5 GHz P6246 Differential probe, 400 MHz P6247 Differential probe, 1 GHz P6248 Differential probe, 1.5 GHz P6701B Converter, optical-to-electrical (multimode) P6703B Converter, optical-electrical (single-mode) TCP202A Current probe TCP300, TCP400 Series...
-
Page 42: Options
About Tektronix oscilloscopes TekProbe component Description P5200 High-voltage differential probe P5205 High-voltage differential probe P5210 High-voltage differential probe P6015A High-voltage probe P6139A Passive probe P6701B Converter, optical-to-electrical (multimode) P6703B Converter, optical-electrical (single-mode) TCP202A Current probe TCP300, TCP400 Series Current measurement system (Requires TCPA300/TCPA400 amplifiers) Options The following options are available for your instrument. - Page 43 About Tektronix oscilloscopes ■ Opt. USB - USB 2.0 Compliance Testing ■ Opt. USBHSIC - USB2.0 and HSIC Bundle, includes options Opt. DJA, HSIC, SR-USB, and USB ■ Opt. USBPWR - USB Power Adapter/ EPS Compliance Automated Test Solution ■...
- Page 44 About Tektronix oscilloscopes ■ Opt. SR-ENET - Ethernet Serial Analysis (10BASE-T and 100BASE-TX) ■ Opt. SR-PCIE - PCI Express Compliance Module for RT-Eye Serial Data Compliance and Analysis ■ Opt. SR-USB - USB Serial Triggering and Analysis (LS, FS, HS) ■...
- Page 45 About Tektronix oscilloscopes ■ Opt. CA1 - Provides single calibration event for the designated interval ■ Opt. R3 - Repair service 3 years (including warranty) ■ Opt. R5 - Repair service 5 years (including warranty) ■ Software: MSO70000C/DX, and DPO70000C/DX Series: ■...
- Page 46 About Tektronix oscilloscopes ■ Opt. SR-810B - 8b/10b Serial Triggering and Analysis ■ Opt. ST6G - Serial Protocol Trigger Software to trigger and decode 8 B/10 B data on high-speed serial or data protocols. Protocol triggering up to 6.25 GS/s. (standard on MSO instruments) ■...
-
Page 47: Documentation And Technical Support
About Tektronix oscilloscopes ■ Opt. G5 Complete Care 5 Years (includes loaner, scheduled calibration, and more) ■ Opt. IF Upgrade Installation Service ■ Opt. R3 - Repair service 3 years (including warranty) ■ Opt. R5 - Repair service 5 years (including warranty) ■... -
Page 48: Support Information
Service Support. For service-related questions about a Tektronix product, ■ contact us by telephone or e-mail. Tektronix also offers extended warranty and calibration programs as options on many products. Contact your local Tektronix distributor or sales office. ■ Write to Tektronix: Tektronix, Inc. -
Page 49: Tekscope Recovery Report Utility
TekScope recovery report utility The TekScope Recovery Report Utility is designed to gather logs and other files that may contain data useful to Tektronix in the diagnosis of TekScope Errors, and it creates a .zip file on the desktop to hold all of the gathered data. This compressed file is easily copied from the desktop to a removable flash drive, or the file can be sent to Tektronix as an email attachment. -
Page 50: Feedback
C:\Temp \TekScopeRecoveryReportUtility_log.txt Feedback Tektronix values your feedback on our products. To help us serve you better, please send any suggestions, ideas, or other comments you may have regarding your instrument. ■ Direct your feedback to us via e-mail at www.tektronix.com/contact-us. -
Page 51: Analysis And Connectivity Support
What do you want to do next? Find out what other documents are available Find out about using online help. Learn how to access Tektronix Support. Return to the beginning of the introduction. Analysis and connectivity support This instrument includes tools you can install to support data export for use with data-analysis tools. - Page 52 About Tektronix oscilloscopes TekVISA TekVISA is a library of industry-standard compliant software components, organized according to the standard VISA model established by the VXIplug&play Systems Alliance. Use TekVISA in software to write interoperable instrument drivers to handle communicating between software applications and your oscilloscope. TekVISA offers the following features and benefits: ■...
-
Page 53: About Tekscope
About Tektronix oscilloscopes About TekScope From the Help menu, select About TekScope. Overview. Provides the details of the instrument such as the model name, identification number, serial number, and version of the software that is installed. The options name and the key details of the applications that are installed in the instrument are also listed. -
Page 54: Working With Your Tektronix Oscilloscope
About Tektronix oscilloscopes Working with your Tektronix oscilloscope Windows environment Windows interface guidelines. Because the instrument uses the Microsoft Windows interface, you have open access to the Windows operating system. You can access the Windows desktop to load and run other Windows-based applications such as Microsoft Excel, WordPad, and Paint. - Page 55 About Tektronix oscilloscopes Connecting to a network. The instrument is built on a PC-based platform that runs Microsoft Windows as its operating system. Like any other Windows computer, you can connect the instrument to a network to enable printing, file sharing, Internet access, and other communications functions.
- Page 56 About Tektronix oscilloscopes Using tek LXI. Tek LXI conforms to the LAN eXtensions for Instrumentation (LXI) standard. The LXI standard defines the communications protocols that allow communication with the instrument over a local area network (LAN). After the TekScope application is running, the LXI application starts. The LXI system tray icon appears when LXI is running.
- Page 57 Click on the Help SUPPORT link to see help on the configuration information. Click on Datasheets, Manuals, or Driver Download to go to the Tektronix Oscilloscopes Web page to access the information. DPO70000SX, MSO/DPO70000DX, MSO/DPO70000C, DPO7000C, and MSO/DPO5000B Series...
- Page 58 About Tektronix oscilloscopes NIST USGCB compliance. Tektronix oscilloscopes are compatible with the security configuration for Information Technology products specified in the United States Government Configuration Baseline (USGCB) settings for Windows 7 and Internet Explorer. The National Institute of Standards and Technology (NIST) USGCB baseline operating system security requirements (Version 1.1.x) were implemented and tested on our oscilloscopes.
-
Page 59: Oscilloscope Interface
About Tektronix oscilloscopes Second monitor use. To optimize your access to the PC that is built into the oscilloscope, connect a keyboard, mouse, and monitor to the instrument, and then configure Windows for dual-display mode. In this configuration, the oscilloscope retains full dynamic oscilloscope performance while Windows and other applications such as publishing, analysis, or Web browsing tools reside on the external monitor. - Page 60 About Tektronix oscilloscopes Menu bar mode. The menu bar menus provide access to commands that control all of the instrument features and functions. When you select a feature setup command, the instrument displays the associated control window on the lower half of the screen.
- Page 61 About Tektronix oscilloscopes Toolbar mode. The toolbar buttons give you instant access to most instrument features without having to navigate through several menus. Click a toolbar button to display an associated control window on the lower half of the screen. Each control window provides access to the individual instrument controls.
- Page 62 About Tektronix oscilloscopes Display help on the Save As dialog box. Display help on the Recall dialog box. Learn to Customize the Toolbar. Toolbar customizing. The Customize option of toolbar mode gives you access to add or remove menu buttons, configure the order of the menu buttons, and set the toolbar back to its default configuration.
- Page 63 About Tektronix oscilloscopes User interface map. See the next figure for a description of the elements of the user interface. These elements provide complete control of the instrument. Menu bar: Access to data I/O, printing, online help, and instrument functions.
- Page 64 What do you want to do next? Learn how to navigate the online help. Find out what other documents are available. Learn how to contact Tektronix Support. Provide feedback on this Tektronix product. Provide information about Tekscope Navigating the online help. To open the online help select Help, and then select Contents and Index. From the online help finder, select one of the following tabs: Contents Tab.
-
Page 65: Basic Operations
About Tektronix oscilloscopes Basic operations Preventing ESD. A direct electrostatic discharge can damage the instrument input. To learn how to avoid this damage, read the following information. Electrostatic discharge (ESD) is a concern when handling any electronic equipment. The instrument is designed with robust ESD protection, however it is still possible that large discharges of static electricity directly into the signal input may damage the instrument. - Page 66 About Tektronix oscilloscopes A cable that is left unconnected on a bench, or carried across a room, can develop a large static charge. Discharge the static voltage from all cables before connecting them to the instrument or device under test by momentarily grounding the center conductor of the cable, or by connecting a 50 Ω...
- Page 67 About Tektronix oscilloscopes CAUTION. Do not use a tool (such as a screwdriver, wrench end, etc) to short the center conductor to the ground shell on the connector, as any sort of scratch or nick may damage the RF response of the cable.
- Page 68 About Tektronix oscilloscopes Selecting the proper attenuator. The ATI input has a maximum voltage range of 300 mV . Use of an attenuator can increase the maximum voltage range. Table 1: Maximum ATI voltage range Attenuator Maximum ATI voltage range...
- Page 69 About Tektronix oscilloscopes Proper connection technique. Use 8 inch-pounds of torque when making connections to the ATI 1.85 mm connector, SMA connectors, adapters, DC Blocks, or cables. Using the improper torque or connection technique may degrade your signals and damage the connectors.
- Page 70 About Tektronix oscilloscopes Figure 2: Installing a connector saver Use the backing wrench on the connector saver to prevent damage caused by rotation of the connectors when installing a connector. Use the supplied torque wrench to tighten (8 inch-pounds) your cable connector to the connector saver.
- Page 71 About Tektronix oscilloscopes Figure 4: Use a second backing wrench DPO70000SX, MSO/DPO70000DX, MSO/DPO70000C, DPO7000C, and MSO/DPO5000B Series...
- Page 72 About Tektronix oscilloscopes Changing control settings. As you configure the instrument, you may need to set a numerical parameter such as a reference level or delay time. There are several different ways to set these parameters in a control window (On DPO70000SX instruments, front panel control knobs are available on the optional DPO7AFP accessory): ■...
- Page 73 About Tektronix oscilloscopes Graphic indicator Increment/Decrement buttons Pop-up keypad Double click in a data entry box, or: ■ Click in a data entry box. ■ Click on the keypad icon. Use the pop-up keypad to enter data. DPO70000SX, MSO/DPO70000DX, MSO/DPO70000C, DPO7000C, and MSO/DPO5000B Series...
- Page 74 About Tektronix oscilloscopes Sample Rate Keypad. Click the Enter Button. Other keypads 8b10b Character Keypad. DPO70000SX, MSO/DPO70000DX, MSO/DPO70000C, DPO7000C, and MSO/DPO5000B Series...
- Page 75 About Tektronix oscilloscopes 8b10b Symbol Keypad. Moving and docking control windows. Control windows that open on the lower half of the screen can be moved to any location. To do this, move the cursor to the upper left-most corner of the window until the hand appears. Left-click the mouse button to grab the handle.
- Page 76 About Tektronix oscilloscopes Controlling from within the graticule area. Use the mouse or your finger in the graticule area to click and drag (or touch and drag) the following: ■ An on-screen cursor to another position on the waveform. ■...
- Page 77 About Tektronix oscilloscopes Accessing shortcut menus by right-clicking. You can right-click to gain quick access to most common commands. Right-click on a graticule, an object, or a readout to access their shortcut menus. The menus are dynamic; their contents will vary, depending on the area or the object you right click.
-
Page 78: Multi-Instrument Configuration
About Tektronix oscilloscopes Multi-instrument configuration Connect instruments in a multi-instrument configuration to create an up to 4 channel, highest bandwidth, and highest sample rate system with synchronized trigger and sample clock. DPO70000SX, MSO/DPO70000DX, MSO/DPO70000C, DPO7000C, and MSO/DPO5000B Series... - Page 79 About Tektronix oscilloscopes Instrument stacking. Multiple instruments may be stacked to save space and allow shorter cables and more convenient connections. WARNING. When using an instrument upside down, be careful to avoid pinching your fingers. DPO70000SX, MSO/DPO70000DX, MSO/DPO70000C, DPO7000C, and MSO/DPO5000B Series...
- Page 80 About Tektronix oscilloscopes Standard orientation of the top feet is useful when placing an instrument inverted on the work bench. Standard orientation of the top feet is also use when stacking an OM4000 on the instrument. Use the rotated orientation of the top feet to stack two instruments on top of each other.
- Page 81 About Tektronix oscilloscopes Before startup. All instruments in a multi-Instrument configuration must be connected properly before powering on the instruments. If the configuration is changed after the instruments are powered on, a system restart may be required. If an instrument is not connected in a multi-instrument configuration, the instrument powers on in its stand alone mode, not multi- instrument mode.
- Page 82 About Tektronix oscilloscopes ™ UltraSync bus cable connection order. Connect UltraSync bus cable bundles to the Master: Select which instrument will be the Master instrument. At the Master instrument connect each UltraSync cable bundle set to the designated ports (start with the To Extension B ports;...
- Page 83 About Tektronix oscilloscopes DPO70000SX, MSO/DPO70000DX, MSO/DPO70000C, DPO7000C, and MSO/DPO5000B Series...
- Page 84 About Tektronix oscilloscopes Master and extension connection order. Connect each extension instrument to the master instrument sequentially from left to right (Extension B, C, and then D). NOTE. Connect the extensions to the master in a star pattern, do not daisy chain the instruments.
- Page 85 About Tektronix oscilloscopes Multi-instrument power on. During the start-up process the instrument checks to see if instruments are connected in a Multi- instrument configuration. If instruments are not connected, the instrument powers up in stand-alone mode. If instruments are connected, the configuration is validated. If the configuration is not valid, guidance is provided to help you create a valid configuration.
- Page 86 About Tektronix oscilloscopes The following images show the master and extension with valid connections. DPO70000SX, MSO/DPO70000DX, MSO/DPO70000C, DPO7000C, and MSO/DPO5000B Series...
- Page 87 About Tektronix oscilloscopes After the multi-instrument connections are verified and the instruments display their operating status displays, the master displays its status and timer display. Pause the timer if you have additional changes to make before the oscilloscope application starts.
- Page 88 TekConnect channel data using programmable interface commands. Waveform data is not sent to the Master. If you plan to use Time Synchronized mode, contact your Tektronix representative for additional information. After the multi-instrument connections are verified, the instruments display their operating status displays. In this example the Master (A) is acquiring on channel 2 (ATI).
- Page 89 About Tektronix oscilloscopes DPO70000SX, MSO/DPO70000DX, MSO/DPO70000C, DPO7000C, and MSO/DPO5000B Series...
- Page 90 About Tektronix oscilloscopes Switching between multi-instrument modes. To switch among ATI, Non-ATI, and Time Synchronized modes, use the following procedure: From the Vertical > Configuration menu select either ATI, TekConnect, or TimeSync. Click Yes to continue. Restart of a multi-instrument system. To restart your multi-instrument system without powering down the oscilloscopes, do the...
- Page 91 About Tektronix oscilloscopes To shut down the Configuration Manager and all of the Scope applications and then restart them without changing the configuration mode, select File > Restart. ATI versus TekConnect channels. ATI channels provide the highest bandwidth and sample rate and the lowest noise. When using the ATI channel, the TekConnect channels are not available.
- Page 92 About Tektronix oscilloscopes Features not available. Features discussed in this manual that are not available or modified on some instruments or configurations are noted in the tables. Table 2: Stand-Alone instrument Feature DPO77002SX DPO75902SX DPO75002SX DPO73304SX DPO72304SX State (Clocked Pattern) trigger...
-
Page 93: Dpo7Afp Auxiliary Front Panel (Optional)
About Tektronix oscilloscopes DPO7AFP Auxiliary Front Panel (optional) The DPO7AFP is an optional plug-in panel that provides physical knobs and buttons to control the DPO70000SX series oscilloscope. To connect the DPO7AFP: Close the TekScope application. NOTE. The TekScope application must be closed before connecting the DPO7AFP. -
Page 94: Waveform Operations
About Tektronix oscilloscopes Waveform operations Triggering timebase and horizontal delay. The architecture of an analog oscilloscope requires its time bases and triggering to be linked. The main trigger triggers the main time base, and then you can use a delayed trigger to trigger a delayed time base. - Page 95 About Tektronix oscilloscopes Looking at waveform details. Use the instrument Zoom function to magnify an acquisition vertically, horizontally, or in both dimensions to let you see the fine detail in your signals. The MultiView Zoom function affects only the display, not the actual waveform that is being acquired.
- Page 96 About Tektronix oscilloscopes The trigger event can be simple or complex. Examples of a simple trigger are the rising edge of the Channel 1 signal or a glitch narrower than 10 ns on Channel 2. You can set up a complex trigger where the trigger system is armed by a condition on one channel and then is triggered by a condition on another channel.
- Page 97 About Tektronix oscilloscopes Using fast acquisition and DPO. When you turn on FastAcq, you can acquire up to 250,000 waveforms per second. In fast acquisition mode, the dead time between acquisitions can be very short, approaching that of the finest analog oscilloscopes.
- Page 98 About Tektronix oscilloscopes Using logic waveforms. This online help supports many oscilloscope models from Tektronix. This feature is only available on some models. The instrument can display logic waveforms of analog or digital signals in bus views with bus decoding. You can use digital, analog, and math waveforms to define up to 16 buses (serial or parallel) in the Bus Setup window.
- Page 99 CAN and LIN messages, with the protocol leveraging the trigger capabilities. 8b10b Serial Triggering and Analysis. Use the 8b10b software to trigger on and analyze 8b10b serial bus signals. ■ Additional packages may be available. Contact your Tektronix representative for more information. DPO70000SX, MSO/DPO70000DX, MSO/DPO70000C, DPO7000C, and MSO/DPO5000B Series...
- Page 100 About Tektronix oscilloscopes DPO70000SX, MSO/DPO70000DX, MSO/DPO70000C, DPO7000C, and MSO/DPO5000B Series...
-
Page 101: Controls And Connectors
Controls and connectors Front panel controls and connectors Front panel overview The instrument features the following front-panel controls and connectors. DPO70000SX Series instruments only have front-panel connectors and the On/Standby switch on the front panel. DPO70000SX, MSO/DPO70000DX, MSO/DPO70000C, DPO7000C, and MSO/DPO5000B Series... - Page 102 Controls and connectors Description Location For all DPO7000C, MSO/DPO70000C, and MSO/DPO70000DX models: DVD/CD-RW drive Front-panel controls USB port Ground terminal Recovered data output Recovered clock output Probe compensation output PROBE CALIBRATION output Channel inputs 10. Auxiliary trigger input 11. Fast Edge output used for probe compensation Only for MSO5000B and DPO5000B models: 12.
- Page 103 Controls and connectors Description Location DVD/CD-RW drive Front-panel controls USB port Ground terminal Figure 5: For DPO70000C models: Recovered data output Recovered clock output Probe compensation output PROBE CALIBRATION output Channel inputs 10. Auxiliary trigger input 11. Fast Edge output used for probe compensation Figure 6: For DPO70000DX models: 12.
- Page 104 Controls and connectors Description Location USB port Ground terminal PROBE CALIBRATION output Channel inputs Auxiliary trigger input Differential Fast Edge output On / Standby switch. Figure 10: For DPO70002SX models: Figure 11: For DPO70004SX models: Probe Compensation output Use the Probe Compensation output to compensate or deskew passive probes or active voltage probes. On some models, this is the Fast Edge output.
-
Page 105: Touch Screen
Controls and connectors Ground terminals Use these terminals to connect the instrument to the same ground as the unit under test, and if you are working with static sensitive components, ground yourself. Static electricity that builds up on your body can damage static-sensitive components. Wear a wrist strap to safely send static charges on your body to earth ground. -
Page 106: Wave Inspector Controls
Controls and connectors Wave inspector controls NOTE. Wave Inspector Controls are available only on MSO/DPO5000B Series instruments. The Wave Inspector controls (zoom/pan, play/pause, mark, and search) help you to efficiently work with long record length waveforms. Controls Description Use Measure to perform automated measurements, Search to search through an acquisition for user-defined events/criteria, or DPX/FastAcq to start or stop fast acquisitions. -
Page 107: Horizontal Controls
Controls and connectors Controls Description Use the dedicated channel (Ch <1–4>) buttons to turn channel displays on and off. The channel button is lighted when the selected channel is on. Use the dedicated push-to-toggle Position/Offset and Scale knobs to adjust the vertical position and scale of the waveform. NOTE. -
Page 108: Trigger Controls
Controls and connectors Controls Description Use the dedicated Position knob to adjust the horizontal position of all waveforms. Use this knob to adjust the trigger point so that you can select the amount of pretrigger data or posttrigger data. In Delay Mode, this knob can be used to set the delay time. - Page 109 Controls and connectors Controls Description Select Trig in the menu bar to open the Trigger control window. Use the Coupling drop-down menu to select trigger coupling an A event or B event Edge trigger. To open the Trigger control window, push the Menu button (Available only on MSO/DPO5000B Series instruments only).
-
Page 110: Trigger Coupling
Controls and connectors Auto trigger mode Auto trigger mode causes the instrument to trigger if a valid trigger event does not occur within a set amount of time. Auto trigger mode is useful when probing DC signal levels such as power supplies or logic levels that are stuck high or low. It is also useful when looking for activities on signal nodes such as oscillations when you first set up the instrument. -
Page 111: General Purpose Controls
Controls and connectors Controls Description The Acquisition Status readouts, and lights on some instruments, indicate the state of the acquisition. Arm indicates the instrument is filling the pretrigger portion of the waveform record. Ready indicates the instrument can accept a valid trigger event and is waiting for the trigger event to occur. -
Page 112: Multiview Zoom Controls
Controls and connectors Controls Description Push the Cursors button to enable cursors on the screen. The Cursor Type control window opens so that you can specify the cursor parameters. NOTE. If cursors are on but the multipurpose knob readouts are not attached to the Position controls, press the Cursors button to attach the controls to the readouts. -
Page 113: Rear And Side Panel Connectors
Controls and connectors Rear and side panel connectors The instrument features the following rear and/or side panel connectors: Controls Description Use the PS-2 connectors to connect a PS-2 keyboard or a mouse to the instrument. Use the USB connectors to connect a USB mouse, a keyboard, or other USB devices to the instrument. - Page 114 Controls and connectors Controls Description Use the COM 2 serial port to connect to other devices through the serial port. NOTE. The COM2 port is not available on some instruments. Use the RJ-45 connector to connect the instrument to a network.
- Page 115 Controls and connectors Controls Description For MSO/DPO70000C and MSO/DPO70000DX instruments: Use the AUX OUT connector to obtain a TTL-compatible, negative polarity pulse when the instrument triggers or when certain other events occur, such as a mask test failure or AUX OUT REF OUT EXT REF IN completion.
- Page 116 Controls and connectors Controls Description Use the eSATA port as an external interface for SATA support devices. NOTE. This port is available only on MSO70000C/DX, DPO70000C/DX, and DPO7000C Series instruments. For DPO70000SX instruments: Use the Display Port to connect to a monitor. Use the PCIe ports to connect to a PC or to set up a multi- instrument configuration.
-
Page 117: Cursor Setups
This online help supports many oscilloscope models from Tektronix. This feature is only available on some models. For information on the controls, click the buttons. -
Page 118: Track Mode
Cursor setups To use Click the Cursor button to turn cursors on and off. NOTE. If cursors are on but the readouts are not attached to the cursor controls, press the Cursors button to attach the readouts to the cursor controls. Press the Cursors button again to turn the cursors off. To select the cursor Track Mode, click either the Indep (independent) or Tracking button. -
Page 119: Cursor Type Control Window
Cursor setups Cursor type control window From the Cursor menu, select Cursor Controls, or press the front panel Cursors button. Overview Use the Cursor Type control window to select the source for each cursor and the type of cursors used for waveform measurements. -
Page 120: Cursor Sources (Yt Display)
Cursor setups Cursor sources (YT display) From the Cursor menu, select Cursor Setup. Overview Use these controls to define the source for both Cursor 1 and Cursor 2 for any cursor type. To use Click the Source drop-down list to select the measurement source for the cursor. Click in an X Position entry box and use a multipurpose knob to adjust the position of the cursor. -
Page 121: Cursor Style
Cursor setups Cursor style From the Cursor menu, select Cursor Setup. Overview Use these controls to change the appearance of the cursors. To use Select a Line style from the drop-down list: Solid, Dashed, or Solid and Dashed. Select a Symbol style from the drop-down list: Lines, Line & X, or X. NOTE. -
Page 122: Cursor Position Control Window
Cursor setups XY cursor readout Cursor type Display format Cursor position Rectangular Waveform and Screen Shown as rectangular coordinate positions. There are nine readouts for Waveform cursors and six for Screen cursors. Polar Waveform and Screen Shown as polar coordinate positions. -
Page 123: Horizontal Bar Cursors
Cursor setups Behavior The cursor units depend on the cursor type. The cursor position readouts appear on the display graticule. When using the IRE graticule style, amplitude cursor readouts are shown in IRE units. Cursor position does not change if the cursor source changes or if the waveform is repositioned. TIP. -
Page 124: Vertical Bar Cursors
Cursor setups Vertical bar cursors From the Cursor menu, select Cursor Controls, or press the front panel Cursors button. To use To use the vertical bar cursors, click V Bars in one of the cursor control windows or highlight Cursor Type from the Cursors menu, and then select V-bars from the submenu. -
Page 125: Screen Cursors
Cursor setups Learn more about the Cursor controls. Go to a step-by-step procedure for taking cursor measurements Screen cursors From the Cursor menu, select Cursor Controls, or press the front panel Cursors button. To use To use the screen cursors, click Screen in one of the cursor control windows or from the Cursors menu highlight Cursor Type, and then select Screen from the submenu. -
Page 126: Cursor Measurements
This online help supports many oscilloscope models from Tektronix. This feature is only available on some models. Cursor types overview... - Page 127 Cursor setups Vertical cursors measure from the trigger point Remember that each vertical cursor measures the time from the trigger point to itself. This relationship is shown in the next figure. A vertical cursor readout includes and varies directly with the Delay time, which varies directly with the horizontal position set for the time base.
-
Page 128: Cursor Setup Control Window (Xy Display Format)
Cursor setups Changing cursor positions Change cursor positions by using the position controls in the Cursor Position window, dragging the cursor into position using the touch screen or mouse, or by turning the front-panel multipurpose knobs. NOTE. To make small changes with the multipurpose knobs, push the Fine button before turning the knobs. When a Fine button is lighted, its multipurpose knob makes smaller adjustments. - Page 129 Cursor setups Behavior When you are using XY display format, only Waveform and Screen cursors are available. If you change the display format to XY when H Bar cursors are enabled, the cursor type will change to Screen. In normal acquisition mode, changing the display format to XY when V Bar cursors are enabled, changes the cursor type to Waveform.
- Page 130 Cursor setups DPO70000SX, MSO/DPO70000DX, MSO/DPO70000C, DPO7000C, and MSO/DPO5000B Series...
-
Page 131: Digital Setups
Digital setups Digital setup control window From the Digital menu, select Digital Setup. NOTE. The Digital Setup is available only on MSO5000B and MSO70000C/DX Series instruments and DPO5000B Series instruments with option MSOE installed, and DPO70000DX instruments with option MSOU installed. Overview Use the Digital Setup control windows to set parameters for the D15-D0 digital channels. -
Page 132: Setting Up Digital Signal Inputs
Digital setups TIP. Click the Bus Setup button to quickly access the Bus Setup control window. What do you want to do next? Learn how to connect a logic probe to signals in your system under test. Learn how to turn on or turn off the digital channels. Learn how to set up the digital channels. -
Page 133: Digital Channel Threshold And Position
Digital setups To use Connect the logic probe to the instrument. Connect the probe to the input signal sources. CAUTION. To prevent damage to the instrument always wear an antistatic wrist strap when making connections to the instrument and observe the maximum input voltage ratings for input connectors. Set up digital channels and buses using the Digital Setup and Bus Setup control windows through the Digital menu. - Page 134 Digital setups To use Use the Channel Selectors to select a channel. Use the Threshold and Position controls to set the voltage threshold level and the vertical position of the selected channel. Set digital channel threshold NOTE. The Digital Channel Threshold option is available only on MSO5000B and MSO70000C/DX Series instruments and DPO5000B Series instruments with option MSOE installed, and DPO70000DX instruments with option MSOU installed.
-
Page 135: Turn On Or Off The Digital Channels D15-D8 And D7-D0
Digital setups Learn more about digital setups. Learn about bus setups. Learn about bus configuration. Turn on or off the digital channels D15-D8 and D7-D0 NOTE. The Turn On or Off the Digital Channels D15-D8 and D7-D0 option is available only on MSO5000B and MSO70000C/DX Series instruments and DPO5000B Series instruments with option MSOE installed, and DPO70000DX instruments with option MSOU installed. -
Page 136: Set The Display Size Of Logic Channels
Digital setups Set the display size of logic channels NOTE. The Display Size of Logic Channels option is available only on MSO5000B and MSO70000C/DX Series instruments and DPO5000B Series instruments with option MSOE installed, and DPO70000DX instruments with option MSOU installed. From the Digital menu, select Digital Setup and use the Size selection box to define the height of the digital channel in the display. -
Page 137: Set Up Digital Channels
Digital setups To use Click the Global Threshold entry box and enter a value for the voltage threshold level with the keypad. ■ Click the Apply button. ■ Behavior The instrument sets the thresholds for all digital channels to the same voltage level. What do you want to do next? Learn how to set the threshold for Ch1-Ch4 (live) and Math1-Math4 channels to use as logic waveforms. - Page 138 Digital setups Behavior As you turn on digital channels, the corresponding channel indicator along the bottom of the menu changes to match the color on the digital channel button. What do you want to do next? Learn about bus setups. Learn about bus configuration Learn more about digital setups.
-
Page 139: Bus Setups
Bus setups Bus setup control window (Config tab) From the Digital menu (or the Vertical menu), select Bus Setup. Some instruments support serial data standards: SPI, I C, USB, RS232, 8b10b, and MIPI. When you select a serial bus, the instrument assigns specific bus signals (called components) to default digital channels and sets the threshold to an appropriate voltage level. - Page 140 Bus setups To use Click and drag the scroll bar until the desired Bus number <B1-B16> or name is visible ■ Click on a Bus number or name ■ Click the corresponding Bus number Off/On button ■ To name the bus, click the Label entry box and enter a name with the keyboard ■...
-
Page 141: Bus Selection List
Bus setups Learn how to troubleshoot a serial bus. Bus selection list From the Bus Setup window, select a bus to set up from the list of Bus selections <B1-B16>. To use Click and drag the scroll bar until the desired Bus number or name is visible. ■... -
Page 142: Bus Search Selection List
Bus setups Bus search selection list From the Search Configure window, select a bus source to set up from the list of Source selections <B1-B16>. To use Select the Search Slot from the drop-down list. ■ Click and turn (drag) the scroll wheel or click the up/down arrows until the desired Bus number or name is visible. ■... -
Page 143: Display Or Clear A Bus
Bus setups Display or clear a bus From the Bus Setup window, select the Bus number <B1-B16> or name that you want to display or clear from the display. To use Select the bus number or name from the list. ■... - Page 144 Bus setups Behavior The bus label appears in the list of bus setups in the Config and Display tabs. The instrument also displays the label adjacent to the bus number on the screen for easy identification. What do you want to do next? Learn more about bus setups.
-
Page 145: Change The Bus Position
Bus setups Change the bus position From the Bus Setup window, select the Bus number <B1-B16> or name to position on the display from the Bus list. To use To change the vertical position of the bus on the display, click the Bus Position entry box and use the keypad or the multipurpose knob to enter a new position. - Page 146 Bus setups To use To change the input for a component, click the Input arrow and select a channel from the cascading list. ■ To change the voltage threshold level, click the Threshold entry box and use the keypad to enter a value or use the ■...
-
Page 147: Set Up An Spi Serial Bus
Bus setups Set up an SPI serial bus NOTE. SPI serial bus setup is available only on instruments with the SR-EMBD option. From the Bus Setup window, select a bus from the Bus list and then select the SPI Serial bus type. NOTE. -
Page 148: Set Up An Rs-232 Serial Bus
Bus setups Behavior The instrument changes the components, voltage threshold levels, polarity, word size, and bit order, and uses those to decode the selected SPI bus. What do you want to do next? Learn more about bus setups. Learn about bus configuration. Learn about digital setups. - Page 149 Bus setups ■ Serial Threshold ■ Polarity ■ Data Bits ■ Parity ■ Bit Rate To use To change the input for a component, click the Input and select a channel from the cascading lists. ■ To change the voltage threshold level, click the Threshold entry box and use the keypad to enter a value or use the ■...
-
Page 150: Set Up A Usb Serial Bus
Bus setups Learn how to set up a CAN Bus Learn how to set up a MIL-1553 Bus Learn how to set up an Ethernet Bus Learn how to set up an Custom serial bus. Learn how to troubleshoot a serial bus. Learn how to track down serial bus anomalies. - Page 151 Bus setups Figure 15: USB bus setup with SuperSpeed selected. To use To change the input for a component, click the Input and select a channel from the cascading lists. ■ To change the voltage threshold level, click the Threshold (H) or Threshold (L) entry box and use the keypad to enter a ■...
-
Page 152: Set Up A Mipi Dsi-1 Serial Bus
Bus setups Learn how to trigger on a bus. Set up a MIPI DSI-1 serial bus NOTE. MIPI DSI-1 serial bus setup is available only on instruments with the SR-DPHY option. From the Bus Setup window in the Config tab, select a bus from the Bus list and then select the MIPI DSI-1 Serial bus type. NOTE. -
Page 153: Set Up A Mipi Csi-2 Serial Bus
Bus setups Learn about bus configuration. Learn about digital setups. Learn how to set up an I2C serial bus. Learn how to set up an SPI serial bus. Learn how to set up a USB serial bus. Learn how to set up an RS-232 serial bus. Learn how to set up a MIPI DSI1 Serial Bus Learn how to set up a MIPI CSI2 Serial Bus Learn how to set up an 8B10B Serial Bus... - Page 154 Bus setups To use To set the channel type, click the Channel Type entry box and select from the drop-down list. ■ To change the input for a component, click the Input and select a channel from the cascading lists. ■...
-
Page 155: Set Up An 8B10B Serial Bus
Bus setups Learn how to view analog characteristics of a digital waveform. Learn how to trigger on a bus. Learn to view the bus packets. Set up an 8B10B serial bus NOTE. 8B10B serial bus setup is available only on instruments with the SR-810B or ST6G options. From the Bus Setup window in the Config tab, select a bus from the Bus list and then select the 8B10B Serial bus type. -
Page 156: Set Up A Custom Serial Bus
Bus setups Behavior The instrument changes the components, voltage threshold levels, speed, and signal type, and uses those to decode the selected 8B10B bus. What do you want to do next? Learn more about bus setups. Learn about bus configuration. Learn about digital setups. - Page 157 Bus setups To use To change the custom decoder, click the Custom Decoder arrow and select the decoder from the cascading list. ■ To change the input for a component, click the Input arrow and select a channel from the cascading list. ■...
-
Page 158: Set Up A Pcie Serial Bus
Bus setups Set up a PCIe serial bus NOTE. PCIe serial bus setup is available only on instruments with the SR-PCIE option. From the Bus Setup window, select Serial from the Bus Type list and then select the PCIe Serial bus type. For information on the controls, click the buttons. -
Page 159: Set Up A Can Serial Bus
Bus setups Learn how to set up an I2C serial bus. Learn how to set up an SPI serial bus. Learn how to set up a USB serial bus. Learn how to set up an RS-232 serial bus. Learn how to set up a MIPI DSI1 Serial Bus Learn how to set up a MIPI CSI2 Serial Bus Learn how to set up an 8B10B Serial Bus Learn how to set up a CAN Bus... - Page 160 Bus setups To use To change the input for a component, click the Input and select a channel from the cascading lists. ■ To set the serial bus type, click the Serial Bus Type entry box and select from the drop-down list. ■...
-
Page 161: Set Up A Lin Serial Bus
Bus setups Set up a LIN serial bus NOTE. LIN serial bus setup is available only on instruments with the SR-AUTO option. From the Bus Setup window, select Serial from the Bus Type list and then select the LIN Serial bus type. For information on the controls, click the buttons. -
Page 162: Set Up A Flexray Serial Bus
Bus setups Learn how to set up an SPI serial bus. Learn how to set up a USB serial bus. Learn how to set up an RS-232 serial bus. Learn how to set up a MIPI DSI1 Serial Bus Learn how to set up a MIPI CSI2 Serial Bus Learn how to set up an 8B10B Serial Bus Learn how to set up a CAN Bus Learn how to set up a LIN Serial Bus... - Page 163 Bus setups To use To change the input for a component, click the Input and select a channel from the cascading lists. ■ To set the signal type, click the Signal Type entry box and select from the drop-down list. ■...
-
Page 164: Set Up A Mil-1553 Serial Bus
Bus setups Set up a MIL-1553 serial bus NOTE. MIL-STD-1553 serial bus setup is available only on instruments with the SR-AERO option. From the Bus Setup window, select Serial from the Bus Type list and then select the MIL-1553 Serial bus type. For information on the controls, click the buttons. -
Page 165: Set Up An Ethernet Serial Bus
Bus setups Learn how to set up a USB serial bus. Learn how to set up an RS-232 serial bus. Learn how to set up a MIPI DSI1 Serial Bus Learn how to set up a MIPI CSI2 Serial Bus Learn how to set up an 8B10B Serial Bus Learn how to set up a CAN Bus Learn how to set up a LIN Serial Bus... - Page 166 Bus setups To use To set the serial bus type, click the Serial Bus Type entry box and select from the drop-down list. ■ To select the standard, click the Standard and select the standard from the drop-down list. ■ To select the signal type, click the Signal Type and select the signal type from the drop-down list.
-
Page 167: Select The Number Of Lanes
Bus setups Select the number of lanes From the Bus Setup window, select Serial from the Bus Type list and then select one of the bus types. To use To change the number of lanes for the bus, click the No Of Lanes and select from the cascading list. Behavior The instrument acquires data from the number of lanes you select. -
Page 168: Select The Serial Bus Channel Input
Bus setups Behavior The instrument acquires data from the channel you select for each component. The channel type supported are analog or digital (MSO models only) input. The analog input consists of two analog signals (D+ and D-). The digital input consists of three digital signals (D+, D-, and D+/D- [differential probing between D+ and D-]). -
Page 169: Select The Usb Serial Bus Speed
Bus setups Behavior The instrument acquires data from the channel you select for each component. What do you want to do next? Learn more about bus setups. Learn about bus configuration. Learn about digital setups. Select the USB serial bus speed NOTE. -
Page 170: Select The Usb Bus Signal Type
Bus setups Select the USB bus signal type NOTE. The USB bus Signal Type is available only on instruments with option SR-USB. Signal Type is not available if you select SuperSpeed in the Bus Setup menu. From the Bus Setup window, select Serial from the Bus Type list and then select the USB Serial bus type. To use To change the signal type for the displayed components of the bus, click Signal Type and select from the cascading list. -
Page 171: Select The Serial Bus Input
Bus setups Behavior The instrument acquires data from the channel you select for each component. What do you want to do next? Learn more about bus setups. Learn about bus configuration. Learn about digital setups. Select the serial bus input From the Bus Setup window, select Serial from the Bus Type list and then select from the cascading list. -
Page 172: Select The Serial Bus Channel Threshold
Bus setups Behavior The instrument acquires data from the channel you select for each component. What do you want to do next? Learn more about bus setups. Learn about bus configuration. Learn about digital setups. Select the serial bus channel threshold From the Bus Setup window, select Serial from the Bus Type list and then select from the cascading list. -
Page 173: Select The Spi Bus Channel Polarity
Bus setups Select the SPI bus channel polarity NOTE. The SPI Bus Channel Polarity option is available only on instruments with option SR-EMBD. From the Bus Setup window, select the Select tab and the SPI Serial bus type. To use Scroll through the Bus list and select the SPI bus to configure. -
Page 174: Select The Rs-232 Bus Data Bits
Bus setups Behavior For the Data component: Normal causes the instrument to decode signals at a high level as a binary 1. ■ Inverted causes the instrument to decode signals at a high level as a binary 0. ■ What do you want to do next? Learn more about bus setups. -
Page 175: Select The Rs-232 Bus Parity
Bus setups Select the RS-232 bus parity NOTE. The RS-232 Bus Parity option is available on instruments with option SR-COMP. From the Bus Setup window, select the Select tab and the RS-232 Serial bus type. To use Scroll through the Bus list and select the RS-232 bus to configure. ■... -
Page 176: Select The Spi Bus Framing
Bus setups Behavior Set the bus bit rate to: 50, 300, 1200, 2400, 9600, 19200, 38400, 115200, 921600, or 10000000. The default value is 9600. ■ Custom. To change the bit rate, click the Bit Rate entry box and use the keypad to enter a value. ■... -
Page 177: Set The Spi Bus Idle Time
Bus setups Set the SPI bus idle time NOTE. The SPI bus Idle Time option is available only on instruments with option SR-EMBD. From the Bus Setup window, select the Select tab and the SPI Serial bus type. To use Select the Idle framing from the drop-down list. -
Page 178: Select The Spi Bus Bit Order
Bus setups Behavior The instrument changes the word size and uses that to decode the selected SPI bus. What do you want to do next? Learn more about bus setups. Learn about bus configuration. Learn about digital setups. Select the SPI bus bit order NOTE. -
Page 179: Set Up A Parallel Bus
Bus setups Set up a parallel bus From the Bus Setup window, select a bus from the Bus list, select the Parallel bus type, and then click the Add Sources button. Overview When you acquire data from a Parallel bus, you can set up the bus to be clocked or unclocked. To use For information on the controls, click the buttons. -
Page 180: Set Up A Clocked Parallel Bus
Bus setups Set up a clocked parallel bus From the Bus Setup window, select a bus from the Bus list and then select the Parallel bus type. Overview The instrument can trigger parallel bus data only when the Clock Source is Channel 4. For information on the controls, click the buttons. -
Page 181: Add Sources To A Parallel Bus
Bus setups Learn about digital setups. Learn how to set up a parallel bus. Learn how to troubleshoot circuits using a parallel bus. Learn how to view analog characteristics of a digital waveform. Learn how to trigger on a bus. Add sources to a parallel bus From the Bus Setup window, click the Add Sources Select button. -
Page 182: Set Up Bus Channel Thresholds
Bus setups Behavior The instrument adds the channels to the parallel bus starting with the Most Significant Bit (MSB). As you select each subsequent channel, the instrument adds the channel to the bus as the next lower bit. The last channel you select is the Least Significant Bit (LSB). -
Page 183: Change The Bit Order Of A Channel In A Parallel Bus
Bus setups Learn about bus configuration. Learn about digital setups. Change the bit order of a channel in a parallel bus NOTE. Serial Bus Channel Type is only available on instruments with an SR-xxxx option. From the Bus Setup window, select a channel to move to a different bit order position within a parallel bus. To use Select a parallel bus from the Bus list. -
Page 184: Remove A Channel From A Parallel Bus
Bus setups Remove a channel from a parallel bus From the Bus Setup window, select a channel to remove from a parallel bus. To use Select a parallel bus from the Bus list. ■ Click the channel you want to remove from the Bus Contains list. ■... -
Page 185: Select The Bus Clock Channel Polarity
Bus setups NOTE. You have the option to add user-defined labels for the analog, reference, bus, and digital sources. Digital sources are only available on MSO models. Behavior The instrument acquires data from the parallel bus only when the signal used as the Clock Source changes logic levels. What do you want to do next? Learn more about bus setups. -
Page 186: Bus Setup Control Window (Display Tab)
Bus setups Bus setup control window (Display tab) From the Bus Setup window, select the Display tab. Overview Use the Bus Setup Display window to define how the instrument displays data acquired from the selected bus. To use Bus List ■... - Page 187 Bus setups For the 8B10B serial bus, you can also display the decode of the bus in Symbol, Character, Data Hex, and Data Binary method. For the PCIe serial bus, you can display the decode of the bus in Symbol, Character Symbol, Character KCode, Data Hex, Data Binary, Descrambled Hex, and Descrambled Binary.
- Page 188 Bus setups For the USB serial bus, you can display the decode of the bus in Mixed Hex, Mixed ASCII, Hex, Binary, Packet, and Details. The speed you select determines the available decodes. Select the decode form the drop down list. For the Ethernet serial bus, you can display the decode of the bus in Mixed Hex, Mixed ASCII, Hex, and Binary.
-
Page 189: Select The Bus Display View
Bus setups Select the bus display view From the Bus Setup window, select the Display tab. To use Scroll through the Bus list and select the bus to configure. ■ Click a + box to display additional views, or click a - box to remove views. ■... -
Page 190: Select The Bus Decode Method
Bus setups Select the bus decode method From the Bus Setup window, select the Display tab. To use Scroll through the Bus list and select the bus to configure. ■ Click the Busform Decode drop down list and select the method to interpret and display the data from the bus. ■... -
Page 191: Select The Bus Symbol Table
Click the Browse button to locate the file. ■ NOTE. The instrument looks for decode symbol table files in the C:\Users\[Username]\Tektronix\TekScope\BusDecodeTables directory. Behavior The instrument searches for the numeric value in the symbol table file and displays the corresponding symbol. For example, you might define a numeric value to display as RESET. -
Page 192: Symbol File Format
The instrument requires a specific format to be compatible with the instrument reader. The instrument uses a format called TSF, which is the TLA Symbol Format used with Tektronix logic analyzers. The file extension is .tsf. You can use any text editor to create the file. -
Page 193: Opening A Bus Symbol Table File
(not Xs). To use Create a TSF file with symbols and numeric values. ■ Copy the file to the C:\Users\[Username]\Tektronix\TekScope\BusDecodeTables directory on the instrument. ■ From the Bus Setup window, select the Config tab and select a bus to decode. ■... - Page 194 . If C:\Users\[Username]\Tektronix\TekScope\BusDecodeTables you saved the file in another directory, you need to copy the file to the C:\Users\[Username]\Tektronix\TekScope \BusDecodeTables directory, where the instrument expects to find it. When you open a symbol table file, the instrument uses the values to decode and display bus values to be easier to recognize.
-
Page 195: Magnivu Setup
MagniVu setup Using MagniVu NOTE. The MagniVu feature is available on MSO5000B models and on DPO5000B models with option MSOE.. Select MagniVu in one of the following ways: ■ Digital menu. ■ Horiz/Acq menu. ■ Horiz/Acq > Horizontal/Acquisition Setup and click Acquisition tab. Overview Turn on or turn off MagniVu. - Page 196 MagniVu setup With MagniVu option enabled (the Sample Rate and Resolution values set): DPO70000SX, MSO/DPO70000DX, MSO/DPO70000C, DPO7000C, and MSO/DPO5000B Series...
- Page 197 MagniVu setup NOTE. The MagniVu record must always contain the trigger. If the trigger point is moved prior to the display region using Horizontal Delay, then the MagniVu record will not be available. In most of these cases, you can find the digital record by looking for the digital signal in the upper overview and panning accordingly.
- Page 198 MagniVu setup DPO70000SX, MSO/DPO70000DX, MSO/DPO70000C, DPO7000C, and MSO/DPO5000B Series...
-
Page 199: Display Setups
Display setups Display control window (Appearance tab) From the Display menu, select Display Setup. Overview Use the Display General tab controls to change the display style, persistence, intensity, format, and interpolation. For information on the controls, click the buttons. Style ■... -
Page 200: Display Control Window (Screen Text Tab)
Display setups What do you want to do next? Learn about using text with screen displays. Learn about changing the appearance of objects in the display. Learn about changing the display colors. Display control window (Screen text tab) From the Display menu, select Screen Text, or open the Screen Text tab in the Display control window. Overview Use the controls on the Screen Text tab to define text captions that you can add to the instrument display. -
Page 201: Text Properties Control Window
Display setups Behavior Click on one of the numbered lines and use the pop-up keyboard to enter up to 64 alphanumeric characters of text per line. Click Clear to clear the entire text of the selected line. The screen text that you enter is not related to any waveform labels that you may have created. -
Page 202: Display Control Window (Objects Tab)
Display setups Learn about changing the display colors. Display control window (Objects tab) From the Display menu, select Objects, or open the Objects tab in the Display control window. Overview Use the Objects tab controls to change the appearance of objects on the oscilloscope display. For information on the controls, click the buttons. -
Page 203: Display Control Window (Colors Tab)
Display setups Trigger T marker Display control window (Colors tab) From the Display menu, select Colors, or open the Colors tab in the Display control window. Overview Use the controls on the Colors tab to change waveform color palettes. You can define colors for the live, math, and reference waveforms. -
Page 204: Display Persistence
Display setups Learn about using text with screen displays. Display persistence From the Display menu, select Display Setup; then open the Appearance tab. To use Click one of the buttons to select the display persistence. Click Infinite (persistence) to continuously accumulate record points on the waveform until you change one of the acquisition ■... -
Page 205: Select The Display Format
Display setups Select the display format From the Display menu, select Display Setup; then open the Appearance tab. To use Click one of the buttons to select the display format. Behavior YT format is the conventional oscilloscope format: Amplitude appears on the vertical axis as the signal varies over time on the horizontal axis. ■... -
Page 206: Xy Format Pairs
Display setups TIP. Use the Display menu Display Format submenu to directly access the format types. What do you want to do next? Learn about changing the display colors. Learn about using text with screen displays. Learn about changing the appearance of objects in the display. XY format pairs When you use the XY display format, channel and reference waveforms are assigned to the axis indicated in the following table. -
Page 207: Select The Waveform Interpolation
Display setups Click in the FastAcq/WfmDB entry box and use a multipurpose knob to adjust the intensity of live waveforms when using ■ Fast Acquisition or Waveform Database acquisition mode. NOTE. Backlight control option is available only on MSO/DPO5000B and DPO7000C Series instruments. Click in the Backlight list box and use the multipurpose knob to adjust the intensity of the backlight to the required option. -
Page 208: Select The Graticule Style
Display setups Behavior The instrument interpolates waveforms in Zoom mode when there is less than one sample for each pixel column. These functions are performed on the acquired data as compared to the displayed data. Click Sin(x)/x to compute record points along a curve between the actual acquired samples. This form of interpolation is ■... -
Page 209: Define The Color Palette
Display setups Behavior Full provides a grid, cross hairs, and frame on the instrument display. Use Full to make quick estimates of waveform ■ parameters. Cross Hair shows cross hairs and a frame on the instrument display. This style is useful for making quick estimates of ■... - Page 210 Display setups To use Click the buttons to define the color for displayed waveforms. Use the buttons under FastAcq/WfmDB Palette to define the color for live waveforms when using Waveform Database ■ acquisition mode. For some models, click the Edit button to activate the Display Palette, where you can customize a waveform color.
-
Page 211: Remote Operation
Display setups Remote operation Remote desktop connection You can find the network setup program in the Windows Start menu. Either select All Programs > Accessories > Remote Desktop Connection, or select Programs > Accessories > Communications > Remote Desktop Connection. DPO70000SX, MSO/DPO70000DX, MSO/DPO70000C, DPO7000C, and MSO/DPO5000B Series... - Page 212 Display setups DPO70000SX, MSO/DPO70000DX, MSO/DPO70000C, DPO7000C, and MSO/DPO5000B Series...
-
Page 213: Horizontal And Acquisition Setups
Horizontal and acquisition setups Horizontal-Acquisition control window (Horizontal tab) From the Horiz/Acq menu, select Horizontal/Acquisition Setup; then open the Horizontal tab. Overview The Horizontal control window manages the horizontal parameters of waveforms. The controls in the Horizontal tab are common to all channels. -
Page 214: Set Record Length Limit
Horizontal and acquisition setups What do you want to do next? Learn more about the Horizontal Setup controls. Learn about the Acquisition Setup controls Set record length limit From the Horiz /Acq menu, select Horizontal/Acquisition Setup; then click Record Length Limit. To use Use the Record Length Limit entry box to set the maximum record length. -
Page 215: Horizontal Digital Control Window
Horizontal and acquisition setups Horizontal digital control window NOTE. The Horizontal Digital control window is only available when a parallel bus is selected on MSO models and on DPO5000B models with option MSOE installed, and DPO70000DX instruments with option MSOU installed. From the Horiz /Acq menu, you can view the Digital Sample Rate and Digital Resolution of logic waveforms. -
Page 216: Horizontal Position-Scale Control Window
Horizontal and acquisition setups Horizontal Position-Scale control window From the Horiz /Acq menu, select Position/Scale. Overview Use the Horizontal control window to set the horizontal position and scale of displayed waveforms. For information on the controls, click the buttons. Delay Mode ■... -
Page 217: Horizontal Position-Scale Control Window With Delay Mode On
Horizontal and acquisition setups Horizontal Position-Scale control window with delay mode on From the Horiz /Acq menu, select Position/Scale. Overview Use the Horizontal control window to set the horizontal delay and the horizontal scale of the displayed waveforms when the horizontal delay is on. -
Page 218: Horizontal-Acquisition Control Window (Acquisition Tab)
Horizontal and acquisition setups Horizontal-Acquisition control window (Acquisition tab) From the Horiz /Acq menu, select Horizontal/Acquisition Setup; then open the Acquisition tab. Overview Use the Acquisition tab to set the acquisition parameters for all live waveforms. The Acquisition controls are common to all channels. -
Page 219: Autoset
Horizontal and acquisition setups The following screen appears on MSO/DPO5000B Series instruments: Behavior Acquisition is the process of sampling the analog input signal, digitizing the signal to convert it into digital data, and then assembling the signal information into a waveform record. The instrument creates a digital representation of the input signal by sampling the voltage level of the signal at regular time intervals. - Page 220 Horizontal and acquisition setups To use If you use Autoset when one or more channels are displayed, the instrument selects the lowest numbered channel for horizontal scaling and triggering. The instrument individually scales all displayed vertical channels. If you use Autoset with no vertical channels displayed, the instrument turns on and scales channel 1.
-
Page 221: Set Autoset Preferences
Horizontal and acquisition setups Control Changed by Autoset to Vertical Bandwidth Full Vertical Offset 0 volts Zoom Set autoset preferences From the Utilities menu, select User Preferences and the Prompts tab. Overview You can set the instrument to display a prompt asking you to confirm the requested action before applying the Autoset function. To use Select User Preferences from the Utilities menu to display the Prompt Before Action... -
Page 222: Enable Enhanced Effective Number Of Bits
Horizontal and acquisition setups To use Click Undo. Only the parameters set by the last autoset are undone. The settings you have changed since the last autoset ■ (that are not controlled by Autoset) remain unchanged. Click OK to close the window and proceed without an Undo. ■... -
Page 223: Enable Fast Acquisitions
Horizontal and acquisition setups Enable fast acquisitions From the Horiz /Acq menu, select Fast Acquisitions, or press the front panel Fast/Acq button. Overview Use these controls to turn the Fast Acquisition feature on or off and to optimize waveform detail. To use Click the Fast Acq button to turn Fast Acquisitions On or Off. -
Page 224: Start And Stop Waveform Acquisitions
Horizontal and acquisition setups Start and stop waveform acquisitions From the Horiz/Acq menu, select Run/Stop. Overview Use the Run/Stop control window to start and stop waveform acquisition. To use Click Run/Stop to toggle waveform acquisition. (You can also press the front panel Run/Stop button.) ■... -
Page 225: Enable Roll Mode
Horizontal and acquisition setups Enable roll mode From the Horiz /Acq menu, select Roll Mode Auto, or click Roll Mode in the Acquisition tab of the Horizontal/Acquisition control window. Overview Use these controls to turn Roll Mode on or off. Roll mode lets you see acquired data without waiting for the acquisition of a complete waveform record. -
Page 226: Select A Sampling Mode
Horizontal and acquisition setups Select a sampling mode From the Horiz /Acq menu, select Sampling Modes, or select a sampling Mode in the Acquisition tab of the Horizontal/Acquisition control window. To use To enable a sampling mode, click one of the Sampling Modes button. In Real Time, the instrument acquires all the points in a waveform record after one trigger event. - Page 227 Horizontal and acquisition setups The sampling speeds and the number of channels you choose affect the mode the instrument uses to sample waveforms. The instrument always uses real-time sampling at slower time base settings; faster time settings force the instrument to switch from real-time sampling to equivalent-time sampling.
-
Page 228: Set The Resolution
Horizontal and acquisition setups Sampling mode selection DPO7354C, DPO7254C, and DPO7104C with Option 2SR 10 ns/div ≤5 ns/div ET/IT ET/IT ET/IT The type of equivalent-time sampling the instrument uses is called random equivalent-time sampling. Although it takes the samples sequentially in time, it takes them randomly with respect to the trigger. Random sampling occurs because the instrument sample clock runs asynchronously with respect to the input signal and the signal trigger. -
Page 229: Select The Acquisition Mode
Horizontal and acquisition setups Select the acquisition mode From the Horiz /Acq menu, highlight Acquisition Mode; then select Mode. Overview The acquisition mode determines how the waveform data points are produced from the sampled data. To use Select the acquisition mode by clicking the appropriate button. If you use Average or Envelope mode, select the number of waveforms for that mode using the multipurpose knob. -
Page 230: Acquisition Interval
Horizontal and acquisition setups Acquisition interval The acquisition interval is the time between sample points. For mathematical purposes, it is the time covered by the waveform record divided by the record length. FastFrame control windows From the Horiz /Acq menu, select FastFrame Setup. Overview Use the FastFrame control windows to capture and view a series of triggered acquisitions without wasting acquisition memory on the dead time between the trigger events. - Page 231 Horizontal and acquisition setups Confine automatic measurements only to the displayed frame. ■ Overlay multiple frames for easy comparison. ■ FastFrame is not compatible with the following features or modes: Equivalent Time ■ Histograms ■ Fast Acquisitions ■ Average ■ Envelope ■...
-
Page 232: Set Up Zoom
Horizontal and acquisition setups Set up zoom From the Vertical or Horiz/Acq menu, select Zoom Setup. Overview Use these control windows to define the overall settings of the Zoom controls. To use Click the Zoom <1–4> tabs to set up each zoom area. The controls under each tab apply only to that zoom area. Click the ■... - Page 233 Horizontal and acquisition setups Behavior Use the Zoom Setup control window to magnify (zoom in on) a waveform without changing the main acquisition parameters. Use Zoom when you want to temporarily look at details of a waveform. If the zoom areas are unlocked, the Horizontal Position and Factor controls affect only the selected zoom area. The Horizontal Position and Factor will affect all zoom areas that are locked together, such that a change to one zoom area will change the horizontal position and factor of all the locked zoom areas.
- Page 234 Horizontal and acquisition setups DPO70000SX, MSO/DPO70000DX, MSO/DPO70000C, DPO7000C, and MSO/DPO5000B Series...
-
Page 235: Error Detector Setups
Error detector setups Use the serial error detector From the Analyze menu, select Serial Error Detector. Error detector is not available on DPO70000SX instruments. Overview The Serial Error Detector requires option ERRDT. The oscilloscope Error Detector conducts Bit, Frame, Symbol, and Character tests much like a BERT. -
Page 236: Set Up The Serial Error Detector
Error Detector. These AWG setup files are located in Win7 in the directory C: \User\Public\Tektronix\Tekscope\ErrorDetector\AWG Alternatively, you can verify operation by disconnecting and reconnecting the signal. There will be massive errors when the signal is disconnected, but after the signal is reconnected the Error Detector will resynchronize to the signal, clear the error counts and rates, and resume testing. - Page 237 Then select the Save button to actually save the setup into the file. To recall a setup file, just browse to the file you want and select Open. The default location for Error Detector setup files in Win7 is C:\Users\Public\Tektronix\TekScope \ErrorDetector.
-
Page 238: Set Error Detector Advanced Settings
■ SSC is ON by default and Tektronix recommends that it should always be ON, even if there is no SSC on the signal. To ignore align primitives, select the Ignore Align Primitives option button and specify the primitives using the keypad or ■... -
Page 239: Specify The Error Detector Test Pattern
Error detector setups Specify the error detector test pattern From the Analyze menu, select Serial Error Detector, press Setup, and then select the Test Pattern tab. Error detector is not available on DPO70000SX instruments. Overview The Test Pattern Setup provides control of the signal test pattern length and the Sync Pattern description. These are often the most difficult settings, because they require knowledge of the signal. -
Page 240: Set The Error Detector Stop Condition
Error detector setups Set the error detector stop condition From the Analyze menu, select Serial Error Detector, press Setup, and then select the Stop Condition tab. Error detector is not available on DPO70000SX instruments. Overview Use this control window to specify the action performed when the error detector detects an error. To use From the Stop Condition tab, select the Stop When condition. - Page 241 Error detector setups Then the typical sequence is to connect the DUT between the oscilloscope and the signal generator or AWG for actual testing. After recabling, only a reSync and Run are needed, even for Bit testing, because the signal test pattern has already been acquired into the oscilloscope memory.
- Page 242 Error detector setups What do you want to do next? Use the Error Detector. Set up the serial error detector. Set error detector advanced settings. Specify the error detector test pattern. Set the error detector stop condition. DPO70000SX, MSO/DPO70000DX, MSO/DPO70000C, DPO7000C, and MSO/DPO5000B Series...
-
Page 243: Linktraining
LinkTraining Link training can facilitate debugging the high speed serial link training protocol found in 100G Datacom applications. Standards include Ethernet and InfinBand using NRZ electrical signaling at 25 Gbps, such as 100GBASE-CR4, CEI LR, 100GBASE-LR4 and CAUI4. Link Training environment Oscilloscope channels are used to monitor both directions of a serial lane and present Tx and Link Partner request/response information for each direction. -
Page 244: Link Training Connections
LinkTraining Link training connections The oscilloscope can monitor two connected DUTs, or a single DUT in a loopback configuration. The signals are accessed using breakout fixtures, 80/20 power splitters, and P7633 differential probes. Lane1 uses oscilloscope Ch1 and Ch3, while Lane2 uses oscilloscope Ch2 and Ch4 (to maximize sample rate). -
Page 245: Start Link Training
LinkTraining Start Link Training To start Link Training do the following steps: From the Menu Bar select Analyze > Link Training. Press the Arm button. Start Link Training on the device under test (DUT). Starting Link Training on the DUT is DUT-specific, but is typically done from a command line console program. DPO70000SX, MSO/DPO70000DX, MSO/DPO70000C, DPO7000C, and MSO/DPO5000B Series... -
Page 246: Typical Link Training Display
LinkTraining Typical Link Training display Protocol activity is filtered during real time acquisition of the Training Sequence and each significant change is captured and time-stamped while redundant messages are discarded. This dramatically reduces the volume of data stored and expedites viewing of results. -
Page 247: Results Table
LinkTraining Results Table The Results Table displays all control channel information with columns indicating Request and Response activity for each direction. Each row is time-stamped and contains a unique protocol event. Click on a row of the Results Table to see a decoded waveform for the Control Channel. - Page 248 LinkTraining The following programing commands are available for Link Training: :LINKTRaining:STAte <OFF | ON> //Default: OFF :LINKTRaining:ARMscope <OFF | ON> //Default: OFF :LINKTRaining:STANdard <Ethernet_100G_KR4 | Ethernet_100G_CR4> //Default: Ethernet_100G_KR4 :LINKTRaining:LANE1 <OFF | ON> //Default: ON :LINKTRaining:LANE2 <OFF | ON> //Default: OFF :LINKTRaining:LANE3 <OFF | ON>...
-
Page 249: Mask Testing Setups
Mask testing setups Mask setup Mask testing control window (Masks tab) From the Mask menu, select Mask Setup. Overview. Use these controls to set up a mask test. You can set the type of mask, polarity, display, and alignment. NOTE. The Comm Trigger is designed to work with communications mask and standard testing. Mask testing automatically uses Communication triggers. -
Page 250: Serial Mask Testing Option
Mask testing setups Serial mask testing option Some instruments require mask testing options: Install Option MTM on DPO7000C and MSO/DPO5000B Series instruments. ■ ■ Install Option MTH on MSO70000C/DX and DPO70000C/DX Series instruments. Select a mask type From the Mask menu, select Mask Setup; then open the Masks tab. Overview. -
Page 251: Mask Types And Standards
Mask testing setups Mask types and standards The following tables list the Mask Types and Standards available with Mask Testing. The standards available for your instrument depend on the bandwidth and configuration of your instrument. The Comm Trigger is designed to work with communications mask and standard testing. Mask testing automatically uses Communication triggers. -
Page 252: Use Mask Display Controls
Mask testing setups ITU-T masks FC2125E Norm, Gamma, FC2125E Abs, Beta, Transm FC2125E Abs, Delta, Transm FC2125E Abs, Gamma, Trans Transm FC2125E Abs, Beta, Recv FC2125E Abs, Delta, Recv FC2125E Abs, Gamma, Recv None 2.5 Optical 2.5 Gb/s 2.5 Electrical 2.5 Gb/s None G1 Tx 1.5 Gb/s G1 Rx 1.5 Gb/s... -
Page 253: Mask Configuration Controls
Mask testing setups Behavior. When the On/Off control is on, the mask is displayed on the graticule. When the On/Off control is off, the mask is not displayed. Click the Config button to replace the Mask Testing control window with the Mask Configuration Display control window. What do you want to do next? Learn about the Mask Configuration Display control window. - Page 254 Mask testing setups Configure mask autoset. From the Mask menu, highlight Mask Configure; then select Autoset. From the Mask Testing control window, click the Autoset Config button. Use this control window to set the vertical, horizontal, and trigger autoset parameters, activate autofit or autoset, choose the autoset mode, return to the default autoset configuration, or go to the Mask Testing control window.
- Page 255 Mask testing setups Configure mask autofit. From the Mask menu, highlight Mask Configure; then select Autofit. From the Mask Testing control window, click the Autofit Config button. Overview. Use this control window to configure the limits for minimizing mask hits, return to default setting, or return to the Mask Testing control window.
-
Page 256: Set Up Mask Alignment
Mask testing setups Set up mask alignment From the Mask menu, select Mask Setup; then open the Masks tab. To use. Click the Autoset control to perform an autoset on the signal. ■ Click the Autofit control to turn the minimize hits function on or off. ■... -
Page 257: Edit A Mask
Mask testing setups Edit a mask From the Mask menu, select Mask Edit Setup, or click the Edit User Mask button in the Mask Testing control window. Overview. Use this control window to select the Segment and Vertex for editing, set the Horizontal and Vertical mask values, and Save or Recall masks. -
Page 258: Tolerance Setup
Mask testing setups Tolerance setup Set up mask testing source-tolerance From the Mask menu, select Source. Overview. Use this control window to select the source of the signal you want to test. For information on the controls, click the buttons. Channels ■... -
Page 259: Fail Setup
Mask testing setups Overview. Use this control to turn the margin mode on or off and to set the percentage of margin used for the mask test. To use. Click the On/Off button to turn the mask margin tolerance on or off. Click the up and down arrows or click in the Margins entry box to activate the pop-up keyboard and set the percentage of margin tolerance. -
Page 260: Set Up Mask Test Fail Notification
Mask testing setups Overview. Use this control window to set the parameters for passing or failing the mask test, to set the test notification mode, to select the polarity for testing, and whether to repeat the test. For information on the controls, click the buttons. Mask Controls ■... -
Page 261: Set Up Mask Test Completion Notification
Mask testing setups Behavior. Beep. When Beep is turned on, the instrument beeps when a mask test fails. ■ E-mail. When E-mail is turned on, the instrument sends an E-mail when a mask test fails. Click the Setup button and ■... -
Page 262: Set Mask Test Parameters
Mask testing setups Behavior. Beep. When Beep is turned on, the instrument beeps when the test is completed. Beep is not available on MSO/DPO5000B ■ Series instruments. SRQ. When SRQ is turned on, the instrument sends a GPIB SRQ command when a test is completed. ■... -
Page 263: Select The Sound Source
Mask testing setups Behavior. Entering a number in the Number of Waveforms (Samples) entry box stops the test when that number has been reached. If the waveforms or samples that fail are equal to or greater than the number in the Fail Threshold entry box, the test has failed. If the failed waveforms or samples are less than the number in the Fail Threshold entry box, the test passes. -
Page 264: Set The Mask Polarity
Mask testing setups Set the mask polarity From the Mask menu, select Pass/Fail Setup. Overview. Use the Mask Polarity control to select whether to test the positive or negative pulse or both. To use. Click Positive to set the pulse polarity to positive. ■... -
Page 265: Fail Results Setup
Mask testing setups To use. Click the On/Off button to start the test. ■ Click the Repeat button to run the test continuously. ■ Click the Controls button to open the Mask Test control window. ■ Behavior. When the Repeat control is on, the test runs continuously. When you click the On/Off button, the test starts using the parameters from the Mask Test control window and the Pass/Fail Results window is displayed. -
Page 266: View The Mask Test Summary
Mask testing setups Overview. Use this control window to view real time test results, start the test, reset the test at the beginning, activate the waveform failure log file, and open the Mask Test Controls control window. For information on the controls, click the buttons. Test Summary ■... -
Page 267: View The Mask Hits Per Segment
Mask testing setups Behavior. The Pass/Fail Test Summary fields provide a real time summary of the test results. Waveforms or samples tested shows how many waveforms or samples have been tested in relation to how many were specified in the test setup. Source indicates what signal source was used for the test. -
Page 268: Start Or Reset A Mask Test
Mask testing setups Start or reset a mask test From the Mask menu, select Pass/Fail Results. Overview. Use these controls to start a test or reset the test to the starting point. To use. Click the On/Off control to start the test. ■... - Page 269 Mask testing setups Overview. Use this control window to access the Edit User Mask control window or to copy a standard mask as a user mask. You can also select the standard you want to copy or edit from the standard drop-down list. NOTE.
-
Page 270: Set User Mask Edit Controls
Mask testing setups Set user mask edit controls From the Mask menu, select Mask Edit Controls. Overview. Use this control window to select the segment and vertex for editing and set the Vertical and Horizontal Mask Values. To use. Click the up and down arrows to select the segment or the vertex of the mask to be edited. ■... - Page 271 Mask testing setups Overview. Use this dialog box to recall a saved user mask. To use. Under Recall What, click User Mask. ■ In the Look in drop-down list box, navigate to the location of the user mask. ■ Click on the name of the mask file you want to recall. You can also click the keyboard icon to access the pop-up keyboard ■...
-
Page 272: Limit Test
Behavior. The Recall dialog box displays when you click Recall in the Mask Edit control window. Clicking Recall replaces the current mask with the mask that you selected in the Recall dialog box. Masks are saved in unless you choose another directory. C:\Users\[Username]\Tektronix\TekScope\Masks What do you want to do next? Learn about saving masks. Learn more about mask types. -
Page 273: Save A Template
Mask testing setups To use. Use the following procedure to build a template from a known signal and compare it to an active signal. Create a template: Select the signal Source and template Destination in the drop-down list boxes. Click in the Vertical and Horizontal Tolerances entry boxes and use the multipurpose knobs to specify the test limit tolerances. -
Page 274: Set Up Limit Test Failure Notification
Behavior. This dialog box opens when you select File from the Limit Test Setup control window. The default file type is a waveform (.WFM). The default folder is C:\Users\[Username]\Tektronix\TekScope\waveforms NOTE. Any characters that you enter in the file name box become part of the file name. The instrument does not use any user- defined file extensions. - Page 275 Mask testing setups Overview. Use the Limit Test controls to set the mode of failure notification when a mask limit test fails. To use. Click a button to switch the control on or off. Use the controls to indicate the failure notification method, if a waveform fails a mask limit test.
- Page 276 Mask testing setups DPO70000SX, MSO/DPO70000DX, MSO/DPO70000C, DPO7000C, and MSO/DPO5000B Series...
-
Page 277: Math Setups
Math setups Set up a math waveform From the Math menu, select Math Setup. Overview Use the Math Setup control window to set up and define math waveforms. NOTE. Math calculations are not available on digital channels. This document is for more than one instrument. Your instrument, or instrument setup, may not include some of these features. For information on the controls, click the buttons. -
Page 278: Set Up Math Averaging
Math setups Learn about the Math Waveform controls. Learn about the Equation Editor. Set up math averaging From the Math menu, select Set Math Averages. Overview Use this control window to specify the number of times the selected math waveform is averaged. -
Page 279: Set Math Variables
Math setups Set math variables From the Math menu, select Set Math Variables. Overview Use this control window to quickly set the math variables to use in your math expression. To use Use the 1 – 4 or 5 – 8 tabs to access the variables you want. ■... -
Page 280: Use Custom Analysis Functions
Math setups Learn about writing Math Plugins Learn about writing MATLAB custom function plugins Use custom analysis functions From the Math menu, select Math Setup. To use Select a custom function from the Custom Analysis Functions drop-down list. Behavior Custom functions are math functions that you have created and installed on the instrument. Once installed you can select and use them just like the instrument built in functions. -
Page 281: Basic Spectral Setups
Math setups Behavior Clicking on the link takes you to the MathWorks Web site. Use the drop down list to select a MATLAB plugin to insert in your math equation. If MATLAB or the instrument toolbox is not installed, the drop down list is replaced with a instructions to install MATLAB and the toolbox. What do you want to do next? Learn about using Math Plugins Learn about writing Math Plugins... -
Page 282: Use Front Panel Spectral Controls
Math setups Use front panel spectral controls From the Math menu, select Basic or Advanced Spectral; in the Spectral Setup window, click the ? mark. Not available on DPO5000 and DPO70000SX Series instruments. To use. To map the spectral controls to the instrument front panel, do the following: From the Horz/Acq menu, select Horizontal/Acquisition Setup. -
Page 283: Set Up The Frequency Spectral Controls
Math setups To use. For information on the controls, click the buttons. Create / Edit ■ Vert Axis ■ Tracking ■ Home < - > Apply ■ Editor ■ Frequency ■ ■ ■ Gating After you create the spectral waveform, use the controls on the right side of the control window to position and adjust the waveform so that you can view the data you are interested in. - Page 284 Math setups To use. Click in an entry box, and then use the multipurpose knobs to set the Center Freq , Freq Span, and Res BW. ■ Click Full to set the frequency span to full. ■ DPO70000SX, MSO/DPO70000DX, MSO/DPO70000C, DPO7000C, and MSO/DPO5000B Series...
-
Page 285: Set Up Spectral Gating Controls
Math setups Behavior. The maximum frequency span is equal to half of the sample rate. If you need a higher frequency span, set the sample rate to a larger value. The Resolution Bandwidth determines how small of a frequency difference can be resolved in the frequency domain output data. It defines the bandwidth of filters used to perform the frequency domain analysis. - Page 286 Math setups To use. Select an FFT window type from the Window Type list. Click in the Gate Position, Gate Duration, or Gate Length entry boxes and use the multipurpose knobs to set the gating parameters. Behavior. An FFT Window Type can help reduce spectral noise for many types of signals.
-
Page 287: Using Spectral Analysis
Math setups Using spectral analysis Spectral analysis overview You can use math waveforms to perform FFT (Fast Fourier Transform) measurements with the instrument. The FFT process mathematically converts the standard time-domain signal (repetitive or single-shot acquisition) into its frequency components, providing spectral analysis capabilities. -
Page 288: The Fft Display
Math setups Nyquist frequency The highest frequency that any digital oscilloscope can measure without errors is one-half of the sample rate or frequency. This frequency is called the Nyquist frequency. The FFT waveform displays the input signal frequency components from DC (0 Hz) to the Nyquist frequency. ■... -
Page 289: Fft Windows
Math setups FFT windows The FFT process assumes that the part of the waveform record used for FFT analysis represents a repeating waveform that starts and ends at or near the same voltage of a cycle. In other words, it is an integer number of cycles. When a waveform starts and ends at the same amplitude, there are no artificial discontinuities in the signal shape, and both the frequency and amplitude information is accurate. -
Page 290: Fft Window Characteristics
Math setups FFT window characteristics Each FFT window is a trade-off between frequency resolution and magnitude accuracy. What you want to measure and your source signal characteristics help determine which window to use. Use the following guidelines to select the best window. FFT window Characteristics Best for measuring... -
Page 291: Aliasing
Math setups Aliasing Problems occur when the instrument acquires a signal containing frequency components that are higher in frequency than the Nyquist frequency. The frequency components that are above the Nyquist frequency are under sampled and appear to "fold back" around the Nyquist frequency, showing as lower frequency components. These incorrect components are called aliases. To quickly check for aliasing, slowly decrease the horizontal time scale. -
Page 292: Math Equation Editor
Math setups Math equation editor Math equation editor control window From the Math menu, select Equation Editor, or click the Editor button in the Math Setup or Spectral Setup control windows. Overview. Use the Math Equation Editor control window to define or edit math waveforms. The readout shows the math expression as you construct it. -
Page 293: Math Equation Editor (Time Tab)
Math setups Behavior. You can create a math expression using one or more of the following approaches: Open the tabs and click one or more of the buttons to insert functions into the math expression. Then select one of the ■... - Page 294 Math setups To use. Click a control to insert time domain functions into the math expression. Click one of the Primitive buttons to insert a Time function into the math expression. Primitive buttons Average Sqrt FABS Integral Log 10 Ceil ASin ACos ATan...
- Page 295 Math setups Behavior. You can use any of the channels as arguments for the function. You can also create nested functions by inserting one function into the argument portion of another. Consider the following when working with math waveforms: Scale and position the source waveform so it is contained on-screen; off-screen waveforms may be clipped, resulting in ■...
- Page 296 Math setups Invert Inserts the text INV( into the math expression. Enter an argument to the function. The invert function inverts the argument within the parentheses. Largest integer Inserts the text FLOOR( into the math expression. The FLOOR function takes the largest integer < the expression. Maximum value Inserts the text MAX( into the math expression.
-
Page 297: Math Equation Editor (Spectral Tab)
Math setups Math equation editor (Spectral tab) From the Math menu, select Equation Editor; then open the Spectral tab. To use. Click a control to insert spectral analysis functions into the math expression. Click one of the Predefined Functions to insert a Spectral function into the math expression. Spectral functions Real Phase... -
Page 298: Math Equation Editor (Var Tab)
Math setups Math equation editor (Var tab) From the Math menu, select Equation Editor; then open the Var tab. To use. Click in a Var <1-8> = entry box and use the multipurpose knobs to enter a value for the variable. Click More to add additional variables Click the associated button to enter that variable into the math expression. -
Page 299: Math Equation Editor (Filter Tab)
Math setups Behavior. The list contains the measurements defined in the Measurement control window. The buttons are only active for defined measurements; they are unavailable for any undefined measurements. Measurements are continuously updated on live acquisitions. The most recent measurement values are always used in math expressions. - Page 300 Math setups DPO70000SX, MSO/DPO70000DX, MSO/DPO70000C, DPO7000C, and MSO/DPO5000B Series...
-
Page 301: Measurement Setups
Measurement setups Measurement snapshot control window From the Measure menu, select Measurement Snapshot. Overview Measurement Snapshot lists all of the automated measurements that are available for a selected waveform. To use Select the waveform for which you want to take a snapshot. Click the Snapshot button in the Measurement control window, or select Snapshot from the Measure menu. -
Page 302: Measurement Setup Control Window (Amplitude Tab)
TIP. For information on measurement algorithms, refer to the Automatic Measurement Algorithms and Methods for High- Performance Communications Applications application note, 85w_15763.pdf. This application note is available from the www.tektronix.com Web site. What do you want to do next? Return to the Measurement control window overview. -
Page 303: Measurement Readouts
When an error icon displays, the instrument also displays an error code. For a list of instrument error codes, messages, and definitions, refer to the Programmer guide available on the product software DVD or from www.tektronix.com/manuals. The next table shows some of the icons with examples of their meaning. -
Page 304: Select An Amplitude Measurement
Measurement setups Icon Meaning example The instrument is in the process of acquiring data and calculating the measurement. The instrument encountered an error. The instrument cannot locate the specified edge of the signal. The instrument cannot measure a waveform that is “clipped” on the screen. - Page 305 Measurement setups To use Use the Ampl tab to select automatic amplitude measurements. Select a source with the Channels Selector. Click a Measurements button to add an Amplitude measurement to the Measure list: Measurement buttons Amplitude +Ovrshoot AC RMS -Ovrshoot Pk-Pk Mean Cycle RMS...
- Page 306 Measurement setups Learn about other measurements. Learn about communication measurements. Learn more about the Measurements list. Learn more about the Measurement controls. Amplitude This voltage measurement is the high value minus the low value measured over the entire waveform or gated region: Amplitude = High –...
-
Page 307: Measurement Setup Control Window (Time Tab)
Measurement setups Negative Overshoot = (Low – Minimum) × Amplitude × 100% Mean This voltage measurement is the arithmetic mean over the entire waveform or gated region. Cycle Mean This voltage measurement is the arithmetic mean over the first cycle in the waveform or the first cycle in the gated region. Measurement setup control window (Time tab) From the Measure menu, select Measurement Setup;... -
Page 308: Select A Time Measurement
Measurement setups Behavior From this control window, you can do the following: Define time measurements for the selected waveforms. ■ Select a waveform source using the Channels Selector. You can measure live waveforms, math waveforms, or reference ■ waveforms. Create a list of measurements to appear in the main graticule or in a separate measurement window. ■... - Page 309 Measurement setups To use Use the Time tab to select automatic time measurements. Select a source with the Channels Selector. Click a Measurements button to add a Time measurement to the Measure list: Time measurements Rise Time Pos Width Period Fall Time Neg Width Freq...
-
Page 310: Measurement Setup Control Window (Communications Tab)
Measurement setups Positive Width This timing measurement is the distance (time) between the mid reference (default 50%) amplitude points of a positive pulse. The measurement is made on the first pulse in the waveform or gated region. Negative Width measurement This timing measurement is the distance (time) between the mid reference (default 50%) amplitude points of a negative pulse. - Page 311 Measurement setups Behavior From this control window, you can do the following: Define communications measurements for the selected waveforms. ■ Select a waveform source using the Channels Selector. You can measure live waveforms, math waveforms, or reference ■ waveforms. Create a list of measurements to appear in the main graticule or in a separate measurement window. ■...
-
Page 312: Select A Communications Measurement
Measurement setups Select a communications measurement From the Measure menu, select Measurement Setup; then open the Comm tab. To use Use the Comm tab to select automatic communications measurements. Select a source with the Channels Selector. Click a Measurements button to add a Communications measurement to the Measure list: Communication measurements Ext Ratio Eye Width... - Page 313 Measurement setups Learn more about the measurement controls. Extinction Ratio Extinction ratio is the ratio of eye top to base. This measurement is only valid when the acquisition mode is set to WfmDB, FastAcq is enabled, or the measurement is taken on a reference waveform saved in FastAcq mode. Ext Ratio = pTopMean/pBaseMean Extinction Ratio Percent Extinction ratio percent is the ratio of eye base to top expressed as a percentage.
-
Page 314: Measurement Setup Control Window (More Tab)
Measurement setups Jitter 6 Sigma Jitter 6 sigma is six times the RMS value of the edge jitter in the current horizontal units. Jitter 6 sigma = 6 × (JitterRMS) Noise Peak-to-Peak Noise p-p is the peak-to-peak value of the noise of the top or base of the signal as specified by you. To ensure accurate noise values, be sure to set the signal type to Eye when measuring an Eye signal. - Page 315 Measurement setups Behavior From this control window, you can do the following: Define miscellaneous measurements for the selected waveforms. ■ Select a waveform source using the Channels Selector. You can measure live waveforms, math waveforms, or reference ■ waveforms. Create a list of measurements to appear in the main graticule or in a separate measurement window. ■...
-
Page 316: Select A Miscellaneous Measurement
Measurement setups Select a miscellaneous measurement From the Measure menu, select Measurement Setup; then open the More tab. To use Use the More tab to select measurements not found under any of the other measurement tabs. Select a source with the Channels Selector. -
Page 317: Counter Measurement Setup
Measurement setups Area Area is a voltage-over-time measurement. The measurement is the area over the entire waveform or gated region expressed in volt-seconds. The area above the common reference point is positive while the area below the common reference point is negative. - Page 318 Measurement setups The resultant count, minimum, maximum, average, and deviation values are shown in the upper-left corner of the display. Scaling. The measurement is scaled by subtracting the reference interval from the measurement and then multiplying the result by the gain. Click Set to 0 to set the Reference Interval to 0.
-
Page 319: Set Up Measurement Statistics
Measurement setups A-B Trigger Time Interval. The A-B Trigger Time Interval Application also uses trigger hardware to measure the time between the A-Event and the B-Event in an A-B Sequence trigger. The A- and B-Events may be any combination of trigger types: edge, glitch, width, and so on. -
Page 320: Set Up Reference Levels
Measurement setups Return to the Measurement Setup control window overview. Learn about setting the Reference Level controls. Learn about using gating to specify measurement areas. Set up reference levels From the Measure menu, select Reference Levels, or click the Ref Levs button in the Measurement Setup window. Overview Use the Reference Levels control window to define unique reference levels for each measurement. - Page 321 Measurement setups Reference levels Min-max uses the highest and lowest values of the waveform record. This setting is best for examining waveforms that have no large, flat portions at a common value, such as sine waves and triangle waves - almost any waveform except for pulses. Histogram Mode sets the values statistically.
-
Page 322: Set Up Measurement Gating
Measurement setups High reference The High Reference defines the high reference level of a waveform; the default level is 90%. This reference level is used with the Low Reference level in the calculation of rise and fall times. To change this level, click the control, and then set the level with the multipurpose knob. -
Page 323: Set Up Histogram Measurements
Measurement setups TIP. Click, hold, and drag across the part of the graticule that you want to measure. After you define the measurement area, select Measurement Gating from the shortcut menu to place gating cursors around the measurement area. Use the same click, hold, and drag method to turn measurement gating off; just select Measurement Gating Off in the shortcut menu. -
Page 324: Set Up Histograms
Measurement setups Behavior From this control window, you can do the following: Define histogram measurements for the selected waveforms. ■ Select a waveform source using the Channels Selector. You can measure live waveforms, math waveforms, or reference ■ waveforms. Create a list of measurements to appear in the main graticule or in a separate measurement window. ■... - Page 325 Measurement setups To use Use the Channels Selector to select the source waveform for the histogram measurements. Click the type of histogram you want to use for your measurement, Horiz (Horizontal) or Vert (Vertical). When you make this selection, the instrument continues to calculate histograms until you set Display to Off. Click either Linear or Log to set the scaling.
- Page 326 Measurement setups Histogram box limits - horizontal Select a mode: Specify the adjustment: Enter limits: Set histogram box limits - vertical Select a mode: DPO70000SX, MSO/DPO70000DX, MSO/DPO70000C, DPO7000C, and MSO/DPO5000B Series...
- Page 327 Measurement setups Specify the adjustment: Enter limits: Set histogram box location - horizontal Select a mode: Specify the adjustment: DPO70000SX, MSO/DPO70000DX, MSO/DPO70000C, DPO7000C, and MSO/DPO5000B Series...
- Page 328 Measurement setups Enter limits: Set histogram box location - vertical Select a mode: Specify the adjustment: Enter limits: DPO70000SX, MSO/DPO70000DX, MSO/DPO70000C, DPO7000C, and MSO/DPO5000B Series...
-
Page 329: Analyzing Waveforms
Analyzing waveforms Control marks From the Analyze menu, select Mark. Overview Use the Mark Control Window to manually set and clear marks on acquired waveforms in areas of interest. To use Use the controls in this window to set a mark on a waveform. You can return to the mark and analyze the waveform in the area at a later time. -
Page 330: Select A Search Type
Analyzing waveforms Select a search type From the Analyze menu, select Search; then open the Select tab. Overview Use the controls in this window to set up the instrument to automatically search and place mark(s). The instrument can search for and mark many of the same conditions that are available for triggers. -
Page 331: Select The Search Type
Analyzing waveforms Select the search type From the Analyze menu, select Search; then open the Select tab. Overview Use these controls to select the type of search you want the instrument to perform to automatically place marks on a waveform. NOTE. - Page 332 Analyzing waveforms To use In the Type-Source table, identify the search Type you want to use; then click the right arrow for that search type under Source. After the Source Selection window opens, identify the Channel, Source, Clock, or Logic parameters to be used in the search.
-
Page 333: Configure A Search
Analyzing waveforms Configure a search From the Analyze menu, select Search; then open the Configure tab. Overview Use the controls in this window to set up the instrument to automatically search and place marks. NOTE. Search and mark operations are not available on digital channels. To use For information on the controls, click the buttons. -
Page 334: Copy Search Settings
Analyzing waveforms Behavior Clicking an entry in the Type column activates the individual search controls, similar to the one shown above. These controls vary depending on the search Type. Setting the search conditions is similar to setting the parameters for an Event Trigger. -
Page 335: Set Advanced Ddr Search Settings
Analyzing waveforms Set advanced DDR search settings From the Analyze menu, select Search; then open the Configure tab. Overview Use the controls in these windows to set conditions for the instrument to automatically search and place marks. To use Under Type, select one of the following entries DDR Read, DDR Write, and DDR Read & Write in the Select tab. Specify a source for the selected DDR search in the Configure tab. -
Page 336: Set Search Parameters
Analyzing waveforms Set search parameters From the Analyze menu, select Search; then open the Configure tab. Overview Use the controls in these windows to set conditions for the instrument to automatically search and place marks. To use The available controls depend on the searches you selected in the Search - Select Control Window. Under Type, click on an entry in the Type-Source table. -
Page 337: Check Search Results
Analyzing waveforms Search type Description Equivalent trigger Timeout Searches for no pulse in a specified time. Timeout Trigger Control Window Transition Search for rising and or falling edges that Transition Time Trigger Control Window are >, <, =, or ≠ a user-specified time. Window Searches for a signal that is entering or Window Trigger Control Window... -
Page 338: View The Search Counts Results
Analyzing waveforms Behavior The Location and Time Delta columns list the search results for each mark placed by the instrument for the search Type indicated. You can also use the buttons to edit or change the format of the table and save results to a file. View the search counts results From the Analyze menu, select Search;... -
Page 339: View Search Marks
Analyzing waveforms Behavior The table in this window displays count results for automated search and mark operations. The Count column displays the number of times the search conditions were met for a specific Type of search. You can also use the buttons to edit the Results Mark Table and save results to a file. View search marks From the Analyze menu, select Search;... -
Page 340: Use Search And Mark Controls
Analyzing waveforms To use Check the Stop Acquisitions if event found option box to stop acquisitions during a search, if a match is found. ■ Use search and mark controls From the Analyze menu, select Search, and then open any of the tabs. Overview Use these controls to find points of interest, and place or edit marks on the waveform. - Page 341 Analyzing waveforms To use Search. Click this button to turn the Search and Mark feature On or Off. Use the corresponding Search button on the front ■ panel to also turn the feature On or Off. Prev /Next. Click this button to advance from one mark to another along the waveform. Use the corresponding Mark ◄ and ■...
-
Page 342: Control User Marks In Table
Analyzing waveforms Control user marks in table From the Analyze menu, select Search; then open the Results tab. Overview Use these controls to convert search marks to user marks and to edit the Result: Mark Table. To use Set. Click this button to add a user mark where a search mark was placed by the system. If a search mark is not selected, ■... -
Page 343: Export A Mark Table
Analyzing waveforms Export a mark table From the Analyze menu, select Search; then open the Results tab. Overview Use these controls to export the Mark Table to a file. To use Export. Click this button to open the Save Marks Table dialog box and export the table to a file in CSV format. ■... -
Page 344: View Mark Counts
Analyzing waveforms View mark counts From the Analyze menu, select Search; then open the Results tab. Overview Use this control to view event and timing information for marks. To use Click the View Time / Count button to toggle between the Results Mark and Results Count tables. ■... - Page 345 Analyzing waveforms Visual Search areas are displayed in green. Only the active visual search area is displayed. Press the Mark Next and the Mark Prev buttons to move the active area to other visual search areas. Active search areas only appear in the zoom window. Use the other Analyze Search control windows to control or view the results of the Visual Search.
-
Page 346: Set Up 8B10B Search Parameters
Analyzing waveforms Set up 8B10B search parameters After setting up an 8B10B bus, go to the Analyze menu, select Search, and then select the Bus trigger type; then open the Configure tab. Overview Use the controls to set up the 8B10B Bus parameters. To use For information on the controls, click the buttons. - Page 347 Analyzing waveforms For some Search For selections, you must set additional fields to define other parameters such as for an Error. ■ In this example, you need to the errors to search for. Optionally, you can also set the component threshold levels through the Logic Thresholds Setup button.
-
Page 348: Set Up Rs-232 Search Parameters
Analyzing waveforms Search for character/symbol The mode options available in Search For Character/Symbol are Character, Symbol, and Disparity. Select the Disparity from the drop-down list. Click Character to search for a character. Click Symbol to search for a symbol. Click Setup to adjust the logic thresholds. - Page 349 Analyzing waveforms To use For information on the controls, click the buttons. Type ■ Source ■ Copy Settings ■ Search Parameters ■ Search / Mark Controls ■ Behavior Clicking an entry in the Type column activates the individual search controls, similar to the one shown above. These controls vary depending on the search Type.
- Page 350 Analyzing waveforms For some Search For selections, you must set additional fields to define other parameters such as for a Data. ■ In this example, you need to set a Number of Bytes, Data Format, and Data Value (click the Edit button).
-
Page 351: Set Up Spi Search Parameters
Analyzing waveforms Search for data The data type options available in Search For Data are Number of Bytes, Data Format, and Data Value. Select the Data Format from the drop-down list. Click Edit to enter the data value. Click Setup to adjust the logic thresholds. Set up SPI search parameters After setting up an SPI bus, go to the Analyze menu, select Search, and then select the Bus trigger type;... - Page 352 Analyzing waveforms Behavior Clicking an entry in the Type column activates the individual search controls, similar to the one shown above. These controls vary depending on the search Type. Setting the search conditions is similar to setting the parameters for an Event Trigger.
-
Page 353: Set Up I2C Search Parameters
Analyzing waveforms Search for data The data type options available in Search For Data are Number of Bytes, Data Format, and Data Value. Select the Data Format from the drop-down list. Click Edit to enter the data value. Click Setup to adjust the logic thresholds. Set up I2C search parameters After setting up an I2C bus, go to the Analyze menu, select Search, and then select the Bus trigger type;... - Page 354 Analyzing waveforms Behavior Clicking an entry in the Type column activates the individual search controls, similar to the one shown above. These controls vary depending on the search Type. Setting the search conditions is similar to setting the parameters for an Event Trigger.
- Page 355 Analyzing waveforms Search for stop Search for repeated start Search for missing ack Search for address The address mode options available in Search For Address are Address Format, Address Value, Addressing Mode, Special Address, and Direction. DPO70000SX, MSO/DPO70000DX, MSO/DPO70000C, DPO7000C, and MSO/DPO5000B Series...
- Page 356 Analyzing waveforms Select the Address Format, Addressing Mode, special Address, and Direction from the drop-down lists. Click Edit to enter the address value. Click Setup to adjust the logic thresholds. Search for data The data type options available in Search For Data are Addressing Mode, Number of Bytes, Data Format, and Data Value. Select the Addressing Mode and Data Format from the drop-down lists.
-
Page 357: Set Up Usb Search Parameters
Analyzing waveforms Set up USB search parameters After setting up an USB bus, go to the Analyze menu, select Search, and then select the Bus trigger type; then open the Configure tab. Overview Use the controls to set up the USB Bus parameters. To use For information on the controls, click the buttons. - Page 358 Analyzing waveforms For some Search For selections, you must set additional fields to define other parameters such as for a Error. ■ In this example, you need to set an Error Type. Optionally, you can also set the component threshold levels through the Logic Thresholds Setup button.
- Page 359 Analyzing waveforms Search for reset Search for suspend Search for resume DPO70000SX, MSO/DPO70000DX, MSO/DPO70000C, DPO7000C, and MSO/DPO5000B Series...
- Page 360 Analyzing waveforms Search for end of packet Search for token (address) packet The token address packet mode options available in Search For Token (Address) Packet are Token Type, Address Format, Address, Endpoint Format, and Endpoint. Select the Token Type, Address Format, When address is, and Endpoint Format from the drop-down lists. Click Edit to enter the address and endpoint values.
- Page 361 Analyzing waveforms Search for handshake packet The handshake packet option available in Search For Handshake Packet is Handshake Type. Select the Handshake Type from the drop-down list. Click Setup to adjust the logic thresholds. Search for special packet The special packet option available in Search For Special Packet is Special Type. Select the Special Type from the drop-down list.
- Page 362 Analyzing waveforms Search for pattern The options available in Search For Pattern are Character, Symbols RD+, Symbols RD-, and Disparity. Select the Character, Symbols RD+, Symbols RD-, and Disparity Search for character/symbol The options available in Search For Character/Symbol are Character, Symbol RD+, Symbol RD-, and Disparity.. Select the Character, Symbol RD+, Symbol RD-, and Disparity.
- Page 363 Analyzing waveforms Search for packets The data packet options available in Search For Packets are types of Packets. Select the packet types. Search for LFPS Search for any control character DPO70000SX, MSO/DPO70000DX, MSO/DPO70000C, DPO7000C, and MSO/DPO5000B Series...
-
Page 364: Set Up Mipi Search Parameters
Analyzing waveforms Set up MIPI search parameters After setting up a MIPI bus, go to the Analyze menu, select Search, and then select the Bus trigger type; then open the Configure tab. Overview Use the controls to set up the MIPI Bus parameters. To use For information on the controls, click the buttons. - Page 365 Analyzing waveforms For some Search For selections, you must set additional fields to define other parameters such as for a Long Packet. ■ In this example, you need to set a Data Type Value, Virtual Channel, Direction, Word Count, Number of Bytes, Payload Format, Payload Value, and Byte Offset (click the Edit button).
- Page 366 Analyzing waveforms Search for start of transmission Search for end of transmission Search for bus turn around Search for escape mode The escape mode command options available in Search For Escape Mode are as follows: DPO70000SX, MSO/DPO70000DX, MSO/DPO70000C, DPO7000C, and MSO/DPO5000B Series...
- Page 367 Analyzing waveforms Search for warning The warning type options available in Search For Warning are as follows: Search for error The error type options available in Search For Error Type are as follows: Search for short packet The data type options available in Search On Short Packet are as follows: DPO70000SX, MSO/DPO70000DX, MSO/DPO70000C, DPO7000C, and MSO/DPO5000B Series...
- Page 368 Analyzing waveforms The Search For Short Packet window allows you set the Virtual Channel, Direction, Packet Data Format, and the Packet Data Value Search for long packet The data type value options available in Search For Long Packet are as follows: DPO70000SX, MSO/DPO70000DX, MSO/DPO70000C, DPO7000C, and MSO/DPO5000B Series...
- Page 369 Analyzing waveforms MIPI CSI-2 MIPI DSI-1 The Search For Long Packet window allows you to set the Virtual Channel, Direction, Data Type Value, Word Count, Number of Bytes, Payload Format, Offset in bytes, and Payload Value. DPO70000SX, MSO/DPO70000DX, MSO/DPO70000C, DPO7000C, and MSO/DPO5000B Series...
-
Page 370: Set Up Pcie Search Parameters
Analyzing waveforms Set up PCIe search parameters After setting up a PCIe bus, go to the Analyze menu, select Search, and then select the Bus trigger type; then open the Configure tab. Overview Use the controls to set up the PCIe Bus parameters. To use For information on the controls, click the buttons. - Page 371 Analyzing waveforms For some Search For selections, you must set additional fields to define other parameters such as for Character/Symbol. ■ In this example, you need to set a Character, Symbol, and Disparity. Click the Search For selections Long Ordered Set, Any Control Character, or Error, to view their parameters. What do you want to do next? Bus setup control window (Config tab) on page...
-
Page 372: Set Up Can Search Parameters
Analyzing waveforms Select the Ordered Set from the drop-down list. Search for error Set up CAN search parameters After setting up a CAN bus, go to the Analyze menu, select Search, and then select the Bus trigger type; then open the Configure tab. - Page 373 Analyzing waveforms Behavior Clicking an entry in the Type column activates the individual search controls, similar to the one shown above. These controls vary depending on the search Type. Setting the search conditions is similar to setting the parameters for an Event Trigger.
- Page 374 Analyzing waveforms Search for identifier Search for data The data type options available in Search For Data are Number of Bytes, Data, and Data is. Search for end of frame DPO70000SX, MSO/DPO70000DX, MSO/DPO70000C, DPO7000C, and MSO/DPO5000B Series...
-
Page 375: Set Up Lin Search Parameters
Analyzing waveforms Search for missing ack Search for bit stuff error Set up LIN search parameters After setting up an LIN bus, go to the Analyze menu, select Search, and then select the Bus trigger type; then open the Configure tab. - Page 376 Analyzing waveforms Behavior Clicking an entry in the Type column activates the individual search controls, similar to the one shown above. These controls vary depending on the search Type. Setting the search conditions is similar to setting the parameters for an Event Trigger.
- Page 377 Analyzing waveforms Learn about bus setups. Search for identifier Select the Identifier from the drop-down list. Click Edit to enter the data value. Search for ident & data The data type options available in Search For Ident & Data are Number of Bytes, Identifier, Data is, and Data value. Select the Data from the drop-down list.
-
Page 378: Set Up Flexray Search Parameters
Analyzing waveforms Search for sleep frame Search for error Set up FLEXRAY search parameters After setting up an FLEXRAY bus, go to the Analyze menu, select Search, and then select the Bus trigger type; then open the Configure tab. Overview Use the controls to set up the FLEXRAY Bus parameters. - Page 379 Analyzing waveforms Behavior Clicking an entry in the Type column activates the individual search controls, similar to the one shown above. These controls vary depending on the search Type. Setting the search conditions is similar to setting the parameters for an Event Trigger.
- Page 380 Analyzing waveforms Learn about bus setups. Search for indicator bits Search for identifier The data type options available in Search For Identifier are Identifier and Qualifier. Select the Identifier from the drop-down list. Click Edit to enter the value. Click Logic Thresholds to adjust the logic thresholds. Search for cycle count The data type options available in Search For Cycle Count are Cycle Count and Qualifier.
- Page 381 Analyzing waveforms Click Edit to enter the data value. Click Logic Thresholds to adjust the logic thresholds. Search for ident & data The data type options available in Search For Ident & Data are Identifier, Number of Bytes, Qualifier, Offset, and Data. Select the Identifier from the drop-down list.
-
Page 382: Set Up Mil-1553 Search Parameters
Analyzing waveforms Search for error Set up MIL-1553 search parameters After setting up a MIL-1553 bus, go to the Analyze menu, select Search, and then select the Bus trigger type; then open the Configure tab. Overview Use the controls to set up the MIL-1553 Bus parameters. To use For information on the controls, click the buttons. - Page 383 Analyzing waveforms Behavior Clicking an entry in the Type column activates the individual search controls, similar to the one shown above. These controls vary depending on the search Type. Setting the search conditions is similar to setting the parameters for an Event Trigger.
- Page 384 Analyzing waveforms Search for status word The data type options available in Search For Status Word are Message Error, Instrumentation, Service Request, BCR, Busy, Subsystem, DBCA, Terminal Flag, Parity Search when Remote Terminal Address is, and RT Address (click the button).
-
Page 385: Set Up Ethernet Search Parameters
Analyzing waveforms Search for error The data type option available in Search For Error is Error Type. Set up ethernet search parameters After setting up an Ethernet bus, go to the Analyze menu, select Search, and then select the Bus trigger type; then open the Configure tab. - Page 386 Analyzing waveforms To use For information on the controls, click the buttons. Type ■ Source ■ Copy Settings ■ Search Parameters ■ Search / Mark Controls ■ Behavior Clicking an entry in the Type column activates the individual search controls, similar to the one shown above. These controls vary depending on the search Type.
- Page 387 Analyzing waveforms For some Search For selections, you must set additional fields to define other parameters such as for Command Word. ■ In this example, you need to enter a Source Port, Destination Port, Seq Number, and Acq Number (click the Edit button).
- Page 388 Analyzing waveforms Q-Tag control information The data type option available in Search For Q-Tag Control Information is Q-Tag Value. MAC length/type The data type option available in Search For MAC Length/Type is MAC Length/Type. IPv4 header The data type options available in Search For IPv4 Header are IP Protocol, Source Address, and Destination Address. DPO70000SX, MSO/DPO70000DX, MSO/DPO70000C, DPO7000C, and MSO/DPO5000B Series...
- Page 389 Analyzing waveforms TCP header The data type options available in Search For TCP Header are Source Port, Destination Port, Seq Number, and Acq Number. MAC data The data type options available in Search For MAC Data are Data, Number of Bytes, Offset, and Qualifier. TCP/IPv4 client data The data type options available in Search For TCP/IPv4 Client Data are Data, Number of Bytes, Offset, and Qualifier.
- Page 390 Analyzing waveforms End of packet Select End of Packet to search for the Ethernet End of Packet. Idle Select Idle to search for an Ethernet Idle character. FCS (CRC) error Select FCS (CRC) Error to search for an Ethernet FCS error. DPO70000SX, MSO/DPO70000DX, MSO/DPO70000C, DPO7000C, and MSO/DPO5000B Series...
-
Page 391: Set Up Ddr Search Parameters
Analyzing waveforms Set up DDR search parameters After setting up a DDR bus, go to the Analyze menu, select Search, and then select the bus trigger type; then open the Configure tab. Overview Use the controls to set up DDR, DDR2, DDR3, DDR4, DDR3L, LPDDR, LPDDR2, LPDDR3, GDDR3, GDDR5 bus parameters. To Use For information on the controls, click the buttons. - Page 392 Analyzing waveforms Behavior Clicking an entry in the Type column activates the individual search controls, similar to the one shown above. These controls vary depending on the search Type. Setting the search conditions is similar to setting the parameters for an Event Trigger.
-
Page 393: Set Up Custom Search Parameters
Analyzing waveforms Set up custom search parameters After setting up a custom bus, go to the Analyze menu, select Search, and then select the Bus trigger type; then open the Configure tab. Overview Use the controls to set up the Custom Bus parameters. To use For information on the controls, click the buttons. -
Page 394: Set Up Parallel Search Parameters
Analyzing waveforms Learn about Custom Serial Bus Setup Set up parallel search parameters After setting up a parallel bus, go to the Analyze menu, select Search, and then select the Bus trigger type; then open the Configure tab. Overview Use the controls to set up the Parallel Bus parameters. To use For information on the controls, click the buttons. -
Page 395: View The Results Table
Analyzing waveforms To use Click the Source box and select the bus number or name from the window. Bus Search Selection List ■ Select the pattern to search for using the Pattern Editor. ■ Select when to place a mark using the Mark When Pattern drop-down list. ■... - Page 396 Analyzing waveforms Behavior This dialog box opens when you click Results Table from the Bus Setup Display tab, or in the Analyze menu, when you select Results Table. Symbol substitution, annotation and radix behavior is controlled by the Bus Setup control window. There is one row per bus packet.
- Page 397 Analyzing waveforms Resize the docked results table To resize the docked table, click the splitter above the docked window and drag it to the size you want the table. DPO70000SX, MSO/DPO70000DX, MSO/DPO70000C, DPO7000C, and MSO/DPO5000B Series...
- Page 398 Analyzing waveforms Change the results table column layout Press the Options button to save a table layout, recall a table layout, or customize columns. In the Customize Columns Layout window, you can move columns, select the columns you want displayed, or restore the defaults.
-
Page 399: Copy The Results Table
Analyzing waveforms What do you want to do next? Learn about copying a results table. Learn about selecting the columns to Copy/Export. Learn about saving a results table. Copy the results table From the Analyze menu, select Results Table. Click the Copy button to open the Select the columns to Copy/Export dialog box. From the dialog box, click the Copy button. -
Page 400: Select Columns To Copy Or Export
Analyzing waveforms Behavior Clicking the Copy button in the Select the columns to Copy/Export dialog box, copies the content of the results table to the Windows clipboard with the data formatted with comma separated values (.csv). After the copy you can paste the data Word, Notepad, Excel, or other programs. What do you want to do next? Learn about selecting the columns to Copy/Export. -
Page 401: Save The Results Table
Analyzing waveforms To use To select a column to copy or export, place a check mark next to the column name. ■ Behavior Clicking the OK button in the Select the columns to Copy/Export dialog box, selects the checked columns for use by the copy and export What do you want to do next? Learn about the Results Table. - Page 402 This dialog box opens when you click Export from the Select the columns to Copy/Export dialog box. The default file type is a file with comma separated values (.csv). The default folder is C:\Users\[Username]\Tektronix\TekScope\data NOTE. Any characters that you enter in the file name box become part of the file name. The instrument does not use any user- defined file extensions.
-
Page 403: Myscope Setups
MyScope setups Set up a MyScope control window From the MyScope menu, select New Control Window. Overview MyScope allows you to create custom control windows that include only the controls you use regularly. Instead of switching between several control windows, put the controls you use into a custom control window. DPO70000SX, MSO/DPO70000DX, MSO/DPO70000C, DPO7000C, and MSO/DPO5000B Series... -
Page 404: Use A Myscope Control Window
MyScope setups To use Click + to expand a control category. ■ Click a control to preview it in the pane at the right. ■ Click the + additionally to expand the control list. (If there is no +, then the control cannot be customized further.) ■... -
Page 405: Measure Controls
MyScope setups Cursor controls The Cursor Multipurpose Knob (MPK) and style controls are available but what displays in your MyScope control window will depend on what type of cursor you select. For example if you select Screen cursors, then Cursor MPKs controls and Cursor Style controls display as shown in the following graphic. -
Page 406: Save A Myscope File As A Dialog Box
Behavior This dialog box opens in the default directory . If you want to C:\Users\[Username]\Tektronix\TekScope\MyScope save MyScope control windows in another directory, click the Save in drop-down list to go to that directory. The only available file type is .tcw. -
Page 407: Open Or Edit A Myscope Dialog Box
This dialog box opens to the default directory . If you saved C:\Users\[Username]\Tektronix\TekScope\MyScope MyScope control window files in another directory, click the Look in drop-down list to go to that directory. Clicking Open will open the selected MyScope control window, allowing you to add or delete controls. - Page 408 MyScope setups DPO70000SX, MSO/DPO70000DX, MSO/DPO70000C, DPO7000C, and MSO/DPO5000B Series...
-
Page 409: Trigger Setups
Trigger setups Set up trigger controls (A event tab) From the Trig menu, select A Event (Main) Trigger Setup. NOTE. This online help documents features and options available for several instrument models. Your instrument may not have every feature discussed in this online help, depending on its configuration. To use Use the Trigger Setup control window to set up the instrument to trigger on live waveforms. -
Page 410: Select The Trigger Type
Trigger setups NOTE. If you select an inverted channel waveform as a trigger source, the normal waveform is used instead. What do you want to do next? Learn about the main trigger types. Learn about sequential triggering. Learn about B Event triggers. Learn about Trigger Mode and Holdoff. - Page 411 Trigger setups Behavior The instrument provides the following trigger type categories. Edge triggers. This is the most commonly used trigger type. You can use with analog and digital signals. Edge triggers ■ Edge triggers are available on both the Main and Delayed triggers. Pulse triggers.
-
Page 412: Set The Trigger Mode Controls
Trigger setups Video. Use Video triggers to trigger the instrument on specified fields or lines of a video signal. You can use one of several ■ preset video signal formats or set a custom format. NOTE. Video trigger on B Events is not available on MSO/DPO5000B Series instruments. TIP. - Page 413 Trigger setups Behavior These controls operate identically to the controls on the front panel. For more information on the individual controls, click the related control in the adjacent graphic. What do you want to do next? Read information about Trigger Holdoff. Return to the Trigger Setup control window.
-
Page 414: Set Up The Trigger Holdoff
Trigger setups Set up the trigger holdoff From the Trig menu, select Holdoff. Overview Use the Trigger Holdoff control Window to set the trigger holdoff. To use Click Auto to set the holdoff to the default amount of time. ■ Click the Time button;... -
Page 415: Set To 50
Trigger setups Set to 50 Push the front-panel Level knob (DPO7AFP required on DPO70000SX instruments). This control is also available in some trigger setup windows. To use Click this button to have the instrument automatically search for and set the trigger level to a value halfway between the peaks of the trigger source signal. -
Page 416: Set Up An 8B10B Bus Trigger
Trigger setups To use. Click the Trigger Type box and select Bus from the drop-down list. ■ Click the Bus box and select the bus number or name from the drop-down list. The Bus Type shows Parallel. ■ Click the Logic Thresholds Setup button to set the voltage threshold levels for the channels in the bus. ■... - Page 417 Trigger setups To use. Click the Trigger Type box and select Bus from the drop-down list. ■ Click the Bus box and select the bus number or name from the drop-down list. ■ NOTE. You have the option to add a user-defined label for bus sources. Click the Logic Thresholds Setup button to set the voltage threshold levels for the channels in the bus.
-
Page 418: Set Up An I2C Bus Trigger
Trigger setups Set up an I2C bus trigger NOTE. The Bus Trigger Control Window for I2C Serial option is available only on instruments with option SR-EMBD. From the Trigger menu, select the Bus setup. Overview. Use the controls to set up the I2C Bus parameters. To use. - Page 419 Trigger setups To use. Click the Trigger Type box and select Bus from the drop-down list. ■ Click the Bus box and select the bus number or name from the drop-down list. ■ NOTE. You have the option to add a user-defined label for bus sources. Click the Logic Thresholds Setup button to set the voltage threshold levels for the channels in the bus.
-
Page 420: Set Up An Spi Bus Trigger
Trigger setups In DPO7000C and MSO70000C/DX Series instruments, when you trigger on an Address for I2C serial bus, there are some predefined patterns termed as Special Addresses. Use this information to debug your serial bus. The following table lists the predefined patterns along with their names. -
Page 421: Set Up An Rs-232 Bus Trigger
Trigger setups To use. Click the Trigger Type box and select Bus from the drop-down list. ■ Click the Bus box and select the bus number or name from the drop-down list. ■ NOTE. You have the option to add a user-defined label for bus sources. Click the Logic Thresholds Setup button to set the voltage threshold levels for the channels in the bus. - Page 422 Trigger setups To use. For information on the controls, click the buttons. Trigger Type ■ Mark All Trigger Events ■ ■ Logic Thresholds ■ DPO70000SX, MSO/DPO70000DX, MSO/DPO70000C, DPO7000C, and MSO/DPO5000B Series...
-
Page 423: Set Up A Usb Bus Trigger
Trigger setups To use. Click the Trigger Type box and select Bus from the drop-down list. ■ Click the Bus box and select the bus number or name from the drop-down list. ■ NOTE. You have the option to add a user-defined label for bus sources. Click the Logic Thresholds Setup button to set the voltage threshold levels for the channels in the bus. - Page 424 Trigger setups To use. For information on the controls, click the buttons. Trigger Type ■ Mark All Trigger Events ■ ■ Logic Thresholds ■ DPO70000SX, MSO/DPO70000DX, MSO/DPO70000C, DPO7000C, and MSO/DPO5000B Series...
- Page 425 Trigger setups To use. Click the Trigger Type box and select Bus from the drop-down list. ■ Click the Bus box and select the bus number or name from the drop-down list. ■ NOTE. You have the option to add a user-defined label for bus sources. Click the Logic Thresholds Setup button to set the voltage threshold levels for the channels in the bus.
- Page 426 Trigger setups Trigger on Handshake Packet The handshake type options available in Trigger on Handshake Packet are as follows: Trigger on Special Packet The special type options available in Trigger on Special Packet are as follows: In the USB bus setup window, set the Speed to High (480 Mbps). In the Trigger setup window, set the Trigger On condition to Special Packet.
- Page 427 Trigger setups NOTE. The Bit Stuffing error type option is not available on high speed bus. Start/Complete The options available in Start/Complete are as follows: Start and end bits The options available in Start and End bits are as follows: Endpoint type The options available in Endpoint Type are as follows: DPO70000SX, MSO/DPO70000DX, MSO/DPO70000C, DPO7000C, and MSO/DPO5000B Series...
-
Page 428: Set Up A Pcie Bus Trigger
Trigger setups Set up a PCIe bus trigger NOTE. The Bus Trigger Control Window for PCIe Serial option is available only on instruments with option SR-PCIE. From the Trigger menu, select Bus setup. Overview. Use the controls to set up the PCIe Bus parameters. To use. - Page 429 Trigger setups To use. Click the Trigger Type box and select Bus from the drop-down list. ■ Click the Bus box and select the bus number or name from the drop-down list. ■ NOTE. You have the option to add a user-defined label for bus sources. Click the Logic Thresholds Setup button to set the voltage threshold levels for the channels in the bus.
-
Page 430: Set Up A Can Bus Trigger
Trigger setups Set up a CAN bus trigger NOTE. The Bus Trigger Control Window for CAN Serial option is available only on instruments with option SR-AUTO. From the Trigger menu, select Bus setup. Overview. Use the controls to set up the CAN Bus parameters. To use. -
Page 431: Set Up A Can Bus Trigger
Trigger setups To use. Click the Trigger Type box and select Bus from the drop-down list. ■ Click the Bus box and select the bus number or name from the drop-down list. ■ NOTE. You have the option to add a user-defined label for bus sources. Click the Logic Thresholds Setup button to set the voltage threshold levels for the channels in the bus. -
Page 432: Set Up A Lin Bus Trigger
Trigger setups To use. For information on the controls, click the buttons. Trigger Type ■ Settings ■ Signal Type ■ Data Source ■ Data Threshold ■ Bit Rate ■ Trigger On ■ ■ CAN Format Behavior. Use this trigger to analyze CAN_H or CAN_L bus data frames with single-ended probes, or use a differential probe to read both signals simultaneously. - Page 433 Trigger setups To use. For information on the controls, click the buttons. Trigger Type ■ Mark All Trigger Events ■ ■ Logic Thresholds ■ DPO70000SX, MSO/DPO70000DX, MSO/DPO70000C, DPO7000C, and MSO/DPO5000B Series...
-
Page 434: Set Up A Flexray Bus Trigger
Trigger setups To use. Click the Trigger Type box and select Bus from the drop-down list. ■ Click the Bus box and select the bus number or name from the drop-down list. ■ NOTE. You have the option to add a user-defined label for bus sources. Click the Logic Thresholds Setup button to set the voltage threshold levels for the channels in the bus. - Page 435 Trigger setups To use. For information on the controls, click the buttons. Trigger Type ■ Mark All Trigger Events ■ ■ Logic Thresholds ■ DPO70000SX, MSO/DPO70000DX, MSO/DPO70000C, DPO7000C, and MSO/DPO5000B Series...
- Page 436 Trigger setups To use. Click the Trigger Type box and select Bus from the drop-down list. ■ Click the Bus box and select the bus number or name from the drop-down list. ■ NOTE. You have the option to add a user-defined label for bus sources. Click the Logic Thresholds Setup button to set the voltage threshold levels for the channels in the bus.
-
Page 437: Set Up A Mil-1553 Bus Trigger
Trigger setups Set up a MIL-1553 bus trigger NOTE. The Bus Trigger Control Window for MIL-STD-1553 Serial option is available only on instruments with option SR-AERO. From the Trigger menu, select Bus setup. Overview. Use the controls to set up the MIL-STD-1553 Bus parameters. To use. - Page 438 Trigger setups To use. Click the Trigger Type box and select Bus from the drop-down list. ■ Click the Bus box and select the bus number or name from the drop-down list. ■ Click the Logic Thresholds Setup button to set the voltage threshold levels for the channels in the bus. ■...
-
Page 439: Set Up An Ethernet Bus Trigger
Trigger setups Trigger on Sync Trigger on RT/IMG Time The error type options available in Trigger on RT/IMG Time are as follows: Trigger on Error The error type options available in Trigger on Error are as follows: Set up an ethernet bus trigger NOTE. - Page 440 Trigger setups To use. For information on the controls, click the buttons. Trigger Type ■ Mark All Trigger Events ■ ■ Logic Thresholds ■ DPO70000SX, MSO/DPO70000DX, MSO/DPO70000C, DPO7000C, and MSO/DPO5000B Series...
- Page 441 Trigger setups To use. Click the Trigger Type box and select Bus from the drop-down list. ■ Click the Bus box and select the bus number or name from the drop-down list. ■ Click the Logic Thresholds Setup button to set the voltage threshold levels for the channels in the bus. ■...
- Page 442 Trigger setups Trigger on Q-Tag Control Information For Trigger on Q-Tag Control Information you need to specify the Q-tag Value. Trigger on MAC Length/Type For Trigger on MAC Length/Type you need to specify the MAC length and type. Trigger on IPv4 Header For Trigger on IPv4 Header you need to enter the IP Protocol, Source Address, and the Destination Address.
- Page 443 Trigger setups Trigger on TCP/IPv4 Client Data For Trigger On TCP/IPv4 Client Data you need to specify the Data, Number of Bytes, Offset, and the Qualifier. Trigger on MAC Data For Trigger On MAC Data you need to specify the Data, Number of Bytes, Offset, and the Qualifier. Trigger on End of Packet Select End of Packet to trigger on an Ethernet End of Packet.
-
Page 444: Set Up A Comm Trigger
Trigger setups Trigger on FCS (CRC) Error Select FCS (CRC) Error to trigger on an Ethernet FCS error. Set up a comm trigger From the Trig menu, select Comm Setup. NOTE. The Comm Trigger is designed to work with communications mask and standard testing. Mask testing automatically uses Communication triggers. - Page 445 Trigger setups To use. For information on the controls, click the buttons. Trigger Type ■ Settings ■ Source / Type / Polarity ■ Coding / Standard / Bit Rate ■ Level ■ Pulse Form ■ Depending on which coding format you use, you can also change the Upper, Lower, and Clock level thresholds and the pulse form using the multipurpose knobs.
-
Page 446: Set Up An Edge Trigger
Trigger setups Set up an edge trigger From the Trig menu, select Edge Setup. Overview. Use the controls in this window to set up Edge trigger parameters for general-purpose testing. To use. For information on the controls, click the buttons. Trigger Type ■... -
Page 447: Set Up A Freq/Period Trigger
Trigger setups Behavior. Edge triggering is the most common way to trigger an instrument. The trigger occurs when the trigger source passes through a specific level on the specified slope (rising or falling). What do you want to do next? Learn more about other trigger types. - Page 448 Occurs, Logic, and Occurs And. The following Trigger Freq/Per screen appears on DPO70000SX Series instruments: NOTE. This online help file supports many oscilloscope models from Tektronix. This feature is only available on some models. DPO70000SX, MSO/DPO70000DX, MSO/DPO70000C, DPO7000C, and MSO/DPO5000B Series...
-
Page 449: Set Up A Glitch Trigger
Trigger setups Behavior. Use the Freq/Per trigger to trigger the instrument on a frequency or period that is either within or outside the specified range. The range is defined by the Upper Limit and Lower Limit controls. You can specify frequencies or periods for either positive or negative pulses. - Page 450 Trigger setups To use. For information on the controls, click the buttons. Trigger Type ■ Mark All Trigger Events ■ Settings ■ Source ■ Set to 50% ■ Level ■ Glitch Width ■ ■ Polarity Qualification ■ Pattern ■ Edit Button ■...
- Page 451 Trigger setups The following Trigger Glitch screen appears on MSO/DPO5000B Series instruments: Behavior. Use the Glitch trigger to detect and trigger on a glitch or to ignore a glitch. Glitches are defined as pulses that are narrower than a specified time. The trigger occurs when the instrument detects a pulse outside (either less than or greater than) the parameters that you specify.
-
Page 452: Set Up A Logic Pattern Trigger
Set up a logic pattern trigger NOTE. This online help file supports many oscilloscope models from Tektronix. This feature is only available on some models. From the Trig menu, select Logic Pattern. It includes the D15-D0 digital channels in the trigger setup on MSO models. DPO models include only the Ch1 - Ch4 analog channels. -
Page 453: Set Up A Logic Pattern Trigger
Trigger setups Set up a logic pattern trigger From the Trig menu, select Logic Pattern. Overview. Use the controls in this window to set up the Logic Pattern trigger parameters. To use. For information on the controls, click the buttons. Trigger Type ■... - Page 454 Trigger setups To use. For information on the controls, click the buttons. Trigger Type ■ Mark All Trigger Events ■ Settings ■ Source ■ ■ Levels Polarity ■ Runt / Trigger if Runt ■ Qualification ■ Pattern ■ ■ Edit Button NOTE.
-
Page 455: Set Up A Serial Pattern Trigger
Trigger setups NOTE. Logic qualification option is not available on DPO5000B and MSO5000B Series instruments. Behavior. Use the Upper Level and Lower Level threshold controls to set the voltage ranges that define a valid pulse. Runt pulses are short pulses that cross one threshold but fail to cross a second threshold before crossing the first threshold again. -
Page 456: Set Up A Setup And Hold Trigger
Trigger setups To use. For information on the controls, click the buttons. Trigger Type ■ Settings ■ Clock Source ■ Data Source ■ Coding ■ Standard ■ Bit Rate ■ ■ Format Data / Clock Levels ■ Edit ■ Trigger On ■... - Page 457 Trigger setups To use. For information on the controls, click the buttons. Trigger Type ■ Mark All Trigger Events ■ Settings ■ Source ■ Data Level ■ Clock Source ■ Clock Level ■ ■ Setup / Hold Time Clock Edge ■...
- Page 458 Trigger setups NOTE. The Logic qualification option is not available on DPO5000B and MSO5000B Series instruments. Behavior. Use the Setup and Hold violation trigger to trigger on setup and hold time violations. When you click on the trigger window controls, the trigger graphic shows the trigger sequence. The setup and hold times define a violation region relative to a clock.
-
Page 459: Set Up An Spi Bus Trigger
Trigger setups Set up an SPI bus trigger NOTE. The SPI Bus Trigger type is available on instruments with option SR-EMBD. From the Trig menu, select SPI Setup. NOTE. This online help documents features and options available for several instrument models. Your instrument may not have every feature discussed in this online help, depending on its configuration. -
Page 460: Set Up A Logic State Trigger
Trigger setups Behavior. Use this trigger to analyze Serial Peripheral Interface Bus data. You must supply the following inputs to analyze standard configuration SPI frames: Slave Select (SS) Source control line ■ Serial Clock (SCLK) Source ■ Serial Data In (MISO) Source or Serial Data Out (MOSI) Source ■... -
Page 461: Set Up A Logic State Trigger
Trigger setups To use. For information on the controls, click the buttons. Trigger Type ■ Mark All Trigger Events ■ Settings ■ Pattern Type ■ Clock Input ■ Pattern ■ Edit Button ■ ■ Pattern Format Logic Thresholds ■ Trigger if.. State ■... -
Page 462: Set Up A Timeout Trigger
Trigger setups To use. For information on the controls, click the buttons. Trigger Type ■ Mark All Trigger Events ■ Settings ■ Pattern Type ■ Input Threshold ■ Trigger if.. State ■ Behavior. Use the Logic State trigger to trigger the instrument when all of the logic inputs to the selected logic function cause the function to be True or False when the clock input changes state. - Page 463 Trigger setups To use. For information on the controls, click the buttons. Trigger Type ■ Mark All Trigger Events ■ Settings ■ Source ■ Set to 50% ■ Level ■ Timer ■ ■ Trigger When Qualification ■ Pattern ■ Edit Button ■...
- Page 464 Trigger setups The following Trigger Timeout screen appears on MSO/DPO5000B Series instruments: NOTE. The Logic qualification is not available on DPO5000B and .MSO5000B Series instruments. DPO70000SX, MSO/DPO70000DX, MSO/DPO70000C, DPO7000C, and MSO/DPO5000B Series...
-
Page 465: Set Up A Transition Time Trigger
Trigger setups Behavior. Use the Timeout trigger to trigger the instrument on pulses longer than the specified time. The instrument will trigger at the end of the time-out period. The instrument can trigger on high, low, or both high and low pulses. The trigger can also be qualified by the logical state of other channels or by a bus pattern (MSO70000C/DX Series only). - Page 466 Trigger setups To use. For information on the controls, click the buttons. Trigger Type ■ Mark All Trigger Events ■ Settings ■ Source ■ ■ Levels Transition ■ Slope ■ Qualification ■ Pattern ■ ■ Edit Button NOTE. The Trigger Transition screen on DPO and MSO instruments is the same except for the source selection and Trigger if Transition Qualification options.
-
Page 467: Set Up A Video Trigger
Trigger setups Behavior. Use the Transition trigger to trigger the instrument on pulse edges that traverse between two thresholds at faster or slower rates than the specified time. You can set up the instrument to trigger on positive or negative edges. The trigger can also be qualified by the logical state of other channels or by a bus pattern (MSO70000C/DX Series only). - Page 468 Trigger setups To use. For information on the controls, click the buttons. Trigger Type ■ Settings ■ Source ■ Format ■ Polarity ■ Graticule ■ Trigger On ■ ■ Holdoff Autoset ■ DPO70000SX, MSO/DPO70000DX, MSO/DPO70000C, DPO7000C, and MSO/DPO5000B Series...
-
Page 469: Set Up A Width Trigger
Trigger setups Behavior. Use the Video trigger to trigger the instrument on specified fields or lines of a composite video signal. NOTE. Only composite signal formats are supported. Graphic display formats such as RGB and VGA are not supported. Select from several preset video signal formats. If using a preset format, the Lines and Fields Autoset buttons will optimize the instrument for viewing the fields or lines for your chosen format. - Page 470 Trigger setups Behavior. For information on the controls, click the buttons. Trigger Type ■ Mark All Trigger Events ■ Settings ■ Source ■ Set to 50% ■ Level ■ Pulse Width Limits ■ ■ Polarity Qualification ■ Logic pattern ■ Edit Button ■...
- Page 471 The following Trigger Width screen appears on MSO/DPO5000B Series instruments: NOTE. This online help file supports many oscilloscope models from Tektronix. This feature is only available on some models. Behavior. Use the Width trigger to trigger the instrument on a pulse that is either within or outside the specified range. The range is defined by the Upper Limit and Lower Limit controls.
-
Page 472: Set Up A Window Trigger
Trigger setups Set up a window trigger NOTE. Window trigger is not available on MSO/DPO5000B Series instruments. From the Trig menu, select Window Setup. Overview. Use the controls in this window to set up the Window trigger parameters. To use. For information on the controls, click the buttons. Trigger Type ■... -
Page 473: Sequence Triggering
Trigger setups Behavior. Use the Window trigger to trigger the instrument when the input signal rises above an upper threshold level or falls below a lower threshold level. After setting these levels, you can specify whether you want to trigger the instrument as the signal is entering or leaving the threshold window. - Page 474 Trigger setups To use. Select the A->B Seq tab to use the A Event (main) trigger with the B Event trigger to capture complex data. For information on the controls, click the buttons. Trigger Summary ■ A Only ■ A -> B Trig after Time ■...
- Page 475 Trigger setups Behavior. The A Event trigger arms the trigger system; the instrument will trigger on the B Event trigger defined by events or time. You can also set up the instrument to delay the B Event Trigger by a specified time period by turning Horizontal Delay Mode on.
-
Page 476: A Only Trigger
Trigger setups A only trigger Trigger on A only (Horizontal delay on). From the Trig menu, select A - B Trigger Sequence. Overview. Use the controls in this window to define the parameters for the A ->B Sequence trigger with Horizontal Delay on. For information on the controls, click the buttons. - Page 477 Trigger setups Use the Horiz Delay and Reference Point entry boxes to delay the acquisition relative to the A Event trigger. Behavior. When you select A Only with Delay Mode on, the instrument first looks for the trigger conditions specified by the A Event.
- Page 478 Trigger setups Trigger on A only (Horizontal delay off). From the Trig menu, select A - B Trigger Sequence. Overview. Use the controls in this window to define the parameters for the A ->B Sequence trigger with Horizontal Delay off. For information on the controls, click the buttons.
- Page 479 Trigger setups To use. From the A Event tab, select the Trigger Type. Configure the controls for the A Event in the trigger setup window. Select the A->B Seq tab; then click A Only. Click to set the Horizontal Delay Mode button to Off. Use the front panel Horizontal Position control (or click in the Horizontal Position entry box and use a multipurpose knob) to define the amount of pretrigger data.
-
Page 480: Trigger After Time
Trigger setups Trigger after time Trigger after time (Horizontal delay on). From the Trig menu, select A - B Trigger Sequence. Overview. Use the controls in this window to define the parameters for the A ->B Sequence trigger with Horizontal Delay on. NOTE. - Page 481 Trigger setups Click to set the Horizontal Delay Mode button to On. Select the trigger delay time with the Trig Delay control. Use the Horiz Delay control to delay the acquisition relative to the B event. Adjust the Ref Point and B Trig Level controls as necessary. Behavior.
- Page 482 Trigger setups Trigger after time (Horizontal delay off). From the Trig menu, select A - B Trigger Sequence. Overview. Use the controls in this window to define the parameters for the A ->B Sequence trigger with Horizontal Delay off. NOTE. The A->B Sequence trigger is not available with MultiScope Triggers. For information on the controls, click the buttons.
- Page 483 Trigger setups Select the trigger delay time with the Trig Delay control. Adjust the Horiz Position and B Trig Level controls as necessary. Behavior. When you select Trig After Time, the instrument looks for the trigger conditions specified by the A event. After the A event arms the trigger system, the instrument triggers on the next B event that occurs after the time specified by the Trig Delay control.
-
Page 484: Trigger After Events
Trigger setups Trigger after events Trigger on nth event (Horizontal delay on). From the Trig menu, select A - B Trigger Sequence. Overview. Use the controls in this window to define the parameters for the A ->B Sequence trigger with Horizontal Delay on. For information on the controls, click the buttons. - Page 485 Trigger setups Set the Horizontal Delay Mode button to On. Select the number of B events with the Trig Event control. Use the Horiz Delay control to delay the acquisition relative to the B event. Adjust the Ref Point and B Trig Level controls as necessary. Behavior.
- Page 486 Trigger setups Trigger on nth event (Horizontal delay off). From the Trig menu, select A - B Trigger Sequence. Overview. Use the controls in this window to define the parameters for the A ->B Sequence trigger with Horizontal Delay off. For information on the controls, click the buttons.
- Page 487 Trigger setups Select the number of B events with the Trig Event control. Adjust the Horiz Position and B Trig Level controls as necessary. Behavior. Use this sequence to trigger the instrument on the nth occurrence of the B event after the A event. When you select Trig on nth Event, the instrument looks for the trigger conditions specified by the A event.
- Page 488 Trigger setups Trigger on nth event (B-Event scan). B-Event Scan is not available on MSO/DPO5000B Series instruments. From the Trig menu, select A - B Trigger Sequence. Overview. Use the controls in this window to define the parameters for the A ->B Sequence trigger with B-Event Scan on. For information on the controls, click the buttons.
- Page 489 Trigger setups Behavior. Use this sequence to trigger the instrument on the nth occurrence of the B event after the A event. When you enable the B-Event Scan, the instrument automatically advances the B-Event value to capture a different portion of the signal.
- Page 490 Trigger setups Trigger on nth event (B-Event scan and horizontal delay on). The B-Event Scan is not available on MSO/DPO5000B Series instruments. From the Trig menu, select A - B Trigger Sequence. Overview. Use the controls in this window to define the parameters for the A ->B Sequence trigger with B-Event Scan and Horizontal Delay on.
-
Page 491: B Event Trigger
Trigger setups Learn more about other trigger types. Return to the Trigger Setup control window. Trigger on nth Event (Horizontal Delay Off). Trigger on nth Event (Horizontal Delay On). Trigger on nth Event (B-Event Scan). B event trigger Set up trigger controls (B event tab) From the Trig menu, select B Event (Delayed) Trigger Setup. -
Page 492: Visual Triggering
Trigger setups Behavior. These controls work together to define the parameters for the trigger event. Use the B Event trigger with the A Event trigger to capture more complex events. The B Event trigger controls are independent from the A Event trigger. When you click on the trigger window controls, the trigger graphic shows the trigger sequence. - Page 493 Trigger setups Overview. Use the Visual Trigger control window to control which triggered waveforms are displayed. For example, the following screen capture shows a waveform acquired using edge trigger. The following screen capture shows the same waveform acquired using edge trigger and visual trigger with two visual trigger areas controlling which triggered waveforms are displayed.
-
Page 494: Create A Visual Trigger Area
Trigger setups Behavior. The control window provides the following visual trigger controls. Pressing the Visual Trigger button toggles visual triggering on and off. ■ NOTE. When Visual Trigger is turned on, the trigger mode is set to Normal. You can change the mode to Auto by pressing the front panel Trigger button. - Page 495 Trigger setups Create an area. Create a visual trigger area by clicking and dragging a box on the display. Then select Visual Trigger > Add Visual Trig Area. In the same menu you can hide or show all visual trigger areas and toggle visual triggering on and off. DPO70000SX, MSO/DPO70000DX, MSO/DPO70000C, DPO7000C, and MSO/DPO5000B Series...
- Page 496 Trigger setups Behavior. Once a visual trigger area is created, you can control the size and position of the area; Click the area to enable its handles. Click again to display the vertices. ■ Click and drag the area to move it to a new location. ■...
-
Page 497: Control Visual Triggering
Trigger setups Control visual triggering In the display, right click a visual trigger area and select Visual Trigger Area from the menu. Overview. Use the right-click menu to control visual trigger areas, qualification expressions, and visual triggering. DPO70000SX, MSO/DPO70000DX, MSO/DPO70000C, DPO7000C, and MSO/DPO5000B Series... - Page 498 Trigger setups To use. Right click a visual trigger area and select Visual Trigger Area. Select Edit Shape to change the shape and orientation of the visual trigger area. Selections include the following: Triangle ■ Rectangle ■ Hexagon ■ Trapezoid ■...
-
Page 499: Define An Area
Trigger setups Learn about visual trigger setup. Learn about creating a visual trigger area. Learn about saving a visual trigger setup. Learn about recalling a visual trigger setup. Learn about visual trigger qualification expressions. Define an area In the Visual Trigger window, click Visual Setup. Overview. - Page 500 Trigger setups To use. Change the settings of a visual qualification area. Select the Visual Area to set up ■ Select the Source that will either be included in or out of the visual trigger area ■ Select the Logic for Source in Area, either In or Out ■...
-
Page 501: Edit Expression Logic
Trigger setups Edit expression logic In the Visual Qualification Setup window, select the Edit Logic tab. Overview. Use these controls to change the source channels and visual qualifier areas that are part of the visual qualifier expression. To use. Click in the logic expression box to edit the contents of the expression. Pressing a button adds the item to the expression. -
Page 502: Set Up Visual Trigger Expression
Trigger setups Set up visual trigger expression From the Trig menu, select Visual Trigger Setup; then double click the Visual Trigger equation. Overview. Use the Qualification Expression Editor control window to define or edit visual trigger expressions. The readout shows the qualification expression as you construct it. -
Page 503: Select A Channel
Trigger setups Select a channel Specify the Ch <1 - 4> for oscilloscope operations. Specify a channel to dedicate the controls for use with an input on the front panel. ■ ■ Shaded buttons Indicate unused or undefined waveforms. Enable the visual trigger expression editor From the Visual Trigger menu, double click the Visual Trigger expression. -
Page 504: Use The Expression Editor Operands
Trigger setups Use the expression editor operands From the Visual Trigger menu, double click the Visual Trigger expression. To use. Click an individual button to enter a character or operator into the visual qualification expression. Behavior. The characters are entered into the expression one at a time. What do you want to do next? Learn about visual trigger setup. -
Page 505: Save A Visual Setup
Trigger setups Save a visual setup From the Trig menu, select Visual Trigger Setup; then press Save from the control window. Overview. Use this dialog box to save Visual Trigger setups to a file for later use. The setup is stored in human-readable text in GPIB command format. -
Page 506: Mode And Holdoff
Trigger setups Overview. Use this dialog box to recall a Visual Trigger setup. To use. Visual trigger setups are recalled from an internal file on your hard drive that you have named. To recall a visual trigger setup from a file, select the location of the setup from the Look in list. Select the setup you want to recall, and then click Open. - Page 507 Trigger setups Overview. Use the controls in this window to set up the trigger mode. For information on the controls, click the buttons. Trigger Summary ■ Normal Trigger ■ Auto Trigger ■ Trigger Position ■ Auto Holdoff ■ Timed Holdoff ■...
-
Page 508: Enable Trigger Position Correction
Trigger setups Behavior. Use the trigger holdoff time to delay the trigger system for a specified amount of time between triggers, or click Auto to let the instrument calculate the time for you. You can also set the holdoff to a Level that synchronizes the instrument with an incoming signal to generate a stable display and avoid triggering on undesired events. - Page 509 Trigger setups Behavior. The Trigger Type indicator(s) in the status area change when you apply Trigger Position Correction. In the example below, the Trigger A indicator changed from A to A' when trigger correction was applied. NOTE. You can use Trigger Position Correction in any combination for A Event, B Event, or Sequence triggers, including Trigger After Time and Trigger on nth Event.
- Page 510 Trigger setups DPO70000SX, MSO/DPO70000DX, MSO/DPO70000C, DPO7000C, and MSO/DPO5000B Series...
-
Page 511: Vertical Setups
Vertical setups Set up vertical controls From the Vertical menu, select Vertical Setup. Overview Use the Vertical Setup control windows to set vertical parameters for live (channel) waveforms. The example windows below do not show controls for attached probes. Click for DPO7000C and MSO/DPO5000B Series instruments Click for MSO/DPO70000C/DX/SX Series instruments The following screen appears on MSO/DPO5000B Series instruments: DPO70000SX, MSO/DPO70000DX, MSO/DPO70000C, DPO7000C, and MSO/DPO5000B Series... - Page 512 Vertical setups The following screen shows the Termination Voltage control that appears on MSO/DPO70000DX/SX Series instruments: For information on the Vertical Setup controls, click the links. NOTE. iCapture is available only on MSO70000C/DX Series instruments and DPO70000DX instruments with option MSOU installed.
-
Page 513: Set Up Input Channels
Vertical setups NOTE. The bandwidth readout displays in reverse video if the bandwidth is not what you selected. If you want the bandwidth to be what you selected, make sure that the sample rate is high enough to enable Digital Filters (DSP). One way to enable DSP is to select Force Constant Sample Rate. - Page 514 Vertical setups NOTE. Right-click on the digital source readout in the waveform window to reroute from one analog channel to any of the other three analog channels. For example, right-click on D0 captured on Ch1 and select iCapture on Ch2 to reroute source D0 to Ch2. The following screen is captured on MSO/DPO5000B Series instruments: TIP.
-
Page 515: Zoom Control Window
Vertical setups Zoom control window From the Vertical or Horiz /Acq menus, select Zoom Controls, or push the front-panel MultiView Zoom button (DPO7AFP required on DPO70000SX instruments). Overview Use the Zoom control window to select the Zoom Area and Source, assign, and to lock and scroll the zoomed areas. The following screen appears on MSO70000C/DX Series instruments: DPO70000SX, MSO/DPO70000DX, MSO/DPO70000C, DPO7000C, and MSO/DPO5000B Series... -
Page 516: Waveform Display Control Window
Vertical setups To use Click a Horiz or Vert button to assign the Horizontal or Vertical zoom controls to the multipurpose knobs. Select the zoom area from the Area drop-down list. The changes you make in this control window apply only to the zoom area selected. -
Page 517: Set The Position-Offset
Vertical setups Behavior The Display button applies only to the selected waveform. Each waveform (channel, math, or reference) has its own Display button. Any displayed channel, math, or reference waveform can be turned off without impacting any math functions, measurements, or histograms done on that waveform. -
Page 518: Waveform Label Control Window
Vertical setups Waveform label control window From the Vertical or Math menus, select Label. Overview Use the Label control window to attach a label to the waveform. To use Use the Channels Selector to select a valid channel, math, or reference waveform. Click in the Label entry box, and then use the pop-up keyboard to create a label for the selected waveform. -
Page 519: Vertical Offset Control Window
Vertical setups Vertical offset control window From the Vertical menu, select Offset. Overview Use the Position/Offset control window to set the offset value of the selected waveform to shift the vertical acquisition window match the waveform data you want to acquire. To use Use the Channels Selector... -
Page 520: Using Offset To Avoid Clipping Signals
Vertical setups Using offset to avoid clipping signals Using Offset to Avoid Clipping Signals Clipping The circled portion of the incoming waveform is clipped, and therefore, is not acquired. The clipped portion cannot be processed or displayed. Offset can move the acquisition window vertically relative to the incoming waveform. - Page 521 Vertical setups The following screen appears on MSO/DPO5000B Series instruments: To use Click a Channels button to select the vertical input channel. ■ Click one of the Termination buttons to set the termination for your probe; termination can also be set during probe ■...
-
Page 522: Coupling Controls
Vertical setups The high input resistance of passive probes (typically 10 MΩ) provides negligible DC loading and provides accurate DC amplitude measurements. Most passive probes require the instrument input impedance to be 1 MΩ. However, their 8 pF to 12 pF (over 60 pF for 1X) capacitive loading can distort timing and phase measurements. -
Page 523: Deskew-Attenuation Control Window
Vertical setups To use Click a Channels button to select the vertical input channel. Click one of the Coupling buttons to couple the signal from the probe to the instrument. Behavior Select DC coupling to display a waveform with AC and DC components. ■... - Page 524 Vertical setups Each input channel has its own deskew settings. Deskew compensates individual channels for probes or cables of different lengths. The instrument applies the delay values after each completed acquisition. The deskew values are saved as part of the instrument setup.
-
Page 525: Bandwidth Control Window
Vertical setups Each input channel has its own external attenuation settings. The attenuation control is automatically set to the correct value when you attach a probe with a TekProbe/TekVPI interface to the instrument. You can change the external attenuation by entering a multiplier or ratio with one control, or by entering a dB value with the other control. -
Page 526: Enhanced Bandwidth
Vertical setups Enhanced bandwidth From the Vertical menu, select Bandwidth Enhanced. Overview The Bandwidth Enhancement controls (similar to those shown below) allow you to use DSP processing to achieve more accurate rise time measurements, to extend the bandwidth, and to flatten the passband at the full sample rate. Enhanced Bandwidth also provides a matched response across enabled channels for channel-to-channel comparisons and differential measurements. - Page 527 Vertical setups NOTE. For ≥3.5 GHz instrument models, the DSP filter on each channel provides magnitude and phase compensation of the analog bandwidth to provide more accurate signal fidelity for high-speed measurements. Digital Filtering (DSP) Enabled provides low-pass bandwidth filtering only to reduce noise. Refer to your oscilloscope Specifications for a list of bandwidth enhancements available for each vertical scale setting on your instrument.
-
Page 528: Vertical Setup Control Window (Aux Tab)
Vertical setups Vertical setup control window (Aux tab) From the Vertical menu, select Vertical Setup; then open the Aux tab. Overview The Vertical Setup Aux Tab, similar to the window shown below, reports the status of the Auxiliary trigger input. This input is located on the instrument front panel. -
Page 529: Probe Setup Control Window
Vertical setups To use To access the controls for this window, connect a compatible probe. What do you want to do next? Continue to learn about the Vertical Setup controls. Probe setup control window From the Vertical menu, select Probe Cal. Overview Use the Probe Setup control window to compensate and check probe status and to compensate the entire signal path. - Page 530 Vertical setups For information on the Probe Setup controls, click the buttons. Compensation ■ Status ■ Deskew ■ Attenuation ■ Type ■ NOTE. The Probe Status control indicates the status of probe compensation for the selected channel. If the probe status does not indicate Pass, the instrument may not take accurate measurements.
-
Page 531: Probe Setup Control Window (Setup Type)
Vertical setups Tips for Reducing Measurement Noise Use the least amount of attenuation. Probe noise is a function of probe attenuation, for example, using a 25X probe, versus ■ a 5X probe, results in significantly greater noise. Select the lowest attenuation that displays the input voltage swing of your signal; then use the vertical scale setting to adjust ■... - Page 532 Vertical setups The following screen appears on MSO/DPO5000B Series instruments: For information on the Probe Setup controls, click the button. Controls ■ DPO70000SX, MSO/DPO70000DX, MSO/DPO70000C, DPO7000C, and MSO/DPO5000B Series...
-
Page 533: Probe Setup Control Window (D15-D0 Tab)
D15-D0 is located on the instrument front panel. The instrument requires the Logic Probe Deskew Fixture (Tektronix part number 067-2083-XX) to deskew the logic probe trigger path. To use For information on the controls, click the buttons. -
Page 534: Probe Setup Control Window (Probe Compensation)
NOTE. To compensate/calibrate a P7520A or P7600 series probe, use the procedure in the probe manual. Use the manual that came with your probe, the manual in the documentation browser that is accessible from the instrument desktop, or download the manual from the Tektronix Web site. Click for DPO7000C and MSO/DPO5000B instruments:... - Page 535 Vertical setups To use Connect a probe to a vertical input. Press a front panel Ch <1–4> button to activate the channel. In the Probe Setup window, click a Chan <1–4> tab to activate the controls for the input source. Select the probe Type for the appropriate signal and ground connections of the probe compensation terminals.
-
Page 536: Probe Setup Control Window (Probe Tip Selection)
Select the type of probe tip to match the one you are using. Click OK. Here is an example of Probe Tip for Tektronix P73XX probe. Here is an example of Probe Tip for Tektronix Trimode probe. DPO70000SX, MSO/DPO70000DX, MSO/DPO70000C, DPO7000C, and MSO/DPO5000B Series... -
Page 537: Probe Setup Control Window (Probe Deskew)
Vertical setups Probe setup control window (Probe deskew) From the Vertical menu, select Deskew. Overview Use the Probe Setup control window to compensate for propagation delays of different length probes connected to the vertical input channels. Click for DPO7000C and MSO/DPO5000B instruments: Click for MSO/DPO70000C/DX/SX instruments: DPO70000SX, MSO/DPO70000DX, MSO/DPO70000C, DPO7000C, and MSO/DPO5000B Series... - Page 538 NOTE. To compensate for timing differences between voltage and current probes, order the following Probe Calibration and Deskew Fixtures: Tektronix part number 067-0405-XX (for DPO7000C and MSO/DPO5000B oscilloscopes). Tektronix part number 067-1586-XX (for MSO/DPO70000C/DX oscilloscopes). Tektronix part number 067-2083-XX (for MSO Series instruments) to deskew the logic probe trigger path.
-
Page 539: Probe Setup Control Window (Probe Attenuation)
Vertical setups Behavior Each input channel has its own deskew settings. Deskew compensates individual channels for probes or cables of different lengths. The instrument applies the delay values after each completed acquisition. The deskew values, which have a range of ±75 ns, do not affect triggering. - Page 540 Vertical setups To use Click a Chan <1–4> tab to select the vertical input channel for the attached probe. To set the external attenuation as a multiplier or ratio, click in the External Atten entry box and use a multipurpose knob to enter a value.
-
Page 541: Probe Controls Window
The type of probe you connect determines the available controls. For example, the window below contains controls for a Tektronix current probe. The following window contains controls for Tektronix TAP1500/TAP2500 type probes. This window contains controls for Tektronix TriMode probes. -
Page 542: Probe Properties
Status of the Analog to Digital Trigger Path Alignment routine ■ NOTE. The instrument requires the Logic Probe Deskew Fixture (Tektronix part number 067-2083-XX) to run the Analog to Digital Trigger Path Alignment routine. DPO70000SX, MSO/DPO70000DX, MSO/DPO70000C, DPO7000C, and MSO/DPO5000B Series... -
Page 543: Probe Setup Control Window (Probe Status)
Vertical setups The instrument displays the following information in the Analog to Digital Trigger Path Alignment field: N/A means that the trigger path alignment routine has not been run ■ Numeric value for the amount of time the instrument needs to skew the channel to align the logic trigger path to the ■... - Page 544 Vertical setups Fail. The instrument was unable to complete the probe compensation procedure; the probe may be faulty. Have the probe ■ checked by Tektronix service personnel. NOTE. The instrument must pass a Signal path compensation on page 513 procedure before it will perform a probe compensation procedure.
-
Page 545: Signal Path Compensation
Perform the Signal Path Compensation (SPC) regularly to ensure that your measurements have the highest level of accuracy. Tektronix considers it a best practice to run SPC when using the instrument to measure signals with higher sensitivity (10 mV/div and lower) settings regardless of temperature shift or time since it was last run. Failure to perform SPC may result in the instrument not meeting warranted performance levels. - Page 546 Vertical setups Select Instrument Calibration. Utility menu on DPO70000SX instruments When the Temperature Status changes to Ready, click Run SPC to start the calibration. Calibration may take 10 to 15 minutes. NOTE. Before running the SPC calibration, remove all channel input signals.
-
Page 547: Signal Path Compensation Status
Fail One or more failures occurred during the signal path compensation procedure. Contact your local Tektronix service representative for further action. Temp The operating temperature is not within 5 °C of the previous signal path compensation. - Page 548 Vertical setups DPO70000SX, MSO/DPO70000DX, MSO/DPO70000C, DPO7000C, and MSO/DPO5000B Series...
-
Page 549: Copying And Printing
Copying and printing Copy setup Copy setup (Images) From the Edit menu, select Copy Setup; then open the Images tab. Overview. Use this control window to copy images to the clipboard for use with other applications. DPO70000SX, MSO/DPO70000DX, MSO/DPO70000C, DPO7000C, and MSO/DPO5000B Series... -
Page 550: Copy Setup (Waveforms)
Copying and printing To use. Select the Palette for the image: Color ■ Color (Ink Saver Mode) ■ Black & White ■ Select the type of View: Full Screen. Copies an image of the entire screen. ■ Graticule(s) Only. Copies an image of the selected graticule. ■... - Page 551 Copying and printing Overview. Use this control window to copy waveforms to the clipboard for use with other applications. To use. The Data Destination (data format) is Spreadsheet only. ■ Select a valid waveform from the Source list. ■ Select the number of samples you want to copy. Select All samples, a range of samples, or only the samples between the ■...
-
Page 552: Copy Setup (Measurements)
Copying and printing Behavior. The Waveform curve data range can be anywhere from one sample to the record length of the selected waveform. ■ The copy operation takes place after you click Copy. ■ If you select Data between cursors, another set of cursors may temporarily appear on your screen while the copy is in ■... -
Page 553: Copying Procedures
Copying and printing Behavior. When you select Displayed Measurements, all displayed measurements will be copied to the clipboard. NOTE. For Histogram Data, the data format is always CSV. The copy operation takes place after you click Copy. Clicking the OK button accepts the changes and closes the dialog box but does not copy the measurements. -
Page 554: Copying The Screen For Use In Other Applications
Copying and printing Select the number of samples that you want to copy from the Waveform curve data range. Select all samples, a range of samples, or only the samples between the cursors. If you select Save Samples between Cursors, you can use the multipurpose knobs to adjust the positions if the cursors are already active. -
Page 555: Printing
Copying and printing Printing Page setup dialog box From the File menu, select Page Setup. Overview. Use the Page Setup dialog box to define the page before sending it to a printer. To use. The controls in this window are similar to the Page Setup dialog boxes used in most Windows applications (see example below). -
Page 556: Print Dialog Box
Copying and printing Print dialog box From the File menu, select Print. Overview. Use the Print dialog box to send data to a printer. To use. The controls in this window are similar to the Print dialog boxes used in most Windows applications. The settings are dependent on the type of printer connected to the instrument. - Page 557 Copying and printing Control Description Push the Search and Mark buttons to find and place a mark on a waveform at a point of interest, or to edit marks. You can return to a mark and analyze the waveform at a later time. Push the FastAcq DPX button to turn Fast Acquisition On or Off.
- Page 558 Copying and printing DPO70000SX, MSO/DPO70000DX, MSO/DPO70000C, DPO7000C, and MSO/DPO5000B Series...
-
Page 559: File Menu
File menu Reference waveform setups Reference waveform controls From the File menu, select Reference Waveform Controls. Overview. Use the Reference control window to display and control reference waveforms. Reference waveforms are shown with the horizontal settings in effect at the time they are saved. NOTE. -
Page 560: Save As Dialog Box (Waveform)
File menu Save as dialog box (Waveform) From the File menu, highlight Save As; then select Waveform from the submenu. From the Reference Waveform controls, click the Save button. Overview. Use this dialog box to save a waveform to a reference location or to a specified folder. To use. -
Page 561: Recall Dialog Box (Waveform)
Behavior. This dialog box opens when you select Save As from the File menu or click Save from the Reference Waveform controls. The default file type is a Tektronix waveform file (.wfm). If you select a different file type from the Save as Type list, you can also define the for saving the waveform. -
Page 562: Delete Setups And Reference Waveforms
TIP. If you do not see the file that you want to recall, verify that the Files of type list shows the correct file format. You may also need to check other folders if the file was stored in a location other than the C:\Users\[Username]\Tektronix\TekScope \Waveforms folder. -
Page 563: Instrument Setups
File menu Instrument setups Save as dialog box (Instrument setup) From the File menu, highlight Save As; then select Setup from the submenu. Overview. Use the Save As dialog box to save instrument setups for later use. To use. To save in Oscilloscope memory: Click on one of the setup location icons under Save in: Oscilloscope Memory. -
Page 564: Recall Dialog Box (Instrument Setups)
File menu Behavior. You can display up to ten saved instrument setups in this dialog box. Additional setups can be saved to the hard drive. When you save a setup, the label adjacent to the setup icon changes from its previous value to User. You can save setups to any location labeled Factory without overwriting a saved setup. -
Page 565: Delete Setups And Reference Waveforms
File menu To use. Setups are recalled from an internal file on your hard drive or from a setup file that you have named. Under Recall What, click Setup. ■ Click one of the icons under Look in: Oscilloscope Memory, and then click the Recall button to restore the setup. ■... -
Page 566: Action On Event
File menu Behavior. Setups or waveforms stored in Windows directories can be deleted by clicking the in the Save or Recall dialog boxes. NOTE. You can only delete setups and reference waveforms stored in oscilloscope memory using this command. What do you want to do next? Learn about saving instrument setups. -
Page 567: Set Up Save On Event
File menu Set up save on event From the File menu select Action On Event, and then click Save Setup. Overview. Use this control window to set up the conditions under which the instrument will save a file, the types of files to save, and the event limits. -
Page 568: Print Setups
■ Behavior. Histogram data is saved in unless you select a C:\Users\[Username]\Tektronix\TekScope\data different location. To access the Histogram Save As dialog box, you may need to select it from the More submenu. What do you want to do next? Learn about saving waveforms. -
Page 569: Save As Dialog Box (Instrument Setup)
File menu Save as dialog box (Instrument setup) From the File menu, highlight Save As; then select Setup from the submenu. Overview. Use the Save As dialog box to save instrument setups for later use. To use. To save in Oscilloscope memory: Click on one of the setup location icons under Save in: Oscilloscope Memory. -
Page 570: Save As Dialog Box (Measurement)
File menu Behavior. You can display up to ten saved instrument setups in this dialog box. Additional setups can be saved to the hard drive. When you save a setup, the label adjacent to the setup icon changes from its previous value to User. You can save setups to any location labeled Factory without overwriting a saved setup. -
Page 571: Save As Dialog Box (Screen Capture)
Select the type of file (either .txt or .csv) to save from the Save as type list. By default, the file will be saved to the folder. \Users\[Username]\Tektronix\TekScope\Data Click the Save button to accept any changes and close the dialog box. - Page 572 File menu Overview. Use this dialog box to save screen captures to a file for use with other applications. DPO70000SX, MSO/DPO70000DX, MSO/DPO70000C, DPO7000C, and MSO/DPO5000B Series...
- Page 573 In the Save As dialog box, assign your own file name, and then save the file to a specified folder. By default, the image will be saved to C:\Users\[Username]\Tektronix\TekScope\ScreenCaptures Click Save to save the screen capture or cancel to close the dialog box without saving.
-
Page 574: Save As Dialog Box (User Mask)
Save as dialog box (User mask) From the File menu, highlight Save As; then select User Mask from the submenu. Overview. Use this dialog box to save user masks. Masks are saved in C:\Users\[Username]\Tektronix unless you choose another folder. \TekScope\Masks To use. -
Page 575: Save As Dialog Box (Waveform)
File menu Save as dialog box (Waveform) From the File menu, highlight Save As; then select Waveform from the submenu. From the Reference Waveform controls, click the Save button. Overview. Use this dialog box to save a waveform to a reference location or to a specified folder. To use. -
Page 576: Auto-Increment The File Name
Behavior. This dialog box opens when you select Save As from the File menu or click Save from the Reference Waveform controls. The default file type is a Tektronix waveform file (.wfm). If you select a different file type from the Save as Type list, you can also define the for saving the waveform. -
Page 577: Save As Dialog Box (Timestamp)
Click the Save button to accept any changes and close the dialog box. Behavior. Digital data is saved in unless you select a different C:\Users\[Username]\Tektronix\TekScope\data location. Save as dialog box (Timestamp) From the File menu, highlight Save As; then select Timestamp Table from the submenu. - Page 578 Click the Save button to accept any changes and close the dialog box. Behavior. Timestamp data is saved in unless you select a C:\Users\[Username]\Tektronix\TekScope\data different location. TIP. You can conveniently save time stamps from the FastFrame Control Window by using the Acquisition > FastFrame >...
-
Page 579: Tek Secure Erase
Utilities Tek secure erase From the Utilities menu, select Tek Secure Erase. Overview Use TekSecure to erase, for the current user, all waveforms and instrument setups. To use Click OK to erase. ■ Click Cancel to exit the dialog box. ■... -
Page 580: Set Time And Date
Utilities Set time and date From the Utilities menu, select Set Time & Date. Overview Use the Set Time and Date control window to set the time and date on the instrument. To use Click in the entry boxes to map them to the multipurpose knobs, and then use the knobs to set the time and date. ■... -
Page 581: Gpib Configuration Control Window
Utilities GPIB configuration control window From the Utilities menu, select GPIB Configuration (GPIB is not available on DPO70000SX instruments). Overview Use the GPIB Configuration control window to configure the instrument for GPIB (General Purpose Interface Bus) applications. GPIB applications enable you to remotely control your instrument, for example, taking measurements, setting controls, or performing calculations. -
Page 582: Lan Server Status Control Window
Utilities LAN server status control window From the Utilities menu, select LAN Server Status. Overview This control window allows you to enable the VXI-11 LAN server to accept GPIB commands. For more information, see the Getting Started with OpenChoice Solutions manual that shipped with your instrument. To use Click the Start button to enable the VXI LAN server to accept GPIB commands. - Page 583 Utilities Figure 16: Utilities menu on C model instruments. Figure 17: Utilities menu on SX model instruments To use To send a signal from the Aux Out BNC connector when the instrument triggers: Click on the desired configuration button: A Trig, B Trig, Event, or Ref Out. A Trig to send a signal when the A Trigger generates a trigger ■...
-
Page 584: Touch Screen
Utilities Behavior For Auxiliary Output, the selected signal is routed to the Aux Out BNC connector so that you can trigger another instrument, such as a logic analyzer. The output voltage is TTL-compatible. For External Reference Sources, the clock reference is routed to the Ext Ref BNC connector when you select External. NOTE. - Page 585 For all calibrations, the SPC Status control should indicate Pass or Compensated. If it does not, contact your local Tektronix service personnel. The oscilloscope displays the date of the last time the SPC routine was run beneath the SPC Status control.
-
Page 586: Instrument Diagnostics Control Window
Utilities Instrument diagnostics control window From the Utilities menu, select Instrument Diagnostics. Overview Use this control window to run the instrument diagnostics. The following screen appears on MSO/DPO5000B Series instruments: To use Use the drop-down list boxes to identify the Subsystem, Area, and Test you want to run. Use the Halt Condition controls to enable looping on the selected test(s) or to halt looping as soon as a failure occurs. -
Page 587: E-Mail On Event Control Window
NOTE. Remove the input signals before running any diagnostics. If any diagnostic failures occur, record the failure information, and then contact your local Tektronix service personnel for more information. E-mail on event control window From the Utilities menu, highlight E-mail on Event;... -
Page 588: Measurement Save Options
Utilities To use In the Recipient e-mail address(es) entry box, type in the addresses where you want to send e-mail. Use a comma to separate multiple addresses. In the Send E-mail on check boxes, select the events on which you want to send e-mail. Use the E-mail Attachments check boxes to select the type of attachment to include with the e-mail. - Page 589 Utilities Overview. Use this control window to set up the conditions under which the instrument will send an e-mail and with the types of attachments to include for the measurements. To use. Click the Settings button to open the Measurement Save Options dialog box. Select the measurement option and the file format.
-
Page 590: Multipurpose Knobs
Utilities Multipurpose knobs The multipurpose knobs can be used to set screen interface parameters (Using the knobs on DPO70000SX instruments requires the DPO7AFP accessory). To use, click a control on the screen to map it to the multipurpose knob(s). Control Description You can undo any mapping by right-clicking the multipurpose knob(s) and selecting Deassign Multipurpose Knobs, or from... -
Page 591: User Preferences Control Window
Utilities User preferences control window User preferences (Prompt before action) From the Utilities menu, select User Preferences; then open the Prompts tab. Overview. Use the Prompts tab to indicate whether or not you want the instrument to display prompts (confirmation messages) before carrying out certain tasks, like deleting files or waveforms. -
Page 592: User Preferences (Readouts)
Utilities To use. To change the label for the selected preset control, click in the Keypad Label text entry boxes and enter a name. ■ Click in the Trig Label Level entry boxes to map them to the multipurpose knobs. Use the knobs to set the trigger level ■... -
Page 593: User Preferences (Measurement Annotation)
Utilities Behavior. The maximum length of time you can leave the readouts highlighted is 5 seconds. The following readouts are highlighted: Vertical Scale ■ Horizontal Delay ■ Trigger Level ■ Trigger Source ■ Trigger Slope ■ Source Termination ■ What do you want to do next? Learn about setting up prompts for certain controls. -
Page 594: User Preferences (Units)
Utilities User preferences (Units) From the Utilities menu, select User Preferences; then open the Units tab. Overview. Use the Units tab to set the detents for the vertical scale controls. To use. Click one of the buttons to set the vertical scale detents: Click 1–2–3 to set the vertical detent increments to 1, 2, 3, 4... -
Page 595: Option Installation
Option installation Install an option From the Utilities menu, select Option Installation. Overview. Use Option Installation to enable upgrades that you have purchased for your instrument from Tektronix. For the most current list of upgrades, go to www.tektronix.com or contact your local Tektronix representative. - Page 596 Utilities To use. Click the Continue button in the initial dialog box. Use either floating license or fixed license and follow the on-screen instructions to install the options. DPO70000SX, MSO/DPO70000DX, MSO/DPO70000C, DPO7000C, and MSO/DPO5000B Series...
- Page 597 Utilities NOTE. Use the fixed license option installation to permanently install the optional features and applications. Use the floating license option installation to temporarily install the optional features and applications. Behavior. The installation dialog box lists information about the installed options and applications. The installation is acknowledged when complete.
-
Page 598: Install The Floating License
Install the floating license From the Utilities menu, select Option Installation. Overview. Use Option Installation to enable upgrades that you have purchased for your instrument from Tektronix. For the most current list of upgrades, go to or contact your local Tektronix representative. - Page 599 Utilities To use. Click the Install button next to Floating License. Browse to the path where the floating license key file (.lic) is located, select the file, and click Open. On successful installation, a dialog box appears indicating that the Option is enabled. Reboot the instrument for the changes to take effect.
-
Page 600: Install The Fixed License
Install the fixed license From the Utilities menu, select Option Installation. Overview. Use Option Installation to enable upgrades that you have purchased for your instrument from Tektronix. For the most current list of upgrades, go to or contact your local Tektronix representative. - Page 601 To use. Fixed License Click the Install button next to Fixed License. Enter the option installation key (provided by Tektronix) in the Options dialog box. Click OK. On successful installation a dialog box appears. Reboot the instrument for the changes to take effect.
-
Page 602: Return The Floating License For The Installed Option(S)
Return the floating license for the installed option(s) From the Utilities menu, select Option Installation. Overview. Use the Option Installation to return the floating license for the installed Option(s) that you purchased for your instrument from Tektronix. DPO70000SX, MSO/DPO70000DX, MSO/DPO70000C, DPO7000C, and MSO/DPO5000B Series... - Page 603 Utilities To use. From the Utilities menu, select Option Installation. Click Continue. The following dialog box appears. Select the Option (for example DPOFL-PTD (TDSPTD)) in the Tekscope Option Installation dialog box and click the Return button (when the license is still valid) or click Exit Key button (when the license has expired). A dialog box appears.
- Page 604 NOTE. Ensure that the Exit Key file is uploaded to the Online Floating License Management System on http:// www.tektronix.com/floatinglicense to access the floating license again. The following dialog box appears on completing the return of a floating license. Click Close.
- Page 605 Utilities DPO70000SX, MSO/DPO70000DX, MSO/DPO70000C, DPO7000C, and MSO/DPO5000B Series...
- Page 606 Utilities DPO70000SX, MSO/DPO70000DX, MSO/DPO70000C, DPO7000C, and MSO/DPO5000B Series...
-
Page 607: Calibrating And Using Probes
Compensate active probes NOTE. This online help file supports many oscilloscope models from Tektronix. This feature is only available on some models. Use this procedure to optimize gain and offset accuracy at the probe tip for each active probe. Allow the instrument and probe to warm up before performing this procedure. -
Page 608: Compensate Passive Probes
Select the channel to which the probe is attached. Click Compensate Probe to begin the procedure. The Probe Status indicator changes to Pass when the procedure is complete. If the procedure does not pass, contact your local Tektronix service personnel. Remove the connections from the terminals. -
Page 609: Acquiring Analog Signals
For DPO7000C and MSO/DPO5000B Series oscilloscopes, order Tektronix part number 067-0405-XX. For DPO70000C and DPO7000C Series oscilloscopes, order Tektronix part number 067-1586-XX. For MSO70000C/DX Series instruments: Tektronix part number 067-2083-XX to deskew the logic probe trigger path. This fixture is a standard accessory. -
Page 610: Setting Acquisition Modes
How to ? Setting acquisition modes Use this procedure to set the data acquisition mode and specify acquisition start/stop methods. Power on the instrument. Set up the horizontal, vertical, and triggering controls. From the Horiz/Acq menu, open the Acquisition control window. Click an Acquisition Mode button. -
Page 611: View The Analog Characteristics Of A Digital Signal
How to ? Adjust the Intensity: Open the Display control window Appearance tab. Rotate the front-panel Intensity knob to adjust the intensity of displayed waveforms, or click in the Intensity FastAcq/ WfmDB entry box and enter the intensity value with the keypad or multipurpose knob. Select the Color Palette: Open the Display control window Colors tab. -
Page 612: Acquiring Digital Signals
How to ? The iCapture function allows you to view the analog characteristics of signals connected to a digital channel. Additional measurement capabilities are available while viewing the analog characteristics of a signal. You can route up to four of the 16 digital inputs (D15-D0) and Clock/qualifier inputs to the analog channels through a logic probe using iCapture. -
Page 613: Displaying Waveforms As A Bus
How to ? Displaying waveforms as a bus Set up a bus NOTE. Use of serial buses may require an option on your instrument. You can set up parallel or serial buses. For both types of buses, follow theses steps: From the Digital or the Vertical menu, select Bus Setup. -
Page 614: Set Up An Spi Serial Bus
Set up an RS-232 serial bus NOTE. This online help file supports many oscilloscope models from Tektronix. This feature is only available on some models. First, follow the common steps to set up any bus. To continue to set up an RS-232 serial bus, follow these steps: To define the bus type in the Bus Setup window, click Serial as the Bus Type, and select RS-232 from the drop-down list. -
Page 615: Set Up A Mipi Dsi-1 Serial Bus
How to ? To set an input voltage reference threshold high level, double-click the Threshold (H) entry box and use the keypad to enter the level. To set an input voltage reference threshold low level, double-click the Threshold (L) entry box and use the keypad to enter the level. -
Page 616: Set Up A Custom Serial Bus
How to ? Set up a custom serial bus First, follow the common steps to set up any bus. To continue to set up a custom serial bus, follow these steps: To define the bus type in the Bus Setup window, click Serial as the Bus Type, and select Custom from the drop-down list. To select the custom decoder, click the Custom Decoder arrow, and select the custom decoder from the drop-down list. -
Page 617: Set Up A Flexray Serial Bus
How to ? Set up a FLEXRAY serial bus First, follow the common steps to set up any bus. To continue to set up an FLEXRAY serial bus, follow these steps: To define the bus type in the Bus Setup window, click Serial as the Bus Type, and select FLEXRAY from the drop-down list. To select the signal type, click the Signal Type arrow, and select the type from the drop-down list. -
Page 618: Analyzing Buses
Tracking down I2C serial bus anomalies NOTE. This online help file supports many oscilloscope models from Tektronix. This feature is only available on some models. You can use your oscilloscope, with its bus triggering and long-record length management features, to track down a problem in the physical layer and the protocol layer of a bus. -
Page 619: Troubleshooting Circuits Using A Parallel Bus
Troubleshooting circuits using a parallel bus NOTE. This online help file supports many oscilloscope models from Tektronix. This feature is only available on some models. You can use digital, analog, or math waveforms to create, monitor, and analyze a parallel bus with your instrument. The supported instruments let you see the on-off status of the signals and decodes the parallel bus signals for you. - Page 620 14. To decode the parallel bus with a symbol table file, click the Use Symbol check box, and enter the full path to the file in the entry box or use the Browse button to locate the file. The file must reside on the instrument in the C:\Users\[Username] \Tektronix\TekScope\busDecodeTables directory. Here is the symbol table file used in this troubleshooting example.
- Page 621 How to ? 21. Acquire data from the parallel bus. 22. Push the MultiView Zoom front panel button, and scroll to the areas of interest to analyze the results. What do you want to do next? Learn about digital setups. Learn about bus setups.
-
Page 622: Troubleshooting An Spi Serial Bus
Troubleshooting an SPI serial bus NOTE. This online help file supports many oscilloscope models from Tektronix. This feature is only available on some models. There are various situations where you need to look at analog characteristics of a digital signal in a digital circuit. For example, you may want to analyze the signal integrity of a signal in a system under test, such as for an SPI serial bus. - Page 623 How to ? 19. Acquire data from the serial bus. 20. Push the MultiView Zoom front panel button, and scroll to the areas of interest to analyze the results. What do you want to do next? Learn about digital setups. Learn about bus setups.
-
Page 624: Creating And Using Myscope Control Windows
The default location to save MyScope files is C:\Usrs\[Username] \Tektronix\TekScope\MyScope 13. From the MyScope menu, click Open Control Window…. 14. Select the MyScope control window that you want from the Open MyScope Control Window dialog box, then and click Open. -
Page 625: Taking Measurements
The default location to save MyScope files is C:\Users\[Username] \Tektronix\TekScope\MyScope 13. From the MyScope menu, click Open Control Window. 14. Select the MyScope control window that you want from the Open MyScope Control Window dialog box, and then click Open. - Page 626 How to ? To turn the display of the cursors on or off, push the front-panel Cursor button. For waveform or screen cursors, set the cursor style by selecting one of the following from the list: ■ Lines. Displays the intersection of horizontal and vertical lines. Lines are the default style for Screen cursors. ■...
-
Page 627: Taking Cursor Measurements
How to ? Taking cursor measurements Use the following procedure to take measurements with cursors: To open the Cursor Controls window, press the Cursors button on the front panel, click Cursors on the toolbar, or select Cursor Setup from the Cursors menu. NOTE. -
Page 628: Take Automatic Measurements
How to ? Remove a measurement. To remove the measurement, click Clear Selected. The last measurement on the list is removed. ■ To remove any measurement, click the name on the Measurements list to highlight the measurement, and then click ■... -
Page 629: Localize A Measurement
Click OK to save the measurement options, or click Cancel to close the dialog box without saving the changes. To save the measurements to a file, select the location to save from the Save in drop-down list. The default location is \Users\[Username]\Tektronix\TekScope\data DPO70000SX, MSO/DPO70000DX, MSO/DPO70000C, DPO7000C, and MSO/DPO5000B Series... -
Page 630: Creating And Using Math Waveforms
How to ? Use the default name for your file, type a unique name into the Name text box, or select an existing name from the Name list (data in the existing file will be overwritten). You can also select the Auto-increment file name check box to save a series of files without typing in a new name each time. - Page 631 How to ? Prerequisites. A math waveform must be defined and displayed. Create a math waveform Use the following procedure to create a math waveform. Ensure that the sources, waveforms, and measurement scalars you will use are present. The sources do not have to be displayed. From the toolbar, click the Math button to open the Math Setup control window.
- Page 632 How to ? Math waveform operations And get this math waveform: To simulate AC coupling on this waveform: Enter this expression: Intg(Ch1-Avg(Ch1)), where Ch1 is the waveform shown at left Avg is the average function And get this math waveform: Offset, position, and scale The settings that you make for offset, scale, and position affect the math waveform you obtain.
-
Page 633: Create A Math Waveform Using Predefined Expressions
How to ? Set scale and position. Click in the Position and Scale entry boxes and use the multipurpose knobs or pop-up keypad to size and position the waveform on the screen. Keep in mind the following: The position is in divisions, so changing the scale can make the math waveform disappear until position is also changed ■... -
Page 634: Create A Math Waveform With The Equation Editor
How to ? Click one of the Predefined Expression buttons in the control window. The predefined expression is added to the math expression at the top of the control window and the math waveform appears on the screen. TIP. You can select Predefined Expressions directly from the Math menu. Create a math waveform with the equation editor Use the following steps to create math waveforms using the Equation Editor: Open the Math Setup control window by clicking Math on the toolbar, or by selecting Math Setup in the Math menu. -
Page 635: Using Mask And Limit Testing
How to ? 10. Click in one of the Math <1–4> n = entry boxes, and then set the number of averages using the multipurpose knobs or pop- up keypad. This number of averages affect math waveforms if the Avg() function is used. 11. - Page 636 How to ? In the Masks tab, click the Autoset button to have the instrument automatically adjust instrument settings to align the waveform to the mask based on the characteristics of the input signal. Autoset is performed on the first waveform acquired after clicking the Autoset button.
-
Page 637: Create A New User Mask
How to ? 10. Set the Mask test pass and fail parameters: Open the Pass/Fail Setup tab of the Masks Testing control window. Use the control knob, keypad, or pop-up keypad to enter the number of waveforms to test (number of samples in some modes), the failure threshold (the number of waveforms that must fail to fail the test), and the delay time (the time from when mask test starts to when the instrument begins sampling). -
Page 638: Create A User Mask From A Defined Mask
How to ? NOTE. You do not need to save an edited user mask to disk; the instrument retains the current user mask in nonvolatile memory. If you plan to create a number of user masks, store your user masks on disk or the hard drive. The instrument can only load one user mask at a time. -
Page 639: Edit A User Defined Mask
How to ? Click the appropriate button in the Type field to select a mask type. Click the More button to display further selections. NOTE. Industry standard masks are available with the Mask Testing feature. The Comm Trigger is designed to work with communications mask and standard testing. -
Page 640: Save A User Mask To Disk
How to ? Save a user mask to disk From Mask menu, select Mask Edit Setup. In the Mask Edit control window, click the Save button to open the Save As dialog box. Specify the save location in the Save in drop-down list box. In the Name field, enter the mask name;... -
Page 641: Using E-Mail On Event
How to ? Select the Type of mask you want to use. Select the mask standard from the drop-down list. NOTE. The standard you select will determine whether you also need to set the polarity for the test. Make any necessary changes to the Display or Alignment configurations. Click the Hit Count button to turn it off or on. -
Page 642: Creating Spectral Waveforms
How to ? Send an E-mail on Trigger. Select the trigger type. Select the trigger source. Set the appropriate parameters for the trigger. From the Mode tab, click E-mail on Trigger to On. Press the Run/Stop button to begin acquiring data to trigger. Creating spectral waveforms Create a spectral waveform Use these steps to display a spectral (FFT magnitude) waveform. -
Page 643: Define A Spectral Math Waveform
How to ? Define a spectral math waveform Use the following procedure to define a spectral math waveform. Before you begin, ensure that the sources you will use are either acquiring or have acquired data. These sources do not have to be displayed to be used. All sources that you will use in your math waveform must be available. - Page 644 How to ? To set the reference level, click in the Level entry box, and use the multipurpose knobs or pop-up keypad to set the reference level. TIP. Reference level is the value at the top of the display screen. It only applies to magnitude waveforms. Adjusting the reference level positions the waveform with respect to the top of the display, but does not change the position of the waveform with respect to its ground reference.
- Page 645 How to ? To set the center frequency of the spectral analysis, click in the Center Frequency and use the multipurpose knobs or pop-up keypad to set the center frequency. Resolution bandwidth determines how small of a frequency difference can be resolved in the frequency domain output data.
-
Page 646: Use A Predefined Spectral Math Waveform
How to ? Take a cursor measurement Use the following procedure to take measurements with cursors: To open the Cursor Controls window, press the Cursors button on the front panel, click Cursors on the toolbar, or select Cursor Setup from the Cursors menu. Select the waveform you want to measure and a Cursor Type from the control window. -
Page 647: Using Reference Waveforms
NOTE. When you save a waveform as a reference waveform, a file containing the waveform data is created in C:\Users\ [Username]\Tektronix\TekScope\Waveforms. The file is named TDS_REFn.WFM, where n is the reference waveform number. Do not manually delete this file because the data will no longer be available. -
Page 648: Recall A Reference Waveform
Risetime001.ext and so on. If Count reaches 999, Tektronix suggests that you change the base file name, for example, Risetime1 on the next save. Your next file will then be saved as . You will receive a warning message if you are going to overwrite any Risetime1000.ext... -
Page 649: Copy Waveform Data
How to ? Name your waveform file by typing a name in the Name text box, or select an existing name from the file list (data in the existing file will be overwritten). You can also select the Auto-increment file name check box to save a series of files without typing in a new name each time. -
Page 650: Save A Screen Capture
Click OK to save the screen capture options, or click Cancel to close the dialog box without saving the changes. In the Save As dialog box, select the location to save from the Save in drop-down list. The default location is C:\Users\ [Username]\Tektronix\TekScope\Screen Captures DPO70000SX, MSO/DPO70000DX, MSO/DPO70000C, DPO7000C, and MSO/DPO5000B Series... -
Page 651: Using Horizontal Delay
How to ? Name your screen capture by typing a name in the Name text box, or select an existing name from the file list (data in the existing file will be overwritten). You can also select the Auto-increment file name check box to save a series of files without typing in a new name each time. -
Page 652: Using Roll Mode
How to ? Click the Horiz toolbar button to open the horizontal/acquisition setup control window. Open the Acquisition tab. Click Roll Mode Off to disable roll mode. Roll mode is also disabled when you set the horizontal scale to 200 ms per division or faster. -
Page 653: Set Up Triggering From The Front Panel
How to ? Set up triggering from the front panel The front panel provides quick access to the most frequently used trigger controls. The trigger readout shows you the state of the trigger system. On DPO70000SX instruments use the DPO7AFP accessory. The Slope, Coupling, and Source controls only apply to edge triggering. -
Page 654: Set Up Triggering From The Trigger Setup Window
How to ? Advanced triggering You can check the advanced trigger status in the readout. The readout indicates the trigger type and then shows sources, levels, or any other parameters that are important for the particular trigger type. Set up triggering from the trigger setup window The following trigger parameters are accessible only through the Trigger control windows: ■... -
Page 655: Trigger On A Sequence
How to ? Define preset levels. From the Utilities menu, select user Preferences. In the User Preferences control window, open the Keypad Defaults tab. Click in the appropriate Trig Level entry box; then use the pop-up keypad or multipurpose knob to adjust the preset. If desired, click a Keypad Label and change the label of the preset using the pop-up keypad. -
Page 656: Trigger On A Event Only
Set the A Trigger Type and Source from the A Event tab in the Trigger control window. Set the B Trigger Type and Source from the B Event tab. NOTE. This online help file supports many oscilloscope models from Tektronix. This feature is only available on some models. -
Page 657: Trigger On A Glitch
How to ? Trigger on a glitch Use the following procedure to detect and trigger on a glitch, or to ignore a glitch: Push the front-panel Advanced button. In the Trigger control window, open the A Event tab. Select Glitch from the Trigger Type drop-down list. Specify the trigger source. -
Page 658: Trigger On A Pulse Width
How to ? Select a Polarity value to specify the direction of the runt pulse. Triggering occurs at the point the pulse returns over the first threshold without crossing the second threshold level. The polarity selected determines the order that the threshold must be crossed for a runt trigger to occur: ■... -
Page 659: Trigger On A Pulse Timeout
How to ? In the Pulse Width drop-down list: ■ Select Inside to trigger on pulses that fall within the specified range. ■ Select Outside to trigger on pulses that are outside the range. You can also Trigger on a logic-qualified pulse using the Trigger if Width "Logic" selection. When the instrument detects that a width trigger condition has occurred, it checks the logical state of two other available channels and triggers only if their conditions are met. -
Page 660: Trigger On A Pattern
How to ? Trigger on a pattern Use the following procedure to trigger the instrument when the logic inputs cause the selected function to become True or False. You can also specify that the logic conditions must be satisfied for a specific amount of time before the instrument triggers. Push the front-panel Advanced button. -
Page 661: Pattern Triggers
How to ? Pattern triggers A pattern trigger occurs when the inputs to the selected logic function cause the function to become True or False. When you use a pattern trigger, you define: ■ The precondition for each logic input: logic high, low, or "don't care"; the logic inputs are the instrument channels ■... -
Page 662: Trigger On A Logic State
How to ? Pattern State Definition If all the preconditions selected for the logic inputs are TRUE, Clocked AND then the instrument triggers. If not all of the preconditions selected for the logic inputs NAND Clocked NAND TRUE, then the instrument triggers. If any of the preconditions selected for the logic inputs Clocked OR TRUE, then the instrument triggers. -
Page 663: Trigger On The Transition Time
How to ? In the Trigger if Logic State drop-down list, select True to trigger the instrument when the logic patterns are true. Select False to trigger the instrument when the logic patterns are false. TIP. For simplest operation, leave this control set to True. Setting the control to False complements the output of the chosen pattern function (for example, from AND to NAND or NOR to OR). -
Page 664: Trigger On Setup-Hold Time Violations
How to ? In the Transition drop-down list: NOTE. On MSO/DPO5000B Series instruments, < or > options are available instead of Less Than or Greater Than. ■ Click Less Than to trigger when the transition time is less than the time you set above. ■... - Page 665 How to ? 10. To set the hold time relative to the clock, click in the Hold Time entry box, and then use the multipurpose knob or pop-up keypad to enter a value. NOTE. Positive setup time always leads the clock edge; positive hold time always follows the clock edge. Setup time always leads the hold time by at least 2 ns (TS + TH ≥...
-
Page 666: Trigger On Window Threshold Violations
How to ? Set up and hold violation trigger Trigger on window threshold violations Use the following procedure to trigger the instrument when the input signal rises above an upper threshold level or falls below a lower threshold level. Push the front-panel Advanced button. In the Trigger control window, Open the A Event tab. -
Page 667: Trigger On A Video Signal
How to ? A value is considered high if the channel input voltage is greater than the specified threshold voltage; a value is considered low if the channel input voltage is less than the specified threshold voltage. Use the "don't care" selection for any channels that will not be used as part of the pattern. -
Page 668: Trigger On A Bus
How to ? Select Comm from the Trigger Type drop-down list. To specify the trigger source, click Source; then select a channel from the drop-down list. Select Clock or Data from the Type drop-down list. If you select Clock, you will also need to select the polarity. Select the Coding format for triggering on a communication signal and the Standard to use with the coding format. - Page 669 How to ? The instrument searches for and marks all similar events that meet the trigger requirements. The results of the search are shown as marked events on screen, and they can also be viewed in the Results tab of the Mark Table. From the Analyze menu select Search, and then select the Results tab.
- Page 670 How to ? You can also add a visual trigger area. See Visual Trigger Setup The results of the edge trigger and the visual trigger are also displayed in the search results. NOTE. Mark All Trigger Events in Record is not available with some trigger types. DPO70000SX, MSO/DPO70000DX, MSO/DPO70000C, DPO7000C, and MSO/DPO5000B Series...
-
Page 671: Using Histograms
How to ? Using histograms Set up a histogram Use the following steps to set up a histogram: From the Measure menu, click Waveform Histograms to open the Waveform Histogram Setup window. Use the to select the waveform, and then use the other instrument controls to position the waveform in Channels Selector the center of the screen. -
Page 672: Using Display Modes
How to ? ■ Off/On. Turns histogram counting and the display on or off. NOTE. You can only display one type of histogram at a time. Horizontal histograms have a maximum of 1000 bins while, vertical histograms have a maximum of 252 bins. Click a Histogram Scaling option: ■... -
Page 673: Set Up Xy Display Format
How to ? Horizontal reference marker Set up XY display format Use the following steps to set up the instrument in XY Display format: Determine the waveform pairs you want to display. Click Display in the toolbar, or select Appearance in the Display menu. In the Display control window, open the Appearance tab. -
Page 674: Choosing A Color Palette
How to ? 11. Click the Lock and Scroll tab to select a zoom lock and scroll setting: ■ To scroll a single zoomed area, click Zoom <1–4>, and then click an AutoScroll button. ■ To scroll multiple zoomed areas simultaneously, click Lock, and then click the Zoom <1–4> buttons you want to scroll through. -
Page 675: Saving And Restoring Instrument Setups
How to ? Overview. Use this control window to customize the color of your waveform display. To use. Click the Source drop-down list to select the waveform for which you want to change the color. Select HLS from the Wfm Palette drop-down menu; then click in the Hue, Saturation, or Lightness entry boxes and use the multipurpose knobs to adjust the percentage of each of these attributes. -
Page 676: Recall An Instrument Setup
How to ? Click OK to overwrite an existing instrument setup, if desired. NOTE. The data in reference waveforms is not saved with the instrument setups. However, the setup information includes which reference waveforms are turned on and which are used with math waveforms and automatic measurements. If you want to save the reference waveform data, save the reference waveform separate from the instrument setup. -
Page 677: Using The Programmer Online Guide
Each application can be purchased and installed on the instrument at any time. Contact your Tektronix representative for purchasing information. Follow the installation instructions that come with the application. - Page 678 How to ? After the instrument display appears, click Minimize in the File menu or press CTRL+M to minimize the instrument application. Right-click on the desktop and select Properties to open the Display Properties dialog box. Open the Display Devices tab to define the Operating Mode and Display Selection of the monitors. In the Display Selection drop downs, set the Primary Device to Notebook, and set the Secondary Device to Monitor.
-
Page 679: Connecting To A Network
How to ? Connecting to a network Enable a network connection Use the following steps to enable network access to the instrument. You must begin this procedure with the instrument powered off. TIP. You may want to print these instructions before you proceed. Attach a keyboard and mouse to the instrument. -
Page 680: Adjusting Display Contrast
How to ? Adjusting display contrast Adjust the display contrast If you find that the instrument screen is too bright or too dark, use these steps to adjust the LCD display contrast to your preference. You need to have a mouse attached to perform this procedure. Right-click on the Windows desktop. -
Page 681: Oscilloscope Reference
Oscilloscope reference Functional model The instrument has four high-level subsystem processes, consisting of both hardware and software functions, and the data that connects them. Digital signal acquisition system This system acquires a waveform record from each input signal you probe. This system consists of the following subsystems: Input Channels. -
Page 682: Process Overview
Oscilloscope reference Process overview Process overview The instrument starts in the idle state; it enters this state at power on, upon receiving most control setting changes, or on finishing acquisition tasks. Control settings are implemented as they are requested. When you toggle the Run/Stop control to Run, the instrument starts the hardware. -
Page 683: Waveform Acquisition
Up to four acquisition channels are available. You can display each channel as a waveform or use the channel data to create other waveforms, such as math and reference waveforms. Tektronix provides a variety of probes and cables for this product. You can also check your Tektronix catalog for connection accessories to support your probing requirements. -
Page 684: Input Conditioning
Oscilloscope reference Input conditioning You can use input conditioning to ensure that the instrument acquires the best possible data for processing. Set the to control the size of the vertical acquisition window for each channel to capture all or part of the input ■... -
Page 685: Coupling
Oscilloscope reference Controls. From the Menu bar, select Vertical > Bandwidth Enhancement. When Analog Only is selected, the bandwidth enhancement filter is not applied to the input data. ■ When Digital Filters (DSP) Enabled is selected, the bandwidth enhancement filter is turned on whenever the base sample ■... -
Page 686: Vertical Acquisition Window Considerations
Oscilloscope reference Figure 19: Adjusted horizontal scale Figure 18: Acquired waveform Set the horizontal scale, position, and resolution (record length) to include the acquired waveform record waveform attributes of interest with good sampling density on the waveform. These settings define the horizontal acquisition window, described inHorizontal Acquisition Window Considerations NOTE. - Page 687 Oscilloscope reference Figure A Figure B DPO70000SX, MSO/DPO70000DX, MSO/DPO70000C, DPO7000C, and MSO/DPO5000B Series...
-
Page 688: Horizontal Acquisition Window Considerations
Oscilloscope reference ■ As you vary vertical offset, the middle voltage level moves relative to zero. This moves the vertical acquisition window up and down on the waveform. With input signals that are smaller than the window, it appears the waveform moves in the window. -
Page 689: Horizontal Acquisition Window Interrelated Parameters
Oscilloscope reference ■ The horizontal scale determines the horizontal size of the window relative to any waveform, allowing you to scale it to contain a waveform edge, a cycle, or several cycles. What do you want to do next? Learn more about Horizontal Setup. Horizontal acquisition window interrelated parameters Horizontal Scale, Record Length, Sample Interval, and Resolution are related parameters that specify the horizontal acquisition window. -
Page 690: Independent Versus Shared Window
Oscilloscope reference Overview Learn about horizontal scale. Learn about record length. Learn about horizontal resolution. Independent versus shared window The instrument applies the same horizontal acquisition window to all channels from which it acquires data. Unlike the vertical acquisition window that you size and offset independently for each channel, the same time/div, resolution (record length), and horizontal position (from the same trigger point) apply to all channels simultaneously. -
Page 691: Autoset Considerations
Oscilloscope reference Autoset considerations Autoset acquires samples from the input signal and attempts to take the following actions based on the input data: Evaluates the amplitude range of the input signals and sets the size and vertical offset of the vertical acquisition window to ■... -
Page 692: Sampling Process
Oscilloscope reference Signal connection This diagram displays the signal connection model for each input channel. What do you want to do next? Learn more about coupling. Learn more about the vertical acquisition system. Sampling process Acquisition is the process of sampling an analog signal, converting it into digital data, and assembling it into a waveform record, which is then stored in acquisition memory. -
Page 693: Sampling Modes
Oscilloscope reference What do you want to do next? Learn about sampling modes. Sampling modes The acquisition system can process the data as it is acquired, averaging or enveloping the waveform data to produce enhanced waveform records. Once the waveform record exists (enhanced or not), you can use the post processing capabilities of the instrument to further analyze that record. -
Page 694: Interleaving
Oscilloscope reference The previous figure shows that the instrument acquires points in order from left to right. When all of the points in the waveform record have been sampled and digitized, the waveform record is stored in acquisition memory and becomes available for display (or use in math waveforms, storage, and so on). What do you want to do next? Learn about Horizontal window considerations. -
Page 695: Trigger Function
Oscilloscope reference Trigger function Triggering concepts Overview. To use the instrument to sample a signal and digitize it into a waveform record that you want to process, you need to set up the trigger conditions. The next figure shows how triggers fit into the overall instrument operation. Triggers create meaningful waveforms from signal displays. -
Page 696: Trigger Sources
NOTE. This online help supports many oscilloscope models from Tektronix. Some of these sources may not be available on your instrument. Some of the sources may not be available on your instrument with its current setup. -
Page 697: Trigger Types
NOTE. This online help supports many oscilloscope models from Tektronix. This feature is only available on some models. Glitch... -
Page 698: Trigger Modes
Oscilloscope reference Communication trigger. Communication trigger is not available on MSO/DPO5000B Series instruments. Available with Mask Testing, this trigger is designed to work with communication masks and standards. Mask testing automatically uses Communication triggers. NOTE. You must install the Serial mask testing optionon some instruments before you can access the Comm triggers. -
Page 699: Trigger Coupling
Oscilloscope reference At the longer holdoff time for the top waveform, unstable triggering occurs. With a shorter holdoff set for the bottom waveform, triggers all occur on the first pulse in the burst to remedy the unstable trigger. The Holdoff setting range is 1.5 µs (minimum holdoff available) to 12 s (maximum holdoff available). For more information on how to set holdoff, click here. -
Page 700: Horizontal Trigger Position
Oscilloscope reference Learn about trigger position. Learn about trigger slope. Horizontal trigger position Horizontal position is an adjustable feature that defines where the trigger occurs on the waveform record. It lets you choose how much the instrument acquires before and after the trigger event. The part of the record that occurs before the trigger is the pretrigger portion. -
Page 701: Bus Trigger
Oscilloscope reference Bus trigger A bus trigger occurs when a supported instrument detects a bus pattern that you specify for a parallel bus, or a bus cycle you select for aserial bus. You can set the instrument to trigger on a parallel bus when the instrument detects a match to the bus pattern, or when the instrument detects that the value on the bus is <... -
Page 702: Glitch Trigger
Oscilloscope reference Learn more about eye measurements. Go to the mask testing setup overview. Glitch trigger A glitch trigger occurs when the instrument detects a pulse narrower (or wider) than some specified time. You can set the instrument to trigger on glitches of either polarity or to reject glitches of either polarity. Pattern trigger A pattern trigger occurs when the inputs to the selected logic function cause the function to become True or False. -
Page 703: Runt Trigger
Oscilloscope reference Runt trigger A runt trigger occurs when the instrument detects a short pulse that crosses one threshold but fails to cross a second threshold before recrossing the first. ■ You can set the instrument to detect any positive or negative runt pulse, or only those wider than a specified minimum width. ■... -
Page 704: State Trigger
Oscilloscope reference Setup/hold triggering uses the setup/hold violation zone to detect when data is unstable too near the time it is clocked. Each time trigger holdoff ends, the instrument monitors the data and clock sources. When a clock edge occurs, the instrument checks the data stream it is processing (from the data source) for transitions occurring within the setup/hold violation zone. -
Page 705: Timeout Trigger
Oscilloscope reference Pattern State Definition If all the preconditions selected for the Clocked AND logic inputs are TRUE, then the instrument triggers. If not all of the preconditions selected for NAND Clocked NAND the logic inputs are TRUE, then the instrument triggers. -
Page 706: Width Trigger
Oscilloscope reference Width trigger A width trigger occurs when the instrument detects a pulse that is inside or outside some specified time range. The instrument can trigger on positive or negative width pulses. Width triggers can also be qualified by the logical state of other channels. Window trigger NOTE. -
Page 707: Triggering With Horizontal Delay On
Oscilloscope reference What do you want to do next? Learn more about sequential triggering. Learn about advanced triggers. Triggering with horizontal delay on You can use horizontal delay when you want to acquire a waveform record that is separated from the trigger event by a significant interval of time. -
Page 708: Triggering And Horizontal Delay Summary
Oscilloscope reference What do you want to do next? Learn about advanced triggers. View a summary of triggering and horizontal delay. Triggering and horizontal delay summary The next figure shows all combinations of triggering and horizontal delay. DPO70000SX, MSO/DPO70000DX, MSO/DPO70000C, DPO7000C, and MSO/DPO5000B Series... -
Page 709: Waveform Display
Oscilloscope reference What do you want to do next? Go to a step-by-step procedure for sequential triggering. Learn about advanced triggers. Waveform display Display overview This instrument includes a flexible, customizable display that lets you control how waveforms appear. The next figure shows how the display features fit into the overall instrument operation. -
Page 710: Display Elements
Oscilloscope reference What do you want to do next? Learn about display elements. Learn about customizable display elements. Go to a step-by-step procedure for displaying waveforms. Display elements The waveform shown below is displayed as part of the user interface (UI) application. Some terms that are useful in discussing the UI follow. - Page 711 Oscilloscope reference Status. Displays the acquisition status, mode, and number of acquisitions; trigger status; date; time; and quick reference to horizontal parameters See the next figure for some ideas on how to manipulate the display elements. Click to toggle between toolbar and menu bar modes and select toolbar extensions. Drag cursors to measure waveforms on screen.
-
Page 712: Customizable Display Elements
Oscilloscope reference Drag the trigger level marker to change the trigger level. What do you want to do next? Learn about acquisition preview. Learn about customizable display elements. Go to a step-by-step procedure for displaying waveforms. Customizable display elements The following lists contains information on customizable display elements and their points of access. Color Palette (Graticule and Waveform): Access these elements through the Display menu Colors command, Display menu Display Palette submenu, or Display Setup control window Colors tab (Disp toolbar button):... - Page 713 Oscilloscope reference ■ On the Temp (Temperature Grading) palette. Areas of the waveform with the highest sample density appear in warmer colors (red shades) and the areas of lowest sample density appear in cooler colors (blue shades). Gray (Monochrome Gray). Displays waveforms in shades of gray. Areas of the waveform with the highest sample density ■...
- Page 714 Oscilloscope reference ■ IRE. Use for NTSC video signals. ■ mV. Use for video signals other than NTSC. Math Colors: Access these elements through the Display menu Colors command or Display Setup control window Colors tab Disp toolbar button): ■ Default.
-
Page 715: Acquisition Preview
Oscilloscope reference Acquisition preview The acquisition preview attempts to show what the next acquisition will look like when the acquisition is delayed due to slow triggers or long acquisition duration, or when the acquisitions have stopped. Acquisition preview recalculates math waveforms, but does not represent changes in trigger levels, trigger modes, or different acquisition modes. -
Page 716: Operations On The Time Base
Oscilloscope reference For channel waveforms, the vertical and horizontal controls that you set also adjust the instrument acquisition parameters. See the following for more information: ■ Vertical Acquisition Window Considerations. ■ Horizontal Acquisition Window Considerations. To change the size of the acquisition waveform and zoomed waveform windows, select the Graticule Size in the Zoom Setup control window. -
Page 717: Using The Multizoom Feature
Oscilloscope reference What do you want to do next? Learn about interpolation. Learn about using the MultiView Zoom feature. Go to a step-by-step procedure for displaying waveforms. Using the MultiZoom feature Use the instrument MultiZoom feature to magnify an acquisition vertically, horizontally, or in both dimensions to let you see the fine detail in your signals without changing the acquisition parameters (sample rate, record length, and so on). - Page 718 Oscilloscope reference High/Low method. The levels that the automatic measurement system derives as the High (top) or Low (bottom) for a waveform influence the fidelity of amplitude and aberration measurements. Select among the modes the instrument provides for determining these levels: Histogram mode sets the values statistically.
-
Page 719: Measurement Variables
Oscilloscope reference Measurement variables By knowing how the instrument makes calculations, you may better understand how to use your instrument and how to interpret your results. The instrument uses a variety of variables in its calculations. These include: High, low. High is the value used as the 100% level in measurements such as fall time and rise time. For example, if you request the 10% to 90% rise time, then the instrument calculates 10% and 90% as percentages with High representing 100%. - Page 720 Oscilloscope reference Other variables. The instrument also measures several values itself that it uses to help calculate measurements. Record Length. is the number of data points in the time base. You set it with the Horizontal menu Record Length item. Start.
- Page 721 Oscilloscope reference MCross calculations. MCross1, MCross2, and MCross3. refer to the first, second, and third MidRef cross times, respectively. The polarity of the crossings does not matter for these variables, but the crossings alternate in polarity; that is, MCross1 could be a positive or negative crossing, but if MCross1 is a positive crossing, MCross2 will be a negative crossing.
-
Page 722: Measurement Algorithms
Oscilloscope reference Measurement algorithms The automated measurements are defined and calculated as follows: Amplitude. Amplitude = High – Low Aarea. The arithmetic area for one waveform. Remember that one waveform is not necessarily equal to one cycle. For cyclical data you may prefer to use the cycle area rather than the arithmetic area. If Start = End then return the (interpolated) value at Start. - Page 723 Oscilloscope reference Cycle mean. Amplitude (voltage) measurement. The mean over one waveform cycle. For non-cyclical data, you might prefer to use the Mean measurement. If StartCycle = EndCycle then return the (interpolated) value at StartCycle. Details of the integration algorithm are given later. Integration Algorithm Cycle RMS.
- Page 724 Oscilloscope reference Extinction dB. Optical measurement. Extinction dB is typically 8 to 12 db. To exceed this range the input may be from nonoptical probes or noncommunication lasers. Extinction dB = 10.0 (log (Extinction Ratio)) Fall time. fall time Timing measurement. The time taken for the falling edge of a pulse to drop from a HighRef value (default = 90%) to a LowRef value (default = 10%).
- Page 725 Oscilloscope reference Low. 0% (lowest) voltage reference value calculated. See High Low Using the min-max measurement technique: Low = Min Maximum. Amplitude (voltage) measurement. The maximum voltage. Typically the most positive peak voltage. Examine all Waveform[ ] samples from Start to End inclusive, and set Max equal to the greatest magnitude Waveform[ ] value found.
- Page 726 Oscilloscope reference Negative overshoot. Amplitude (voltage) measurement. Note that this value should never be negative (unless High or Low are set out-of-range). Negative width. Timing measurement. The distance (time) between MidRef (default = 50%) amplitude points of a negative pulse. If MCross1Polarity = –...
- Page 727 Oscilloscope reference Phase. Timing measurement. The amount of phase shift, expressed in degrees of the target waveform cycle, between the MidRef crossings of two different waveforms. Waveforms measured should be of the same frequency or one waveform should be a harmonic of the other. Phase is a dual waveform measurement;...
- Page 728 Oscilloscope reference Rise time. Timing measurement. Time taken for the leading edge of a pulse to rise from a LowRef value (default = 10%) to a HighRef value (default = 90%). The following figure shows a rising edge with the two crossings necessary to calculate a Rise Time measurement. Searching from Start to End, find the first sample in the measurement zone less than LowRef.
- Page 729 Oscilloscope reference Integration Algorithm. The integration algorithm used by the instrument is as follows: W(t) is the sampled waveform Ŵ(t) is the continuous function obtained by linear interpolation of W(t) A and B are numbers between 0.0 and RecordLength – 1.0 If A and B are integers, then: where s is the sample interval.
-
Page 730: Measurements On Envelope Waveforms
Oscilloscope reference Measurements on envelope waveforms Time measurements on envelope waveforms must be treated differently from time measurements on other waveforms, because envelope waveforms contain so many apparent crossings. Unless otherwise noted, envelope waveforms use either the minima or the maxima (but not both), determined in the following manner: Step through the waveform from Start to End until the sample min and max pair do not straddle MidRef. -
Page 731: Missing Or Out-Of-Range Samples
Oscilloscope reference Missing or out-of-range samples If some samples in the waveform are missing or off-scale, the measurements will linearly interpolate between known samples to make an appropriate guess as to the sample value. Missing samples at the ends of the measurement record will be assumed to have the value of the nearest known sample. -
Page 732: Measurement Errors
Oscilloscope reference Measurement errors The following measurement errors can be generated by the instrument. They may be generated in various situations such as those described below. In general, measurements producing an error will produce nothing. Error Description Unstable These are generic error messages that occur when the measurement system was unable to obtain a correct measurement Measurement system error Zero period... -
Page 733: Histograms
Oscilloscope reference Cursor function Measurements Horizontal cursors measure vertical parameters (amplitude) in volts, watts, or IRE. The cursor readouts are defined as: V1 = Level @ Cursor 1 with respect to its source ground level. V2 = Level @ Cursor 2 with respect to its source ground level. ΔV = Level @ Cursor 2 - Level @ Cursor 1. -
Page 734: Typical Math Waveforms
Oscilloscope reference Typical math waveforms You create math waveforms when you create a math expression. You do so by applying numerical constants, math operators and functions to operands. You can display and manipulate these derived math waveforms much like you can the channel and reference waveforms (see Using Math Waveforms). -
Page 735: Math Waveforms
Oscilloscope reference Math waveforms Once you have acquired waveforms or taken measurements on waveforms, the instrument can mathematically combine them to create a waveform that supports your data-analysis task. For example, you might have a waveform clouded by background noise. You can obtain a cleaner waveform by subtracting the background noise from your original waveform. Or, you can integrate a single waveform into an integral math waveform as shown below. -
Page 736: Math Waveform Differentiation
Oscilloscope reference You create math waveforms to support the analysis of your channel and reference waveforms. By combining and transforming source waveforms and other data into math waveforms, you can derive the data view that your application requires. Create math waveforms that result from: ■... -
Page 737: Math Waveform Sources
Oscilloscope reference Cursor Measurements. You can also use cursors to measure derivative waveforms. Use the steps in Taking Cursor Measurements. When using that procedure, note that the amplitude measurements on a derivative waveform will be in volts per second rather than in volt-seconds as is indicated for the integral waveform measured in the procedure. NOTE. -
Page 738: Math Waveform Expression Syntax
Oscilloscope reference Dependencies. In general, math waveforms that include sources as operands are affected by updates to those sources: Shifts in amplitude or DC level of input sources that cause the source to clip also clip the waveform data supplied to the ■... -
Page 739: Offset Position Scale And Math Waveforms
Oscilloscope reference Go to a step-by-step procedure for creating math waveforms. Go to a step-by step procedure for using math waveforms. Offset position scale and math waveforms The settings that you make for offset, scale, and position affect the math waveform you obtain. Here are some tips for obtaining a good display: ■... -
Page 740: Math Plugins
Math plugins extend the current built-in math system on your instrument. When the TekScope application starts, it scans C: \Users\Public\Tektronix\Plugins\Math and C:\Users\<current user ID>\Tektronix\Plugins\Math for .NET libraries and loads any tagged functions into the math system. For a library to load, it must have the word math, meas or plugin in its name. If a plugin library is placed in one of the folders after the TekScope application has started, the plugin will not be available until the application is restarted. - Page 741 Oscilloscope reference Waveform types. All waveform classes contain a member called SourceName. This is a string that contains the symbol name of the waveform source. If the source is a channel, math or reference waveform, the SourceName will be Ch<x>, Math<n> or Ref<n>, respectively.
- Page 742 Oscilloscope reference Parallel.For(0, vCount, vv => output[vv, hh] = output[vv, hh + 1]; If the output type of a plugin is IWaveformDB, when the plugin is called the output waveform is populated with the values the plugin returned the last time it was called. If this is the first time the plugin was called, all of the values inside the IWaveformDB will be zero (displays as clear).
- Page 743 Oscilloscope reference ISettings: scope settings. You can access information about instrument settings through ISettings. Settings for the math target, as well as the input and output waveforms, are put into the dictionary. However, if the waveform is an intermediate, no setting information is available.
- Page 744 Example plugins. If the Application Developer Kit has been installed on the instrument, example plugins can be found in Microsoft Visual Studio. When you create a new project, choose Visual C#->Tektronix->Math to access the examples. DPO70000SX, MSO/DPO70000DX, MSO/DPO70000C, DPO7000C, and MSO/DPO5000B Series...
- Page 745 Oscilloscope reference Create a plugin. To create a plugin, you need to use either one of our Visual Studio templates or create a new project using the .NET language of your choice. To create a C# plugin from scratch, you first need to create a new, empty C# project. Once you create your project, add references to ScopeSupportBase, TekScriptingEngine, System.Data, System.Data.DataSequence, System.XML and System.Xml.Linq.
-
Page 746: Matlab Custom Functions
The Custom Analysis Interface for use with MATLAB provides two options for writing MATLAB custom analysis functions: a basic function interface and a more advanced class-based interface. Both types are available in demo form on the instrument in C: \Users\Public\Tektronix\Plugins\Math\MATLAB. Using the basic Function interface to create MATLAB functions. The function interface uses a simple signature: function [ output ] = exampleProcessingFunction( firstTime, varargin ) Your function should take two inputs: a Boolean that indicates whether or not this is the first time the function has been called and a variable length array. - Page 747 Oscilloscope reference Using a Class to create MATLAB functions. An dvanced user can create a MATLAB custom analysis function by subclassing instrument.integration.AlgorithmDefinition. The waterfall.m class shows an example of this type of custom analysis function. This is more complex than using a function but allows more control of behavior than the basic function capability. By using a subclass, you can implement custom tear-down behaviors, such as closing plots automatically when an analysis function is no longer being called.
-
Page 748: Spectral Math Waveforms
Oscilloscope reference Spectral math waveforms The math capabilities of the instrument include waveform spectral analysis. This section describes how you can control the analysis intuitively with time domain and frequency domain controls. These controls merge the time domain controls with the frequency domain controls to provide a complete spectral analyzer. -
Page 749: Spectral Math Time Controls
Oscilloscope reference Time controls Gate controls Frequency controls Magnitude controls Phase controls Source Position Center dB, dBm linear, real degrees, radians, group imaginary delay Duration, record length Duration Span Ref level Zero threshold Duration, sample rate Window Resolution bandwidth Ref level offset Phase Unwrap Resolution What do you want to do next? - Page 750 Oscilloscope reference What do you want to do next? Go to a list of all spectral math controls. Learn more about spectral math controls. Go to a step-by-step procedure for defining a spectral math waveform. DPO70000SX, MSO/DPO70000DX, MSO/DPO70000C, DPO7000C, and MSO/DPO5000B Series...
-
Page 751: Spectral Math Gating Controls
Oscilloscope reference Spectral math gating controls Gating determines which portion of the acquired waveform is transformed into the frequency domain. The gate has a position and a width control. The gate position is the time in seconds from the trigger location to the center 50% position of the gate interval (see the next figure). -
Page 752: Spectral Math Frequency Domain Controls
Oscilloscope reference Spectral math frequency domain controls The gated region of the source waveform is transformed into a spectral phase or magnitude waveform. The horizontal units are always hertz. The vertical units depend on whether phase or magnitude is selected. The frequency domain controls for the spectral waveform are span, center, and resolution bandwidth. - Page 753 Oscilloscope reference What do you want to do next? Go to a list of all spectral math controls. Learn more about spectral math controls. Go to a step-by-step procedure for defining a spectral math waveform. DPO70000SX, MSO/DPO70000DX, MSO/DPO70000C, DPO7000C, and MSO/DPO5000B Series...
-
Page 754: Spectral Math Magnitude Controls
Oscilloscope reference Spectral math magnitude controls Vertical units can be either linear or log. You can select from the following choices by clicking the Math menu button. Then select the Spectral Analysis Setup command. Mag tab Select the desired scale type, Linear, dB, or dBm: Linear. - Page 755 Oscilloscope reference Reference level offset Reference level offset This changes the value of Ref in the equation for dB shown above. Unlike the Reference Level control, this control actually changes the output data values in the spectrum. Zero dB is shown on the display screen by the marker associated with the spectral waveform.
-
Page 756: Spectral Math Phase Controls
Oscilloscope reference Spectral math phase controls Select the phase controls You can set the vertical units to Degrees, Radians, or Group Delay in seconds. To do this, click the Math toolbar button, click Spectral Analysis Setup, and select the Phase tab. Then select the desired scale type from Degrees, Radians, or Group Delay. Phase reference position Phase is a relative measurement that must have a time domain reference point. - Page 757 Oscilloscope reference Group delay When the phase spectrum is a continuous function of frequency, group delay may be computed. This is true of impulse response testing where an impulse is fed into the system, and the spectrum of the response of the system output is computed. Group delay measures how well a system passes a signal in terms of phase distortion.
- Page 758 Oscilloscope reference There are eight different spectral analyzer windows: Rectangular ■ Gaussian ■ Hamming ■ Blackman-Harris ■ Hanning ■ Flattop2 ■ ■ Kaiser-Bessel Tek Exponential ■ Your choice of window function will depend on the input source characteristics that you want to observe and the characteristics of the window function.
- Page 759 Oscilloscope reference Scallop loss This is the magnitude error of the spectral analyzer when the frequency of the observed signal is exactly half way between two frequency samples of the spectrum when the interpolation ratio due to zero fill of the FFT is one. When zero fill is in effect, scallop loss is essentially eliminated because of the interpolation in the frequency domain due to zero fill.
-
Page 760: Spectral Analyzer Window Types
Oscilloscope reference Spectral analyzer window types In the time domain, a window is a bell-shaped function equal in length to the gate duration. For most windows, this function tapers to zero at both ends of the gate region. Before computation of the spectral transformation, the window is multiplied, sample by sample, times the input data in the gated region. - Page 761 Oscilloscope reference Window 3 dB BW in bins Scallop loss Nearest side lobe Zero phase Coefficients reference Rectangular 0.89 3.96 dB -13 dB Hamming 1.78 dB -43 dB 0.543478, 0.456522 Hanning 1.44 1.42 dB -32 dB 0.5, 0.5 Kaiser-Bessel 1.72 1.02 dB -69 dB 0.40243, 0.49804,...
- Page 762 Oscilloscope reference Nearest side lobe This is the difference in magnitude between the spectral lobe peak in the spectrum and the next side lobe that occurs due to energy leakage. Different windows have different leakage characteristics. The more narrow the resolution bandwidth of the window the more leakage in the spectrum.
-
Page 763: Flattop2 Window
Oscilloscope reference Flattop2 window This window has the lowest scallop loss of any of the windows. It also has a wider resolution bandwidth but lower side lobe attenuation. Also, it is unique because the time domain shape has negative values. NOTE. -
Page 764: Gaussian Window
Oscilloscope reference Gaussian window This is the default window function (see the next figure). It is unique in that the time-domain shape of an exponential Gaussian function transforms into a Gaussian exponential shape in the frequency domain. NOTE. This window provides optimal localization in both the time and the frequency domain What do you want to do next? Learn about using spectral analyzer windows. -
Page 765: Hamming Window
Oscilloscope reference Hamming window This window is unique in that the time domain shape does not taper all the way to zero at the ends. This makes it a good choice if you wanted to process the real and imaginary parts of the spectrum off line and inverse transform it back to the time domain. Because the data does not taper to zero, you could remove the effect of the window function from the result. - Page 766 Oscilloscope reference Hanning window Kaiser-Bessel window DPO70000SX, MSO/DPO70000DX, MSO/DPO70000C, DPO7000C, and MSO/DPO5000B Series...
-
Page 767: Rectangular Window
Oscilloscope reference Blackman-Harris window What do you want to do next? Learn about using spectral analyzer windows. Rectangular window This window is equal to unity (see the next figure). This means the data samples in the gate are not modified before input to the spectral analyzer. -
Page 768: Tek-Exponential Window
Oscilloscope reference What do you want to do next? Learn about using spectral analyzer windows. Tek-Exponential window In the time domain, it is not a symmetrical bell shape as is the case with the other windows. Instead, it is exponential with a peak at the 20% position of the time domain gate. -
Page 769: Recognizing Aliasing
Oscilloscope reference What do you want to do next? Learn about using spectral analyzer windows. Recognizing aliasing Aliasing occurs when the input frequency of a signal is greater than one half of the sampling frequency (the sample rate). Set the sample rate high enough so that the signals in the spectrum appear at their correct frequency as opposed to a lower aliased frequency value. -
Page 770: Mask Testing
Oscilloscope reference If you have a variable-frequency signal source, another way to observe aliasing is to adjust the frequency slowly while watching the spectral display. If some of the harmonics are aliased, you will see the harmonics decreasing in frequency when they should be increasing or vice versa. -
Page 771: Serial Mask Testing With Mask Testing
Oscilloscope reference Standards and bandwidth. When the instrument system bandwidth (which includes the instrument, attached probes, and/or cabling) falls into the range of 1.5 to 1.8 (0.8 for optical signals) times the data signal bit rate, the third harmonic of the data signal is significantly attenuated. -
Page 772: Levels Used In Taking Eye Measurements
Oscilloscope reference ■ Automatic measurements on communications signals NOTE. If a standard listed in this manual is not available on your instrument, it is because the configuration or bandwidth of your instrument cannot test that standard. Although this oscilloscope is not a calibrated optical reference receiver, you can use it with mask testing to evaluate general optical signal characteristics and wave shape, using an external O/ E converter. -
Page 773: Output
Oscilloscope reference T1 values. The T1 values are vertical and horizontal values associated with the left-most crossing point. These areas are used to establish the following values: TCross Mean. This is the horizontal mean of the left-crossing point at TCross ■... -
Page 774: Saving And Recalling Waveforms
Oscilloscope reference A few other things to remember when saving and recalling setups: ■ Recalling a setup replaces the current setup with the recalled setup. If you do not want to lose your current setup, save the setup file for later recall. ■... -
Page 775: Miscellaneous
Oscilloscope reference File formats. To make saved files more useful, select a file format usable by your analysis tools: BMP. This creates (.bmp) files in a bitmap file format usable by many graphic programs. (Available for screen captures.) ■ JPEG. This creates (.jpg) files in a compressed image format usable by many graphic programs. (Available for screen ■... -
Page 776: Active Probes
Oscilloscope reference Active probes Active voltage probes often contain preamplifiers that provide high resistance and low capacitance at the probe tip. Some active voltage probes contain differential amplifiers that provide high Common Mode Rejection Ratio (CMRR). Active current probes often contain Hall-effect sensors that extend the probe bandwidth down to DC. Many active probes, especially high frequency probes, can drive a 50 Ω... -
Page 777: Can Bit Rate
Oscilloscope reference ■ When set to Sequential, the B-Event value is sequentially incremented after each acquisition completes, until the Start Event reaches the End Event. At this point the B-Event value is set to Start Event value again. ■ When set to Random, the B-Event value is set to a random value between the Start Event and End Event values for each set of Advance After acquisitions. -
Page 778: Channels Selector
Oscilloscope reference Channels selector Specify the Channel <1 – 4> and waveform type (Channel, Math, or Reference) for oscilloscope operations. Click Ch and specify a channel to dedicate the controls for use with an input on the front panel. ■ ■... -
Page 779: Set Up Communication Trigger Coding
Oscilloscope reference AMI trigger standards DS2 Rate Coax 6.312 Mb/s DS3 44.736 Mb/s E1 2.048 Mb/s E2 8.448 Mb/s E3 34.368 Mb/s STS–1 51.84 Mb/s Custom DS3 44.736 Mb/s STS–1 51.84 Mb/s Custom DS2 6.312 Mb/s DS2 Rate Sym 6.312 Mb/s Custom DS1 1.544 Mb/s DS1C 3.152 Mb/s... -
Page 780: Select The Comm Trigger Pulse Form
Oscilloscope reference Behavior. The coding format determines which standards are available as well as other parameters, such as trigger threshold and pulse form. The standard selected determines the bit rate. Changing the bit rate causes the standard to change to your own customized standard. -
Page 781: Set The Comm Trigger Source
Oscilloscope reference Set the comm trigger source ■ Use the Source drop-down list to select the channel for the Comm trigger source. Use the Type drop-down list to select the clock source for the trigger. ■ ■ Use the Polarity drop-down list to select the polarity of the clock source. Control window handle Inserts the text COS( into the math expression. -
Page 782: Customize Color Palettes
Oscilloscope reference Overview. Use these controls to define the source for both Cursor 1 and Cursor 2 for any cursor type. To use. Click the Source drop-down list to select the measurement source for the cursor. Click in a Position entry box and use a multipurpose knob to adjust the position of the cursor. Behavior. -
Page 783: Cycle Mean
Oscilloscope reference Cycle mean This voltage measurement is the arithmetic mean over the first cycle in the waveform or the first cycle in the gated region. Cycle RMS This voltage measurement is the true Root Mean Square voltage over the first cycle in the waveform or the first cycle in the gated region. -
Page 784: Select Digital Input Icapture
Set up trigger path alignment NOTE. This online help supports many oscilloscope models from Tektronix. This feature is only available on some models. The exact trigger location is used in alignment process to avoid jitter. To minimize logic trigger errors, trigger adjustment aligns the 16 digital probe trigger paths (excluding the clock) using a specified analog path as a reference source to provide the best trigger alignment possible. -
Page 785: Set Logic Properties
Oscilloscope reference Set logic properties NOTE. Logic Properties option is available only on MSO5000B and MSO70000C/DX Series instruments and DPO5000B Series instruments with option MSOE installed, and DPO70000DX instruments with option MSOU installed. From the Vertical menu, select Vertical Setup. From the Math menu, select Math Setup. To use. -
Page 786: Select The Display Style
Oscilloscope reference To use. Click the Threshold entry box for the desired channel and use the keypad to enter a value or use the multipurpose knobs to ■ select a voltage level. Click the OK button. ■ What do you want to do next? Learn about the digital channel setup. -
Page 787: Select The Math Color
Oscilloscope reference Behavior. Vectors displays waveforms with lines drawn between record points. ■ Dots displays waveform record points as dots on the screen. Dots are useful when you want to display multivalued ■ waveforms such as eye diagrams. Inten Samp (Intensified Samples) shows only the actual samples. When you use intensified samples, you identify the actual ■... -
Page 788: Select The Reference Color
Oscilloscope reference Select the reference color From the Display menu, select Colors, or open the Colors tab in the Display control window. To use. Click one of the buttons to select the color scheme for reference waveforms. Click Default to use the default system color for the selected reference waveform. ■... -
Page 789: Duty Cycle Distortion
Oscilloscope reference Behavior. The trigger level markers indicate the voltage level where the trigger or threshold levels of the active waveform occur: The Short trigger level marker displays a short arrow on the side of the graticule by the active waveform. ■... -
Page 790: Set Up E-Mail On Trigger
Oscilloscope reference Behavior. The characters are entered into the math expression one at a time. What do you want to do next? Learn about the Math Setup controls. Learn about averaging math waveforms. Set up e-mail on trigger Click Setup to access the E-mail on Event control window where you configure sending e-mail on events. Enhanced bandwidth indicator. -
Page 791: Eye Top
Oscilloscope reference Eye top Eye Top is the top value used in the extinction ratio measurements. Eye Top = pTopMean Eye width Eye width is the measurement of eye width in seconds. Eye Width = (tCross2Mean –3 × pTopSigma) – (tCross1Mean + *tCross1Sigma) Set up e-mail configuration From the Utilities menu, highlight E-mail on Event;... - Page 792 Oscilloscope reference Overview. Use this dialog box to enter the address of the mail server to use when sending E-mail on events. You must have a server entered in the SMTP Server Address box for your instrument to send e-mail. You can customize your e-mail by selecting the number of attempts to make, entering a From address, setting the time out length, entering a login and password if necessary, and entering a host name.
-
Page 793: Send An E-Mail On Trigger
Oscilloscope reference To use. Enter the SMTP server address. ■ Click OK if you want to accept the default values. ■ Click More>> if you want to customize your e-mail. ■ Enter the appropriate information in each box that you need to change from the default. ■... -
Page 794: Force A Trigger
This instrument offers several tools you can install to support data export for use with data-analysis tools. These tools ship with the Tektronix instrument that this online help supports. You can find them on the product software DVD that ships with this instrument. You can find the Readme file on the CD-ROM that you use to install the analysis and connectivity tools. -
Page 795: High
Oscilloscope reference ■ When working with reference waveforms, if one or more reference waveforms are used as part of a math waveform, the number of frames in the math waveform is the smallest of all source waveforms (reference, math, or channel waveforms). ■... -
Page 796: Histogram Box Limits - Vertical
Oscilloscope reference Enter limits: Histogram box limits - vertical Select a mode: Specify the adjustment: Enter limits: DPO70000SX, MSO/DPO70000DX, MSO/DPO70000C, DPO7000C, and MSO/DPO5000B Series... -
Page 797: Histogram Box Location - Horizontal
Oscilloscope reference Histogram box location - horizontal Select a mode: Specify the adjustment: Enter limits: Histogram box location - vertical Select a mode: Specify the adjustment: DPO70000SX, MSO/DPO70000DX, MSO/DPO70000C, DPO7000C, and MSO/DPO5000B Series... -
Page 798: Histogram Max
Oscilloscope reference Enter limits: Histogram max Displays the voltage of the highest nonzero bin in vertical histograms or the time of the right-most nonzero bin in the horizontal histograms. Histogram mean Measures the average of all acquired points within or on the histogram box. Histogram min Displays the voltage of the lowest nonzero bin in vertical histograms or the time of the left-most nonzero bin in the horizontal histograms. -
Page 799: Mean Plus Or Minus 3 Stddev
Oscilloscope reference Mean plus or minus 3 StdDev The percentage of points in the histogram that are within three standard deviations of the histogram mean. Minimum This voltage measurement is the minimum amplitude. It is typically the most negative peak voltage and is measured over the entire waveform or gated region. -
Page 800: Horizontal Position-Scale Control Window (Delay Mode)
Oscilloscope reference Horizontal Position-Scale control window (Delay mode) From the Horiz /Acq menu, select Position/Scale. Overview. Use the Horizontal Position/Scale control window to set the horizontal delay and the horizontal scale of the displayed waveforms when the horizontal delay is on. To use. -
Page 801: Horizontal Reference Marker
Oscilloscope reference To use. Click in the Scale entry box and use the multipurpose knob or keypad to change the setting. ■ Behavior. The Scale control scales all live displayed waveforms at the same time. The scale units depend on the waveform type. In most cases the horizontal units will be time. However, the horizontal units can also be frequency. -
Page 802: Set The Horizontal Scale When Delay Is On
Oscilloscope reference Behavior. The horizontal delay feature is useful when you want to acquire waveform details that are separated from the trigger event by a significant interval of time. For example, you can trigger the instrument on a sync pulse that occurs once every 10 ms, and then look at the high-speed characteristics that occur 6 ms after the pulse. - Page 803 Oscilloscope reference To use. If you use Average or Envelope mode, select the number of waveforms for that mode using the multipurpose knob. ■ If you use Waveform Database mode, use the multipurpose knob to select the number of samples. ■...
- Page 804 Oscilloscope reference Behavior. A single waveform data point can be made up of several sequentially acquired data points. The waveform data points can also be created from a composite of sampled data taken from multiple acquisitions. The acquisition modes determine how the waveform data points are produced from the sampled data.
- Page 805 Oscilloscope reference Average. This mode acquires and displays a waveform record that is the average result of several acquisitions. This mode reduces random noise. Use the multipurpose knobs to specify the number of waveforms that you want to average. WfmDB. Waveform Database mode acquires and displays a waveform that is the accumulation of several acquisitions. In addition to time and amplitude, the waveform displays a count of the number of times a specific sample point has been acquired.
-
Page 806: Set Horizontal Delay And Horizontal Position
Oscilloscope reference Set horizontal delay and horizontal position From the Horiz /Acq menu, select Horizontal/Acquisition Setup; then open the Horizontal tab. Overview. Use this control to select the amount of data that appears before the trigger event. To use. Click Delay Mode to toggle Delay Mode Off, and then click in the Position entry box. Use a multipurpose knob or the front- ■... -
Page 807: Horizontal Control Window Readouts
Oscilloscope reference Horizontal control window readouts From the Horiz /Acq menu, select Horizontal/Acquisition Setup; then open the Horizontal tab. Overview. Use the horizontal readouts, similar to those shown below, to obtain a quick overview of the horizontal settings. NOTE. You cannot change the Horizontal controls directly from the readouts. To use. - Page 808 Oscilloscope reference To use. Click in a Horizontal Controls entry box to map it to one of the multipurpose knobs; then use the knob to change the value. You can also use the pop-up keypad to enter a value. Horizontal controls Use this control to set the sample rate for the waveform record.
-
Page 809: I2C Addressing Mode
MATLAB ■ Other software products may be compatible but have not been tested by Tektronix. If the instrument malfunctions after you install software, uninstall the software and then reinstall the instrument application to restore proper operation. Before installing other desktop applications, exit the instrument application. To do this, click Exit on the File menu. -
Page 810: Jitter 6 Sigma
Oscilloscope reference Jitter 6 sigma Jitter 6 sigma is six times the RMS value of the edge jitter in the current horizontal units. Jitter 6 sigma = 6 × (JitterRMS) Jitter peak-to-peak Jitter p-p is the peak-to-peak value for the edge jitter in the current horizontal units. Jitter PP = TCross1PP Jitter root mean square Jitter RMS is the RMS value of the edge jitter in the current horizontal units. -
Page 811: Logic Pattern And State Pattern Editor (Bus Tab)
Oscilloscope reference Logic pattern and state pattern editor (bus tab) Use the controls to set up the Logic Pattern or the Logic State trigger pattern for the instrument to use to detect a bus value. The maximum pattern size (number of bits) for Logic Pattern or Logic State trigger is 20 bits. The display pattern format is binary, hexadecimal, ASCII, or decimal. -
Page 812: Logic Pattern And State Pattern Editor (Digital Tab)
Oscilloscope reference Logic pattern and state pattern editor (digital tab) Use the controls to set up the Logic Pattern or the Logic State trigger pattern of the channels the instrument uses as logic waveforms to detect a bus value. What do you want to do next? Learn how to define a pattern for the instrument to use to detect a bus value. -
Page 813: Logic Pattern Format
Logic pattern format NOTE. This online help file supports many oscilloscope models from Tektronix. This feature is only available on some models. Select the Logic Pattern or Logic State trigger type. You can change the format of the pattern after you define a logic pattern. -
Page 814: Logic State Trigger Criteria
Oscilloscope reference Logic state trigger criteria Use the Trigger When Pattern selection to determine when the instrument should trigger. Select True to trigger the instrument when the logic patterns go true. ■ ■ Select False to trigger the instrument when the logic patterns go false. The low level measurement is the value used as 0% whenever high reference, mid reference, or low reference values are needed, such as in fall time or rise time measurements. -
Page 815: Mask Autoset Horizontal Controls
Oscilloscope reference Mask autoset horizontal controls From the Mask menu, highlight Mask Configure; then select Autoset. From the Mask Setup control window, click the Autoset Config button. Overview. Use these controls to choose whether to have autoset affect the horizontal scale or position. To use. -
Page 816: Control The Mask Autoset Trigger Level
Oscilloscope reference Behavior. If Auto is selected, an autoset is done automatically after a standard mask is selected. The purpose of the manual autoset mode is to adjust everything that can be done without having any waveform data. What do you want to do next? Learn about trigger level autoset. -
Page 817: Mask Hit Count
Math arbitrary filters This section describes the library of FIR filters that are available for use under the ArbFilt <x>( < fsource waveform>) function in the Tektronix oscilloscope waveform math section. The user may find this under the path: C:\Users\[Username] . - Page 818 Oscilloscope reference Low pass filters. The following graphs show the available set of low pass filters. Their normalized frequency response is shown from 0 to ½ the sample rate. These filters will operate at any sample rate with cutoff frequency scaled as shown below on the graphs.
- Page 819 Oscilloscope reference High pass filters. The following graphs show the available set of high pass filters. Their normalized frequency response is shown from 0 to ½ the sample rate. These filters will operate at any sample rate with cutoff frequency scaled as shown below on the graphs.
- Page 820 Oscilloscope reference Band pass filters. Each filter has a bandwidth of 0.05 times the sample rate. They will operate at any sample rate. The available center frequencies are 0.05, 0.10, 0.15, 0.20, 0.25, 0.30, 0.35, 0.40, 0.45. Stop band attenuation is approximately -60 dB and pass band ripple is around 1dB.
- Page 821 Oscilloscope reference Band stop filters. Each filter has a bandwidth of 0.1 times the sample rate. They will operate at any sample rate. The available center frequencies are 0.10, 0.15, 0.20, 0.25, 0.30, 0.35, and 0.40. Stop band attenuation is approximately – 110 dB, however, the noise floor of the oscilloscope will not allow for that depth.
- Page 822 Oscilloscope reference Smoothing filters. These are sometimes called box car filters. They simply average together adjacent samples along the time record. The filter coefficients for these filters are all equal to 1/ M where M is the length of the filter. The name of the files indicates the length of the smoothing filter.
- Page 823 Oscilloscope reference Hilbert transform filter. The ideal Hilbert transform filter has a gain of one at all frequencies and shifts the phase of all frequencies by 90 degrees. This type of filter is one of the types that may be specified in the Remez Exchange algorithm. This filter departs from its desired behavior in the frequency range of 0 to 0.025 times the sample rate and also in the range of about 0.475 to 0.5 times the sample rate.
- Page 824 Figure 30: Frequency response of the differentiator filter This section describes the ASCII file format for storing filters for use in the Tektronix oscilloscope waveform math section. A filter menu function allows the user to specify a disk file name containing the filter. A single file format allows the user to specify a different set of coefficients for each sample rate that the filter operates at.
-
Page 825: Enter A Math Expression
Oscilloscope reference An example of a filter that is setup to operate at a specific sample rate is given as follows. This is the contents of a file named 200MHz_mult_sample_rates.flt that is included in the library directory on the oscilloscope. #This is a 4th order Bessel Thompsen low pass filter. -
Page 826: Set The Math Display And Vertical Controls
Oscilloscope reference Set the math display and vertical controls From the Math menu, select Math Setup. To use. Click a Math <1-4> tab to identify a math waveform. ■ Click in the Math <1-4> = data entry field to enter the math expression, or select a predefined expression. - Page 827 Oscilloscope reference To use. Use the Histog tab to select automatic histogram measurements. Select a source with the Channels Selector. Click a Measurements button to add a Histogram measurement to the Measure list: Histogram measurements WfmCt Median Pk-Pk U+ /-1S Hits in Box Mean U+ /-2S...
- Page 828 Oscilloscope reference Behavior. Measurements are updated approximately three times a second, or less for long record lengths. Measurements are calculated after each acquisition. You can display up to eight automatic measurements. TIP. Select the individual measurements directly from the Measure menu Histogram Measurements submenu. What do you want to do next? Learn about taking amplitude measurements.
-
Page 829: Set Up The Measurement List
Oscilloscope reference Mean±2 StdDev The percentage of points in the histogram that are within two standard deviations of the histogram mean. Mean±3 StdDev The percentage of points in the histogram that are within three standard deviations of the histogram mean. Set up the measurement list From the Measure menu, select Measurement Setup. -
Page 830: Minimum
Oscilloscope reference Minimum This voltage measurement is the minimum amplitude. It is typically the most negative peak voltage and is measured over the entire waveform or gated region. Natural antilog Inserts the text EXP( into the math expression. Enter an argument to the function. The natural antilog function raises to the power of the argument. -
Page 831: Nyquist Frequency
Oscilloscope reference Nyquist frequency The highest frequency that any digital oscilloscope can measure without errors is one-half of the sample rate or frequency. This frequency is called the Nyquist frequency. The FFT waveform displays the input signal frequency components from DC (0 Hz) to the Nyquist frequency. Set up zoom AutoScroll From the Vertical or Horiz /Acq menu, select Zoom Controls;... -
Page 832: Set Display Persistence
Oscilloscope reference Behavior. The cursor units depend on the cursor type. The cursor position readouts appear on the display graticule. When using the IRE graticule style, amplitude cursor readouts are shown in IRE units. Cursor position does not change if the cursor source changes or if the waveform is repositioned. TIP. -
Page 833: Set The Fastframe Analyze Tab Controls
Oscilloscope reference Set the FastFrame analyze tab controls From the Horiz /Acq menu, select FastFrame; then open the Analyze tab. Overview. Use the FastFrame Control Window Analyze tab to select the viewing frame (Selected Frame) when FastFrame is turned on. You can also select the reference frame. To use. -
Page 834: Set Up Fastframe Setup Tab Controls
Oscilloscope reference Set up FastFrame setup tab controls From the Horiz /Acq menu, select FastFrame Setup; then open the Setup tab. Overview. Use the FastFrame Control Window Setup tab to select the event Duration and Frame Size when FastFrame is turned To use. -
Page 835: Set Up Fastframe View Tab Controls
Oscilloscope reference Set up FastFrame view tab controls From the Horiz /Acq menu, select FastFrame; then open the View tab. Overview. Use the FastFrame Control Window View tab to specify how to view frames when FastFrame is turned On. To use. Select the Source channel from the drop-down list, and then use the multipurpose knob to identify the Selected Frame. -
Page 836: Select Waveform Save Options
Oscilloscope reference Behavior. The Selected Frame displays the frame that you want to view. You can use the MultiView Zoom features of the instrument to magnify the waveform of interest. The Selected Frame can use any Channel, Math, or Reference waveform as the source waveform. - Page 837 Oscilloscope reference Overview. Use the Waveform Save Options dialog box to set the parameters for the waveform you want to save. DPO70000SX, MSO/DPO70000DX, MSO/DPO70000C, DPO7000C, and MSO/DPO5000B Series...
-
Page 838: Csv Text Format
Learn more about CSV text format. CSV text format In the Tektronix oscilloscope, you can save the waveform data generated in CSV format. You can import this waveform data into an Microsoft Excel spreadsheet for analysis. The waveform data occupies five columns in the spreadsheet. -
Page 839: Set Mask Test Controls
Oscilloscope reference The first column is the name of the parameter (such as Record Length, Sample Interval, Trigger Point, and Trigger Time), the second column is the value of the parameter, the third column is the unit associated with each of the parameters, the fourth column is the time of the waveform sample relative to the trigger point, and the fifth column is the value of the sampled waveform that was converted from the oscilloscope's internal digitizing levels. -
Page 840: Set Up A Delay Measurement
Oscilloscope reference Set up a delay measurement From the Measure menu highlight Time; then select Delay from the submenu, or open the Time tab in the Measurement Setup control window and click the Delay button under Measurements. Overview. Use the Delay Measurement control window to set up the instrument to measure the delay between two waveforms. To use. -
Page 841: Set Up A Phase Measurement
Oscilloscope reference Behavior. This timing measurement is the time between the mid reference crossing of two different waveforms, or the gated region of the waveforms. The graphic in the control window shows the points on the waveforms from which the delay measurement will be taken. The graphic is updated each time you change the control settings. - Page 842 Oscilloscope reference Overview. Use the Phase Measurement Setup control window to set up the instrument to take phase measurements. To use. Use the Channels Selector to select the target and reference source waveforms. Then use the Mid Reference control to specify the voltage reference point in the waveform. Click OK to add the measurement to the measurement list or click to cancel the measurement and return to the Measurement Setup control window.
-
Page 843: Myscope Controls
Oscilloscope reference MyScope controls Click one of links below to access detailed information on the controls in each category: ■ File ■ Edit ■ Vertical ■ Horizontal ■ Trigger ■ Display ■ Cursors ■ Measure ■ Mask ■ Math ■ Utilities NOTE. -
Page 844: Select The Graticule Size
Click OK to return to the Save As dialog box, where you can assign your own file name and save the time stamp to the specified folder. By default, the file is saved to the folder. C:\Users\[Username]\Tektronix\TekScope\data Behavior. The time stamp table data is saved as a .txt file. Select the graticule size From the Vertical or Horiz/Acq menus, highlight Zoom Graticule Size;... -
Page 845: Offset And Clipping
Oscilloscope reference To use. The correct input termination is set automatically when you attach a probe with a TekProbe or TekVPI interface. For other ■ probes, you must set the input termination manually. Select the input coupling for the signal from the attached probe to the instrument. ■... -
Page 846: The On-Screen Multiview Zoom Menu
Oscilloscope reference The On-Screen MultiView zoom menu Peak to peak This voltage measurement is the absolute difference between the maximum and minimum amplitude in the entire waveform or gated region. Period This measurement is the time required to complete the first cycle in a waveform or gated region. Period is the reciprocal of frequency and is measured in seconds. -
Page 847: Positive Overshoot
Oscilloscope reference Positive overshoot This voltage measurement is measured over the entire waveform or gated region. Positive Overshoot = (Maximum – High) × Amplitude × 100% Positive width This timing measurement is the distance (time) between the mid reference (default 50%) amplitude points of a positive pulse. The measurement is made on the first pulse in the waveform or gated region. -
Page 848: Probe Compensation
Oscilloscope reference Probe compensation Probe compensation adjustment Probe compensation output Use the Probe Compensation output to compensate or deskew passive or active voltage probes. Quality factor Quality factor is the ratio of eye size to noise. Quality Factor = (PTopmean – PBasemean)/(PTopsigma + PBasesigma) Recall a template waveform Use this procedure to recall a template waveform to a reference location. -
Page 849: Recall A Mask
In the Recall dialog box, click User Mask; then select the mask you want to recall. Click Recall to recall the mask. NOTE. The default folder for saving masks is C:\Users\[Username]\Tektronix\TekScope\Masks. If you saved masks in a different folder, click the Look in drop-down list to find the folder where your masks are saved. - Page 850 Oscilloscope reference To use. Select the mode that works best for your application. Horizontal mode Automatic. Use this mode to set the Scale and Sample Rate; the record length is a dependent variable. If the current time-per-division scale has a record length equal to the record length limit, changing the time-per-division to a larger value will decrease the sample rate to the next available setting.
-
Page 851: Reference Point
Oscilloscope reference Behavior. Sample rate, scale, and record length are interactive in all modes. If you increase the scale, the sample rate must decrease if either the maximum record length or the record length limit you set is reached. Automatic and Constant Sample Rate modes are identical, with the exception that in Constant Sample Rate mode the user cannot set the record length limit. -
Page 852: Select The Rs-232 Data Parity
Click Save to save the mask. The default folder for saving masks is C:\Users\[Username]\Tektronix . If you want to save the mask in a different folder, click the Save in drop-down list, and then click a \TekScope\Masks folder to select it. -
Page 853: Selecting A Spectral Window
Oscilloscope reference Selecting a spectral window A spectral window determines what the filter shape of the spectral analyzer will be in the frequency domain. It may be described by a mathematical function that is multiplied point-by-point times the input data to the spectral analyzer. The following spectral windows are available with the instrument: ■... -
Page 854: Selected Waveform Versus Deselected Waveform
Oscilloscope reference Window attributes. In the time domain, windows are typically bell shaped and go to zero at the ends of the record. For cases where you may be ■ doing impulse response testing, the impulse should be centered at the zero phase reference point (for most windows, this is the 50% position of the gate and 20% for the Tek Exponential window). -
Page 855: Sequence Triggering (Horizontal Delay On)
Oscilloscope reference Sequence triggering (horizontal delay on) From the Trig menu, select A - B Trigger Sequence; then open the A -> B Seq tab. Overview. Select the A-B Seq tab to use the A Event (main) trigger with the B Event trigger to capture complex data. For information on the controls, click the buttons. -
Page 856: Change The Serial Bit Rate
Oscilloscope reference Behavior. Select A - B Trigger Sequence to use the A Event (main) trigger with the B Event trigger to capture complex data. The A Event trigger arms the trigger system. The instrument then triggers on the B Event trigger defined by events or time. You can also set up the instrument to delay the B Event Trigger by a specified time period by turning Horizontal Delay Mode on. -
Page 857: Select The Serial Data Format
Oscilloscope reference Select the serial data format From the Trig menu, Select Serial Pattern Setup. To use. In the Format drop-down list, select the data format, Binary or Hex, depending on how you want to view the data. ■ Select the serial data source From the Trig menu, select Serial Pattern Setup. -
Page 858: Define The Serial Trigger On Pattern
Oscilloscope reference To use. Select either the Binary or Hex format option. Use the editor controls to define the pattern to trigger on: Use the alpha - numeric buttons to insert a character in the text box. ■ Click the Home button to place the cursor at the right most position of the text box. ■... -
Page 859: Set Up Fastframe Operation
Oscilloscope reference To use. Use these controls to define a NRZ pattern for the instrument to trigger on. Pattern In the Format drop-down list box, select Binary or Hex. Click the Edit button and use the Serial Pattern Editor to define the pattern. Click Enter. -
Page 860: Select The Data Source Channel
Oscilloscope reference Select the data source channel Use the Source drop-down list to select the input channel that is connected to the data signal. Set the data threshold level To set the data threshold voltage level: Click in the Data Level entry box. Use the multipurpose knob to set the data voltage level. - Page 861 Oscilloscope reference To use. Use these controls to insert spectral analysis functions into the math expression. Click one of the buttons to insert a function into the math expression. Magnitude Phase Real Imaginary Average Use the Channels Selector to select one of the input channel waveforms to create the Math waveform. Click Avgs to open the Adjust Math Parameters control window.
-
Page 862: Spectral Tracking
Oscilloscope reference Spectral tracking From the Math menu, select Advanced Spectral; then open the Tracking tab. Use these controls to lock two math waveforms together. This is useful when you want to generate both a magnitude waveform and a phase waveform from the same source. When you lock the spectral controls together, any changes you make to one math waveform are also made to the other math waveform. - Page 863 Oscilloscope reference Set the magnitude scale. Use these controls to specify the vertical scale for magnitude waveforms. Click one of the Scale buttons to specify the vertical units as linear (V, A, W), dBm (1mW into 50 Ω), or dB (logarithmic). ■...
-
Page 864: Set The Spectral Vertical Controls
Oscilloscope reference Set the Linear Scale. Click in an entry box and use a multipurpose knob to specify the position and scale for a linear display. What do you want to do next? Learn about locking math waveforms together. Learn about the Math Setup controls. Set the spectral vertical controls From the Math menu, select Basic Spectral or click Basic in the Math Setup control window. -
Page 865: Spi Bus Trigger Polarity
Oscilloscope reference Behavior. The reference level offset is used to calculate the log magnitude in dB. Adjusting the reference level positions the waveform with respect to the top of the screen but does not change the position of the waveform with respect to the ground reference marker. -
Page 866: Set The Time-Out Value
Oscilloscope reference Set the Time-Out value The time-out value determines when the instrument will trigger. Click in the Timer entry box. Use the multipurpose knob to set the time-out value. Set the upper and lower threshold levels for transition time Use the upper and lower threshold levels to measure the transition time as shown in the trigger graphic. -
Page 867: Trigger Holdoff (Random)
Oscilloscope reference After a trigger event, the instrument will not accept another trigger event until after the holdoff value is exceeded. Holdoff is usually specified in units of time, but other units may be used. Trigger holdoff (Random) When Trigger Holdoff is set to Random, the instrument delays the trigger a random amount of time between triggers. This means that successive acquisitions are unrelated to the previous trigger signal. -
Page 868: Set The Trigger Qualification
Set the trigger occurs and qualification NOTE. This online help supports many oscilloscope models from Tektronix. This feature is only available on some models. For the supported instruments, use the controls to set up the Occurs And pattern for the instrument to qualify the following triggers: Glitch, Runt, Setup/Hold, Timeout, Transition, Width, and Window. -
Page 869: Hf Filtering
HF filtering NOTE. This online help supports many oscilloscope models from Tektronix. This feature is only available on some models. Use the HF filter to extend the range of the Glitch/Pulse Width/Time-Out Timers to work with digital data rates above 4 Gbps. The timers require that the minimum reset time be ≥... -
Page 870: Set The Trigger Reset Conditions
Oscilloscope reference When using Envelope with Edge trigger on a signal as shown, positive polarity triggers on the leading edge of the burst, while negative polarity triggers on the trailing edge of the burst. Polarity changes have similar effects on the other trigger types where the Envelop Detector is available. -
Page 871: Trigger Summary
Oscilloscope reference Figure 33: If your instrument has digital channels and, in the Vertical menu you selected an iCapture signal, trigger on a the iCapture channel by selecting the channel. Trigger summary In the upper-right corner of the setup window, the trigger summary provides a one-line summary of the trigger setups. Use this summary to get an overview of the trigger setups without having to look through all of the trigger tabs. -
Page 872: Using Fastframe Acquisitions
Oscilloscope reference Using FastFrame acquisitions Consider the following operating characteristics when using FastFrame : You can push Run/Stop to terminate a FastFrame sequence. If any frames were acquired, they are displayed. If no frames ■ were acquired, the previous FastFrame waveform is displayed. ■... -
Page 873: Digital Menu
Oscilloscope reference Digital menu NOTE. The Digital Menu is available only on MSO5000B and MSO70000C/DX Series instruments and DPO5000B Series instruments with option MSOE installed, and DPO70000DX instruments with option MSOU installed. Use the Digital menu options to set parameters for the D15-D0 digital channels, and to set up buses based on analog, math, and digital waveforms from which the instrument can acquire, decode, and display data (or bus forms). -
Page 874: Measurement Menu
Oscilloscope reference Measurement menu Use Measurement menu commands to select from and set up a variety of automatic measurements. Commands are also available on this menu for further in-depth analysis, gating (bounding), statistics, communication, and histograms. Trigger menu Use the Trigger menu to set up the instrument to trigger on live waveforms. Several different types of triggering are available. Utilities menu The Utilities menu provides access to utilities used by the instrument such as instrument calibration, instrument diagnostics, and user preferences. -
Page 875: Set The Vertical Scale
Oscilloscope reference Behavior. The Position control moves the vertical position of the waveform 0.2 divisions (0.02 divisions with FINE control). Increasing the position value moves the waveform up, and decreasing the position value moves the waveform down. The Position control differs from the Offset control; for information on the Offset control for channel waveforms refer to the Vertical Offset Control Window. -
Page 876: Select The Bandwidth
Oscilloscope reference Behavior. Each waveform has its own vertical scale parameter. For a signal with constant amplitude, increasing the scale causes the waveform to appear smaller. Decreasing the scale causes the waveform to appear larger. The scale affects all waveforms, but affects channel waveforms differently: For channel waveforms, the scale setting controls the vertical size of the acquisition window as well as the display scale. -
Page 877: Bus Pattern Condition
Oscilloscope reference Behavior. Bandwidth refers to the range of frequencies the instrument can acquire and display accurately with less than 3 dB attenuation. Each input channel has its own bandwidth selection. To take accurate measurements, the input frequency should be much less than the rated bandwidth of the instrument. A good rule to follow is to ensure the bandwidth of the instrument system is three to five times the bandwidth of the signal that you want to measure. -
Page 878: Bus Pattern Editor (Bus Tab)
Oscilloscope reference Bus pattern editor (Bus tab) When you select a parallel bus and click the Edit button, use the Pattern Editor controls to set up the bus trigger pattern for the instrument to use to detect a specific parallel bus value. When you select a serial bus and click the Edit button, use the Pattern Editor controls to set up the bus trigger pattern for a serial bus value. -
Page 879: Bus Pattern Editor (Bus Tab)
Oscilloscope reference Learn how to set the voltage threshold level for logic waveforms and to define a pattern. Learn about bus setups. Bus pattern editor (Bus tab) Use the Pattern Editor controls to set up the bus trigger pattern for the instrument as follows: DPO70000SX, MSO/DPO70000DX, MSO/DPO70000C, DPO7000C, and MSO/DPO5000B Series... - Page 880 Oscilloscope reference For parallel bus. Select the parallel bus and click Edit button. Select a bus and click Edit button. DPO70000SX, MSO/DPO70000DX, MSO/DPO70000C, DPO7000C, and MSO/DPO5000B Series...
- Page 881 Oscilloscope reference For serial bus. Select a bus SPI (with Trigger On set to Data ), RS232 (with Trigger On set to Data), I2C (with Trigger On set to Data), or USB (with Trigger On set to Special Packet, Special Type set to SPLIT 1000, and select Hub Address or Port Address) and click Edit button.
-
Page 882: Bus Pattern Editor (Logic Tab On Mso Series)
Oscilloscope reference What do you want to do next? Learn how to set the voltage threshold level for logic waveforms and to define a pattern. Learn about bus setups. Bus pattern editor (Logic tab on MSO series) Use the controls to set the bus trigger pattern of the channels the instrument uses as logic waveforms to detect a parallel or serial bus value. -
Page 883: Bus Pattern Editor (Live Tab)
Oscilloscope reference What do you want to do next? Learn how to define a pattern for a bus. Learn about bus setups. Bus pattern editor (Live tab) Use the controls to set the bus trigger pattern of the channels the instrument uses as logic waveforms to detect a parallel or serial bus value. -
Page 884: Bus Pattern Format
Oscilloscope reference What do you want to do next? Learn how to define a pattern for a bus. Learn about bus setups. Bus pattern format For MSO70000C/DX Series instruments, from the Trigger menu, select the Bus trigger type. You can change the format of the bus pattern after you define a pattern. -
Page 885: Bus Trigger On Selections
Set logic thresholds NOTE. This online help file supports many oscilloscope models from Tektronix. This feature is only available on some models. For the supported instruments, from the Trigger menu or from the Search and Mark menu, select the Bus, the Logic Pattern, or the Logic State trigger. - Page 886 Oscilloscope reference This is an example of the Threshold Setup dialog box for a 4-bit parallel bus. This is an example of the Threshold Setup dialog box for an I2C serial bus. DPO70000SX, MSO/DPO70000DX, MSO/DPO70000C, DPO7000C, and MSO/DPO5000B Series...
- Page 887 Oscilloscope reference This is an example of the Threshold Setup dialog box for an SPI serial bus. This is an example of the Threshold Setup dialog box for an RS232 serial bus. DPO70000SX, MSO/DPO70000DX, MSO/DPO70000C, DPO7000C, and MSO/DPO5000B Series...
- Page 888 Oscilloscope reference This is an example of the Threshold Setup dialog box for an USB serial bus. What do you want to do next? Learn about the Global Threshold field. Learn about bus setups. DPO70000SX, MSO/DPO70000DX, MSO/DPO70000C, DPO7000C, and MSO/DPO5000B Series...
-
Page 889: Select The Coupling
Oscilloscope reference Select the coupling From the Vertical menu, select Vertical Setup. Overview. Use the Coupling controls to couple the signal from the attached probe to the instrument. Available controls depend on the instrument model, selected termination, and attached probe. Some example control groups are shown. -
Page 890: Set The Offset
Oscilloscope reference To use. Click Display to turn the channel waveform display on and off. Assign a label to the waveform with the pop-up keyboard to make it easier to identify on the screen. Set the units of vertical scale in the Units text box. Behavior. -
Page 891: Set The Vertical Position-Scale
Oscilloscope reference Behavior. Use the Offset control to eliminate clipping the waveform. The offset control affects the vertical acquisition window by subtracting a DC bias from the waveform. This moves the level at the vertical center of the acquisition window of the selected channel. - Page 892 Oscilloscope reference Behavior. Each waveform has its own vertical Position control. The control increases or decreases the vertical position of the waveform 0.2 divisions (0.02 divisions using the Fine knob). Increasing the position value of the waveform moves the waveform up, and decreasing the position moves the waveform down.
-
Page 893: Select The Probe Controls
Oscilloscope reference NOTE. These knobs are automatically mapped when certain functions are performed, for example, when the MultiView Zoom button is pushed. Bandwidth readout (BW) Nominal system bandwidth consists of a combination of factors including, but not limited to, probe bandwidth, probe tip bandwidth, and bandwidth selections made in the Vertical Setup Control Window. -
Page 894: Select The Termination
Oscilloscope reference Select the termination From the Vertical menu, select Vertical Setup. To use. Use the Termination controls to select the channel input resistance: For DPO7000C and MSO/DPO5000B oscilloscopes: Select 1 MΩ for use with high impedance passive probes. ■ Select 50 Ω... -
Page 895: Set The Termination Voltage
Oscilloscope reference Behavior. The correct termination is set automatically when you attach a probe with a TekProbe/TekVPI interface to the instrument. However, you may have to set the termination manually if you use a probe without a TekProbe Interface. Consider the following when using 50 Ω termination with any channel: AC coupling is not available with 50 Ω... -
Page 896: Video Trigger Autoset
Oscilloscope reference Video trigger autoset Autoset automatically sets the video trigger controls for the selected format and optimizes the vertical sensitivity and time per division for viewing video lines and fields. These controls do not appear if you select the Custom format. ■... -
Page 897: Working With Your Oscilloscope
Oscilloscope reference Working with your oscilloscope The following topics describe features of your Tektronix oscilloscope. Even if you are an experienced user, you may want to browse through these topics to learn new ways of doing familiar tasks. Basic operations. - Page 898 Oscilloscope reference DPO70000SX, MSO/DPO70000DX, MSO/DPO70000C, DPO7000C, and MSO/DPO5000B Series...
- Page 899 Index parallel bus, 149 3 dB BW in bins, 728 Adjust, 246, 648, 684 8B10B bus Advanced trigger button, 76 setting up, 583 Aliasing 8B10B serial bus recognizing, 737 trigger, 314 Amplitude measurements, 91, 272, 744 8B10B Serial Bus Analog search for any character, 315 oscilloscopes, 65, 174, 177, 642 search for character symbol, 315...
- Page 900 Index acquisition mode, 770 parallel bus and remove a channel, 152 math waveforms, 602 parallel bus setup, 147, 148 parallel bus source, 149 serial bus channel threshold, 140 serial bus data rate, 138 B event trigger, 459 serial bus input, 139 Bandwidth serial bus threshold high, 139 control window, 493...
- Page 901 Index color, 517, 539 GPIB, 81 gray scale, 517 LAN, 81 gray-scale, 539 parallel port, 81 monochrome gray, 65, 177, 642 PS-2 keyboard, 81 monochrome green, 65, 177, 642 REF OUT, 81 normal, 177 serial port, 81 spectral, 177 side panel, 81 temperature, 177 signal out, 81 Comm trigger control window, 412...
- Page 902 Index Freq/Per trigger, 415 vertical setup, 479 gating, 290 waveform display, 484 glitch trigger, 417 waveform label, 486 GPIB configuration, 549 width trigger, 437 histogram, 292 zoom, 200, 483 Controls horizontal & acquisition setup, 181 search and mark, 308 horizontal position/scale, 184 Copy Event Table, 367, 368 instrument compensation, 552 Copy setup control window...
- Page 903 Index type control window, 87, 700 Delay mode, 185, 768, 769 units, 90 Delete setups, 530, 533 vertical, 87, 92, 700 waveforms, 530, 533 waveform, 92, 700 Deskew Cursor measurements control window, 505 sources, 88, 593 interaction with fast acquisition, 191, 505 styles, 89 procedure, 45, 576, 861 units, 94...
- Page 904 Index Displayed waveform, 653 clear data, 746 Displaying waveforms, 640 copy, 522 Displays copy setup, 517, 518, 520 appearance, 167, 648 select for copy, 522 color palette, 171 Undo last autoset, 189 colors, 171, 177, 755, 756 Edit MyScope, 375 contrast, 648 Editing a user mask, 757 control window, 484...
- Page 905 Index locking waveforms, 830 Trigger on TCP/IPv4/MAC Client Data, 409 Event table magnitude waveforms, 610, 828, 832 copy, 367, 368 phase waveforms, 828, 830 export, 368 process, 255 exporting, 369 window characteristics, 258 saving, 369 windows, 257, 821 selecting columns, 368 File, 742 Event Table, 363 File menu options...
- Page 906 Index intensity, 65, 79 defined, 733 Hardware position, 74 acquisition, 659 print, 26, 79, 524 hardware applications scale, 74 adding, 645 termination, 488, 812, 862, 863 removing, 645 touch screen, 73, 552 harmonics, 737 triggering from, 621 Help Functional model of instrument, 649 about tekscope, 21 Hi Res mode, 770, 817 high input impedance probes, 74, 763, 862, 863...
- Page 907 Index delay, 62, 63, 185, 441, 619, 656, 676, 768, 769, 774, Input channel acquisition hardware, 659 delay off, 674 conditioning, 652 delay on, 675 trigger sources, 664 input connector protection, 37 interrelated parameters, 657 Input signal parameters, 657 setting up, 577 position, 656, 661, 684 Installing options, 563 position &...
- Page 908 Index Mask editing Linear interpolation, 662 setup window, 225 Linear magnitude, 722 Mask hits List of bus setups, 109, 110 per segment, 235 Localizing a measurement, 597 Mask margin Lock mask, 221 controls, 226 Logic clock input for a trigger, 780 Mask pass/fail define source/tolerance, 226 Logic probe...
- Page 909 Index Measurement plugin, 248 annotation, 561 Math menu options Ch1 - Ch2, 815 gating, 597 Ch1 * Ch2, 815 localizing, 597 Ch3 - Ch4, 815 phase, 285 Ch3 * Ch4, 815 snapshot, 269 Measurement algorithms display On/Off, 484 amplitude, 690 position and scale, 485 area, 690 set averages, 246...
- Page 910 Index negative width, 694 horizontal, 92, 93 optical power, 694 horizontal parameters, 92 out of range samples, 699 interaction with fast acquisition, 191 peak to peak, 694 list, 266, 797 period, 694 mean, 287 phase, 695 miscellaneous, 282 positive duty cycle, 695 reference levels, 288 positive overshoot, 695 standard deviation, 287...
- Page 911 Index before startup, 49 add sources, 149 connection order, 52 clock polarity, 153 fast restart, 58 clock source, 152 features not available, 60 decode method, 158 instrument stacking, 47 display bus components, 157 power on, 53 remove a channel, 152 Switching between modes, 58 setting up, 581 Time Synchronized mode, 56, 58...
- Page 912 Index Position correction, trigger, 476 compensation, 502 Position knob, 75, 774 control window, 499 Position/scale control window status, 511 position, 842 tip selection window, 504 scale, 843 Probe Setup Control Window, 497 Positive pulse testing, 232 Probe tip selection, 504 Posttrigger data, 377 Probes Power down, 647...
- Page 913 Index Runt pulse triggering, 625 Recalling masks, 817 Runt trigger control window, 421 Setups, 741 definition, 671 template, 816 Waveforms, 742 Recalling a template waveform, 816 Recalling masks, 817 Sample density, 662 recalling saved files Sample interval, 657, 661 instrument setups, 644 Sample mode, 770 reference waveforms, 529, 616 Sample rate and user preference, 657...
- Page 914 Index control window, 169 RS-232 trigger, 316 cursors, 93 SPI trigger, 319, 338, 340, 343, 346 display text, 168 USB trigger, 325 Serial bus channel threshold objects control window, 170 setup, 140 Search Serial bus data rate configure, 301 setup, 138 controls, 308 Serial bus input count results, 306...
- Page 915 Index signal path compensation, 513 overview, 716 Signal path compensation procedure, 575 set up, 611 Signal processing and transformation, 649 time domain, 716 Spectral setups Sin(x)/x interpolation, 662 control window Single button, 78, 192 advanced Slope advanced, 250 trigger, 667 basic SMTP server address, 759 basic, 249...
- Page 916 Index bus pattern editor (DPO/MSO5000B Series), 847 TekSecure erase, 547 bus selection, 845 Template recall, 816 bus time condition, 845 saving, 241 codes, 746, 747 Termination considerations, 656 and coupling, 812 indicator, 476 termination control window, 812 live tab of the pattern editor, 851 Test notification, 227, 228 logic clock input, 780 Test results, 233...
- Page 917 Index logic state, 429 posttrigger data, 377 mode, 380 pretrigger data, 377 parallel bus setup, 383 sequential, 441, 624, 823 quick select, 378 setup control window, 377 run/stop, 192 shared/independent, 838 runt setup, 421 types, 377, 378 Troubleshooting setup/hold setup, 424 autoset, 659 timeout setup, 430 support information, 16...
- Page 918 Index User preferences control window attenuation, 507 prompts, 559 bandwidth, 493 readouts, 560 coupling, 490 trigger level presets, 559 deskew, 505 Using Fast Acquisitions, 578 display on/off, 857 Using mask testing, 608 label, 486 Using math waveforms, 598 offset, 487 Using MyScope control windows, 372 position/scale, 859 Using zoom, 685...
- Page 919 Index Waveform record, 661 Windows dockable, 645 Waveforms Windows interface, 22 averaging, 246 Working with your oscilloscope, 865 clipping, 858 colors, 177, 755, 756 display, 167, 484, 857 displaying, 640 X style cursor, 89 handle, 44 XY cursors, 88 histogram, 292 XY format, 173, 174 intensity, 174 XYZ format, 173...
- Page 920 Index DPO70000SX, MSO/DPO70000DX, MSO/DPO70000C, DPO7000C, and MSO/DPO5000B Series...
Need help?
Do you have a question about the DPO75902S and is the answer not in the manual?
Questions and answers