Table of Contents
Advertisement
Quick Links
Advertisement
Table of Contents

Related Manuals for CEMB N500


Summary of Contents for CEMB N500
-
Page 3: Table Of Contents
Contents N500 rev. 3.1 Chapter 1 - General description Standard accessories ……………………………… 1 - 1 Optional accessories ……………………………… 1 - 2 Connections ……………………………………… 1 - 2 Battery ……………………………………………... 1 - 3 General advice ……………………………………… 1 - 4 Chapter 2 - General layout Keys/buttons on the control panel ………...…...……... - Page 4 ………...….… 9 - 5 List of measurements …………………………...… 9 - 5 Reading measurements saved on the N500 instrument ... 9 - 6 - Loading of new measurements in archive …...… 9 - 7 - Selection and elimination of measurements …..…...
-
Page 5: General Description
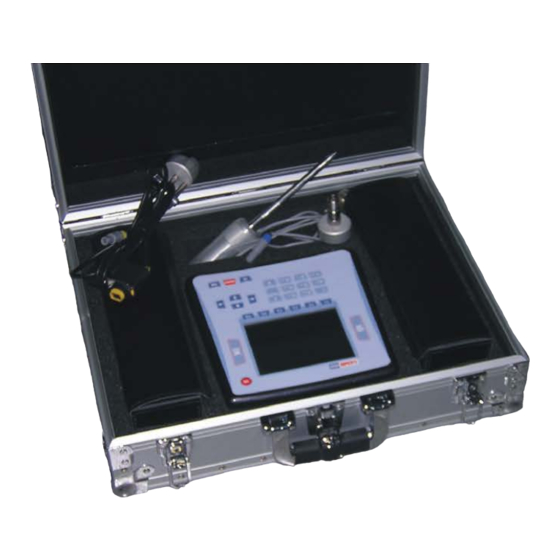
Chapter 1 General description The N500 instrument is supplied, together with its accessories, in a special case. It is advisable, each time the instrument is used, to place back it in its case in order to avoid risk of damage during transit. -
Page 6: Optional Accessories
Connections 1 – battery charger 2 – VGA output 15-pin (only for CEMB Technical Service) 3 – serial port RS232 (connecting of optional portable printer) 4 – 2 USB ports type A (master) 5 –... -
Page 7: Battery
Battery The N500 instrument is provided with a built-in rechargeable lithium battery, which allows autonomy of more than eight hours under normal operating conditions of the instrument. The battery status is indicated by an icon in the upper right hand corner of the screen. -
Page 8: General Advice
Caution: If the N500 instrument is provided with battery charger Accord, when plugging the adapter in the socket on the instrument make sure of the correct polarity, by keeping the + symbol on the same side as the wording TIP, as shown in the following image. -
Page 9: General Layout
Chapter 2 General layout Keys/buttons on the control panel The control panel of the CEMB N500 instrument incorporates a keypad where the various keys or buttons can be subdivided by function: - on / off button Press this button to switch the instrument on;... - Page 10 - buttons for navigating between the pages When this button is pressed in the setup screen, it confirms the settings selected and allows going onto the next screen. Instead, in the Measurement screen, it has the function of starting/stopping the actual measurement (see 2-4 Start / Stop the acquisition).
- Page 11 - arrow keys When a graph is displayed, these keys increase or decrease respectively the minimum or max. value of the x axis ( ) or the y axis ( Instead, when inputting a value for a parameter, they either shift the cursor to the left or right ( ) and increase or decrease the value in question ( - alphanumeric keypad...
-
Page 12: General Purpose Functions
General purpose functions In addition to many functions, specific for each different purpose and described in relative sections, there are certain general purpose functions which are described below. - Functions associated with the measuring phase Start / Stop acquisition: In all the Measurement screens, acquisition is started by pressing , and is subsequently stopped by again pressing The active acquisition status is easily to recognize (except in the balancing function) -
Page 13: Function "Other Functions
Caution: After changing the amplification, wait for a few seconds until the measurement becomes steady. - Function “Other functions...” When there are more than six functions accessible from a certain screen, there are not enough function keys to correspond to them; in such cases the key is associated with Pressing of this key causes substitution of the functions corresponding to... - Page 14 Use of the cursor For easier reading and interpretation of the displayed data, it is possible to introduce a cursor in any graph, provided the visible region is not blank: this can be done with . A window at the top right corner of the graph contains the co-ordinates of the point where the cursor lies.
- Page 15 Change of display channel: If both measuring channels are enabled, various types of display are possible, namely: - just graph of channel Ch1 - just graph of channel Ch2 - graphs of channels Ch1 and Ch2 simultaneously The passing in sequence between the various possibilities is obtained by repeatedly pressing .
- Page 16 List of peaks When this function is selected, a table appears with the 10 peaks of highest value present in the zone of the spectrum displayed, and associated with the corresponding frequencies. Their value is calculated by applying an interpolation algorithm to the FFT graph; this also allows identifying peaks not situated in correspondence to one of the lines of the spectrum.
-
Page 17: To Save Measurements
- to save measurements The N500 instrument allows easy saving of the acquired data; for such purpose, four different archives are available for the four different types of acquisition possible: - waveform - spectra (FFT) - monitoring in time - monitoring in speed... -
Page 18: To Capture And Save Displayed Images
- to capture and save displayed images In all screens of the N500 instrument, the image visible on the display can be captured with then saved in png format in an appropriate archive. This image can be used subsequently if required to accompany documentation produced by the operator. -
Page 19: Home Screen (Menu)
Chapter 3 Home screen (menu) After fully switching on the N500 instrument, it shows its Home screen which, besides showing a set of information: Manufacturer logo and name of the instrument – Serial number (S/N) of the instrument – Current program version –... - Page 20 Setting of the general operating parameters of the instrument 5. Data manager mode Data management (change of the name or delete the data saved on instrument N500) Copying or shifting data to USB key. N.B. It is possible to return to this screen from any other by pressing...
-
Page 21: Setup Mode
Chapter 4 Setup mode Sensor setup The N500 instrument can be used with different types and models of sensors. Therefore in order to ensure correct measurement, it is necessary to preset exactly the type of sensitivity of the sensors actually connected. - Page 22 DISPLC displacement N.B. The N500 instrument is able to determine automatically whether there is no sensor connected to an enabled channel (i.e. not set to OFF Sensors Setup) and it signals this by showing the symbol in the vicinity of the signal bar of the corresponding channel (only during measurement).
-
Page 23: General Setup
General Setup N.B. When the key is pressed, the SYSTEM INFO pop-up appears, containing full information concerning the system. Strike any key to close this window. The parameters for general use of the instrument should be preset in this page. 1. - Page 24 Only the firmware obtained directly from CEMB Technical Service should be used. It is advisable to remove the USB key before rebooting the instrument.
-
Page 25: Vibrometer Mode
Chapter 5 Vibrometer mode One of the simplest, but at the same time most significant information in vibration analysis, is the overall value of the actual vibration. In fact, this is very often the first parameter to be considered when evaluating the operating conditions of a motor, fan, pump, machine tool... -
Page 26: Frequency Range
2. Type of measurement As with all physical quantities, vibration has a value which can vary from instant to instant: mathematically it may be described as a function of time. Hence its overall value can be calculated according to three different types: RMS (Root Mean Square): –... -
Page 27: Vibrometer - Measurement Screen
N.B. Use of the CUSTOM frequency band is only recommended for expert users who have sound knowledge of the basic concepts in digital signal processing. In fact, an incorrect choice of sampling parameters could lead to unsatisfactory results. For example, with too low a f , there is risk of losing important high frequency information;... -
Page 28: Monitoring In Time
10. amplification status of the channel N.B. The values obtained in this mode can be reused to evaluate the operating status of the instrument by using, for example, the tables and graphs given in Appendix B of this manual. The default measurement is that of the total vibration value, but by pressing it is possible to switch to measurement of the synchronous value: in this mode, information appears concerning the modulus, phase and speed of rotation. - Page 29 When and then is selected, the entire monitoring can be saved in a file for subsequent analysis. When the acquisition is enabled for both channels, the data save is performed automatically for both channels in the same file. N.B. As access to the Monitoring in time function is gained from the VIBROMETER screen, the settings used for calculation of the overall value are the ones selected in the VIBROMETER SETUP screen.
-
Page 30: Monitoring In Speed
Monitoring in speed In many situations it could prove useful to associate the vibration value with that of the speed of rotation of a shaft; in this way it could be possible to investigate, for example, how the overall or the synchronous component varies during machine starting or stop phase, with identification of any critical zones or zones with risk of resonance, which are best to avoid. - Page 31 Monitoring is stopped by a further pressing of and the typical graph control functions become available (see 2-5 Functions operating on the graphs). - Set scale - Show cursor - Change of channel displayed - List of peaks When is pressed, the entire monitoring can be saved in a file for subsequent analysis.
-
Page 33: Chapter 6 - Fft (Fast Fourier Transform) Analyzer Mode
Chapter 6 analyzer mode (Fast Fourier Transform) A complete analysis of the vibration cannot fail to take into account the study of the various factors contributing towards forming its overall value. Hence it is essential to be able to carry out spectrum analysis with FFT (Fast Fourier Transform) algorithm. Such technique allows splitting and memorizing a measured signal into its component frequencies in a certain period of time, thus making it easier to discover their causes. - Page 34 It can be chosen from the following default values 25, 100, 500, 1000, 2500, 5000, 10000 and 15000 Hz, on the basis of which the N500 instrument will choose the appropriate frequency for data acquisition. N.B.
- Page 35 5. N° of lines Such parameter defines the number of lines used in the FFT algorithm, in practice associated with the resolution in frequency in the spectrum. This determines how close can be the frequency of two peaks so that they still remain distinct in the FFT graph. Such resolution is equal to linee therefore to maintain it constant, when the max.
-
Page 36: Spectrum Analysis (Fft)
Spectrum analysis (FFT) The so-called FFT algorithm is applied to the signals acquired with due respect for the settings made; in accordance with the recommendations deriving from the mathematical treatment from which it has been taken, such numeric processing is preceded by application of a Hanning window to the acquired signal. - Page 37 Harmonic cursor When the cursor is displayed on an FFT graph (see. 2-6 Use of the cursor), it means that a special mode known as harmonic cursor is available. The frequency at which the cursor is currently positioned when is pressed, is considered as the fundamental frequency of the signal under examination, and on the graph all the harmonics of higher order (2nd, 3rd, 4th, …) are marked Shifting of the cursor, which varies the frequency considered as fundamental, causes the...
-
Page 38: Waveform Function
In this mode, the N500 instrument can be used as an actual oscilloscope, and further enhances the variety of information which can be deduced from the vibration signals. - Page 39 One of the most frequent uses is the so-called Impact test: A hammer is used to stress a structure and to cause it to vibrate in order to determine its natural frequencies. For such purpose, a sensor should be placed in the zone to be examined and a threshold value chosen, which is higher than the background noise read, but lower than that produced by the hammering with which the structure is stressed.
- Page 40 The selection of a suitable value is normally one of the most delicate operations, but by using the N500 instrument it is considerably simplified. The graph at the bottom of the page shows in real time the signal of the trigger channel (in continuous line) and the current threshold (broken line).
- Page 41 After pressing the threshold value can be preset in two ways, namely: By typing, using the numeric keyboard (only after pressing , it is possible – to shift the broken line in the graph); by using to increase or decrease the value of a single digit, –...
- Page 42 FFT analyzer mode 6 - 10...
-
Page 43: Balancer Mode
(lack of uniformity of the mass about its axis of rotation); such unbalance can be corrected with a balancing procedure. The N500 instrument allows balancing any rotor under service conditions in one or two planes, by using one or two vibration pick-ups and a photocell. -
Page 44: Selection Of The Balancing Program
As the calibration is normally a laborious procedure, the parameters derived should be memorized, then called in the case of subsequent maintenance work on the same machine. This is possible via the balancing programs: a program is defined with a series of settings in order to work on a particular rotor and it contains all the information and data acquired regarding such rotor. - Page 45 1. New program – BALANCING SETUP The creation of a new program entails setting of a series of parameters. This is done in the BALANCING SETUP screen. 1. Number of planes This is the number of planes on which to act to correct the unbalance of the rotor.
- Page 46 For example, for a rotor with speed of rotation 600 RPM, it could be necessary to wait up to 10 seconds before being able to view the first result of the measurement. 3. Unit of measurement of the vibration This is the unit of measurement in which to supply the vibration to the sensors: acceleration (g (acc)) –...
- Page 47 2. Load program from archive When this option is selected, access is gained to the program archive. Arrow keys allows scrolling the 10 available positions, thus selecting the required program (visible in negative, i.e. with white writing on black background); the program can then be loaded by pressing If it is not possible to carry out the operation correctly (e.g.
-
Page 48: Calibration Sequence
3) third spin with test weight only on the second balancing plane For the two configurations correction on one plane with one sensor – correction on two planes with two sensors – The calibration sequence screen on the N500 instrument is organized as in the figures. Balancer mode 7 - 6... - Page 49 1 - number and name of the balancing program (if loaded from the archive), or else ---- 2 - current speed of rotation, in RPM 3 - layout of the position of the sensors and correction planes on the rotor; indication of the plane on which to apply the test weight N.B.
-
Page 50: Execution Of Measurement
Execution of measurement To start the measurement in any of these steps, press ; a pop-up panel appears showing, in real time, the quality of the current measurement (for each channel). The higher is the level of the bars, the better will be the quality of the measurement (which is averaged over time). - Page 51 Test weight Calibration requires the use of a test weight, to be applied in succession on the various correction planes. These two parameters should be preset, with the appropriate functions by typing the appropriate values with the numeric keypad, and confirming with To cover the various operational requirements when balancing on two planes, it is possible to specify a different test weight (value and angular position) on plane 1 and on plane 2.
-
Page 52: Unbalance Measurement And Calculation Of The Correction
Unbalance measurement and calculation of the correction In appearance the UNBALANCE MEASUREMENT page is very similar to the calibration page: and the following information is given: 1 – number and name of the balancing program (when loaded from the archive), otherwise ---- 2 –... - Page 53 4 – indication of the correction weight, in value and position on every plane. N.B. The module is indicated in general units U, corresponding to those used in setting the test weight. As the program makes use of correction through addition of material, the position indicated is the one where to add the correction weight.
- Page 54 : direct printing of a balancing certificate by using the portable printer provided (optional). The certificate gives the unbalances on the correction planes (in units U), as well as the values of vibration (overall and synchronous) of these planes. The following is an example of this certificate: : function involving splitting of the correction weight on two presettable angles (see 7-13 Splitting of correction weight.
-
Page 55: Splitting Of Correction Weight
The split function of the N500 function calculates the weights to be applied or to remove corresponding to any two positions α1 and α2, so that their effects are equivalent to those of the correction calculated by the balancing algorithm. -
Page 56: Saving Of A Balancing Program
If not, such splitting would be impossible, and the N500 instrument would indicate zero as correction weight for both positions α1 and α2. N.B.: It is useful to observe that the more the α1 and α2 positions are further apart from the position calculated in balancing, the higher must be the values of the corresponding weights. -
Page 57: Data Manager Mode
N500 instrument; send archive to PC using CEMB PoInTer software – load (display) measurements already in the archive. – Archive management Measurements saved with the N500 instrument are subdivided by type into different archives: waveforms – – Monitoring in time –... -
Page 58: Copying /Shifting Archive On Usb Key
(+10 and –10 respectively). Copying /shifting archive on USB key The data on the N500 instrument can be copied or shifted to the USB key supplied, and then easily imported on to an ordinary PC with CEMB PoInTer software (see Chap. 9). - Page 59 After inserting the pen drive in one of the two USB ports on the instrument it is necessary to select which archive/archives to be transferred. These will be marked with the symbol placed alongside its/their name. Pressing of , indicated by the causes starting of the data transfer process pop-up wait message At the end, the...
-
Page 60: Sending Archive To Pc
If the problem persists, contact the Technical Service Department. Sending archive to PC (CEMB PoInTer software required) Data stored in the N500 instrument can be sent directly to a PC equipped with CEMB PoInTer software, version 2.6 or greater. -
Page 61: Display Of Measurements Present In The Archive
Display of measurements present in the archive It is possible to display all the measurements and images saved in the N500 instrument by selecting them from the relative archive and pressing This makes it very easy to obtain comparisons and to make assessments directly "in field ". - Page 62 Data manager mode 8 - 6...
-
Page 63: Cemb Pointer (Optional)
Chapter 9 CEMB PoInTer Program (optional) The data collected and memorized with the N500 instrument can readily imported to a PC (directly or using a USB key), and subsequently analyzed, processed, compared, printed. Such operation is considerably facilitated by using the CEMB PoInTer (Portable Instruments Terminal) software, available for Windows operating systems. -
Page 64: Installation And Registration
Installation and registration For installation of the CEMB PoInTer software, proceed to run the setup.exe program, contained in the CD-ROM, and then click on the button without changing any option. In this way the software will be installed in the default program directory. - Page 65 Administrator user. Caution: Installation of the CEMB PoInTer software requires a different activation code on each PC, each one of which must be requested from CEMB by the above- mentioned procedures. Archive for measurement points A measurement archive, especially if of large size, should be structured in some way for fast and efficient data access.
-
Page 66: Data Manager
- type of measurement (RMS, PK, PP) - number of averages (1, 4, 8, 16) This ensures that measurements made at a future date on the same point will always be coherent between each others and therefore comparable. CEMB PoInTer Program 9 - 4... -
Page 67: Data Protection - Password
A reliable management of an archive requires suitable protection against accidental data loss. Such protection, in the CEMB PoInTer software, is obtained through the use of a password. If it is easy to understand how accidental deleting of an item in the archive could... -
Page 68: Reading Measurements Saved On The N500 Instrument
This may be done from the N500 instrument as described in 8.4 – Sending archive to PC; a specific message will be displayed on both the N500 instrument and the PC to confirm that the operation has been concluded. -
Page 69: Loading Of New Measurements In Archive
N.B. If the structure of a plant is saved on the USB key, and then deleted on the N500 instrument, the corresponding point will be associated directly with each measurement made subsequently. Hence loading of all the measurements in the... -
Page 70: Selection And Elimination Of Measurements
This has the advantage of retaining clarity also in the case of a large number of measurements. To access the graph display page, press the following key CEMB PoInTer Program 9 - 8... -
Page 71: Display Of Graphs
Also by selecting File Return Back from the menu. Using the Setup measurement unit option it is possible to select between metric units (g, mm/s, µm) and imperial units (g, inc/s, mils), or Hz and RPM. CEMB PoInTer program 9 - 9... -
Page 72: Cursor
(zoom in) : by clicking on a point the zone around that point is enlarged; (zoom out) : by clicking on a point a larger region around that point is displayed; CEMB PoInTer Program 9 - 10... -
Page 73: Separate/Combine Graphs
If it is wished to represent two or more measurements, this can be done in a single graph (default) or in two or more separate graphs (a maximum of three), with one measurement in each of them. To switch from one mode to the other press respectively. CEMB PoInTer program 9 - 11... -
Page 74: Creation And Printing Of Certificates And Reports
Creation and printing of certificates and reports Use of the CEMB PoInTer software allows easy creation and printing of vibration analysis certificates and reports, including data and/or graphs of the measurements taken and saved using the N500 instrument. When the key is pressed, the user must select the model (template) required for the certificate to be produced. -
Page 75: Appendix A - Specification
Appendix A Specification Instrument Dimensions: approx. 230 x 230 x 58 mm Weight: 1.75 kg Operating range Temperature: from -10° to +50° C Humidity in air: from 0 to 95% without condensation - Power supply Rechargeable lithium battery, 6 Ah Charging time: less than 5 hours (from fully discharged battery) Power supply unit-battery charger for 100-240 V, 50/60 Hz (24 V, 1.5 A) Autonomy: over 8 hours with normal use of the instrument... - Page 76 - Measurement specifications A/D converter: resolution 24 bit Dynamic range: > 100 dB Number of averages: from 1 to 16 Resolution: 100, 200, 400, 800, 1600, 3200 lines Frequency range: DC – 15kHz max µ Background noise: typically less than 1.50 V for a spectrum with 400 lines having a max.
-
Page 77: Appendix B - Evaluation Criteria
Appendix B Evaluation criteria TABLE A MACHINE CATEGORIES BY EVALUATION CRITERIA Group according to MACHINES ISO 10816 VDI 2056 Machine parts that are closely related to the machine as a whole during normal working I – K conditions. Grinding and boring machines. Electric motors (up to 15 KW) that need good balancing, e.g. - Page 78 EVALUATION CRITERIA BASED SPEED VIBRATION MEASURED ON FIXED PARTS For almost all machines, the measurement of the total speed of vibration as RMS value on fixed parts of the structure is able to characterize the machine from the vibratory point-of- view.
- Page 79 admissible accettable admissible good uman sensitivity Graph for evaluating mechanical vibrations on the basis of the RMS velocity. Evaluation criteria B - 3...
- Page 80 Evaluation criteria B - 4...
-
Page 81: Appendix C - A Rapid Guide To Interpreting A Spectrum
Appendix C A rapid guide to interpreting a spectrum TYPICAL CASES OF MACHINE VIBRATIONS 1. PRELIMINARY RAPID GUIDE f = vibration frequency [cycles/min] or [Hz] s = shift amplitude [µm] Measured values during control: v = vibration speed [mm/s] a = vibration acceleration [g] n = piece rotation speed [rpm] Frequency data Causes... - Page 82 7) f is much greater Damaged roller bearings. Unstable frequency, intensity and phase. Axial than n, not an vibration. exact multiple Excessive wear on sleeve Completely or locally defective lubrication. bearings. Audible screech. Belts too tight. Characteristic audible screech. Multiple belts not Run between the belts.
- Page 83 2. TYPICAL SPECTRA OF VIBRATIONS RELATED TO THE MOST COMMON DEFECTS Note: The spectra are in an indicative graphic form. The N500 equipment produces a different form of graph. The following are the spectra of typical vibrations, caused by the most common defects found in practical experience.
- Page 84 3. MECHANICAL LOOSENESS/PLAY 4. BELT 5. GEARS A rapid guide to interpreting a spectrum C - 4...
- Page 85 6. SLEEVE BEARINGS 7. ROLLER BEARINGS 8. ELECTRIC MOTORS A rapid guide to interpreting a spectrum C - 5...
- Page 86 3. FORMULAE FOR CALCULATING TYPICAL BEARING DEFECT FREQUENCIES SYMBOLS: FTF = housing frequency BPFO = defect on outer track BPFI = defect on inner track = defect on roller/ball The frequencies of bearings can be calculated if we know: = number of shaft rpm = primitive diameter = ball/roller diameter = number of balls/rollers...
- Page 87 Codes that can be used in models for certificates obtained using the CEMB PoInTer program. When the certificate is created, the CEMB PoInTer software automatically replaces some of the default codes in the model (#x# format) with corresponding information, related to the measurements displayed at the time.
- Page 88 Frequency of peak no. 1 in graph 3 #502# Frequency of peak no. 2 in graph 3 #…# Frequency of peak no. … in graph 3 #525# Frequency of peak no. 25 in graph 3 Codes for Cemb PoInTer certificates D - 2...
- Page 89 Value of peak no. 1 in graph 3 #527# Value of peak no. 2 in graph 3 #…# Value of peak no. .. in graph 3 #550# Value of peak no. 25 in graph 3 Codes for Cemb PoInTer certificates D - 3...
Need help?
Do you have a question about the N500 and is the answer not in the manual?
Questions and answers