Advertisement
Quick Links
Advertisement

Subscribe to Our Youtube Channel
Related Manuals for ASD FieldSpec 4


Summary of Contents for ASD FieldSpec 4
- Page 1 User Manual ASD Document 600979 Rev. D June 2015...
- Page 2 The ASD Inc. logo, FieldSpec, Indico, LabSpec, QualitySpec, and TerraSpec are registered trademarks and goLab, HandHeld 2, RS , and ViewSpec are trademarks of ASD Inc. All other trademarks and registered trademarks are the properties of their respective owners.
-
Page 3: Table Of Contents
1.3 FieldSpec 4 Instrument Overview ........ - Page 4 3.6 ASD Software Displays Saturation Error ........
- Page 5 What Are These Steps in My Data? ........57 What Can Cause More Noise in My Data from Last Time?.
-
Page 6: Chapter 1: Getting Started
1.1 About This Manual This manual is for users of the FieldSpec 4 instrument and describes how to set up and use the instrument. It also includes reference information about how the instrument works. This manual uses the following symbols and typographical conventions. -
Page 7: Technical Support
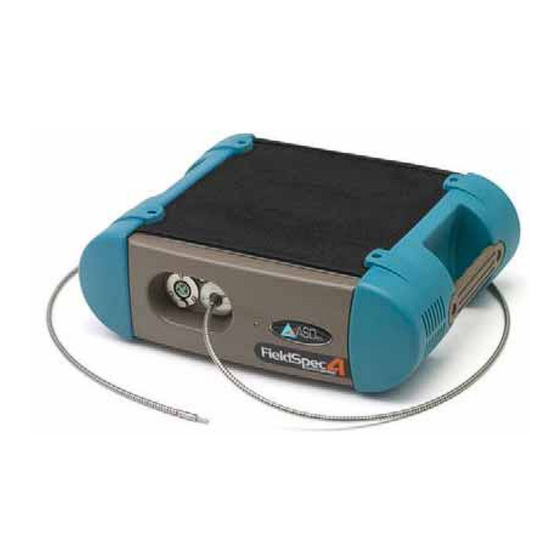
A spectroradiometer is a special kind of spectrometer that can measure radiant energy (radiance and irradiance.) The FieldSpec 4 instrument has a fixed fiber optic cable that lets you calibrate it to units of radiant energy (irradiance and radiance). - Page 8 Figure 1.1 shows the front panel of the instrument. Accessory power port Fiber optic cable (fixed) Figure 1.1: FieldSpec 4 instrument front panel Figure 1.2 shows the back panel of the instrument. Ethernet port to connect to the instrument controller...
-
Page 9: Unpacking The Instrument
1.4 Unpacking the Instrument The instrument ships in a hard-shell carrying case, as shown in Figure 1.3. Instrument and ® Spectralon fiber optic cable reference panel Contact probe (optional) Computer Power cable, Ethernet cable, and accessories (some purchased separately) Battery (1; additional batteries are optional) Figure 1.3: Instrument as it ships The backpack and laptop carrier ship separately and are in the soft-sided case, as shown in... -
Page 10: Setting Up The Instrument
To unpack the instrument: 1. Inspect the shipping containers and note any damage. • Save all packing materials, foam spacers, and paperwork for future use. 2. Open the shipping containers, following all instructions and orientation labels. 3. Remove the instrument from its shipping case and place it on a sturdy bench or counter with an electrical outlet available. - Page 11 On/off switch Wi-Fi/Ethernet button Ethernet port to connect to the instrument controller Power port 2. Connect the Ethernet cable to the instrument controller’s Ethernet port and to the back of the instrument. • The location of the Ethernet port varies on different instrument controllers. •...
-
Page 12: Setting Up Rs And Saving Spectra
1.6 Setting Up RS and Saving Spectra After you start the RS software, you must optimize and set a white reference. You can then collect and save spectra. To set up the software and save spectra: 1. Start the RS software. - Page 13 5. Point the end of the fiber optic cable at the sample and hold it there until the spectrum average collection is complete. 6. Select Control > Save Spectrum. 7. If you would like to change the file save location of your spectrum, browse to where you want to save the spectrum and enter a file name.
-
Page 14: Chapter 2: Using And Maintaining The Instrument
To use the instrument, you must have a laptop computer (instrument controller) and the appropriate software. If you did not purchase an instrument controller from ASD or need to use your own computer, the following sections provide the system requirements: “Computer Requirements”... -
Page 15: Software Requirements
® (Optional) Serial communications port (RS-232 COM, Bluetooth , or USB; only needed if a GPS is used). Contact ASD for information about using GPS receivers with ASD instruments. Software Requirements The instrument controller requires the following software: Microsoft Internet Explorer 6.0 or higher ... -
Page 16: Using The Battery
Use only batteries supplied by ASD. Use ASD batteries only as authorized by ASD. Using improper batteries or improper use of ASD batteries could result in bodily injury or damage to the instrument. A fully charged battery’s life depends on the battery age, instrument configuration, environment, and accessories powered by the accessory power port. -
Page 17: Setting Up Ethernet Or Wireless Communication
Power Status Icon The software from ASD has a Power Status icon at the bottom of the main window next to the Connection Status. When you hold the mouse pointer over the icon, a pop-up window shows the voltage level of the instrument. -
Page 18: Understanding The Fiber Optic Cable
2.5 Understanding the Fiber Optic Cable ASD offers a variety of fiber optic cable lengths to use with the instrument. A single cable, without any interruption in the fiber optic connections, allows for accurate measurement of radiance and irradiance in absolute units, and ensures the highest level of signal throughput. -
Page 19: Checking The Fiber Optic Cable For Broken Fibers
If left in a tight coil for longer than a week, the fibers may develop longitudinal fractures that will not be detectable. These fractures in the fiber will cause light leakage, resulting in a weaker signal. Store the fiber optic cable in the netting compartment on the instrument or on the fiber optic spool. -
Page 20: Options For Collecting Spectra
On the instrument controller, exit any ASD software that might be running and communicating with the unit. 4. Ensure that the instrument is turned on. 5. Start the Fiber Check software from the Start menu under All Programs > ASD Programs > RS Tools > Fiber Check. -
Page 21: Using The Pistol Grip
Pistol grip—Provides a convenient way to hold and aim the fiber optic cable to collect spectra using ambient light. For more information, see “Using the Pistol Grip” page 16. Accessory light sources—Provide artificial light for sample illumination. For more ... -
Page 22: Using Accessory Light Sources
Contact ASD or refer to the manual for the accessory for more information. Using Fore Optics ASD offers a wide selection of fore optic accessories to meet a variety of application needs, including: Lenses that decrease the field of view from the fiber optic’s 25° field of view to as little as ... - Page 23 you have both hands holding the sample and the fiber optic cable. You can attach the remote trigger to the pistol grip and save spectra by pressing the button on the trigger. To use the remote trigger: 1. Attach the remote trigger cable to the instrument. Remote trigger connector Remote trigger...
-
Page 24: Shipping And Carrying The Instrument
• The LEDs on the trigger are bright enough to be seen even on a sunny day. The LEDs light when the trigger is pushed (briefly) and turn off when the capture is complete. 2.7 Shipping and Carrying the Instrument The following sections describe how to ship and carry the instrument: “Shipping the Instrument”... -
Page 25: Using The Laptop Carrier (Belly Board)
“Protecting the Instrument from Bad Weather” on page 29 Using the Laptop Carrier (Belly Board) The laptop carrier or belly board lets you carry the instrument controller in the field as you collect spectra. You can use it the following ways: With the neck strap—The laptop carrier can hold the instrument controller without the ... -
Page 26: Using The Backpack
5. Place the instrument controller on the laptop carrier temporarily and observe its location. • Determine where on the laptop carrier to place the instrument controller and allow for comfortable use of the keyboard. 6. Remember this placement and place the instrument controller on a table. 7. - Page 27 You can use the instrument in the backpack with either hand. Determine which hand you want to use for collecting spectra with the fiber optic cable and which you need available to type on the keyboard and handle samples. Aiming the fiber optic cable or accessory will probably require less dexterity than operating the instrument controller and typing.
- Page 28 • With the hook and loop material to the back of the backpack. If needed you can run the fiber optic cable through the loop on one of the battery pouches. The hip belt of the backpack has a battery pouch on each side. Fiber optic spool (attached to back of backpack with hook and loop material)
- Page 29 • If the fiber optic cable is short, it can go directly from the instrument through the loop on the battery pouch. Loop on battery pouch Fiber optic cable 8. Place the battery into the pouch on the opposite side of the backpack from where the fiber optic cable is.
-
Page 30: Adjusting The Backpack Straps To Fit
10. Attach the laptop carrier to the plastic connectors on the shoulder straps of the backpack. 11. Place the instrument controller onto the laptop carrier, matching the strips of hook and loop material. • The laptop carrier is equipped with a pistol grip holder. Adjusting the Backpack Straps to Fit For better weight distribution and comfort, adjust the shoulder straps and yoke to your height while wearing the fully loaded backpack. -
Page 31: Attaching The Pistol Grip Clip
To shorten the torso adjustment: Pull the strap on left of backpack (as shown) until the yoke and shoulder straps raise up to the desired position, and the weight is comfortably distributed. To lengthen torso adjustment: Push up on the plastic speed grip clamp on the left of the backpack to release the strap, ... - Page 32 The pistol grip clip has two components that you must assemble before use: Pistol grip link that screws onto the pistol grip. Link Plate Screws Figure 2.7: Pistol grip link Pistol grip latch housing that clamps onto the backpack. ...
- Page 33 3. Attach the pistol grip link to the pistol grip based on the hand you want to use, as shown. • Make sure the plate is seated flat against the side of the pistol grip. Two screws Link Link Two screws (not shown) Plate (not Plate...
-
Page 34: Carrying Accessories And Supplies
10. Slide the pistol grip link into the housing until it clicks to keep the pistol grip securely attached. • To remove the pistol grip, use the latch release and pull the pistol grip up. Carrying Accessories and Supplies The backpack is designed specifically for the instrument. The large mesh pocket at the bottom of the pack provides ventilation to keep the instrument from overheating. -
Page 35: Setting Up Gps
If you purchased the instrument controller and GPS device from ASD, you should not have to configure anything. You can begin using the GPS device as you collect spectra with no additional configuration. See “Using a GPS Device... - Page 36 Table 2.2: GPS device and instrument controller connection options and setup Instrument Additional device controller hardware or connection connection software Setup required Serial Serial None 1. Configure the GPS device to output NMEA data. • See “Configuring the GPS Device” on page 32.
-
Page 37: Configuring The Gps Device
Consult the documentation for your device for how to configure it for the output needed. Setting Up a USB-to-Serial Converter If you purchased your GPS device and instrument controller from ASD, they should already be configured properly. If you purchased your instrument controller or GPS device from a third party and your GPS device outputs serial data and your computer does not have a serial connection, you must purchase a USB-to-serial converter. -
Page 38: Configuring A Bluetooth Connection
To install and configure the GPSGate Client software: 1. Download and install GPSGate Client. • The software is available from: http://gpsgate.com/download. • Use a second computer to download the GPSGate Client, so the instrument controller IP settings are not changed. 2. -
Page 39: Configuring The Instrument Controller Com Port
34. Configuring the Instrument Controller COM Port If you purchased your GPS device and instrument controller from ASD, they should already be configured properly. If you are setting up an instrument controller purchased from a third party, you must configure the COM port for the GPS device. -
Page 40: Using A Gps Device While Collecting Spectra
35. Using a GPS Device While Collecting Spectra If you purchased the GPS device and instrument controller from ASD or if you have already completed the GPS setup, you can now use the GPS device while you collect spectra. -
Page 41: Maintaining The Instrument
6. See if the lock icon on bottom-left corner looks locked and if the Latitude, Longitude, and Altitude information displays across the bottom of the window. • You may need to wait a brief period for the GPS device to lock on to three satellites for the data to display. -
Page 42: Annual Maintenance
Returning the Instrument for Service To return the instrument to ASD for maintenance or repair, contact ASD technical support for a Return Merchandise Authorization (RMA). The RMA includes scheduling details, contact information, shipping instructions, and a brief description of the maintenance or repair requirements. -
Page 43: Chapter 3: Troubleshooting
To fix many communication errors (particularly if the instrument has been functioning at some point), below are steps to try: 1. If you did not purchase the instrument controller from ASD or have configured the instrument controller to connect to a network, you must change the instrument controller’s network settings to connect to the instrument. -
Page 44: Changing The Network Settings On The Instrument Controller
Wireless function switch. Be sure it is on for wireless communication. 6. If you receive a 400 command error while starting the ASD software, you need to reload the instrument .ini file to the instrument. • Use the Instrument Configuration utility from ASD to do this. Contact technical support for assistance. - Page 45 7. Select the “Use the following IP address” option and enter 10.1.1.10 as the IP address and 255.255.255.0 as the Subnet mask. • All other entries can stay blank. 8. Click OK twice to return to the Network Connections window. 9.
-
Page 46: Instrument Controller Does Not Connect To The Instrument With The Ethernet Cable
17. Click OK twice to return to the Network Connections window. 18. Right-click the Wireless Network Connection again and select Properties. 19. Click Configure in the upper-right side of the window. 20. Click the Power Management tab. 21. Deselect the “Allow the computer to turn off this device to save power” option. 22. - Page 47 5. Check that the IP addresses of the instrument and the instrument controller are in the same range or subnet. • The same range or subnet means that the first three octets of the IP address (xxx.xxx.xxx.___) match. • The default IP address for the instrument is 10.1.1.11. •...
-
Page 48: Instrument Controller Does Not Connect Wirelessly To The Instrument
The instrument has a default WPA of: 0123456789 • When first connecting to the instrument, the connection status may show, “Limited access.” After you start the ASD software, the status will change to, “Connected.” 3.4 Instrument Loses its Wireless Connection 1. See section “Common Communication Fixes”... -
Page 49: Windows Firewall Messages Display When You Try To Connect
3. Click Windows Firewall. 4. Click Advanced Settings. 5. Click Inbound Rules. 6. Make sure you see the two ASD rules. 7. Click Outbound Rules. 8. Make sure you see the two ASD rules. 9. If the rules are there, but are not enabled, right-click each rule and select Enable Rule. -
Page 50: Asd Software Displays Saturation Error
Public, and give it a name you will recognize. 3.6 ASD Software Displays Saturation Error The ASD software displays a saturation error and plays an audible error alarm when the instrument is overwhelmed with light (signal) and cannot discern the spectrum of the sample. -
Page 51: Appendix A: Specifications And Compliance
Appendix A: Specifications and Compliance The following sections contain the specifications and WEEE compliance: “A.1 Physical Specifications” on page 46 “A.2 Power Input and Output” on page 47 “A.3 Battery Specifications” on page 47 “A.4 Battery Charger Specifications” on page 47 ... -
Page 52: Power Input And Output
A.2 Power Input and Output Below are the power input and output. Auto ranging, Switching, SELV AC power supply type 90-240 VAC, 50/60 Hz AC input +12 VDC, 60 W DC input Output, +12 VDC, 27 W (max). Accessory power port (front of instrument) A.3 Battery Specifications Below are the NiMH battery specifications. -
Page 53: Environmental Specifications
A.5 Environmental Specifications Below are the environmental specifications. 0 to 40°C Operating temperature Non-condensing Operating and storage humidity -15 to 45°C Storage temperature A.6 Wavelength Configuration Below is the wavelength configuration. Wavelength name Wavelength range VNIR-SWIR 1-SWIR 2 350 - 2500 nm The spectral resolution is: 3 nm @ 700 nm. -
Page 54: Network Interface Requirements
A.7 Network Interface Requirements The instrument has a 10/100 Base T Ethernet port. You can connect the instrument to the instrument controller using an Ethernet cross-over cable. The instrument can also communicate with the instrument controller using the 802.11g wireless card. -
Page 55: Appendix B: Faqs
Spectrometer — An optical instrument that uses detectors, other than photographic film, to measure the distribution of radiation in a particular wavelength region. All ASD instruments are spectrometers. The SWIR component of the ASD spectrometer is a scanning spectrometer, while the VNIR component is an array spectrometer. -
Page 56: What Does A Broken Fiber Mean
B.1. The label also contains the model number and MAC address for the instrument. The serial number is also accessible in the ASD software by selecting Help > About. When corresponding with ASD about any instrument questions, you should provide the instrument serial number. -
Page 57: Collecting Spectra
Figure B.1: Label with serial number B.2 Collecting Spectra “How Often Do I Need to Optimize?” on page 52 “How Often Do I Need a Baseline or White Reference?” on page 53 “What Spectrum Average (or Sample Count) Should I Use?” on page 53 ... -
Page 58: How Often Do I Need A Baseline Or White Reference
Spectralon panel is greater than one, reoptimization is recommended. The ASD software provides a saturation warning. We recommend leaving the volume on the instrument controller loud enough to hear the warning. How Often Do I Need a Baseline or White... -
Page 59: How Do I Collect A Reference With A Spot Size Larger Than The Spectralon Panel
How Do I Collect a Reference with a Spot Size Larger Than the Spectralon Panel? Purchase a bigger reference panel or move the fiber optic cable closer to it. If you are indoors using artificial light, make sure that the distance and angle from the reference panel is the same as for samples. -
Page 60: What Are The Units Of Radiance
ASCII text files for incorporation into other applications. The complete specification of the ASD file format is available upon request. Why Do I See Oscillations (Sine Wave) in My Data? Your light source may use AC power. -
Page 61: What Are These Two Large Noise Bands In My Data
What Are These Two Large Noise Bands in My Data? Water vapor in the atmosphere absorbs light in the 1400 nm and 1800 nm bands. This results in little to no signal at these wavelengths. When the reference and target spectra are ratioed to create reflectance measurements, very small, randomly fluctuating numbers (that is, noise) create large fluctuations in the spectra. -
Page 62: What Are These Steps In My Data
Figure B.4: Spectrum of fluorescent lights. What Are These Steps in My Data? Light is brought into the instrument by various combinations of the strands in the fiber optic cable. Each strand has its own field of view. When the cable is held close to the sample, each strand views slightly different portions of the sample. -
Page 63: Why Does The Vnir Drop To Zero After A Dark Current Collection
An increase in noise can be due to a problem in the instrument such as an electronic component malfunction or a grounding problem. This is usually indicated by a regular pattern to the noise or periodic bursts of noise that are visible over the normal spectra. Why Does the VNIR Drop to Zero after a Dark Current Collection? When the VNIR drops to zero after a dark current has been collected, this may indicate a... -
Page 64: Instrument Controller
The instrument outputs a lot of data at a high rate of speed for the ASD software to collect. In addition, the ASD software will stack up your keystroke entries and execute them later, in the order they were received. -
Page 65: Appendix C: Standard Accessories
Appendix C: Standard Accessories FieldSpec 4 User Manual (printed and PDF on flash drive) FieldSpec 4 Quick Start Guide (printed and PDF on flash drive) Instrument power supply 12 V One 12 V, 9 amp hour Nickel-Metal Hydride battery, one AC battery charger, and one ... -
Page 66: Accessories For Light Sources And Probes
Collecting radiance and irradiance data (where solar light is the primary source of illumination). Many accessories, including the optional fore optic lenses, rely on external illumination sources, including solar illumination. Visit the FieldSpec 4 product pages on the ASD website at www.asdi.com to see more recommended accessories. Appendix C: Standard Accessories... -
Page 67: Appendix D: Understanding Field Measurement Conditions
Spatial and temporal variability of the sample characteristics Many of these parameters are controlled when using one of the ASD standard sampling interfaces (for example., Muglight or contact probe). To develop a field experiment, you must first define the overall experimental design. -
Page 68: Illumination
You must compute the reflectance or transmittance spectrum by dividing the spectral response of the target material by that of a reference sample. The ASD software handles both the collection of the two spectral responses and the calculation of reflectance or transmittance. -
Page 69: Characteristics Of Artificial Illumination
can contribute as much as 5-10% of the total illumination reaching a surface. At shorter wavelengths, diffuse skylight can contribute as much as 20-25% of the total. The spectral characteristics of the illumination scattered off surrounding objects is determined by their reflectance characteristics. - Page 70 By far, water vapor is the strongest modifier of the incoming solar spectrum. Water vapor has absorption features spanning the solar reflected region of the spectrum (see Figure D.2), and varies both spatially and temporally. Figure D.2: Transmission spectrum of water vapor for typical atmospheric conditions Carbon dioxide has strong features in the 2000-2200 nm range (see Figure D.3), a region of...
-
Page 71: Clouds
Other major atmospheric components that influence the atmospheric transmission spectrum are shown in Figure D.4. Figure D.4: Transmission spectrum of various gases for a typical atmospheric conditions D.3 Clouds Partial cloud cover is indicative of highly spatially and temporally variable atmospheric water vapor. -
Page 72: Measure The Magnitude Of The Effect Of Cirrus Clouds
Measure the Magnitude of the Effect of Cirrus Clouds Here is a way to measure how much cirrus clouds affect spectra collection: 1. Standardize the field spectrometer on the reference panel. 2. Continue to view the reference panel with the instrument. •... -
Page 73: Rocks, Soils, And Man-Made Materials
Lignin Proteins Starches Sugars Non-photosynthetic components of the canopy have spectra that are dominated by absorption features attributed to lignin and cellulose. The spectral radiance leaving a vegetation canopy is significantly impacted by many factors, such as those listed in Table D.1. -
Page 74: White Reference
The use of a white reference standard with near 100% reflectance simplifies this calculation. The ASD software can calculate the ratios for reflectance or transmittance of the material being sampled by the spectrometer using the reference panel as the standard. -
Page 75: Appendix E: Theory Of Operation
Appendix E: Theory of Operation The following sections describe the instrument’s theory of operation: “E.1 Overview” on page 70 “E.2 Fiber Optic Collection of Reflected/Transmitted Light” on page 71 “E.3 Inside the Instrument” on page 71 “E.4 Visible and Near-Infrared (VNIR)” on page 71 ... -
Page 76: Fiber Optic Collection Of Reflected/Transmitted Light
E.2 Fiber Optic Collection of Reflected/ Transmitted Light Optical energy is collected through a bundle of specially formulated optical fibers that are precisely cut, polished, and sealed for extremely efficient energy collection. The fibers themselves are of low hydroxyl molecule composition providing the maximum transmission available across the wavelength range of the instrument. -
Page 77: Fore Optics
Each SWIR spectrometer consists of a concave holographic grating and a single thermo- electrically cooled indium gallium arsenide (InGaAs) detector. The gratings are mounted about a common shaft that oscillates back and forth through a 15° swing. As the grating moves, it exposes the SWIR 1 and SWIR 2 detectors to different wavelengths of optical energy. -
Page 78: White Reference
energy reflected off a white reference panel or standard. Spectralon from LabSphere is a white reference standard that is very suitable for the VNIR and SWIR spectral ranges of ASD instruments. Spectralon Reflectance Data Figure E.1 shows reflectance data for an uncalibrated white Spectralon panel. When using a calibrated white Spectralon panel as the white reference for a reflectance measurement with the instrument, an even closer reflectance value for the sample can be calculated. -
Page 79: Gain And Offset
Figure E.1: Typical 350–2500 nm spectral response of Labsphere 99% Spectralon E.9 Gain and Offset The gain value is the inverse of actual gain. A decrease in gain value will produce a higher gain. The maximum gain value is 16. Under the low light levels that create such a gain, small changes in offset will translate into large changes in dynamic range. -
Page 80: Appendix F: Declaration Of Conformity
Appendix F: Declaration of Conformity ® FieldSpec 4 User Manual... -
Page 81: Index
Index Symbols the fiber optic tip the Spectralon reference panel .ini file needs updating clouds effect on collecting spectra collecting absolute reflectance, when to use spectra in the field accessories carrying in the field collecting spectra carrying the instrument for light sources and probes options for standard... - Page 82 sinusoidal wave, explained back panel steps in carrying in the field 19, 21 VNIR drops to zero after dark current front panel VNIR spikes models default IP addresses overview for the instrument controller protecting from bad weather sending it for maintenance or repair serial number location environmental specifications setting up...
- Page 83 optimizing, when to do network oscillations in data, explained physical power wavelength physical specifications spectra pistol grip collecting in the field attaching clip to collecting options using to collect spectra collecting using accessory light sources post-processing data collecting using fore optics power collecting using the pistol grip options...
- Page 84 explained VNIR, defined warm-up time wavelength specification WEEE compliance white reference collecting larger than Spectralon panel defined 69, 73 how often to collect reflectance data wind effect on collecting spectra Windows firewall, handling messages from Windows language settings wireless connection default settings instrument controller does not connect to the instrument...
- Page 86 Phone: 303.444.6522 Fax: 303.444.6825 NIR.info@panalytical.com www.asdi.com FieldSpec 4 User Manual ASD Document 600979 Rev. D June 2015 To obtain a copy of this instruction manual online, visit our website at http://support.asdi.com © 2015 ASD Inc.,a PANalytical company All rights reserved.
Need help?
Do you have a question about the FieldSpec 4 and is the answer not in the manual?
Questions and answers