Table of Contents
Advertisement
Quick Links
A l l t e s t I n s t r u me n t s , I n c .
5 0 0 C e n t r a l A v e .
F a r mi n g d a l e , N J 0 7 7 2 7
P : ( 7 3 2 ) 9 1 9 - 3 3 3 9
F : ( 7 3 2 ) 9 1 9 - 3 3 3 2
a l l t e s t . n e t
s s a l e s @ a l l t e s t . n e t
T h e t e s t & me a s u r e me n t
e q u i p me n t y o u n e e d a t
t h e p r i c e y o u w a n t .
A l l t e s t c a r r i e s t h e w o r l d ' s l a r g e s t s e l e c t i o n o f
u s e d / r e f u r b i s h e d b e n c h t o p t e s t & me a s u r e me n t
e q u i p me n t a t 5 0 % t h e p r i c e o f n e w .
O O u r e q u i p me n t i s g u a r a n t e e d w o r k i n g , w a r r a n t i e d , a n d
a v a i l a b l e w i t h c e r t i f i e d c a l i b r a t i o n f r o m o u r i n - h o u s e s t a f f
o f t e c h n i c i a n s a n d e n g i n e e r s .
• 1 0 + f u l l t i me t e c h n i c i a n s w i t h o v e r 1 5 0 y e a r s o f
s p e c i a l i z a t i o n
• 9 0 d a y w a r r a n t y & 5 d a y r i g h t o f r e t u r n o n a l l
e q u i p me n t
• • 1 - 3 y e a r w a r r a n t i e s f o r n e w a n d
p r e mi u m- r e f u r b i s h e d e q u i p me n t
• E v e r y u n i t t e s t e d t o O E M s p e c i f i c a t i o n s
• S a t i s f a c t i o n g u a r a n t e e d
Y o u h a v e p l a n s , w e w i l l h e l p y o u a c h i e v e t h e m.
A n y p r o j e c t . A n y b u d g e t .
t
G e t a q u o t e t o d a y !
C C a l l ( 7 3 2 ) 9 1 9 - 3 3 3 9 o r e ma i l s a l e s @a l l t e s t . n e t .
Advertisement
Chapters
Table of Contents

Related Manuals for Tektronix WCA330


Summary of Contents for Tektronix WCA330
- Page 1 T h e t e s t & me a s u r e me n t e q u i p me n t y o u n e e d a t t h e p r i c e y o u w a n t . A l l t e s t I n s t r u me n t s , I n c .
- Page 2 User Manual WCA330 & WCA380 3GHz & 8GHz Wireless Communication Analyzer 070-A792-50 This document applies to firmware version 3.2 and above. www.tektronix.com...
- Page 3 Copyright © Tektronix Japan, Ltd. All rights reserved. Copyright © Tektronix, Inc. All rights reserved. Tektronix products are covered by U.S. and foreign patents, issued and pending. Information in this publication supercedes that in all previously published material. Specifications and price change privileges reserved.
- Page 4 Tektronix, with shipping charges prepaid. Tektronix shall pay for the return of the product to Customer if the shipment is to a location within the country in which the Tektronix service center is located.
- Page 6 Service Options Tektronix provides service to cover repair under warranty as well as other services that are designed to meet your specific service needs. Advancing technology has brought incredible change to the power of measurement instruments. Manufac- turing methods and calibration techniques have been revolutionized, making the service challenge tougher than ever. By using Tektronix as your service provider you make use of our technology and product knowledge, our world-wide logistics infrastructure, and our ISO9000 approved service centers.
- Page 8 ............1–3 Difference between WCA330 and WCA380 ......
-
Page 9: Table Of Contents
........2–121 WCA330 & WCA380 User Manual... - Page 10 ..... . . 3–61 Operating Example of the Utility Average Function ..... . 3–63 WCA330 & WCA380 User Manual...
- Page 11 ..........3–167 WCA330 & WCA380 User Manual...
- Page 12 ........F–1 Index WCA330 & WCA380 User Manual...
- Page 13 Table of Contents List of Figures Figure 1–1: WCA330/WCA380 wireless communication analyzer 1–1 Figure 1–2: Signal processing system block diagram ... . . 1–4 Figure 1–3: AC inlet on the rear panel .
-
Page 14: Figure 1-9: Initial Screen
3–9 Figure 3–4: Relationship between the frequency and span settings 3–12 Figure 3–5: SETUP keys for setting reference level ....3–13 WCA330 & WCA380 User Manual... - Page 15 ....3–74 Figure 3–41: Example of a trigger mask pattern ....3–75 viii WCA330 & WCA380 User Manual...
- Page 16 ........3–139 WCA330 & WCA380 User Manual...
- Page 17 ........3–211 Figure E–1: Front panel interface for mouse operations ... E–1 WCA330 & WCA380 User Manual...
- Page 18 ....E–7 Figure E–6: Moving the marker and selecting a frame ... . E–8 WCA330 & WCA380 User Manual...
- Page 19 Table 2–33: SelfCal menu table ....... 2–116 WCA330 & WCA380 User Manual...
- Page 20 ........B–4 xiii WCA330 & WCA380 User Manual...
- Page 21 ..E–9 Table F–1: External inspection check list ..... . . F–2 WCA330 & WCA380 User Manual...
- Page 22 Observe Standard Precautions for Lifting Heavy Objects. The product weighs more than 30 kg. To avoid falling or injury, carry the product with two or more people. WCA330 & WCA380 User Manual...
- Page 23 WARNING indicates an injury hazard not immediately accessible as you read the marking. CAUTION indicates a hazard to property including the product. Symbols on the Product. The following symbols may appear on the product: WARNING Protective Ground CAUTION High Voltage (Earth) Terminal Refer to Manual WCA330 & WCA380 User Manual...
- Page 24 Use Care When Servicing With Power On. Dangerous voltages or currents may exist in this product. Disconnect power, remove battery (if applicable), and disconnect test leads before removing protective panels, soldering, or replacing components. To avoid electric shock, do not touch exposed connections. xvii WCA330 & WCA380 User Manual...
- Page 25 Service Safety Summary xviii WCA330 & WCA380 User Manual...
- Page 26 Preface About This Manual This user manual is for the WCA330 and WCA380 Wireless Communication Analyzers. This manual consists of the following sections: H Getting Started contains the product overview and describes the architecture, installation, and calibration of the analyzer.
- Page 27 GPIB commands allow you to control the instrument from a PC remotely. H WCA330 and WCA380 Service Manual (070-A795-XX, optional accessory) describes how to verify the characteristics of, adjust, disassemble, assemble, and troubleshoot the analyzer, and contains the information required for repair, including module replacement, and calibration.
- Page 28 This phone number is toll free in North America. After office hours, please leave a voice mail message. Outside North America, contact a Tektronix sales office or distributor; see the Tektronix web site for a list of offices. WCA330 & WCA380 User Manual...
- Page 29 Preface xxii WCA330 & WCA380 User Manual...
- Page 30 Getting Started...
-
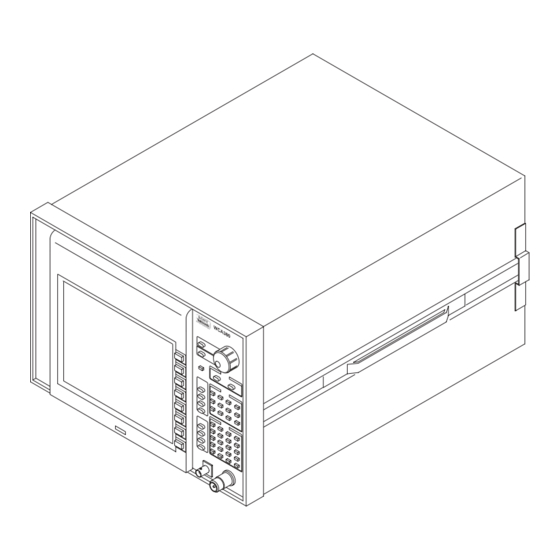
Page 32: Figure 1-1: Wca330/Wca380 Wireless Communication Analyzer
Product Overview WCA330 and WCA380 are wireless communication analyzers equipped with a 3 GHz/8 GHz down-converter to analyze Radio Frequency (RF) signals. The newly adopted architecture allows concurrent acquisition of time and frequency domain data and display of measurement results in color. The analyzer provides a wide variety of functions such as spectrum, power, analog and digital modulation, and CDMA analyses. - Page 33 Features The analyzer has the following features: H Measurement frequency range: DC to 3 GHz for the WCA330 DC to 8 GHz for the WCA380 H Measurement span: 100 Hz to 3 GHz H Concurrent processing of real-time frequency and modulation analysis...
- Page 34 WCA330 ..DC to 3 GHz WCA380 ..DC to 8 GHz The descriptions in this manual apply to both the WCA330 and the WCA380, unless otherwise noted. WCA330 & WCA380 User Manual...
-
Page 35: Figure 1-2: Signal Processing System Block Diagram
GPIB interface Twin IQ signal FIFO processor A/D converter input TFT controller TFT display Wideband Digital trigger Data memory digital filter comparator FIFO Controller Trigger signal input Figure 1-2: Signal processing system block diagram WCA330 & WCA380 User Manual... - Page 36 Converts the RF signal, input at the front-panel RF INPUT, into a 10 MHz IF Down Converter signal. The bandwidth is 3 GHz for the WCA330 and 8 GHz for the WCA380. The signal output from the down converter is sent to the succeeding block, i.e., analog front end.
- Page 37 Block mode. The pre-trigger and post-trigger positions can be set optionally; the phenomenon before and after the trigger event can be measured. WCA330 & WCA380 User Manual...
- Page 38 A 12.1 inch XGA TFT-LCD module is used. This color display has a sufficient resolution for multi-windows, and can display 17 formats. You can select up to eight formats and display four of them together. WCA330 & WCA380 User Manual...
- Page 39 Product Overview WCA330 & WCA380 User Manual...
- Page 40 For a list of accessories, refer to Standard Accessories on page A–2. If you find any damaged or missing components, contact your local Tektronix representatives. 3. It is recommended that the container and packing materials be stored in a safe place.
-
Page 41: Figure 1-3: Ac Inlet On The Rear Panel
The metallic section on the surface of the analyzer is connected to a power supply protective ground terminal through a power cord ground line. To prevent electrical shocks, insert the plug into an outlet that has a protective ground line. 1-10 WCA330 & WCA380 User Manual... -
Page 42: Figure 1-4: Mouse Connector Location (Rear Panel)
H When you want to operate with a mouse instead of the front panel. Refer to Appendix E for the mouse operations. H When Windows 98 displays a dialog box for maintaining the operating system (for example, changing the time). Mouse connector Figure 1-4: Mouse connector location (rear panel) 1-11 WCA330 & WCA380 User Manual... -
Page 43: Figure 1-5: Principal Power Switch On The Rear Panel
Standby LED Power switch Figure 1-6: Power switch (ON/STANDBY) When you power on the analyzer, Windows 98 is booted and then applications are started. The STANDBY LED goes out after blinking for a while. 1-12 WCA330 & WCA380 User Manual... -
Page 44: Figure 1-7: New Clock Settings Dialog Box
(Digital Down Converter) board is installed. Upon completion, it displays the result as shown in Figure 1–8. When Fail” or Not installed” is displayed, contact your local Tektronix representatives. Figure 1-8: Display of self test results upon power up (upper left of screen) 1-13 WCA330 & WCA380 User Manual... - Page 45 Installation and Power On The following initial screen appears, as shown in Figure 1–9. Figure 1-9: Initial screen 1-14 WCA330 & WCA380 User Manual...
-
Page 46: Figure 1-10: Angular Adjustment Of Tilt Display
If you want to return the display into the main cabinet, continue to press the bottom of the display until you hear a click. See Figure 1–10. Release bar Figure 1-10: Angular adjustment of tilt display 1-15 WCA330 & WCA380 User Manual... - Page 47 When the power cord remains unplugged from the AC outlet, or no voltage is being supplied to the AC outlet, be sure to keep the power switch in the STANDBY position. 1-16 WCA330 & WCA380 User Manual...
- Page 48 2. If no error is detected, applications on the analyzer are started. If an error is detected, refer to an appropriate Windows manual. For how to access Windows on the analyzer, refer to Using Windows 98 on page 3–195. 1-17 WCA330 & WCA380 User Manual...
- Page 49 It is not recommended that you install other applications including Internet Explorer, Word, and Excel on the analyzer. If you do so, you must keep this in mind. 1-18 WCA330 & WCA380 User Manual...
- Page 50 H Self gain-calibration H IQ offset calibration H Wide IQ balance calibration H Wide IQ full calibration H Diagnostics H Characteristic checks When an error occurs during above process, contact your local Tektronix representative. 1-19 WCA330 & WCA380 User Manual...
-
Page 51: Figure 1-11: Displaying Uncal
The calibration runs. It takes several seconds to complete the process. 4. If you press the AutoGainCal side key to select On, calibration will run automatically anytime the analyzer gain drifts to an UNCAL state. 1-20 WCA330 & WCA380 User Manual... -
Page 52: Figure 1-12: Running The Self Gain-Calibration
1. Press the UTILITY key in the front panel CONFIG area. See Figure 1–12. 2. Press the Util A [SelfCal] side key. 3. Press the Wide IQ Balance Cal side key. Calibration runs. It takes several seconds to complete the process. 1-21 WCA330 & WCA380 User Manual... -
Page 53: Figure 1-13: Running Calibration And Diagnostics
Calibration runs. It takes several minutes to complete the process. [config] <- VIEW area Mode: C key Digital Demod Calibration side key Calibration CONFIG area MODE key Diag Diag side key RF INPUT (N type connector) Figure 1-13: Running calibration and diagnostics 1-22 WCA330 & WCA380 User Manual... -
Page 54: Table 1-1: Internal Diagnostic Program
3. Press the MODE key in the front panel CONFIG area. See Figure 1–13 on page 1-22. 4. Press the More... side key twice. 5. Press the Diag side key. 6. Press the C key in the front panel VIEW area. 1-23 WCA330 & WCA380 User Manual... - Page 55 8. Press the Execute All side key to perform a test on every item. Press the side key that corresponds to each test item to perform a test once. Refer to Table 1–1 on Page1–23. 1-24 WCA330 & WCA380 User Manual...
-
Page 56: Figure 1-14: Execution Results Of Diagnostic Routines (View C)
Figure 1-14: Execution results of diagnostic routines (View C) Characteristics Check The electrical characteristics listed in Appendix B, Specifications, can be checked only by our service personnel. If you need a characteristics check, contact your local Tektronix representative. 1-25 WCA330 & WCA380 User Manual... - Page 57 Calibration and Diagnostics 1-26 WCA330 & WCA380 User Manual...
- Page 58 Operating Basics...
- Page 60 Interface Maps This section lists the names of the front- and rear-panel components and their functions. Following the descriptions of the menu operations, this section also gives brief descriptions of the menu item functions. WCA330 & WCA380 User Manual...
-
Page 61: Figure 2-1: Front Panel Map (Left Part)
Refer to page 3-202 for making a hardcopy of the screen image. Refer to page 1-9 for powering on and off. Refer to page 3-206 for capturing the display data into DTP software. Figure 2-1: Front panel map (left part) WCA330 & WCA380 User Manual... -
Page 62: Figure 2-2: Front Panel Map (Right Part)
NOTE: Inputting a signal of more than +30 dBm may damage the instrument. Refer to page B-9 for the specifications for external trigger input. Refer to page B-3 for the input specification. Figure 2-2: Front panel map (right part) WCA330 & WCA380 User Manual... -
Page 63: Figure 2-3: Rear Panel Map
GPIB controls. Mouse, keyboard, and LAN interface conducted only by our service personnel. From the top: When required, contact your local Tektronix H PC/AT keyboard connector (6 pin mini DIN) representatives. H PS/2 mouse connector (6 pin mini DIN) H LAN Ethernet connector (10/100BASE T) Refer to Appendix E for mouse and keyboard operation. -
Page 64: Figure 2-4: Display Screen Configuration
Refer to page 3-31 for setting up the view. When you select the menu item specifying file save or load, this area displays the dialog box allowing file access. Refer to page 3-178 for file access. Figure 2-4: Display screen configuration WCA330 & WCA380 User Manual... -
Page 65: Figure 2-5: View General Display Information
For the SymbolTable view, it displays nothing. For the views other than Polar, EyeDiagram, and SymbolTable, the horizontal axis is divided into 10 divisions. Figure 2-5: View general display information WCA330 & WCA380 User Manual... -
Page 66: Figure 2-6: Status Display Areas
Table 2–1 on the next page. Status messages are displayed in red or blue. Those displayed in red are warning messages. UNCAL OVERLOAD TRIGGERED PAUSE REMOTE Hardware status display area Setup status display area VECTOR SEAMLESS Figure 2-6: Status display areas WCA330 & WCA380 User Manual... -
Page 67: Table 2-1: Status Display
This field is blue when data is acquired seamlessly. That is there is no gap between frames. It is always seamless in the Zoom mode. In other modes, it depends on the frame period setting. Refer to page 3-26 for details. WCA330 & WCA380 User Manual... -
Page 68: Figure 2-7: Setup Display Area
RF1 Normal AC Freq HW 1024 Blackman 80u (160u) 200 Auto On 1 Freq Int Rise 50% Figure 2-7: Setup display area NOTE. When you connect a mouse to the analyzer, the Windows 98 task bar may hide the setup display area. WCA330 & WCA380 User Manual... -
Page 69: Table 2-2: Setup Display Items
Trigger count value SETUP:Trigger...Õ Times Trigger domain SETUP:Trigger...Õ Domain Trigger source SETUP:Trigger...Õ Source Trigger polarity SETUP:Trigger...Õ Slope Trigger position SETUP:Trigger...Õ Pos The arrow (Õ) indicates that the one pointed to is at the next lower level. 2-10 WCA330 & WCA380 User Manual... -
Page 70: Figure 2-8: Menu Display Area And Keys
H SETUP menu sets frequency, span, reference level, and other parameters. H VIEW menu controls waveform display and marker operation. SETUP menu keys VIEW control keys Side keys Menu display area CONFIG menu keys Figure 2-8: Menu display area and keys 2-11 WCA330 & WCA380 User Manual... -
Page 71: Figure 2-9: Config Menu Keys
Span menu item for selection. When you press this key, the SETUP:Freq,Span,Ref... submenu appears and you can input a numeric value in the Ref menu item. Figure 2-10: SETUP menu keys 2-12 WCA330 & WCA380 User Manual... -
Page 72: Figure 2-11: View Keys
For example, to use the markers for View B, do these steps to display the marker submenu: 1. Press the B key. 2. Press the MKR key. Refer to page 2–63 and below for details on the VIEW menus. Refer to page 3–31 for how to display data. 2-13 WCA330 & WCA380 User Manual... -
Page 73: Figure 2-12: Examples Of Top Menu Item Display
Figure 2-12: Examples of top menu item display The second through eighth menu items in the displayed menu are used to set or select a menu item or to move to a submenu. Figure 2–13 shows many of the menu items. 2-14 WCA330 & WCA380 User Manual... -
Page 74: Figure 2-13: Examples Of Lower Menu Item Display
Toggle menu items switch between the two displayed options when you press the associated side key. Slope Rise Fall Menu items without labels do not cause any response. Figure 2-13: Examples of lower menu item display 2-15 WCA330 & WCA380 User Manual... -
Page 75: Figure 2-14: Menu Items Requiring Selection Or Numeric Input
Figure 2-15: Drop down list for selecting an item 2. Turn the general purpose knob to move the blue item within the drop-down listing, and select an item. Alternatively, you can use the Y and B keys for the selection. 2-16 WCA330 & WCA380 User Manual... -
Page 76: Figure 2-16: Side Menu Item For Numeric Setting
You can delete a digit using the BS or a selection with the CLEAR key. b. Press the unit key to establish the input. The new values are immediately reflected in the analyzer settings or views. 2-17 WCA330 & WCA380 User Manual... -
Page 77: Figure 2-17: Step Keys
Y and B keys. When necessary, repeat steps c and d to obtain a desired value more quickly. The established values are immediately reflected in the analyzer settings. 2-18 WCA330 & WCA380 User Manual... -
Page 78: Tutorial
H Using averaging and compared displays H Using peak search and zoom functions H Using delta markers H Powering down These procedures assume that the installation procedure beginning on page 1–9 has already been completed. 2-19 WCA330 & WCA380 User Manual... -
Page 79: Preparations
Refer to Connecting the Mouse on page 1–11. 2. Connect the signal generator output through the cable to the RF INPUT connector on the front panel (see Figure 2–19). RF INPUT (N type connector) Figure 2-19: Cable connection 2-20 WCA330 & WCA380 User Manual... -
Page 80: Applying Power
2. Press the principal power switch found on the rear panel of the analyzer, then press the power switch (ON/STANDBY) shown in Figure 2–20 to toggle the analyzer into operation. Power switch Figure 2-20: Power switch 2-21 WCA330 & WCA380 User Manual... - Page 81 Tutorial The analyzer should boot up with the initial screen shown in Figure 2–21. This concludes the analyzer preparation tutorial. Figure 2-21: Initial screen 2-22 WCA330 & WCA380 User Manual...
-
Page 82: Configuring The Analyzer With Basic Configuration Patterns
This key selects measurement of the spectrum with a default span of 3 GHz and a center frequency of 1.5 GHz. The display in Figure 2–21 is unchanged because the initial screen defaults to the Spectrum. 2-23 WCA330 & WCA380 User Manual... - Page 83 1. Press the ROLL key on the front panel. See Figure 2–23. ROLL key Figure 2-23: Control of the start and stop of measurement Figure 2–24 shows an example of the spectrum display. Figure 2-24: Spectrum measurement with a span of 3 GHz 2-24 WCA330 & WCA380 User Manual...
- Page 84 Press the ROLL key to stop the measurement. If PAUSE is blue, the data acquisition is stopped. If it is gray, the data acquisition is in progress. UNCAL OVERLOAD TRIGGERED PAUSE REMOTE Status display area Figure 2-25: Status display area 2-25 WCA330 & WCA380 User Manual...
-
Page 85: Measuring A Digitally-Modulated Signal
3 GHz and a center frequency of 1.5 GHz. It now displays the spectrum, spectrogram, vector (constellation), and EYE pattern in the four views. Spectrum display area Vector display area Spectrogram display area Eye diagram display area Figure 2-26: Four view display for digital modulation analysis 2-26 WCA330 & WCA380 User Manual... - Page 86 (3 GHz) that the analyzer cannot capture the digitally-modulated signal. These views can be obtained by specifying a proper span and center frequency. Figure 2-27: Measuring the digitally modulated signal - Span 3 GHz 2. Stop the Roll mode acquisition . 2-27 WCA330 & WCA380 User Manual...
-
Page 87: Changing Hardware Settings
Figure 2-28: SETUP:FREQ key location The Freq, Span, Ref... submenu is displayed in the menu display area. Note that numeric input in the Freq menu item is already available for adjustment. See Figure 2–29. 2-28 WCA330 & WCA380 User Manual... - Page 88 Clear all characters from an input field or dismiss the drop down list. Clear the character preceding the caret or clear the field being displayed in blue. Figure 2-30: Numeric input keypad 2-29 WCA330 & WCA380 User Manual...
- Page 89 Unlike the Roll mode, the Block mode requires a longer time to display the data. This is because the data is displayed only after enough is acquired to fill the specified block size. After acquiring one block of data, the analyzer displays the data. 2-30 WCA330 & WCA380 User Manual...
- Page 90 If it is in gray, the data capture is in progress. UNCAL OVERLOAD TRIGGERED PAUSE REMOTE Hardware status display area Setting status display area VECTOR SEAMLESS If SEAMLESS is blue, this indicates that the data is being captured continuously. Figure 2-32: Setup display areas 2-31 WCA330 & WCA380 User Manual...
- Page 91 Note how the display diagram changes. Spectrum display Vector display (Waveform view) (Polar view) Spectrogram display Eye diagram (Spectrogram view) (EyeDiagram view) Figure 2-33: Views resulting from changes to the frequency and span settings 2-32 WCA330 & WCA380 User Manual...
-
Page 92: View Definitions And Layout
(see Figure 2–34). [config] <- View: Action Assign Show CONFIG area View A Waveform CONFIG:VIEW key View B Spectrogram View C Polar View D View D side key EyeDiagram Figure 2-34: CONFIG:VIEW key and its submenu 2-33 WCA330 & WCA380 User Manual... - Page 93 Select Waterfall from the drop-down listing by turning the general purpose knob. c. Press the View D side key again to enable the view settings. Figure 2–36 shows an example of the views with the new settings. 2-34 WCA330 & WCA380 User Manual...
- Page 94 Tutorial Waterfall view Figure 2-36: Making changes to View D 2-35 WCA330 & WCA380 User Manual...
- Page 95 Press the B key in the VIEW area (see Figure 2–38). View B is displayed fully on the screen. See Figure 2–39. VIEW area View selection keys View layout selection keys Figure 2-38: VIEW keys (view control keys) 2-36 WCA330 & WCA380 User Manual...
- Page 96 Try pressing the A to D keys in the VIEW area. d. Try pressing the , and keys and the A to D keys in various combinations to see the possible view configurations. 2-37 WCA330 & WCA380 User Manual...
-
Page 97: Averaging And Compared Display
BLOCK key displays the original spectrum without averaging. The averaged waveform is displayed on the screen. With the averaging parameter settings above, the process stops after 64 sweeps. If you want to restart the averaging, press the Reset side key. 2-38 WCA330 & WCA380 User Manual... - Page 98 Select Active using the general purpose knob. View A displays a green and a yellow trace (see Figure 2–40). The white trace represents the non-averaged waveform and the grayish trace the averaged waveform. 2-39 WCA330 & WCA380 User Manual...
-
Page 99: Peak Search And Zoom
800 MHz and 100 kHz, respectively. If you changed these settings previously, they will not be reset when you change acquisition or display modes. To set them, follow the steps listed on pages 2–28 and 2–30. 2-40 WCA330 & WCA380 User Manual... - Page 100 Press the VIEW:SRCH key. The marker (V) is positioned at the maximum signal peak. The marker frequency in View A becomes the center frequency for zooming in View C in the next step. 2-41 WCA330 & WCA380 User Manual...
- Page 101 In View D, the number of displayed frames is [(block size)/(expansion factor) – 1] (In this case, 200/100–1=1). You can repeat steps c and d for different expansion factors. Before zoom After zoom Figure 2-42: Example of zooming 2-42 WCA330 & WCA380 User Manual...
-
Page 102: Delta Markers
1. For better visibility, change View C to a single view display: a. Press the VIEW:C key. b. Press the VIEW: key. View C changes to single view display. See Figure 2–43. Figure 2-43: Moving the markers by peak search 2-43 WCA330 & WCA380 User Manual... - Page 103 Position the delta markers for a measurement. Markers 3. Operate the delta markers: a. Press the VIEW:MKR key. b. Press the Delta Marker side key and select On. The delta markers (V and Z) turn on. 2-44 WCA330 & WCA380 User Manual...
- Page 104 At the top left corner, the view shows the differences in frequency and power resulting from the delta marker measurement. See Figure 2–44. Result of delta marker measurement Delta markers Figure 2-44: Measurement example using the delta markers 2-45 WCA330 & WCA380 User Manual...
-
Page 105: Turning Off The Power
1. Press the power switch at the bottom left corner of the front panel to select the STANDBY position. The Windows 98 shutdown process runs and powers down the analyzer. 2. Turn off the signal generator. You have completed the tutorial. 2-46 WCA330 & WCA380 User Manual... -
Page 106: Menu Functions
3. Analyze the signal while making fine SETUP:FREQ VIEW:MKR changes to the settings. SETUP:REF VIEW:SRCH Data memory Time or frequency Display/analysis Input signal Signal process block domain signal block Data register Figure 2-45: Signal process and display blocks 2-47 WCA330 & WCA380 User Manual... -
Page 107: Config Menu
Configures the analyzer for the dual (frequency and time) mode. For the dual mode, refer to Memory Mode on page 3-5. Zoom Configures the analyzer for the zoom mode. For the zoom mode, refer to Memory Mode on page 3-5. 2-48 WCA330 & WCA380 User Manual... - Page 108 Communication). For details, refer to GSM Analysis on page 3-151. Calibration Executes the auto calibration. For details, refer to Wide IQ full calibration on page 1-22. Diag Executes the internal diagnostic routines. For details, refer to Diagnosis on page 1-23. 2-49 WCA330 & WCA380 User Manual...
- Page 109 Enables frame by frame time series display along the vertical axis. In each spectrum, the horizontal axis represents frequency, amplitude or phase in color. This is called color spectrogram display". For detailed settings, refer to page 2-72. 2-50 WCA330 & WCA380 User Manual...
- Page 110 For detailed settings, refer to page 2-92. CodePower This view has basically the same functions as the Waveform view except for the cdmaOne compliant analysis functions. For detailed settings, refer to page 2-93. 2-51 WCA330 & WCA380 User Manual...
- Page 111 For detailed settings, refer to page 2-115. Script related view Script The analyzer supports the scripting language. You can create a script program to add and customize side keys or automate measurement. For details, refer to the Programmer Manual. 2-52 WCA330 & WCA380 User Manual...
- Page 112 The analyzer incorporates no function by factory default. Util H [Remote] Displays the remote control menu. The menu allows you to set up communication parameters between the analyzer and external devices. For details, refer to the Programmer Manual. 2-53 WCA330 & WCA380 User Manual...
-
Page 113: Setup (Standard) Menu
Processes data in the frequency domain only. Dual Processes data in both the frequency and time domains. Zoom Processes data in both the frequency and time domains, and expand the waveform around a specified center frequency. 2-54 WCA330 & WCA380 User Manual... - Page 114 When you select Mixer in Manual above, select the level. The mixer level depends on the Band setting: RF (WCA330) / RF1, RF2 (WCA380): -5, -10, -15, -20, -25 dBm RF3, RF4 (WCA380): -5, -15, -25 dBm Select the level necessary for your measurement. The default is -25 dBm. Normally, use the default.
- Page 115 When you select RF Att in Manual above, select the level. The RF attenuator level depends on the Band setting: RF (WCA330) / RF1, RF2 (WCA380): 0 to 50 dB in 0 2 5 7 step. RF3, RF4 (WCA380): 0, 10, 20, 30, 40, 50 dB...
- Page 116 Sets the timeout value when the trigger mode is set to Timeout. The range is 0 to 60 s. Timeout Interval Sets the time interval when the trigger mode is set to Interval or Quick Interval. The range is 1 to 3600 s. 2-57 WCA330 & WCA380 User Manual...
- Page 117 Mkr->Freq side key in the view menus shown in page 2-63 and the subsequent pages. Selects the expansion factor: 5 MHz span: 2/5/10/20/50/100/200/500/1000 Other than 5 MHz span: 2/4/10/20/40/100/200/400/1000 Execute Executes zoom. You can repeat execution while changing the above settings. 2-58 WCA330 & WCA380 User Manual...
-
Page 118: Setup (Cdma) Menu
Refer to Reference Level on page 3-13 for details. Max Span Sets the maximum span. Reference Osc Selects Internal or External for the reference clock. Same as Reference Osc in SETUP (Standard) menu on page 2-56. 2-59 WCA330 & WCA380 User Manual... - Page 119 Refer to Trigger on page 3-65 for details. Trigger Level Sets the trigger level in the time domain when you have selected 5 MHz Span Normal Trig. The range is -40 dB to 0 dB. 2-60 WCA330 & WCA380 User Manual...
-
Page 120: Setup (3Gppacp) Menu
Sets a reference level. It must be greater than the maximum level of an input signal. If an overload occurs, the measured data will be invalid. Refer to Reference Level on page 3-13 for details. 2-61 WCA330 & WCA380 User Manual... - Page 121 When you select RF Att in Manual above, select the level. The RF attenuator level depends on the Band setting: RF (WCA330) / RF1, RF2 (WCA380): 0 to 50 dB in 0 2 5 7 step. RF3, RF4 (WCA380): 0, 10, 20, 30, 40, 50 dB...
-
Page 122: Waveform View Menu
Selects the maximum and minimum values from the data for each pixel and connect the values with a line. Displays the maximum value of the data for each pixel. Displays the minimum value of the data for each pixel. 2-63 WCA330 & WCA380 User Manual... - Page 123 Averages the data written in memory in the Roll or Block mode. This item does not depend on the settings of Average On/Off. Reset Restarts the averaging that has been started with Average On. 2-64 WCA330 & WCA380 User Manual...
- Page 124 Used to display two waveforms concurrently. The Trace2... submenu sets up the second waveform. Source Same as Source on page 2-63. Format Same as Format on page 2-64. Frame Same as Frame on page 2-64. 2-65 WCA330 & WCA380 User Manual...
- Page 125 Frame Relative frame is set to zero. See Figure 2-46 on page 2-68. On specifies that the origin of the time axis for each frame is set to zero. Off uses the ordinary time axis. 2-66 WCA330 & WCA380 User Manual...
- Page 126 Searches for the maximum peak spectrum and moves the V marker there. Searches for the minimum peak spectrum and moves the V marker there. This item is available when Format is other than FreqAmpl. 2-67 WCA330 & WCA380 User Manual...
- Page 127 (Example) Figure 2-46: Frame Relative On and Off 10 % Example. Separation = 10 % Two peaks can be detected. Two peaks can not be detected. Full scale (100 %) Figure 2-47: Separation setting 2-68 WCA330 & WCA380 User Manual...
-
Page 128: Analog View Menu
Demodulates the frequency modulated signal. Horizontal axis: Time; Vertical axis: Frequency. Frame Specifies the number of the frame to be displayed. By default, it is set to frame 0 into which the current data is written. 2-69 WCA330 & WCA380 User Manual... - Page 129 Sets the minimum horizontal distance to separate two peaks. Same as Separation in the Waveform view menu on page 2-68. Delta Marker Turns the delta marker on or off. Toggle Delta Changes the V and Z marker positions each other. 2-70 WCA330 & WCA380 User Manual...
-
Page 130: Fsk View Menu
Specifies the number of the frame to be displayed. By default, it is set to frame 0 into which the current data is written. Options... Same as Options... in the Analog view menu on page 2-70. 2-71 WCA330 & WCA380 User Manual... -
Page 131: Spectrogram View Menu
By default, it is set to frame 0 into which the current data is written. Sets the start value of the vertical axis (i.e. frame number). Ver. Start By default, it is set to frame 0 into which the current data is written. 2-72 WCA330 & WCA380 User Manual... - Page 132 Sets the center frequency to the value at the current marker position. When you press this side key, the Freq, Span, Ref... Õ Freq setting in the SETUP menu changes to the frequency at the current marker position. 2-73 WCA330 & WCA380 User Manual...
- Page 133 When you press this side key, the Freq, Span, Ref...Õ Freq setting in the SETUP menu changes to the frequency at the current marker position. Ver. Mag Sets the number of vertical pixels to display one frame. The range is 1 to 10. 2-74 WCA330 & WCA380 User Manual...
-
Page 134: Waterfall View Menu
Sets the vertical (amplitude) full scale of one frame in pixel for displaying. The range is 1 to 100 pixels. Specifies the interval between adjacent waveforms on screen. The range is 1 to 100 pixels. 2-75 WCA330 & WCA380 User Manual... -
Page 135: Polar View Menu
Specifies 16QAM (Quadrature Amplitude Modulation) modulation. 64QAM Specifies 64QAM (Quadrature Amplitude Modulation) modulation. 256QAM Specifies 256QAM (Quadrature Amplitude Modulation) modulation. GMSK Specifies GMSK (Gaussian filtered Minimum Shift Keying) modulation. GFSK Specifies GFSK (Gaussian filtered Frequency Shift Keying) modulation. 2-76 WCA330 & WCA380 User Manual... - Page 136 Sets the width of the mask range with Center described above. Left [Hz] Sets the left edge frequency of the mask range with Right described below. Right [Hz] Sets the right edge frequency of the mask range with Left described above. 2-77 WCA330 & WCA380 User Manual...
- Page 137 Specifies the number of the frame to be displayed after a trigger event. If this frame number agrees with the trigger position specified with Setup Õ Trigger... Õ Pos, the frame for which a trigger is generated is displayed. By default, Position is set to zero (current frame). 2-78 WCA330 & WCA380 User Manual...
-
Page 138: Eyediagram View Menu
Sets the length of the symbol to be displayed. This is the scale setting for the horizontal axis. The time length required for symbol to symbol movement is defined as 1. The range is 1 to 16. Marker Inputs the time to move the V marker. 2-79 WCA330 & WCA380 User Manual... -
Page 139: Symboltable View Menu
Converts the symbol data currently being displayed into the text form to copy it to a text file. For details, refer to page 3-206. D1 to D8 Selects a data register in which the symbol data currently being displayed is saved temporarily. 2-80 WCA330 & WCA380 User Manual... -
Page 140: Evm View Menu
Inputs the symbol position to place the V marker. The range is 0 to the number of symbols -1. Delta Marker Turns the delta marker on or off. Toggle Delta Changes the V and Z marker positions each other. 2-81 WCA330 & WCA380 User Manual... - Page 141 Example. Mask Percent = 10 In this example, 10 % area of both ends are excluded from the EVM calculation. 10 % 10 % Figure 2-48: Setting Mask Percent for the EVM calculation 2-82 WCA330 & WCA380 User Manual...
-
Page 142: Cdmawaveform View Menu
IS 95 standard. For detail, refer to Specified Line Settings on page 3-119. Display Lines... Controls the horizontal and vertical line markers. Same as Display Lines... in the Waveform view menu on page 2-65. 2-83 WCA330 & WCA380 User Manual... - Page 143 Searches for the maximum peak spectrum and moves the marker there. Searches for the minimum peak spectrum and moves the marker there. This item is available when Format is other than FreqAmpl. 2-84 WCA330 & WCA380 User Manual...
- Page 144 Selects either IS 95 or T 53 standard. Channel Specifies the measurement channel. Displays the specified mask line of the specified channel. By default, the channel matches the one you specify in SETUP (CDMA) Õ Freq, Span, Ref..2-85 WCA330 & WCA380 User Manual...
-
Page 145: Cdmapolar View Menu
Specifies 256QAM (Quadrature Amplitude Modulation) modulation. GMSK Specifies GMSK (Gaussian filtered Minimum Shift Keying) modulation. GFSK Specifies GFSK (Gaussian filtered Frequency Shift Keying) modulation. CDMA_OQPSK Specifies CDMA OQPSK (Offset QPSK) used in the IS 95 standard. 2-86 WCA330 & WCA380 User Manual... - Page 146 Sets the burst search parameters. Same as Burst... in the Polar view menu on page 2-77. Mask... Specifies the frequency range to be processed. Same as Mask... in the Polar view menu on page 2-77. Options... Same as Options.. in the Polar view menu on page 2-78. 2-87 WCA330 & WCA380 User Manual...
-
Page 147: Cdmatime View Menu
Hold Ver. Scale Specifies whether you retain or reset the scale setting of the vertical axis when you change the input source. Same as Hold Ver. Scale in the Waveform view menu on page 2-66. 2-88 WCA330 & WCA380 User Manual... - Page 148 Measures the CDMA time characteristic for the data already contained in memory. It is useful, for example, when you loaded the data from a file. To abort the measurement after you press Measure side key, press the Break side key. 2-89 WCA330 & WCA380 User Manual...
-
Page 149: Codespectrogram View Menu
According to the cdmaOne standard, this view displays each channel power measured for each symbol in color with channel along the horizontal axis and symbol (time) along the vertical axis. For details on cdmaOne analysis, refer to page 3–127. 2-90 WCA330 & WCA380 User Manual... -
Page 150: Table 2-19: Codespectrogram View Menu Table
Turns the delta marker on or off. Toggle Delta Changes the V and Z marker positions each other. Ver. Mag Sets the number of vertical pixels to display one frame. The range is 1 to 10. 2-91 WCA330 & WCA380 User Manual... -
Page 151: Codepolar View Menu
Displays a data in vector format that represents chip to chip movements using a vector. Constellation Displays data in constellation format that represents only chips. Marker Inputs the time to move the V marker. Analyze Performs measurement for all the symbols on data memory. 2-92 WCA330 & WCA380 User Manual... -
Page 152: Codepower View Menu
Represents relative channel power to the total power along the vertical axis. Absolute Represents absolute channel power along the vertical axis. Display Lines... Controls the horizontal and vertical line markers. Same as Display Lines... in the Waveform view menu on page 2-65. 2-93 WCA330 & WCA380 User Manual... - Page 153 Specifies that the data is averaged for all the symbols. Mkr -> Symbol Sets Begin Symbol and End Symbol with the marker and delta marker. Average Type Same as Average Type above on the top menu level. Execute Executes averaging. 2-94 WCA330 & WCA380 User Manual...
-
Page 154: Codewspectrogram View Menu
According to the W-CDMA standard, this view displays each channel power measured for each slot in color with channel along the horizontal axis and slot (time) along the vertical axis. For details on W-CDMA analysis, refer to page 3–135. 2-95 WCA330 & WCA380 User Manual... -
Page 155: Table 2-22: Codewspectrogram View Menu Table
Turns the delta marker on or off. Toggle Delta Changes the V and Z marker positions each other. Ver. Mag Sets the number of vertical pixels to display one slot. The range is 1 to 10. 2-96 WCA330 & WCA380 User Manual... -
Page 156: Codewpolar View Menu
Same as Auto Carrier in the Polar view menu on page 2-77. Symbol Specifies how to display the constellation. Constellation Displays the constellation for one short code specified with Options...Õ Time Slot. Displays the constellation for all the signals. 2-97 WCA330 & WCA380 User Manual... - Page 157 Determines whether to hide or not the LMS in the last part of the data. On hides the LMS part, i.e. does not display the part. Analyze Performs the measurement for all time slots on the data memory. 2-98 WCA330 & WCA380 User Manual...
-
Page 158: Codewpower View Menu
Specifies that the averaging is done for all slots. Mkr -> Slot Sets Begin Slot and End Slot with the marker and delta marker. Average Type Same as Average Type above on the top menu level. Execute Executes averaging. 2-99 WCA330 & WCA380 User Manual... -
Page 159: 3Gppacpview Menu
Hor. Start Sets the horizontal axis start value. Ver. Scale Sets the vertical axis scale. Ver. Start Sets the vertical axis start value. Full Scale Sets the vertical scale to the default full scale. 2-100 WCA330 & WCA380 User Manual... - Page 160 Figure 2-49 on page 2-102. This menu item is displayed when you select OBW for Measurement. Set the ratio of the power in the specified band region to the power in the entire span region. 2-101 WCA330 & WCA380 User Manual...
- Page 161 Freq setting changes to the frequency in the current marker position. Filter SP sets the interval. Filter Alpha sets the filter shape factor. Filter BW sets the bandwidth. Frequency Figure 2-49: Setting the receive filter with the ACP... submenu 2-102 WCA330 & WCA380 User Manual...
-
Page 162: 3Gppspectrogram View Menu
(time) along the vertical axis. The menu is the same as the CodeWSpectrogram view menu on page 2–95. For detail on the 3GPP analysis, refer to page 3–143. 2-103 WCA330 & WCA380 User Manual... -
Page 163: 3Gpppolar View Menu
Determines whether to search the carrier automatically. Same as Auto Carrier in the Polar view menu on page 2-77. Symbol Specifies how to display the constellation. Constellation Displays the constellation for one short code. Displays the constellation for all signals. 2-104 WCA330 & WCA380 User Manual... - Page 164 Selects the display format. Same as Display in the Polar view menu on page 2-78. Marker Inputs the time to move the V marker. Analyze Performs the measurement for all time slots on the data memory. 2-105 WCA330 & WCA380 User Manual...
-
Page 165: 3Gpppower View Menu
For detail on the 3GPP analysis, refer to page 3–143. The menu is the same as the CodeWPower view menu on page 2–99. For detail on the 3GPP analysis, refer to page 3–143. 2-106 WCA330 & WCA380 User Manual... -
Page 166: Gsm View Menu
Specifies the number of the burst to display. This menu is shown when the number of bursts determines after pressing the Analyze side key. This menu is not available when Measurement is set to Spectrum (SW). 2-107 WCA330 & WCA380 User Manual... -
Page 167: Gsmpolar View Menu
Sets the burst search parameters. Same as Burst... in the Polar view menu on page 2-77. Burst... NOTE. Use the following default settings for the GSM measurement. Number Frames Search Block Size Peak Threshold Threshold -20 dB Offset 2-108 WCA330 & WCA380 User Manual... - Page 168 For the GSM measurement, the analyzer always set it to 61 (default). Analysis Sets the data length in bits for analysis and display. See Figure 2-50. Length For the GSM measurement, the analyzer always set it to 148 (default). 2-109 WCA330 & WCA380 User Manual...
- Page 169 By default, Position is set to zero (current frame). Sync Word Length Sync Word Position Sync word Data stream Analysis Length (Displayed on screen) Figure 2-50: Setting the sync word parameters 2-110 WCA330 & WCA380 User Manual...
-
Page 170: Gsmmask View Menu
Expands the rising edge of the waveform horizontally on screen. Falling Edge Expands the falling edge of the waveform horizontally on screen. Full Scale Sets the horizontal scale to full scale to display all data on the memory. 2-111 WCA330 & WCA380 User Manual... -
Page 171: Ccdf Menu
Menu Functions CCDF Menu Table 2–30 summarizes the menu when you have defined the view as CCDF in the CONFIG:VIEW menu. For CCDF analysis, refer to page 3–165. 2-112 WCA330 & WCA380 User Manual... -
Page 172: Table 2-30: Ccdf Menu Table
Specifies that the data is calculated for all frames. Mkr -> Frame Sets Begin Frame and End Frame with the marker and delta marker. Execute Executes the calculation. Reset This menu item is displayed during data acquisition. It restarts the CCDF calculation. 2-113 WCA330 & WCA380 User Manual... -
Page 173: Ccdfview Menu
Same as Marker... in the Analog view menu on page 2-70. Search... Searches for the peak spectrum and places the V marker there. Same as Search... in the Analog view menu on page 2-70. 2-114 WCA330 & WCA380 User Manual... -
Page 174: Autosave Menu
Specifies the name of the file to store the data. Save Frames Sets the number of frames to be stored in the RollSave mode. Counter Reset Resets the file counter. When you acquire data next time, the file name is suffixed to zero. 2-115 WCA330 & WCA380 User Manual... -
Page 175: Selfcal (Util A) Menu
When set to On, the analyzer will automatically run the internal calibration routines. Gain Cal Runs the auto calibration. IQ Offset Cal Compensates offset of I/Q input signals. Wide IQ Corrects DC balance of I/Q signals in the Wide IF mode. Balance Cal 2-116 WCA330 & WCA380 User Manual... -
Page 176: Saveload (Util B) Menu
Load From File Loads the data from the file that contains it in the IQ format. (*.IQ) Load From File Loads the data from the file that contains it in the AP format. (*.AP) 2-117 WCA330 & WCA380 User Manual... -
Page 177: Average (Util C) Menu
Selects one of the D1 to D8 data registers as the destination for storing the result. The default is D1. Mkr->Frame Sets the frame in the marker position to End Frame. Performs the averaging with RMS (root mean square). PeakHold Performs the peak hold. 2-118 WCA330 & WCA380 User Manual... -
Page 178: File Access Menu
Operates a file. Refer to File Menu Operations on page 3-178 for details. Copy File... Copies a file. Delete File... Deletes a file. Create Dir... Creates a new directory. Delete Dir... Deletes a directory. 2-119 WCA330 & WCA380 User Manual... -
Page 179: Print Menu
Top level Subordinate level, options and descriptions Cancel Returns to the menu previously displayed. Printer Selects a printer. Print To Printer Performs a hardcopy. Save To File Saves the hardcopy to a file. (*.BMP) 2-120 WCA330 & WCA380 User Manual... -
Page 180: Changing The Power-Up Settings
1. Press CONFIG:MODE Õ [Config]<– (the top side key) to display the Config menu. 2. Press the side key Power On...Õ Return To Defaults in order. The analyzer will start with the factory default from the next power-on. 2-121 WCA330 & WCA380 User Manual... - Page 181 Menu Functions 2-122 WCA330 & WCA380 User Manual...
- Page 182 Reference...
-
Page 184: Input And Memory Modes
Input and Memory Modes There are several input frequency bands: RF (for WCA330)/RF1 to RF4 (for WCA380), Baseband, and IQ. There are three intermediate frequency (IF) modes: Normal, HiRes, and Wide. There are four modes in which data is written into memory: Scalar, Frequency, Dual, and Zoom. -
Page 185: Selecting The Input Frequency Band
50 MHz to 3 GHz (IF mode: Wide) RF2 (WCA380) 2.5 GHz to 3.5 GHz RF3 (WCA380) 3.5 GHz to 6.5 GHz RF4 (WCA380) 5.0 GHz to 8.0 GHz Use the I/Q signals from the rear IQ input connectors. WCA330 & WCA380 User Manual... - Page 186 RF Mode. This mode uses the internal down-converter to process 10 MHz to 3 GHz (for WCA330)/8 GHz (for WCA380) signals. Generally, with a span of up to 6 MHz, data is acquired in one logical frame by one scan. If a span is greater than 6 MHz, data is acquired in one frame by two or more scans.
-
Page 187: Selecting The If Mode
FFT. You can specify the Normal mode when the input frequency band is set to Baseband or RF (for WCA330)/RF1 to 4 (for WCA380). HiRes Mode. This mode has a relatively narrow IF bandwidth of 6 MHz, but has the widest dynamic range. -
Page 188: Memory Modes: Scalar, Frequency, Dual, And Zoom
(see Figure 3–2). The block size (the number of frames) for each domain is reduced to half. You can set the frame period to any value. The number of FFT points is fixed at 1024. WCA330 & WCA380 User Manual... -
Page 189: Setting The Mode
Press SETUP:MAIN Õ Band. b. Use the general purpose knob to select the band you prefer from Baseband, RF (for WCA330)/RF1 to 4 (for WCA380), and IQ. 2. Select an IF mode: a. Press the IF Mode side key. -
Page 190: Mode Summary
The number of FFT points is 1024. When it is 256, the maximum span is 5 MHz. The mode is switched to Scalar by setting the span to 10 MHz or larger. 1 GHz when the input band is RF2. WCA330 & WCA380 User Manual... - Page 191 H Acquires signals in real-time (depending on the frame period). Dual mode H Analyzing analog or digital modulation. H Acquires signals in real-time (depending on the frame period). Zoom mode H Enlarging a particular frequency domain. WCA330 & WCA380 User Manual...
-
Page 192: Frequency And Span
H Press SETUP:Freq or SETUP:Span and enter the value using the general purpose knob or keypad. Set a frequency and span with the Freq, Span, Ref... submenu. Set a frequency. Set a span. Figure 3-3: SETUP keys for setting the frequency and span WCA330 & WCA380 User Manual... - Page 193 Upper limit of the frequency setting range (RF mode) v 10 MHz or 5 MHz (Baseband mode, depending on the memory mode) (Center frequency) – (Span)/2 w Lower limit of the frequency setting range (RF mode) w 0 Hz (Baseband mode) 3-10 WCA330 & WCA380 User Manual...
-
Page 194: Setting The Frequency With The Marker And Search
If you change another parameter and the combination is permitted, the buffered value takes effect and is reflected to the hardware. This buffering is made in frequency, span, and frame period settings. 3-11 WCA330 & WCA380 User Manual... - Page 195 Set span The frequency and span cannot be set as shown Set frequency in these two illustrations: Set span Set frequency Set span Figure 3-4: Relationship between the frequency and span settings 3-12 WCA330 & WCA380 User Manual...
-
Page 196: Reference Level
-30 to +30 dBm (1 dB steps) RF (WCA330) -52 to +30 dBm (1 dB steps) RF1, 2 (WCA380) RF3, 4 (WCA380) -50 to +30 dBm (1 dB steps) -10 to +20 dBm (10 dB steps) 3-13 WCA330 & WCA380 User Manual... -
Page 197: Overload
OVERLOAD turns red momentarily and then disappears. If you have made settings so that one scan uses one physical frame, a similar phenome- non may result when a single-shot signal occurs. 3-14 WCA330 & WCA380 User Manual... -
Page 198: Fft Parameters
H FFT type H FFT point H FFT window These parameters can be set by pressing the SETUP:MAIN key Õ Memory Mode, Input, FFT..This section explains each parameter and how to set it. 3-15 WCA330 & WCA380 User Manual... -
Page 199: Fft Type
RF1 to 4 Dual HW or SW 1024 (WCA380) (WCA380) Zoom HW or SW 1024 HiRes Scalar 1024 or 256 Dual 1024 Zoom 1024 Wide Zoom 1024 Wide Zoom 1024 HW: Hardware processing. SW: Software processing. 3-16 WCA330 & WCA380 User Manual... -
Page 200: Fft Window
For ordinary measurement, select the window capable of separating the desired frequency component. Such a window maximizes the accuracy with which to measure amplitude levels and minimizes leakage errors while separating each frequency component. 3-17 WCA330 & WCA380 User Manual... - Page 201 H Frequency resolution is improved by reducing the width of the main lobe window. H Accuracy of the amplitude levels of frequency components is improved by reducing side lobe level relative to the main lobe. 3-18 WCA330 & WCA380 User Manual...
-
Page 202: Setting Fft Parameters
Press the FFT Points side key. b. Turn the rotary knob to select 1024 or 256. 4. Select the FFT window: a. Press the FFT Window side key. b. Turn the rotary knob to select the FFT window. 3-19 WCA330 & WCA380 User Manual... - Page 203 FFT Parameters 3-20 WCA330 & WCA380 User Manual...
-
Page 204: Acquiring Data
Display . . . one frame one frame one frame Time Repeat by trigger count . . . Display Block mode Acquire one block (N frames) Time Figure 3-8: Roll mode and Block mode 3-21 WCA330 & WCA380 User Manual... -
Page 205: Setting The Block Size
Table 3–8. Table 3-8: Block size setting range FFT points Memory mode Block size Frequency 1 to 16000 frames Frequency 1 to 4000 frames 1024 Dual 1 to 2000 frames 1 to 2000 frames Zoom 3-22 WCA330 & WCA380 User Manual... -
Page 206: Starting/Stopping Data Acquisition
NOTE. In the RF mode, when you set the span to 10 MHz or larger, the Roll mode operates even if you press the BLOCK key. In the Baseband mode, whenever you press the BLOCK key, the Block mode operates. 3-23 WCA330 & WCA380 User Manual... - Page 207 Acquiring Data 3-24 WCA330 & WCA380 User Manual...
-
Page 208: Frame Period And Real Time
Use the following procedure to set the frame period: 1. Press the SETUP:MAIN key Õ the Frame Period side key. 2. Use the general purpose knob to increase or decrease the value, or enter a numeric value using the ENTRY keypad. 3-25 WCA330 & WCA380 User Manual... -
Page 209: Frame Period And Seamless Acquisition
Real-Time Acquisition. With 50 % or more of the frame length overlapped, FFT processing results in continuous spectrum. With less than 50 % of the frame length overlapped, the result is discontinuous spectrum (see Figure 3–14 on page 3–28). 3-26 WCA330 & WCA380 User Manual... - Page 210 Frame Period and Real Time Real-time acquisition is possible under the following conditions: Input band . . . Baseband and RF (for WCA330)/RF1 to 4 (for WCA380) Span ..5 MHz or less...
- Page 211 ..Time Figure 3-14: Real time acquisition in the frequency domain NOTE. If the span is set to 5 MHz or less in the Baseband or RF (WCA330)/RF1 to RF4 (WCA380) mode, data can be acquired in real time. 3-28...
- Page 212 200 Hz 3.2 s 50 ms 100 Hz 6.4 s 100 ms 1024 30 MHz 25 ms 25 ms 20 MHz 25 ms 25 ms IF mode: Wide 10 MHz 50 ms 50 ms 3-29 WCA330 & WCA380 User Manual...
- Page 213 Frame Period and Real Time 3-30 WCA330 & WCA380 User Manual...
-
Page 214: Displaying Waveform Data
Up to eight views can be defined. Up to four windows can be displayed simultaneously. This section discusses the following topics: H Setting views H Setting scales H Changing display frames H Relationship among frame, bin, and pixel 3-31 WCA330 & WCA380 User Manual... -
Page 215: Setting Views
Use the VIEW: A to D keys to select the view. For example, when you switch the view A to E, press the VIEW: A key twice while selecting the view A. Figure 3-16: Views A to H (2x2 display) 3-32 WCA330 & WCA380 User Manual... - Page 216 NOTE. When you specify None for Source in a view menu, the view is empty. Specifying the Layout on Select one of the view layout keys (see Figure 3–15) to define a view layout. the Screen 3-33 WCA330 & WCA380 User Manual...
- Page 217 Any one of the View B, D, F, and H is displayed. Ç Ç Ç Ç Ç Ç Ç Ç Ç Ç Ç Ç Ç Ç Ç Ç Ç Ç Ç Ç Ç Ç Ç Ç Ç Ç Figure 3-18: Two view display 3-34 WCA330 & WCA380 User Manual...
- Page 218 Ç Ç Ç Ç Ç Ç Ç É É É É É É É Ç Ç Ç Ç Ç Ç Ç É É É É É É É Figure 3-20: Four view display (2x2 display) 3-35 WCA330 & WCA380 User Manual...
-
Page 219: Setting Scales
Vertical axis: Set with Ver. Start Horizontal axis: Set with Hor. Start Color axis: Set with Color Start Set with Color Scale Set with Hor. Scale Color axis Horizontal axis View direction Figure 3-21: Setting scales 3-36 WCA330 & WCA380 User Manual... - Page 220 #0. The start value for each frame depends on the frame period. For detail on frame period, refer to Frame Period and Real Time on page 3–25. 3-37 WCA330 & WCA380 User Manual...
-
Page 221: Changing Display Frames
Three dimensional view default display frame Frame N Frame 3 Frame 2 Frame 1 Frame 0 * N = (Block size) × (Trigger count) - 1 Two dimensional view (default frame) Figure 3-22: Display frames 3-38 WCA330 & WCA380 User Manual... - Page 222 Press the VIEW:B key. b. Press the VIEW:MKR key. 2. Press the Ver. side key to change a numeric value. Use the general purpose knob to observe, in detail, the time-dependent variations in the spectrum. 3-39 WCA330 & WCA380 User Manual...
- Page 223 To enable or disable view linking, do the following procedure: H Press the CONFIG:VIEW key Õ the Options... side key Õ the Marker Link side key and select On or Off. On — Views are linked (default). Off — Views are independent. 3-40 WCA330 & WCA380 User Manual...
-
Page 224: Relation Among Frame, Bin, And Pixel
The bandwidth of one bin is calculated as follows. This bandwidth is important for power measurement as described on page 3–81. (Bandwidth of one bin) = (Set span) / [(Number of bins) –1] 3-41 WCA330 & WCA380 User Manual... - Page 225 In the following views, when you select one of the data register D1 to D8 for the view source, you can select a compression method in the Compression menu: Waveform view Spectrogram view Waterfall view CDMAWaveform view 3-42 WCA330 & WCA380 User Manual...
- Page 226 MinMax Removes the minimum and maximum data points for the corresponding pixel. The minimum and maximum are connected with a line. Pixel data on screen Acquired data points Figure 3-25: Display data compression method 3-43 WCA330 & WCA380 User Manual...
- Page 227 Displaying Waveform Data 3-44 WCA330 & WCA380 User Manual...
-
Page 228: Marker Operations And Peak Search
H Line Marker is shown with a vertical or horizontal line and the value at the marker position for general purpose. The line marker is controlled with the Options... Õ Display Lines... menu in the views such as Waveform, Analog, FSK, and CodePower. 3-45 WCA330 & WCA380 User Manual... -
Page 229: Moving The Primary Marker
You can use the search menu such as Peak, Max, and Min to move the marker. For detail, refer to each view menu beginning on page 2–63. 3. Read the marker read-out. Marker read out Marker: 0Hz -25.29dBm Figure 3-26: Marker read out 3-46 WCA330 & WCA380 User Manual... - Page 230 H The search function is disabled along the vertical (frame number) axis in a three-dimensional display such as the spectrogram and waterfall views. H The search function is not supported for the Polar, EyeDiagram, and SymbolTable views. 3-47 WCA330 & WCA380 User Manual...
-
Page 231: Operating The Delta Marker
The “Marker” label in the top left corner of the view changes to “Delta”. Delta: 0Hz 0.0dBm Point B Point A 4. Move the V marker to the desired position (Point A). Point B Point A 3-48 WCA330 & WCA380 User Manual... - Page 232 The Z marker remains. Delta marker read out Delta: 18.2kHz -0.8dBm Point B Point A The Z marker is positioned at Point A, and the V marker at Point B. 7. Read the marker read-out. 3-49 WCA330 & WCA380 User Manual...
- Page 233 Marker Operations and Peak Search 3-50 WCA330 & WCA380 User Manual...
-
Page 234: Zoom
Zoom enables you to observe details of a spectrum around a selected frequency by enlarging the acquired spectrum waveform in the specified span. This section discusses the following topics: H Zoom process H Zoom range H Zoom operation 3-51 WCA330 & WCA380 User Manual... -
Page 235: Zoom Process
Data memory Original data in time domain Re analyzed data in frequency domain CPU memory Original data in Saved in CPU memory frequency domain Figure 3-27: Zoom process 3-52 WCA330 & WCA380 User Manual... -
Page 236: Zoom Range
(The number of acquired frames) / (Expansion factor) – 1. NOTE. For a three-dimensional view, one frame of those resulting from zoom will not contain the data available for display, so the number of frames available for display will decrease by one. 3-53 WCA330 & WCA380 User Manual... -
Page 237: Zoom Operation
Press the Frequency side key to input the center frequency after zooming. e. Select the Mag side key to select the expansion factor. The span equals (Unzoomed span / expansion factor). Zoom by pressing the Execute side key. 3-54 WCA330 & WCA380 User Manual... - Page 238 In this example, the signal acquired with a center frequency of 800 MHz and a span of 100 kHz enlarges by a factor of 100 around a center frequency of about 800 MHz. Before zooming After zooming Figure 3-28: Spectra before and after zooming 3-55 WCA330 & WCA380 User Manual...
- Page 239 The frequency at the marker position is immediately set to the zoom center frequency (SETUP:Zoom...Õ Frequency). If necessary, change the center frequency by fine-tuning the marker position. 3. Press the Execute side key to run the zoom with the new center frequency. 3-56 WCA330 & WCA380 User Manual...
-
Page 240: Average And Peak Hold
Average and Peak Hold The averaging technique is generally used to enhance the signal-to-noise ratio. This section describes the averaging process and provides operating examples. The average function also includes the peak hold. 3-57 WCA330 & WCA380 User Manual... -
Page 241: Averaging Process
Block mode. See Figure 3–29. Data memory Time domain Analog process data Frequency domain Display FFT process data For concurrent display, Average On Execute use Trace 2 Average Display Averaging function Figure 3-29: Averaging process in the view 3-58 WCA330 & WCA380 User Manual... - Page 242 Data memory Display Frequency domain data Data register Display Averaging function File . . . Figure 3-30: Process of the utility average 3-59 WCA330 & WCA380 User Manual...
-
Page 243: Averaging Mode
: Active data for the n frame P: Frame point NumAverage: Weighting factor Continuous averaging weights older sweeps so that they have a progressively smaller effect on the average. The utility average function does not support the RMSExpo mode. 3-60 WCA330 & WCA380 User Manual... -
Page 244: Operating Example Of The View Average Function
View A (see Figure 3–31). If you press the Reset side key, the averaging restarts. Averaged waveform Ordinary spectrum waveform (Peak Hold mode) (FM modulated signal) Figure 3-31: Simultaneous display of a spectrum and its averaged waveform (Example) 3-61 WCA330 & WCA380 User Manual... - Page 245 With the Num Averages side key, set the number of averaging. d. With the Begin Frame and End Frame side keys or Mkr –> Frame side key, specify the frame range for averaging. 2. Press the Execute side key to run averaging. 3-62 WCA330 & WCA380 User Manual...
-
Page 246: Operating Example Of The Utility Average Function
For example, use View A as the Waveform view. a. Press CONFIG:VIEW Õ View A and select Waveform. b. Press VIEW:A Õ VIEW:MAIN Õ Source and select the data register you set in step 1c. Now, the averaging result is displayed. 3-63 WCA330 & WCA380 User Manual... - Page 247 Average and Peak Hold 3-64 WCA330 & WCA380 User Manual...
-
Page 248: Trigger
H Domain: Selects either the time or frequency domain. H Source: Selects a trigger signal source. H Slope: Selects the rising or falling edge of a trigger signal. H Position: Specifies a trigger position. This section describes the above topics in detail. 3-65 WCA330 & WCA380 User Manual... -
Page 249: Setting A Trigger
When you create a trigger mask pattern on the Waveform view, if you press the Draw Max, Draw Line, Draw Min or Draw Horizontal side key in the Edit... submenu, the trigger mode is automatically set to Normal. 3-66 WCA330 & WCA380 User Manual... - Page 250 This setting is valid when specifying an internal trigger source. The timeout value is set with Trigger...Õ Timeout. Waiting while acquiring data Display Time Specified time Trigger events generated Point at which you Timeout press the BLOCK key Figure 3-34: Timeout trigger 3-67 WCA330 & WCA380 User Manual...
- Page 251 Quick — Same as Normal except that the analyzer acquires all the blocks and then displays them. Data Data Data · · · Display acquisition acquisition acquisition Time The point at which the trigger occurs after you press the BLOCK key. Figure 3-36: Quick trigger 3-68 WCA330 & WCA380 User Manual...
- Page 252 The point at which you press the BLOCK key. Figure 3-37: Quick Interval trigger Never — Press the BLOCK key to start or stop acquisition of one block of data manually. Other trigger settings are not effective. 3-69 WCA330 & WCA380 User Manual...
- Page 253 Memory mode Maximum trigger count (fraction part rounded down) Frequency 16,000 ÷ (Block size setting) Frequency 4,000 ÷ (Block size setting) 1024 Dual 2 000 ÷ (Block size setting) 2,000 ÷ (Block size setting) Zoom 3-70 WCA330 & WCA380 User Manual...
- Page 254 If you set the trigger count to 1 or more, block to block gaps are displayed in thin black stripes. (They are shown in white in this figure.) Figure 3-38: Three dimensional view display effect by setting a trigger count 3-71 WCA330 & WCA380 User Manual...
- Page 255 ..Frame 1535 Frame 1536 data acquisition Frame 1537 Frame 1538 Block 4 ..Frame 2047 Figure 3-39: Relation between the trigger count and the frame 3-72 WCA330 & WCA380 User Manual...
- Page 256 With the trigger source set to External, the rising edge of an external input signal generates a trigger. You cannot select the trigger slope. Setting. H Press SETUP:MAIN Õ Trigger...Õ Slope and select Rise or Fall. 3-73 WCA330 & WCA380 User Manual...
- Page 257 Delayed) Position setting Trigger Acquisition completed 1 block Timeout mode Position setting Timeout Acquisition completed 1 block Delayed mode Position is always 100 % Delayed time elapsed Figure 3-40: Trigger position and data acquisition 3-74 WCA330 & WCA380 User Manual...
-
Page 258: Creating A Trigger Mask Pattern
The pattern you create is saved in the internal trigger register. Refer to Trigger on page 3–65 for other trigger settings. Figure 3-41: Example of a trigger mask pattern 3-75 WCA330 & WCA380 User Manual... -
Page 259: Hints For Creating A Mask Pattern
Span v5 MHz (SETUP:SPAN Õ v5 MHz) FFT window: Blackman-Harris (SETUP:MAIN Õ Memory Mode, Input, FFT...Õ FFT Window Õ Blackman) When you use a mask pattern for triggering, the trigger mode is set to Normal automatically. 3-76 WCA330 & WCA380 User Manual... -
Page 260: Example Of Creating A Mask Pattern
For example, to create the pattern shown in Figure 3–41, first create achromatic area A. a. Press the Draw Max side key. b. Place the V marker at A–L using the Hor. and Ver. side keys. A–L A–R 3-77 WCA330 & WCA380 User Manual... - Page 261 Z marker. A–L A–R d. Move V to A–R using the Hor. and Ver. side keys. A–L A–R e. Press the Draw Line side key. The white area is created as shown below. 3-78 WCA330 & WCA380 User Manual...
- Page 262 Move the edit marker (V) to a specified position using the Hor. and Ver. side keys, then press the Draw Horizontal side key. Original baseline New baseline Figure 3-42: Example of a trigger mask pattern with a shifted baseline 3-79 WCA330 & WCA380 User Manual...
- Page 263 Creating a Trigger Mask Pattern 3-80 WCA330 & WCA380 User Manual...
-
Page 264: Power Measurement
Power — Power of the specified frequency area (dBm) C/N — Proportion of carrier to noise (dB) C/No — Proportion of carrier to noise per frequency (dB/Hz) ACP — Leakage power of adjacent channel (dB) OBW — Occupied bandwidth 3-81 WCA330 & WCA380 User Manual... -
Page 265: Setting Requirements
You must use an averaged waveform in any power measurement, although it may Waveform not appear in the following operation descriptions. Select Source Õ Average in the Waveform view or 3gppACPView. For averaging, refer to Averaging and Peak Hold beginning on page 3–57. 3-82 WCA330 & WCA380 User Manual... -
Page 266: Noise Measurement
4. Read the measured value displayed at the top left corner on the view. 5. When necessary, press the ROLL or BLOCK key to acquire the signal while measuring the noise. Figure 3–43 shows a noise measurement example. Noise measurement result Figure 3-43: Noise measurement example 3-83 WCA330 & WCA380 User Manual... -
Page 267: Power Measurement
5. When necessary, press the ROLL or BLOCK key to acquire the signal while measuring power. Figure 3–44 shows a power measurement example. Band power marker Power measurement result Figure 3-44: Power measurement example 3-84 WCA330 & WCA380 User Manual... -
Page 268: C/N And C/No Measurements
6. When necessary, press the ROLL or BLOCK key to acquire the signal while measuring C/N or C/No. Figure 3–45 shows C/N and C/No measurement examples. C/N measurement result C/No measurement result C/N measurement C/No measurement Figure 3-45: C/N and C/No measurement examples 3-85 WCA330 & WCA380 User Manual... -
Page 269: Acp Measurement
H ACP Upper (dB) indicates the power proportion of the low frequency adjacent channel signal to the carrier signal. H ACP Lower (dB) indicates the power proportion of the high frequency adjacent channel signal to the carrier signal. 3-86 WCA330 & WCA380 User Manual... - Page 270 5. When necessary, press the ROLL or BLOCK key to acquire the signal while measuring the ACP. Figure 3–46 shows an ACP measurement example. Band power marker ACP measurement result Figure 3-46: ACP measurement example 3-87 WCA330 & WCA380 User Manual...
-
Page 271: Obw Measurement
5. Read the measured value displayed at the top left corner on the view. 6. When necessary, press the ROLL or BLOCK key to acquire the signal while measuring the OBW. Figure 3–47 shows an OBW measurement example. 3-88 WCA330 & WCA380 User Manual... - Page 272 Power Measurement Band power marker OBW measurement result Figure 3-47: OBW measurement example 3-89 WCA330 & WCA380 User Manual...
-
Page 273: Band Power Marker Operations
3. Press the Width side key and input the bandwidth. If it is set to 0, the power for one bin width will be calculated. Center frequency (Center) Left cursor Right cursor (Left) (Right) Bandwidth Figure 3-48: Power measurement band power marker 3-90 WCA330 & WCA380 User Manual... - Page 274 Center band Upper band power marker power marker power marker Fc - Sp Fc + Sp Channel space Sp Channel space Sp Bandwidth Bandwidth Bandwidth (Bw) (Bw) (Bw) Figure 3-49: ACP measurement band power marker 3-91 WCA330 & WCA380 User Manual...
- Page 275 5. Press the SP side key and input the frequency interval between two adjacent channels. 6. You can display the Upper and Lower band power markers by selecting Band Power Markers Õ Upper and Lower, respectively. 3-92 WCA330 & WCA380 User Manual...
- Page 276 3. Press the OBW side key and input the proportion (Pr). The analyzer calculates the occupied bandwidth and displays the result by the cursors and the value at the top left corner on the view. 3-93 WCA330 & WCA380 User Manual...
- Page 277 Power Measurement 3-94 WCA330 & WCA380 User Manual...
-
Page 278: Analyzing An Analog Modulated Signal
Analog view, press the VIEW:B key. b. Press the Format side key. c. Turn the general purpose knob to select AM, PM, or FM. Now, the analog signal can be demodulated and displayed on screen. 3-95 WCA330 & WCA380 User Manual... -
Page 279: Display
In this case, use the auto scale function (refer to page 3–36). AM signal demodulation display example PM signal demodulation display example FM signal demodulation display example Figure 3-51: Display examples of analog signal demodulation 3-96 WCA330 & WCA380 User Manual... -
Page 280: Display And Analysis Of A Digitally-Modulated Signal
W-CDMA standard, and the 3gppPolar view for the 3GPP standard) H EYE diagram display in the EyeDiagram view H Symbol table display in the SymbolTable view H Error vector analysis display in the EVM view 3-97 WCA330 & WCA380 User Manual... -
Page 281: Process Flow
1/4 p QPSK 18 kHz RootRaisedCosine 0.35 GMSK 270.833 kHz None CDPD GMSK 19.2 kHz None IS 95/T 53 CDMA_OQPSK 1.2288 MHz RootRaisedCosine 0.2 IS 95 and T 53 can be set in the CDMAPolar view. 3-98 WCA330 & WCA380 User Manual... - Page 282 Reference data Measurement or Reference data. Comparison Polar view Error vector analysis and display Vector/constellation display EVM view EyeDiagram view EYE diagram display SymbolTable view Symbol table display Figure 3-52: Digital modulation signal flow 3-99 WCA330 & WCA380 User Manual...
-
Page 283: Setting
3. Set a proper frequency and span (refer to page 3–9). The analyzer requires the proper span to recognize the digital modulation and display the signal. Set the span as close to the bandwidth as possible and fine-tune it. 3-100 WCA330 & WCA380 User Manual... - Page 284 Press the Alpha/BT side key to input the a/BT value. Now, the settings are complete. The EVM, phase error, vector and eye diagrams can be displayed. Then, press the ROLL or BLOCK key to acquire data. 3-101 WCA330 & WCA380 User Manual...
-
Page 285: Vector And Constellation Displays
IQ diagram. However, the constellation shows only the measurement signal symbols in red without displaying the symbol-to-symbol locus. Frequency error Origin offset Vector display Constellation display Figure 3-53: Vector and constellation display examples 3-102 WCA330 & WCA380 User Manual... - Page 286 Select Display Õ Measurement (measurement data) or Reference (ideal signal) in the Polar view menu. Use the EVM view to obtain the errors quantitatively from the ideal digitally-modulated signal (refer to page 3–106) . 3-103 WCA330 & WCA380 User Manual...
-
Page 287: Eye Diagram Display
EVM view (refer to page 3–106). Vector display Eye diagram display (1 symbol transition length) Eye diagram display Eye diagram display (2 symbol transition length) (4 symbol transition length) Figure 3-54: Vector and Eye diagram display examples 3-104 WCA330 & WCA380 User Manual... -
Page 288: Symbol Table Display
The SymbolTable view can display the ideal signal as well as the measurement data. Select Display Õ Measurement (measurement data) or Reference (ideal signal) in the SymbolTable view menu. Figure 3-55: Symbol table display example 3-105 WCA330 & WCA380 User Manual... -
Page 289: Error Vector Analysis Display
(each view is auto-scaled). You can select three formats of EVM, Mag Error, and Phase Error with Format in the EVM view menu. Vector display EVM display Mag Error display Phase Error display Figure 3-56: EVM view display examples 3-106 WCA330 & WCA380 User Manual... - Page 290 H Mag error (% RMS): Root-mean-square of the amplitude error H Phase error (deg): Root-mean-square of the phase error H EVM (% RMS): Root-mean-square of the EVM (Error Vector Magnitude) H Rho: r meter 3-107 WCA330 & WCA380 User Manual...
- Page 291 ò (Rho) + Where, R is the ideal IQ signal point data represented by the complex number, and the Z is the measurement IQ signal point data represented by the complex number. 3-108 WCA330 & WCA380 User Manual...
-
Page 292: Analyzing An Fsk Digital Modulated Signal
Turn the general purpose knob to select FSK. If you want to define two or more FSK views, repeat steps b and c. Now, the FSK signal can be demodulated and displayed on screen. 3-109 WCA330 & WCA380 User Manual... -
Page 293: Display
The default scale settings may not be enough to finely display the whole waveform. In this case, use the auto scale function (refer to page 3–36). Figure 3-58: Example display of FSK modulation signal demodulation 3-110 WCA330 & WCA380 User Manual... -
Page 294: Cdma Analysis
(30 kHz and 1 MHz RBW) Time characteristic analysis Power Specified Line 1.6 ms wide (Evaluation of rising and falling Average power 25 ms wide characteristics) Rising and falling edges This section describes each type of analysis. 3-111 WCA330 & WCA380 User Manual... -
Page 295: Evaluation Of Demodulation Precision And Waveform Quality
Evaluation of Demodulation Precision and Waveform Quality Figure 3–59 shows the result of a channel analysis performed in the four views with the EVM/Rho basic configuration. Figure 3-59: CDMA analysis with the EVM/Rho basic configuration 3-112 WCA330 & WCA380 User Manual... - Page 296 The green trace represents the EVM between the ideal and measured signals. The red points represent symbols of the measured signal. The display can be switched to Mag Error or Phase Error. 3-113 WCA330 & WCA380 User Manual...
- Page 297 5M Span Auto Trig. If the display condition is unstable, select 5M Span Normal Trig. because a burst signal is a high probability. 5. Press the BLOCK key to initiate the measurement. The signal is displayed in each view together with the measurement values. 3-114 WCA330 & WCA380 User Manual...
- Page 298 1. Press the key VIEW:D Õ VIEW:MAIN. 2. Press the Format side key to select either Mag Error or Phase Error. 3. If necessary, press the side key Options...Õ Scale, Marker, Search...Õ Scale...Õ Auto Scale to adjust the scale. 3-115 WCA330 & WCA380 User Manual...
-
Page 299: Evaluation Of Spurious
Figure 3–60 shows the two views that display the in-band analysis results with the Spurious basic configuration. Examine the spurious of the external area. Figure 3-60: CDMA analysis with the Spurious basic configuration (30 MHz span) 3-116 WCA330 & WCA380 User Manual... - Page 300 Number: Fail information signal intensity (dB or dBm) frequency position The Number corresponds to the number of the number tag. If a spurious signal is beyond the Specified Line, Fail is displayed. Otherwise, empty display results. 3-117 WCA330 & WCA380 User Manual...
- Page 301 CDMA Analysis Figure 3-61: CDMA analysis with the Spurious basic configuration (5 MHz span) 3-118 WCA330 & WCA380 User Manual...
- Page 302 Level1: -42 dB Frequency1: 900 kHz Frequency1: 1.98 MHz Figure 3-62: Default specified line (when RBW = 30 k) Level1: -60 dBm Frequency: 1.385 MHz Figure 3-63: Default specified line (when RBW = 1 M) 3-119 WCA330 & WCA380 User Manual...
- Page 303 If the display is unstable, select 5M Span Normal Trig. because it is likely a burst signal. 5. Perform the measurement by pressing the ROLL key if 30M Span or by pressing the BLOCK key if 5M Span. 3-120 WCA330 & WCA380 User Manual...
- Page 304 1. Press Measurement Options...Õ Spurious Search and select Off. 2. Perform the measurement by pressing the ROLL key if 30M Span or by pressing the BLOCK key if 5M Span. 3-121 WCA330 & WCA380 User Manual...
-
Page 305: Time Characteristic Evaluation
Time Domain basic configuration. Mask Area Mask Area Averaged waveform Mask Area Latest unaveraged waveform This figure contains white mask areas that are actually displayed in blue. Figure 3-64: CDMA analysis with the Time Domain basic configuration 3-122 WCA330 & WCA380 User Manual... - Page 306 Off Left: 169 ms Off Right: 1.431 ms On Level: - 3 dB Off Level: - 20 dB Off Level: - 20 dB On Left: 175 ms On Right 1.425 ms Figure 3-65: Default mask area 3-123 WCA330 & WCA380 User Manual...
- Page 307 IS-95 specifies that the averaging count is 100. This value is the default for the analyzer. You can set another value through Options...Õ Num Averages in the view menu. To stop the measurement before completion, press the Break side key or CLEAR front-panel key. 3-124 WCA330 & WCA380 User Manual...
- Page 308 2. Select CDMATime for Views C and D. Now, the four views contain the same display. 3. Change the View B display: a. Press the key VIEW:B Õ VIEW:MAIN. b. Press the side key Option...Õ Scale, Marker, Search...Õ Scale...Õ Rising Edge. 3-125 WCA330 & WCA380 User Manual...
- Page 309 4. Change the View D display: a. Press the key VIEW:D Õ VIEW:MAIN. b. Press the side key Option...Õ Scale, Marker, Search...Õ Scale...Õ Falling Edge. View B and D change as shown in lower part of Figure 3–66. 3-126 WCA330 & WCA380 User Manual...
- Page 310 Analysis This chapter describes the cdmaOne analysis functions. The following topics are discussed. H About the cdmaOne analysis H Operating examples H Standard code-domain power measurement H Code-domain power measurement for continuous symbols 3-127 WCA330 & WCA380 User Manual...
-
Page 311: About Cdmaone Analysis
2. Establish the synchronization as QPSK and correct the frequency and phase. 3. Establish the long-code using pilot channels. 4. Perform Fast Hadamard Transformation. 5. Calculate the symbol power for all channels. 6. Create the reference waveform. 3-128 WCA330 & WCA380 User Manual... -
Page 312: Operating Examples
When the input level is too high, the OVERLOAD indicator displays in red. Then, increase the reference level. The measurement for each symbol continues. To stop data acquisition, press START/STOP:ROLL key again For details on the view menus, refer to page 2–63 and below. 3-129 WCA330 & WCA380 User Manual... - Page 313 Date and time at data acquisition end point Measurement values at marker position: (from the left) Origin offset D Chip number D Amplitude D Phase Amplitude scale View C: CodePolar view Figure 3-68: Constellation 3-130 WCA330 & WCA380 User Manual...
- Page 314 Analysis Data source Code domain power Measurement values at marker position Channel number View D: CodePower view Figure 3-69: Code domain power 3-131 WCA330 & WCA380 User Manual...
- Page 315 8. Press the START/STOP:BLOCK key to start data acquisition. After the data acquisition, the first symbol is analyzed. 9. Press the VIEW:C key. 10. Press the Analyze side key to analyze for all frames. 3-132 WCA330 & WCA380 User Manual...
- Page 316 View B links to the display of code-domain power in View A and D. So you can observe the time-varying signal with consistency between the frequency domain and code domain. Figure 3-70: Analyzing a transient signal 3-133 WCA330 & WCA380 User Manual...
- Page 317 Analysis 3-134 WCA330 & WCA380 User Manual...
-
Page 318: W-Cdma Analysis
Short code in a long code mask 8 bit Gold code using M sequence obtained from the (LMS) part generator polynomial Modulation method QPSK Baseband filter Root cosine with a=0.22 (default); 0.0001≤a≤1 3-135 WCA330 & WCA380 User Manual... - Page 319 4. Establish the long-code number and phase. 5. Correct the frequency and phase. 6. Perform Fast Hadamard Transformation. 7. Calculate the symbol power for all channels. 8. Extract effective channels from pilot symbols. 3-136 WCA330 & WCA380 User Manual...
-
Page 320: Operating Examples
9. Press the START/STOP:BLOCK key to acquire one block of data. When the input level is too high, the OVERLOAD indicator displays in red. Then, increase the reference level. For details on the view menus, refer to page 2–63 and below. 3-137 WCA330 & WCA380 User Manual... - Page 321 Measurement values at marker position: (from the left) Origin offset D Symbol number (displayed by turning D Amplitude Symbol Constellation on) D Phase Amplitude scale View C: CodeWPolar view Figure 3-72: Symbol constellation 3-138 WCA330 & WCA380 User Manual...
- Page 322 Data source Symbol number Symbol power Measurement values at marker position Channel number Symbol rate and channel number at that rate View D: CodeWPower view with X Axis set to Symbol Figure 3-74: Symbol power 3-139 WCA330 & WCA380 User Manual...
- Page 323 13. Press the START/STOP:BLOCK key to start data acquisition. After the data acquisition, the first slot is analyzed. 14. Press the VIEW:C key. 15. Press the Analyze side key to analyze for all frames. 3-140 WCA330 & WCA380 User Manual...
- Page 324 View B links to the display of code-domain power in View A and D. So you can observe the time-varying signals with consistency between the frequency domain and code domain. Figure 3-75: Analyzing a transient signal 3-141 WCA330 & WCA380 User Manual...
- Page 325 W-CDMA Analysis 3-142 WCA330 & WCA380 User Manual...
-
Page 326: 3Gpp Analysis
18 bit Gold code using M sequence obtained from the generator polynomial Channelization code Hierarchical orthogonal code sequence specified with the combination of the chip rate and symbol rate Modulation method QPSK Baseband filter Root cosine with a=0.22 (default); 0.0001≤a≤1 3-143 WCA330 & WCA380 User Manual... - Page 327 3. Determine the scrambling code number range with S-SCH. 4. Establish the long-code number and phase. 5. Correct the frequency and phase with PCPICH. 6. Perform Fast Hadamard Transformation. 7. Calculate the symbol power for all channels. 3-144 WCA330 & WCA380 User Manual...
- Page 328 When the input level is too high, the OVERLOAD indicator displays in red. Then, increase the reference level. 8. Press the VIEW:C key. 9. Press the Analyze side key to measure for all frames. 3-145 WCA330 & WCA380 User Manual...
- Page 329 Press the VIEW:C key to select the 3gppPolar view. Press the [View C] <– side key (top side key) to show the top menu. g. Press the Analyze side key to analyze for all frames. 3-146 WCA330 & WCA380 User Manual...
- Page 330 Measurement values at marker position: (from the left) Origin offset D Symbol number (displayed by turning D Amplitude Symbol Constellation on) D Phase Amplitude scale View C: 3gppPolar view Figure 3-77: Symbol constellation 3-147 WCA330 & WCA380 User Manual...
- Page 331 Figure 3-78: Code domain power Symbol number Symbol power Measurement values at marker position Channel number Symbol rate and channel number at that rate View D: CodeWPower view with X Axis set to Symbol Figure 3-79: Symbol power 3-148 WCA330 & WCA380 User Manual...
-
Page 332: 3Gpp Acp Measurement
When you retrieve the data from the file, do the following steps: H Press VIEW:MAIN Õ Options...Õ Copy From...Õ Text File, and specify the file. Figure 3–80 is an example of the 3GPP ACP measurement. 3-149 WCA330 & WCA380 User Manual... - Page 333 3GPP Analysis Band power marker Measurement results Figure 3-80: 3GPP ACP measurement example 3-150 WCA330 & WCA380 User Manual...
-
Page 334: Gsm Analysis
H Selecting the GSM measurement H Modulation accuracy measurement H Output power measurement H Power vs. Time measurement H Spectrum (MOD) measurement H Spectrum (SW) measurement H Analyzing file data H Entering the sync word 3-151 WCA330 & WCA380 User Manual... -
Page 335: Measurement Functions
0 dB < (Output power) – (Reference power) < 3 dB G (#HFF) T (#H0) T (#H0) (Data 1) (Data 2) 58 bits 26 bits 58 bits 3 bits 3 bits 8.25 bits Figure 3-81: Slot data structure 3-152 WCA330 & WCA380 User Manual... - Page 336 The spectra of bursts are calculated with the 30 kHz RBW Gaussian filter, and then peak-held for the specified number of slots. The Pass/Fail test is done for the peak-held spectrum in comparison with the specified line in the GSM standard. 3-153 WCA330 & WCA380 User Manual...
-
Page 337: Basic Operations
If you want to analyze data on a file, refer to Analyzing File Data on page 3–162. NOTE. If the input signal is nonstandard, measurement results are not displayed on the screen (waveforms may be displayed if triggered). 3-154 WCA330 & WCA380 User Manual... - Page 338 EVM view Measurement side key to select the measurement item Measurement result (from the top) D Frequency error D Phase error (max) D Phase error (RMS) SymbolTable view GSM view Figure 3-82: Modulation accuracy measurement 3-155 WCA330 & WCA380 User Manual...
- Page 339 View A to D show the measurement result for the specified burst. GSMPolar view Amplitude vs. Time Two line markers (fixed) show the process range. Measurement result D Mean carrier power Spectrogram view GSM view Figure 3-83: Output power measurement 3-156 WCA330 & WCA380 User Manual...
- Page 340 View A to D show the measurement result for the specified burst. GSMPolar view GSMMask view Specified mask in GSM. Measurement result D Mean carrier power Spectrogram view GSM view Figure 3-84: Power vs. Time measurement 3-157 WCA330 & WCA380 User Manual...
- Page 341 5. Press the Burst No. side key and select a burst number. View A to D show the measurement result for the specified burst. In this case, View B displays raw data of the specified burst (not averaged). 3-158 WCA330 & WCA380 User Manual...
- Page 342 GSM Analysis GSMPolar view Amplitude vs. Time Specified line Pass/Fail test result in GSM Waveform view GSM view Figure 3-85: Spectrum (MOD) measurement 3-159 WCA330 & WCA380 User Manual...
- Page 343 4. Press the Analyze side key to analyze the data acquired on the memory. The analyzer displays the measurement result and waveform as in step 3. If you want to quit, press the ROLL or BLOCK key. 3-160 WCA330 & WCA380 User Manual...
- Page 344 GSM Analysis Spectrogram view GSMPolar view Specified line in GSM Pass/Fail test result Waveform view GSM view Figure 3-86: Spectrum (SW) measurement 3-161 WCA330 & WCA380 User Manual...
- Page 345 View A to D show the measurement result for the specified burst. NOTE. When you change the measurement item with the Measurement side key in the GSM view menu, the analyzer clears the data loaded from a file onto the memory. 3-162 WCA330 & WCA380 User Manual...
-
Page 346: Entering The Sync Word
H Press one of the side keys from 0 1 2 3... to C D E F... and then select a number. GSMPolar view Sync Word field Figure 3-87: Entering a sync word in the GSMPolar view 3-163 WCA330 & WCA380 User Manual... - Page 347 Sync Word... menu, the analyzer always turns them On for the GSM measurement. NOTE. The sync word is reset to TSC0 (default) when you change the measure- ment item with the Measurement side key in the GSM view menu. 3-164 WCA330 & WCA380 User Manual...
-
Page 348: Ccdf Analysis
CCDF Analysis This chapter describes the CCDF (Complementary Cumulative Distribution Function) analysis functions. The following topics are discussed. H About CCDF analysis H Operating examples 3-165 WCA330 & WCA380 User Manual... -
Page 349: About Ccdf Analysis
1. Measure the amplitude of the input signal over time. 2. Determine the amplitude distribution. 3. Obtain CCDF using the above formula. Amplitude CCDF Max. Crest factor Average Time Amplitude Amplitude (Average) Average Max. Figure 3-88: CCDF calculation process 3-166 WCA330 & WCA380 User Manual... -
Page 350: Operating Examples
11. When you replace View G or H with View C or D, press the VIEW:C or D key one or two times (depending on the settings). For details on the CCDF and CCDFView menus, refer to page 2–112 and 2–114, respectively. 3-167 WCA330 & WCA380 User Manual... - Page 351 Data source Measurement values at marker position: (from the left) D Horizontal readout (Threshold power) D Vertical readout (Probability) The value at which the probability is zero (crest factor) Figure 3-90: CCDFView display (View H) 3-168 WCA330 & WCA380 User Manual...
-
Page 352: Auto-Save Function
If you want logging occurring at regular intervals or time reduction between blocks (guaranteeing the minimum time), this function may not work for you. Refer to Frame Period and Real Time on page 3–25 for details. 3-169 WCA330 & WCA380 User Manual... -
Page 353: Operating Procedure
..C:\Users\PROJ–E\R01*.IQ BlockSave view ..C:\Users\PROJ–E\B01*.IQ a. Press View:C Õ File Name and then specify a file name. b. Press View:D Õ File Name and then specify a file name. 3-170 WCA330 & WCA380 User Manual... - Page 354 Counter Reset side key. The files that have been previously made will be overwritten. 9. When you stop the acquisition, press the ROLL key (in the Roll mode) or BLOCK key (in the Block mode) again. 3-171 WCA330 & WCA380 User Manual...
-
Page 355: Loading The Data
B011.IQ (, B011.IQT) B012.IQ (, B012.IQT) B013.IQ (, B013.IQT) Loading the Data Refer to Load on page 3–176. If the IQT-formatted file exists, it is also read automatically with specifying the IQ-formatted file only. 3-172 WCA330 & WCA380 User Manual... -
Page 356: File Operations
..page 3–174 H Operating file access menu . . . page 3–178 H Data file format ... . page 3–184 3-173 WCA330 & WCA380 User Manual... -
Page 357: Saving And Loading Files
2. Press the Load From File (*.CFG) side key. The file access menu appears. Select the drive and directory in which the file is located, and load it. Refer to File Menu Operations on page 3–178 for detail. 3-174 WCA330 & WCA380 User Manual... - Page 358 I and Q axes of the IQ diagram. The AP-formatted data is calculated from the IQ-formatted data and represented in the polar coordinates. It takes more time to save the AP-formatted data than the IQ-formatted data. 3-175 WCA330 & WCA380 User Manual...
- Page 359 3gppSpectrogram, 3gppPower, 3gppACPView 3gppPolar CCDFView CCDF The data acquired only with the block size of 20 is displayed. The file data can not be input directly, but displayed through the view shown in the Display" column. 3-176 WCA330 & WCA380 User Manual...
- Page 360 3. Specify Active in Source of the view menu to display the contents of the data memory. In this way, you can zoom the waveform if the data has been acquired in the Zoom mode. 3-177 WCA330 & WCA380 User Manual...
-
Page 361: Operating File Access Menu
Drive selection File name ABC.cfg field field ABC.cfg dual10m.cfg dual3g.cfg Program Files freq10m.cfg scal3g.cfg SUP.cfg SYSTEM SUP2.cfg zoom10m.cfg zoom3m.cfg Directory listing File listing Figure 3-94: Directory and file listings in the file access menu 3-178 WCA330 & WCA380 User Manual... - Page 362 Edit the characters in the file name entry field in the subdirectory Name Entry... Open the subdirectory to copy or delete a file, or create or delete a directory Operation... Figure 3-95: File operation menu 3-179 WCA330 & WCA380 User Manual...
- Page 363 NOTE. The analyzer automatically adds the extension to the file. If you input an improper extension, the analyzer replaces it with the proper one. Loading a File 1. Select a file using the procedures in Selecting a File described above. 2. Press the OK side key. 3-180 WCA330 & WCA380 User Manual...
- Page 364 2. Select a file using the procedure described in Selecting a File on page 3–180. 3. Press the Delete File side key to delete the file. 4. Press the uppermost side key twice to return to the top-level menu. 3-181 WCA330 & WCA380 User Manual...
- Page 365 3. Press the Delete Dir side key to delete the directory. 4. Press the uppermost side key twice to return to the top-level menu. NOTE. Directories containing one or more files cannot be deleted. 3-182 WCA330 & WCA380 User Manual...
- Page 366 H To delete a character at the cursor position, press the Delete Char side key. While the cursor is on the space, the Delete Char side key works as the Backspace key. 3-183 WCA330 & WCA380 User Manual...
-
Page 367: Data File Format
If it is zero, obtain the true value by investigating the file size. In this case, Correction data block is always added. The details on each block are described on the following page. 3-184 WCA330 & WCA380 User Manual... - Page 368 In this case, Length of header = 1 (1 byte) + 4 ( 2 to 5 bytes) + 0403 = 408 bytes The data block starts from the 409 byte. 3-185 WCA330 & WCA380 User Manual...
- Page 369 FFTWindow. Shows the FFT window setting when the analyzer acquired the data. ENBW. Shows the factor used for the in-band power calculation. FFTPoints. Shows the FFT points setting when the analyzer acquired the data. 3-186 WCA330 & WCA380 User Manual...
- Page 370 MemoryMode. Shows the memory mode when the analyzer acquired the data. It is necessary only when the analyzer reloads the data. CenterFrequency. Shows the center frequency in Hz when the analyzer acquired the data. 3-187 WCA330 & WCA380 User Manual...
- Page 371 5 MHz make the span of 100 MHz. MultiAddr. Shows the last frame address in the multi-frame mode. The range is 0 to MultiFrames –1. MultiFrames –1 indicates that the data ends just at the end of scans. 3-188 WCA330 & WCA380 User Manual...
-
Page 372: Data Block
The explanation for each item listed above begins on the following page. 3-189 WCA330 & WCA380 User Manual... - Page 373 -1 indicates that the frame is after the trigger (post-trigger). short overLoad. Indicates whether an input overload occurred. 0 indicates that the MaxInputLevel value in the file header was proper. -1 indicates that the MaxInputLevel value in the file header was too low. 3-190 WCA330 & WCA380 User Manual...
- Page 374 320, 321, 322,..., 638, 639, 640,<383 dummy data:>, 0, 1, 2,..., 317, 318, 319 375, 376, 377,..., 748, 749, 750,<273 dummy data>, 0, 1, 2,..., 372, 373, 374 400, 401, 402,..., 798, 799, 800,<223 dummy data>, 0, 1, 2,..., 397, 398, 399 3-191 WCA330 & WCA380 User Manual...
- Page 375 AP format (1024 bins) struct apFrame1024_st { struct apBin_st ap[1024]; IQ format (1024 bins) struct iqFrame1024_st{ struct iqBin_st iq[1024]; AP format (256 bins) struct apFrame256_st{ struct apBin_st ap[256]; IQ format (256 bins) struct iqFrame256_st{ struct iqBin_st iq[256]; 3-192 WCA330 & WCA380 User Manual...
- Page 376 Q = q * IQScale [V] For the IQ file, I and Q are calculated with this formula. IQScale = Sqrt(Power(10, (GainOffset + MaxInputLevel)/10)/20*2) I = i/(1<<DataShift) * IQScale [V] Q = q/(1<<DataShift) * IQScale [V] 3-193 WCA330 & WCA380 User Manual...
-
Page 377: Correction Data Block
When this block is added, the amplitude and phase are calculated with the following formula. Be careful about the sign for phase correction. Amplitude = (Original data) – (Gain correction data/128) [dBm] Phase = (Original data) + (Phase correction data/128) [degree] 3-194 WCA330 & WCA380 User Manual... -
Page 378: Using Windows 98
PS/2 mouse and a keyboard are located on the second slot from the right. Keyboard connector Mouse connector Figure 3-100: Mouse and keyboard connectors Attach a mouse and a keyboard to connectors. 3-195 WCA330 & WCA380 User Manual... - Page 379 Be sure to press the ENTER key after the K or k. M and m keys Numeric input Represent M (10 ) and m (10 ), respectively. Be sure to press the ENTER key after the M or m. 3-196 WCA330 & WCA380 User Manual...
-
Page 380: Accessing Windows 98
Figure 3-101: Displaying the Windows 98 accessory menu Setting Date and Time. The analyzer view displays date and time managed by the Windows operating system. You can use the Windows 98 time setting program to set date and time. 3-197 WCA330 & WCA380 User Manual... - Page 381 1. Use a mouse to move the pointer to the bottom of the display (see Fig- ure 3–101). The task bar appears. 2. Locate the pointer on the WCA330 or WCA380 icon in the task bar and right-click. A menu appears.
-
Page 382: Lan Connection
Figure 3-102: 10/100 BASE T connector location (rear panel) If you reboot the analyzer after connecting to LAN, the analyzer detects the network speed automatically and sets it to 10 Mbps or 100 Mbps. 3-199 WCA330 & WCA380 User Manual... -
Page 383: Network Setting
To share resources, open Properties dialog box for each resource such as files or disks and enter necessary information on the Sharing tab. Figure 3–103 shows a setting example to share a folder. Figure 3-103: Setting for sharing a folder 3-200 WCA330 & WCA380 User Manual... -
Page 384: Outputting Waveform Data
......page 3–202 H Outputting view data in text format ..page 3–206 3-201 WCA330 & WCA380 User Manual... -
Page 385: Screen Hardcopy
Parallel port Figure 3-104: Parallel port location (rear panel) If you have connected the analyzer to LAN, you can also use any printer on the network. 3-202 WCA330 & WCA380 User Manual... - Page 386 Figure 3–105. 3. Install the printer driver following the messages appearing in the dialog box. NOTE. You can set the default printer when you install the driver. Figure 3-105: Installing the printer driver 3-203 WCA330 & WCA380 User Manual...
- Page 387 “Default Printer Not Found” in red in the uppermost status display area on the screen. This message also appear when no printer driver is installed. If the printer is disconnected or turned off, the printer driver prompts you to correct the problem. 3-204 WCA330 & WCA380 User Manual...
- Page 388 2. Press the Save To File (*.BMP) side key. The directory and file listings appear. 3. Select an existing file or create a new file. For details, refer to Operating File Access Menu on page 3–178. 4. Press OK side key. 3-205 WCA330 & WCA380 User Manual...
-
Page 389: Outputting View Data In Text Format
FFT points in the time domain, or the number of bins in the frequency domain. Figure 3–106 shows waveform data that has been pasted in the application software Scratch Pad. 3-206 WCA330 & WCA380 User Manual... - Page 390 Press the side key Options...Õ Copy To...Õ Clipboard. H To output the data to a file: Press the side key Options...Õ Copy To...Õ Text File. For details on the file access menu operations, refer to page 3–178. 3-207 WCA330 & WCA380 User Manual...
- Page 391 Input the file name and then click on OK. Figure 3–107 shows a graph created in Microsoft Excel using the text data of the spectrum. Helvetica Series1 Series2 Figure 3-107: Creating a graph from the text data in Excel 3-208 WCA330 & WCA380 User Manual...
-
Page 392: Setting The Date And Time
1. Press CONFIG:UTILITY key on the front panel. 2. Press Action side key and select Assign. 3. Press UTIL D side key and select TimeDate. The Date/Time Properties dialog box appears. Figure 3-108: Date/Time Properties dialog box 3-209 WCA330 & WCA380 User Manual... - Page 393 Space Bar side key to confirm your settings. The Date/Time Properties dialog box appears again. 7. Press UTIL D side key and select None to close the Date/Time Properties dialog box. 3-210 WCA330 & WCA380 User Manual...
-
Page 394: Displaying The Version And Self Test Result
1. Press any key in the CONFIG area on the front panel. For example, press the CONFIG:MODE key. 2. Press the uppermost side key. Figure 3-109: Displaying the version and self test result (view of upper left corner) 3-211 WCA330 & WCA380 User Manual... - Page 395 Note that the analyzer cannot be checked sufficiently with this self test. If you suspect that the analyzer operates abnormally, contact your local Tektronix distributor or sales office. H Optional information If any optional software is installed, it is indicated with its version. 3-212 WCA330 & WCA380 User Manual...
-
Page 396: Appendices
Appendices... -
Page 398: Appendix A: Options And Accessories
China power cord 220 V, 10A, 50 Hz power cord No power cord Rackmount Spectrum Analyzer comes configured for installation in a 19 inch wide instrument rack. For later field conversions, order kit # 016 1754 XX. WCA330 & WCA380 User Manual... -
Page 399: Standard Accessories
You can also order the optional accessories listed in Table A–3. Table A-3: Optional accessories Accessory Part number Service manual 070 A755 XX Rack mount kit (for field conversion) 016 1754 XX Data display and analysis software for PC SL7PCW3 WCA330 & WCA380 User Manual... -
Page 400: Appendix B: Specifications
Appendix B: Specifications This appendix lists the electrical, physical, and environmental characteristics of the analyzer, and specifies the performance requirements for those characteris- tics. The specifications are common to the WCA330 and WCA380, unless otherwise noted. WCA330 & WCA380 User Manual... -
Page 401: Electrical Characteristics
Characteristic Description Input frequency Baseband DC to 10 MHz RF/RF1 band 10 MHz to 3 GHz (RF: WCA330, RF1: WCA380) RF2 band 2.5 GHz to 3.5 GHz (WCA380) RF3 band 3.5 GHz to 6.5 GHz (WCA380) RF4 band 5.0 GHz to 8.0 GHz (WCA380) - Page 402 Characteristic Description Reference level setting range -50 to +30 dBm (1 dB step, RF for WCA330, RF1 to RF4 for WCA380) -30 to +30 dBm (1 dB step, Baseband) -10 to +20 dBm (10 dB step, IQ) Reference level accuracy at 20_ C to 30_ C ±0.8 dB (Baseband)
- Page 403 Description Image suppression 75 dB (RF for WCA330, RF1 for WCA380, center 1.5 GHz, input 9.962 GHz ) 75 dB (RF2, center 3 GHz, input 11.462 GHz, WCA380 only) 70 dB (RF3, center 5 GHz, input 5.842 GHz, WCA380 only) 70 dB (RF4, center 6.5 GHz, input 5.658 GHz, WCA380 only)
- Page 404 12 bits, 40.96 Msps × 2 for I/Q each signal Real Time Span 5 MHz Vector Span 30 MHz (Wide IF mode, IQ) 10 MHz (Baseband) 6 MHz (Normal IF mode) 5 MHz (HiRes IF mode) WCA330 & WCA380 User Manual...
- Page 405 1.6 ksps 500 Hz span 800 sps 200 Hz span 320 sps 100 Hz span 160 sps Sampling rate Wide IF mode, IQ 20 M to 30 MHz span 40.96 Msps 10 MHz span 20.48 Msps WCA330 & WCA380 User Manual...
- Page 406 1.28 s 200 Hz span 3.2 s 100 Hz span 6.4 s Frame update time Zoom, Wide IF mode, IQ 30 MHz span 25 ms 20 MHz span 25 ms 10 MHz span 50 ms WCA330 & WCA380 User Manual...
- Page 407 AM demodulation accuracy ±2 % (-10 dBfs input at center, 10 to 60 % modulation depth) PM demodulation accuracy ±3_ (-10 dBfs input at center) FM demodulation accuracy ±1 % of span (-10 dBfs input at center) WCA330 & WCA380 User Manual...
- Page 408 Time Event Trigger Mask resolution 1 sample point Level range 0 dBfs to -40 dBfs External synchronization timing uncertainty ±50 ns (20/30 MHz span of Wide IF mode) ±100 ns (10 MHz span of Wide IF mode) WCA330 & WCA380 User Manual...
- Page 409 Table B-15: Marker Characteristic Description Marker Type Normal, Delta, Band power Search functions Peak right, Peak left, Maximum Link between views On/Off Measurement functions Noise power, Power within band, C/N ratio, Adjacent channel power, Occupied bandwidth B-10 WCA330 & WCA380 User Manual...
- Page 410 350 W max. Maximum line current is 5 Arms at 50Hz, 90V line, with 5% clipping. Surge current Maximum 30 A peak at 25_ C for ≤ 5 line cycles, after product has been turned off for at least 30 s. B-11 WCA330 & WCA380 User Manual...
-
Page 411: Physical Characteristics
20 g half sine, 11 ms duration, 3 shocks per axis in each direction (18 shocks total) Cooling clearance Bottom 20 mm (0.79 in) Both sides 50 mm (1.97 in) Rear 50 mm (1.97 in) from the rear fan cover B-12 WCA330 & WCA380 User Manual... - Page 412 CAT II Local level mains (wall sockets). Equipment at this level includes appliances, portable tools, and similar products. Equipment is usually cord connected. CAT I Secondary (signal level) or battery operated circuits of electronic equipment. B-13 WCA330 & WCA380 User Manual...
- Page 413 Class 1 (as defined in IEC 1010 1, Annex H) - grounded product Overvoltage Category Overvoltage Category II (as defined in IEC 1010 1, Annex J) Pollution Degree Pollution Degree 2 (as defined in IEC 1010 1). Note: Rated for indoor use only. B-14 WCA330 & WCA380 User Manual...
- Page 414 Internal Internal Internal Internal Internal External Trigger Slope Rise Rise Rise Rise Rise Trigger Position 50 % 50 % 50 % 50 % 50 % Zoom Frequency 1.5 GHz Zoom Span 3 GHz Zoom Mag WCA330 & WCA380 User Manual...
- Page 415 Display Lines...ÕHor. 2 Visible Display Lines...ÕHor. 2 Display Lines...ÕVer. 1 Visible Display Lines...ÕVer. 1 Display Lines...ÕVer. 2 Visible Display Lines...ÕVer. 2 Scale...ÕHor. Scale Scale...ÕHor. Start Scale...ÕVer. Scale 100 dBm Scale...ÕVer. Start -1 V -100 dBm WCA330 & WCA380 User Manual...
- Page 416 These items are displayed in gray initially. When you set the span equal to 5 MHz or lower in Baseband mode, or equal to 10 MHz or lower in RF mode, these items are available. WCA330 & WCA380 User Manual...
- Page 417 30 kHz Measurement Power Spurious Measurement Options...ÕOBW 99 % 99 % Measurement Options...ÕSeparation Measurement Options...ÕThreshold -100 dB -100 dB Measurement Options...ÕSorted by Frequency Frequency Measurement Options...ÕSpurious Search Measurement Options...ÕStandard IS 95 IS 95 Measurement Options...ÕChannel WCA330 & WCA380 User Manual...
- Page 418 Measurement Format Constellation Marker Options...ÕMeasurement Destination D5D6 Options...ÕReference Destination D7D8 Options...ÕPosition 45 % Format Options...ÕScale...ÕHor. Scale Options...ÕScale...ÕHor. Start Options...ÕScale...ÕVer. Scale 100 % Options...ÕScale...ÕVer. Start These items are not reset when you set the basic configuration. WCA330 & WCA380 User Manual...
- Page 419 Active Format FreqAmpl Frame Filter Average...ÕAverage Average...ÕAverage Type RMS Expo RMS Expo Average...ÕNum Averages Average...ÕBegin Frame Average...ÕEnd Frame RBW...ÕRBW Calculation RBW...ÕAlpha RBW...ÕRBW Edit...ÕHor. Edit...ÕVer. Trace2...ÕSource None Trace2...ÕFormat FreqAmpl Trace2...ÕFrame Options...ÕPosition 100 % Options...ÕHold Ver. Scale WCA330 & WCA380 User Manual...
- Page 420 Ver. Start Symbol Rate Composite Scale...ÕHor. Scale 64 ch Scale...ÕHor. Start Scale...ÕVer. Scale Scale...ÕVer. Start Scale...ÕColor Scale 50 dB Scale...ÕColor Start -50 dB Marker...ÕHor. 34 ch Marker...ÕVer. Marker...ÕDelta Marker Search...ÕSeparation Search...ÕVer. Search...ÕDelta Marker Options...ÕMonochrome Options...ÕNumber Colors WCA330 & WCA380 User Manual...
- Page 421 Symbol Rate Composite Scale...ÕHor. Scale 64 ch Scale...ÕHor. Start Scale...ÕVer. Scale 50 dB Scale...ÕVer. Start -50 dB Marker...ÕHor. 19 ch Marker...ÕDelta Marker Search...ÕSeparation Search...ÕDelta Marker These items are not reset when you set the basic configuration. WCA330 & WCA380 User Manual...
- Page 422 3. Change the input mode: a. Press the SETUP:MAIN key. b. Press the Band side key to select RF (for WCA330) or RF1 (for WCA380) with the general purpose knob. c. Press the IF Mode side key to select Normal with the general purpose knob.
-
Page 423: Appendix C: Default Settings
3. Change the input mode: a. Press the SETUP:MAIN key. b. Press the Band side key to select RF (for WCA330) or RF1 (for WCA380) with the general purpose knob. c. Press the IF Mode side key to select the following mode with the... -
Page 424: Appendix D: Frequency And Time Resolution
RF mode only. 1 2 5 steps in the range of 10 MHz to 3 GHz, plus 30 MHz and 3 GHz. 800xN+1 (N = Span/5 MHz). 200xN+1 (N = Span/5 MHz). Baseband mode only. WCA330 & WCA380 User Manual... - Page 425 40 k 24.4140625 n 40.96 M 10 M 50 m 50 m 100 m 20 k 48.828125 n 20.48 M The FFT point is 1024 only. Frame period = Frame length (fixed in the Zoom mode). WCA330 & WCA380 User Manual...
-
Page 426: Appendix E: Mouse Operations
With a mouse connected to the analyzer, you can perform all the menu opera- tions for the analyzer. With a keyboard connected to the analyzer, you can more easily enter numeric values and file names. Front panel interface Figure E-1: Front panel interface for mouse operations WCA330 & WCA380 User Manual... -
Page 427: Displaying The Front Panel Interface
9. Click OK. The property setting window disappears. The front panel interface will appear at the next startup and after. If you have created a WCA330 or WCA380 shortcut, also make the above setting. To return to the initial condition (no front panel interface display), select Minimum window in step 8 above. - Page 428 The mouse is available for the following operations: H Operating the front panel key H Operating the side menu H Selecting the CONFIG, SETUP, or VIEW menu H Moving the marker or selecting a frame WCA330 & WCA380 User Manual...
- Page 429 For details on the operation, refer to Menu Operations on page 2–11. Keypad functions can be completed with the keyboard. Refer to Operations with Keyboard on page E-9. Figure E-2: Correspondence between front panel interface buttons and front panel keys WCA330 & WCA380 User Manual...
- Page 430 Clicking this kind of menu item allows you to move to a higher menu level. Cancel When you click this menu item, the menu currently displayed terminates and the menu previously displayed appears. Figure E-3: Operating the side menu (top level item) WCA330 & WCA380 User Manual...
- Page 431 Up or Down arrow. A toggle menu item, which switches between the two selections each time you click on the menu item. No function assigned. Figure E-4: Operating the side menu (7 items in lower level) WCA330 & WCA380 User Manual...
- Page 432 VIEW menu appears. When you click in this area, the SETUP menu appears. When you click in the specified area on the screen, the contents of the side menu change. Figure E-5: Selecting menus using the mouse WCA330 & WCA380 User Manual...
- Page 433 Frames on page 3–38 for details. The marker moves on the waveform. The marker position is selected in the two dimensional view. The marker moves in any direction. Figure E-6: Moving the marker and selecting a frame WCA330 & WCA380 User Manual...
-
Page 434: Operations With Keyboard
If you have performed the Windows 98 shutdown process: The analyzer shuts down normally, but the front-panel power switch remains on with the STANDBY LED lit. At the next power-on, turn the power switch to STANDBY and back ON again. WCA330 & WCA380 User Manual... - Page 435 Appendix E: Mouse Operations E-10 WCA330 & WCA380 User Manual...
-
Page 436: Appendix F: Inspection And Cleaning
Inspection and Cleaning Procedures If you need to clean the inside of the instrument, consult your Tektronix Service Center or representative. The collection of dirt on components inside can cause instrument overheating and breakdown. - Page 437 3. Clean the monitor screen with a lint-free cloth dampened with either isopro- pyl alcohol or, preferably, a gentle, general purpose detergent-and-water solution. Lubrication There is no periodic lubrication required for this instrument. Cleaning Inside Consult your Tektronix Service Center or representative for cleaning the instrument interior. WCA330 & WCA380 User Manual...
- Page 438 Index...
- Page 440 Architecture, 1–4 Changing display frames, 3–38 Auto, trigger mode, 3–66 Changing the power-up settings, 2–121 Auto-save function, 3–169 Characteristics Auto-scale, 3–36 check, 1–25 Average electrical, B–2 description, 3–57 Environmental, B–12 mode, 3–60 Physical, B–12 Index-1 WCA330 & WCA380 User Manual...
- Page 441 2–119 adjusting the tilt angle, 1–15 copy, 3–181 analog demodulation, 3–96 delete, 3–181 constellation, 3–102 extension, 3–174 error vector analysis, 3–106 format, 3–184 eye diagram, 3–104 header, 3–185 front panel, 2–2 Index-2 WCA330 & WCA380 User Manual...
- Page 442 Mag error, EVM view, 3–107 GSMPolar view menu table, 2–108 Manuals list, xx Marker band power markers, 3–90 link, 3–40 Hardcopy operation, 3–45 to a file, 3–205 type, 3–45 to a printer, 3–202 Memory mode, 3–1 Index-3 WCA330 & WCA380 User Manual...
- Page 443 Modulation system, supported, 3–98 Pixel, relation among frame, bin, and pixel, 3–41 Mouse Polar view menu table, 2–76 connection, 1–11, 3–195 Position, trigger, 3–74 connector, rear panel, 2–4 Power, power measurement, 3–84 operation, E–1 Power cord Index-4 WCA330 & WCA380 User Manual...
- Page 444 2–4 view, 3–32 parallel port, 2–4 SETUP (CDMA) menu table, 2–59 principal power switch, 2–4 SETUP (Standard) menu table, 2–54, 2–61 VGA output port, 2–4 SETUP area, front panel, 2–3 Reference level, description, 3–13 Index-5 WCA330 & WCA380 User Manual...
- Page 445 3–75 Wireless communication analyzer, description, 1–1 mode, 3–66 position, 3–74 setting, 3–66 slope, 3–73 Zoom source, 3–73 description, 3–51 TRIGGERED, status display, 2–8 mode, 3–6 Trouble, installation, 1–17 operation, 3–54 Tutorial, 2–19 range, 3–53 Index-6 WCA330 & WCA380 User Manual...
Need help?
Do you have a question about the WCA330 and is the answer not in the manual?
Questions and answers