Advertisement
Quick Links
OWNER'S MANUAL
INSIGHT QUANTUM
SPECTRORADIOMETER
Models MS-100
Rev: 8-Mar-2023
APOGEE INSTRUMENTS, INC. | 721 WEST 1800 NORTH, LOGAN, UTAH 84321, USA
TEL: (435) 792-4700 | FAX: (435) 787-8268 | WEB: APOGEEINSTRUMENTS.COM
Copyright © 2023 Apogee Instruments, Inc.
Advertisement

Related Manuals for Apogee Instruments MS-100


Summary of Contents for Apogee Instruments MS-100
- Page 1 OWNER’S MANUAL INSIGHT QUANTUM SPECTRORADIOMETER Models MS-100 Rev: 8-Mar-2023 APOGEE INSTRUMENTS, INC. | 721 WEST 1800 NORTH, LOGAN, UTAH 84321, USA TEL: (435) 792-4700 | FAX: (435) 787-8268 | WEB: APOGEEINSTRUMENTS.COM Copyright © 2023 Apogee Instruments, Inc.
- Page 2 TABLE OF CONTENTS Owner’s Manual ................................1 Certificate of Compliance ............................3 Certificate of Compliance ............................4 Packing Contents ..............................5 Introduction ................................6 Sensor Models ............................... 7 Product Diagram ..............................8 Getting Started ..............................9 Dark Calibration ..............................11 Taking a Measurement ............................
- Page 3 RoHS 3 compliant using exemption 6c. Further note that Apogee Instruments does not specifically run any analysis on our raw materials or end products for the presence of these substances, but we rely on the information provided to us by our material suppliers.
- Page 4 RoHS 3 compliant using exemption 6c. Further note that Apogee Instruments does not specifically run any analysis on our raw materials or end products for the presence of these substances, but we rely on the information provided to us by our material suppliers.
- Page 5 Case MS-100 InSight Spectroradiometer Protective Case Quick Start Guide Mini-USB Cable Power Adapter Modbus Communication Board Neck Strap Screw Neck Strap...
- Page 6 (e.g., plant phenotyping) platforms. Please note that the meter is not waterproof. Apogee Instruments InSight model MS-100 (380 to 780 nm measurement range) spectroradiometers are handheld units designed for laboratory and field use. Each spectroradiometer consists of a spectrometer (slit, diffraction grating, detector array) and diffuser mounted in a small plastic housing.
- Page 7 The Apogee InSight MS series handheld quantum spectroradiometers covered in this manual are self-contained and come complete with a handheld meter, carrying case, protective case, quick start guide, mini-USB cable, power adapter, communication board, neck strap screw, and neck strap. Sensor model number is located on a label on the right side of the meter.
- Page 9 Date/Time on your PC. Charging the Internal Battery Connect one end of the mini-USB charger cable to the MS-100 and the other end into a wall socket with the appropriate voltage. You can also connect the meter to a computer to charge. The indicator light will illuminate orange while it is charging.
- Page 10 Using the Lanyard Strap/Tripod You can attach a lanyard (neck strap) onto the ring at the bottom of the MS-100. If you detach the lanyard screw on the bottom of the MS- 100, it will expose a screw hole where you can attach a...
- Page 11 It is good practice to perform a dark calibration every time you turn on the MS-100, whenever you move to a different temperature environment (hot to cold or cold to hot), or whenever you move to a different light intensity environment (light to dark or dark to light).
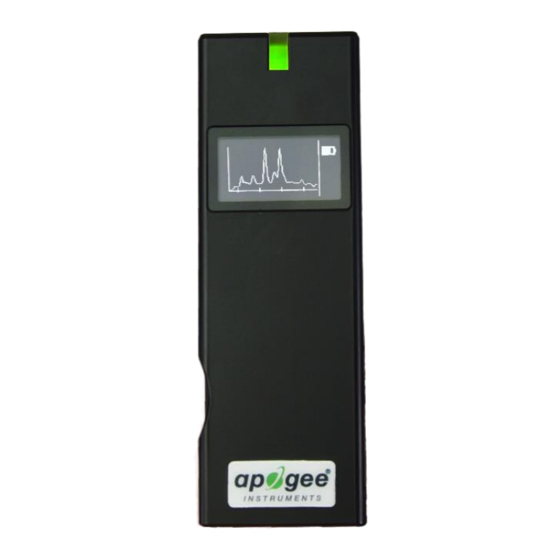
- Page 12 1. Slide the sensor cover up over the sensor diffuser on the back of the unit. 2. Turn on the MS-100 by pressing the On/Off button on the left side of the unit. The indicator light on the front of the unit will illuminate green, and an Apogee splash screen will display.
- Page 13 The battery level indicator is on the top right. 7. Hold the MS-100 as shown with the sensor facing toward the front, in the direction of a light source, and press the “measure” button on the top of the MS- 100.
- Page 14 PPFD: photosynthetic photon flux density. Sum of photons between 400 and 700 nm in units of micromoles per square meter per second [mmol m ] for instantaneous measurements. PPFD is almost universally used to quantify photosynthetically active radiation (PAR), radiation driving photosynthesis. PFD: photon flux density.
- Page 15 CCT: correlated color temperature. Metric quantifying color appearance of white light sources. It is reported as an absolute temperature (in units of K) and typically ranges from 2000 to 6500 K, with lights that appear blue (cool colors) being higher numbers and lights that appear orange (warm colors) being lower numbers. For example, clear blue sky ranges from about 15000-25000 K and flame ranges from about 1700-2000 K.
- Page 16 LambdaP: peak wavelength. Wavelength where maximum radiation is measured, in units of nanometers [nm]. LambdaD: dominant wavelength. Wavelength indicating perceived color of a radiation source, in units of nm. It is the wavelength within the visible range that aligns with perceived hue. CIE 1931 x and y: chromaticity coordinates calculated from CIE 1931 color matching functions.
- Page 17 MS-100 SPECTRUM Sensor CMOS Linear Image Sensor Wavelength Range 380 to 780 nm Wavelength Data 1 nm Increment Spectral Bandwidth Approximately 12 nm (half bandwidth) Wavelength ± 1 nm Reproducibility Measurement Range PPFD: 2 to 1,200 µmol mˉ² sˉ¹; Lux: 70 to 70,000 lx Illuminance Accuracy ±...
- Page 18 PPF-NIR (700 to 780 nm) mˉ² sˉ¹ Percent Flicker 8. Spectral Power Distribution (SPD) mW/m2 9. Peak Wavelength (λp) 10. Peak Wavelength (λpV) 11. Integration Time (I-Time) SYSTEM CONFIGURATIONS Display 0.96” 128x64 mono OLED ≒ 1.2 million files @ 8 GB Micro-SD card (Excel) Maximum Files Battery Operation ≦...
- Page 19 Directional (cosine) response is defined as the measurement error at a specific angle of radiation incidence. Error for Apogee InSight MS-100 series spectroradiometers is approximately ± 2 % and ± 5 % at solar zenith angles of 45° and 70°,...
- Page 20 Launch the Apogee InSight software. Plug your spectroradiometer into the PC using the included mini-USB cable. To connect your MS-100, click on “Device.” Under “Device List,” select on your meter and choose “Connect.” This will also automatically sync up your device with the Date/Time on your...
- Page 21 VIEW SCREEN Load Data: Load previously saved data from your PC. Save Data: Save data to your PC. Data rows can also be selected to be saved individually. Capture: Spectroradiometer takes a light measurement. Continuous Capture: Spectroradiometer continuously takes light measurements at short intervals (approximately every 5 seconds), allowing you to move and reposition the sensor without needing to click the “Capture”...
- Page 22 The “Spectrum” window graphs the wavelength spectrum of your light measurements. You can view multiple captures at the same time. The captures are tracked in the “Data” window below the graph. The x- axis represents wavelength, and the y- axis represents intensity.
- Page 23 The “Mark” check box allows you to the numerical data from your captures across a vertical cross section of the spectrum. Select the data you want to see and drag the vertical line side to side to change the spectrum values. The “Data”...
- Page 24 The CIE Chart Window displays CIE 1931 or CIE 1976. • CIE 1931 x and y: chromaticity coordinates calculated from CIE 1931 color matching functions. • CIE 1976 u’ and v’: chromaticity coordinates calculated from CIE 1976 color matching functions. Zoom in and zoom out on the graph with the buttons in the right-hand corner.
- Page 25 In the lower right-hand corner of the screen, you can choose to display the “Basic List,” “Color Rendering Index (CRI) chart,” “CRI pie chart,” or “Gamut Area Index (GAI)/CRI chart.” To check the measurements, select the list icon with a green check mark. Click on the measurement to the right (1-5) you want to replace.
- Page 26 LOG SCREEN The “Log” window automatically captures and logs light measurements at certain intervals. Use the tool bar to save log data to your computer. Use the load log button to review previously saved logs. You can choose which measurements you want to log. To change your selections, click on the list icon with a green check mark in the bottom right corner.
- Page 27 Log mode determines the intervals for automatic continuous captures. There are two modes: timer mode and count mode. Timer Mode: Uses interval and total time as parameters. For example, the MS-100 captures data every 5 seconds for 1 minute total.
- Page 28 BIN SCREEN The “Bin” feature is used to classify a light measurement within a given range of boundaries as mapped on the CIE charts. You can upload a past bin file or capture new data. A mark will show you whether the measurement is within the acceptable boundaries for the Energy Star standards.
- Page 29 You can add to or remove ellipse boundaries from the current Bin chart by using the Ellipse Editor. CCT is the name of the boundary and must be represented by a number between 2700-8000 (representing the CCT number). The x, y, coordinates represent the center of the ellipse.
- Page 30 CHECKER SCREEN On the “Checker” screen, you can test different measurement values as either a pass or fail based on your custom parameters. Green check marks mean pass and red Xs mean fail for each item. To change your parameters, click on the “Term Lock”...
- Page 31 TRANSMIT SCREEN The transmit function is used to measure the transmittance between the standard light and the test sample. There are two modes: boundary mode and center mode. Boundary Mode: Allows you to input the minimum and maximum values to create a boundary range. Center Mode: Allows you to input the central value and its respective width.
- Page 32 TM-30 SCREEN TM-30-15 is a relatively new color rendering index system published by IES (Illuminating Engineering Society). A color rendering index system indicates how well a light, when shining on an object, can reproduce the object’s color accurately (compared to a black body radiator – e.g., the sun). The Rf metric is sometimes called color fidelity index.
- Page 33 In the bottom right corner of the screen, you can select the TM30 Chart you want to view: Rf RG Plot (upper left); Rfh, j (upper right); or Chroma Shift (lower right). Select the orange text button to view numerical values for each point on the graph.
- Page 34 Additional data such as Integration Time, R1-R15, LambdaPV, and all the intensity data for each wavelength in the Wavelength Spectrum are all available in the file. The MS-100 can also interface with a PC using the Apogee InSight PC Software, which provides a much richer functional and visual environment,...
- Page 35 Apple or Google Play store. To connect your MS-100 unit to the app via Bluetooth, click on the Bluetooth icon in the top right corner. Make sure the unit is powered on. Select “Yes” when asked to reset the Bluetooth connection. Select the device that pops up under “Available Device.”...
- Page 36 Apogee InSight has 8 screen options: 1. Browser 2. Basic 3. Spectrum 4. PPFD Spectrum 5. CIE1931 6. CIE1976 7. CRI 8. Settings (secondary page) The “Browser” screen allows you to choose past measurements.
- Page 37 On the “Basic” screen, you can select measurements to test. Click the rainbow measurement button at the bottom of the screen to take a measurement. Scroll up and down the screen to view each measurement. To change your selected measurements, click the gear icon in the bottom right of the screen.
- Page 38 On the “Spectrum” screen, you can view a spectrum graph of your measurement. Drag the white marker left and right to view the exact measurement data. On the “PPFD Spectrum” screen, you can view a spectrum graph of your measurement. Drag the white marker left and right to view the exact measurement data.
- Page 39 After selecting the gear icon, select the “Reference Spectrum” setting. You can choose which reference spectrum you want to measure against on the “PPFD Spectrum” page. On the “CIE1931” screen, you can view the CIE1931 graph of your measurement. CIE 1931 x and y: chromaticity coordinates calculated from CIE 1931 color matching functions.
- Page 40 On the “CIE1976” screen, you can view the CIE1976 graph of your measurement. CIE 1976 u’ and v’: chromaticity coordinates calculated from CIE 1976 color matching functions. On the “CRI” screen, you can view a color rendering index graph of your measurement.
- Page 41 To access the “Setting” page from the home screen, click on any of the “Basic,” “Spectrum,” “PPFD Spectrum,” “CIE1931,” “CIE1976,” or “CRI” options. Click on the gear setting icon in the lower right corner of these screens. To perform a dark calibration, click on the “Dark Calibration” option. The calibration takes approximately 5 seconds.
- Page 42 This product is a high-precision measurement device with sensitive components. Although the meter is very stable, nominal accuracy drift is normal for all research-grade sensors. To ensure maximum accuracy, we generally recommend units are sent in for recalibration every year, although you can often wait longer according to your particular tolerances.
- Page 43 When the meter is maintained properly the battery should last for many years, even after continuous use. To charge the battery, connect one end of the mini-USB charger cable to the MS-100 and the other end into a wall socket with the appropriate voltage. You can also connect the meter to a computer to charge. The indicator light will illuminate orange while it is charging.
- Page 44 RETURN AND WARRANTY POLICY RETURN POLICY Apogee Instruments will accept returns within 30 days of purchase as long as the product is in new condition (to be determined by Apogee). Returns are subject to a 10 % restocking fee. WARRANTY POLICY...
- Page 45 84321, USA 5. Upon receipt, Apogee Instruments will determine the cause of failure. If the product is found to be defective in terms of operation to the published specifications due to a failure of product materials or craftsmanship, Apogee Instruments will repair or replace the items free of charge.
Need help?
Do you have a question about the MS-100 and is the answer not in the manual?
Questions and answers