Table of Contents
Advertisement
Quick Links
Advertisement
Table of Contents

Related Manuals for Smart Storm USI


Summary of Contents for Smart Storm USI
- Page 1 USI Level User Manual USI Level METER INSTRUCTION MANUAL Date : 23/01/2021 Version: 2.3 The Old Mill Lower Slack Wainstalls Halifax, HX2 7TJ Tel: +44 (0)1422 363462 Enquiries@smartstormgroup.com Web: www.smartstormgroup.com Smart Storm Ltd. Page 1/20...
-
Page 2: Table Of Contents
USI Level User Manual Table of Contents Revision History ......................... 3 Design ............................4 Run ............................ 4 Text ........................4 2.1.1 Graph ........................5 2.1.2 Echo Profile ......................6 2.1.3 Display Config ....................7 2.1.4 Setup ..........................8 System ......................... 8 2.2.1... -
Page 3: Revision History
V CHAPRONT dimensional diagram Welcome to the USI. The USI uses intuitive programming through its touch screen display. The user will navigate through the different screen with ease to calibrate, programme and display chosen options. This largely negates the need for a detailed instruction manual and provided the user is familiar with the generic terms (see glossary) he or she should enjoy trouble-free operation. -
Page 4: Design
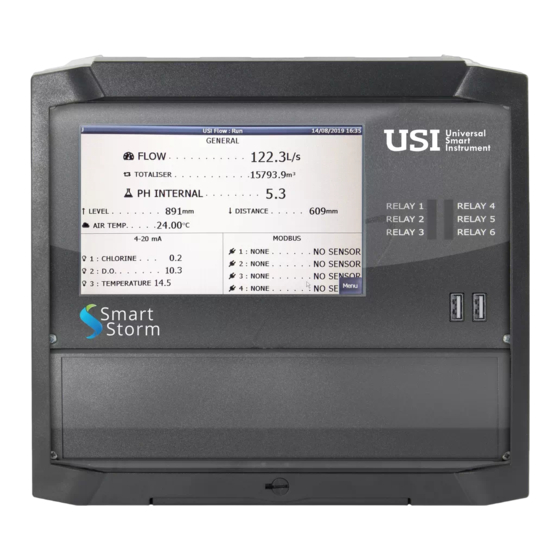
USI Level User Manual 2 Design 2.1 Run Text 2.1.1 What: Display the current readings value. Description: • Displays the value of Flow, Temperature, Totaliser, and all of the defined inputs. • The box below the value displays the daily readings of the last 7 days. Scroll to view. -
Page 5: Graph
USI Level User Manual Graph 2.1.2 What: Shows the measured readings as a graph. Description: • Show each readings as a graph. • The range of the graph is defined in Setup-System (see section 2.2.1 System on page 8). Smart Storm Ltd. -
Page 6: Echo Profile
USI Level User Manual Echo Profile 2.1.3 What: Show the actual signal received by the sensor. Description: • The signal received by the sensor is display on the graph. • The distance calculated is shown by a green arrow at the top of the graph. -
Page 7: Display Config
USI Level User Manual Display Config 2.1.4 What: Shows the current configuration of the device Smart Storm Ltd. Page 7/20... -
Page 8: Setup
• Units: Set the units used to display value. If the system of units (Metric or Imperial) is changed, the USI will have to be reset to its factory settings. Please download any data before doing that (see section 3.1 Download on page 17);... -
Page 9: Device
USI Level User Manual Device 2.2.2 What: Define the primary device used to measure the flow. Description: • Tank Enabled: Whether the selected sensor is used or not. • Name: Name given to the selected tank. This name will be used through the software to identify this tank. -
Page 10: Volume
USI Level User Manual Volume 2.2.3 What: Select the shape of the tank. Description: • Tank1/Tank2: Select which tank to configure. If a name has been given to the tank, it will be displayed in the box. • Shape: Select the shape of the tank. For each tank, a drawing will be displayed to help entering its dimension. -
Page 11: Relay
USI Level User Manual Relay 2.2.4 What: Configuration screen for the relays. Description: • Configure up to 6 relays. Select the type, tank on and off point and pump. • Pump: The pump option can enabled various behaviour for relays to work together: Fixed Pump: the relay work by itself ◦... -
Page 12: Site Details
USI Level User Manual Site Details 2.2.5 What: Details of the site in which the device is installed. Description: • The Name and the ID are used to name the data file. Please enter something meaningful to help recognise the file. -
Page 13: About
USI Level User Manual About 2.2.6 What: Display version and copyright information. Description: • Version: The version of the software. Smart Storm Ltd. Page 13/20... -
Page 14: Logger
USI Level User Manual 2.3 Logger Download 2.3.1 What: Download data logged on the device. For more details on how to download, see section 3.1 Download on page 17. Description: • When pressing a download button, the user will be asked to enter a Site Name, if this has not been done before. -
Page 15: Data Viewer
USI Level User Manual Data Viewer 2.3.2 What: Configure a viewer to display previous logged data. Description: • 3 difference viewer can be used: Daily: A summary of a daily readings display as a report (range: 4 weeks). ◦ Detailed: Detailed readings display as a report (range: 1 day). -
Page 16: How To
3. Go into the Download sub-menu (see section 2.3.1 Download on page 15 for the interface) 4. Press the “Download” button • If you have an existing file on your USB stick, the USI will automatically transfer any new data to the file;... -
Page 17: Change The Software
3.4 Change the software On this test unit, both USI Flow and USI Level are installed. However, it is not possible for both of them to run at the same time. To select which application to run: 1. -
Page 18: Wiring Diagram
USI Level User Manual 4 Wiring Diagram Smart Storm Ltd. Page 18/20... -
Page 19: Dimension
USI Level User Manual 5 Dimension All dimensions are in millimetres. Smart Storm Ltd. Page 19/20... -
Page 20: Glossary Of Terms
– a 4-20mA input signal from an external pH meter can be calibrated and logged by the USI. • pH internal – the USI has an integrated pH meter which can be calibrated directly with a pH sensor. • Primary Device – Either a Flume or Weir through which the flow is to be measured •...
Need help?
Do you have a question about the USI and is the answer not in the manual?
Questions and answers