Table of Contents
Advertisement
Quick Links
Advertisement
Table of Contents

Related Manuals for PERSEE T3


Summary of Contents for PERSEE T3
- Page 1 Compatible Visible Spectrophotometer T3/T3M...
- Page 3 T3 / T3M Instruction Manual Introduction Persee Analytics Inc. Thanks your purchase spectrophotometer. UV-Visible Spectrophotometer is a well-accepted, documented technique with many applications. The technique is extensively used for the analysis of agricultural products and is widely used in public health, environmental protection, life sciences industries and many other organic and biochemical applications.
- Page 4 T3 / T3M Instruction Manual read the instruction manual carefully before operation. If the equipment is used in a manner not specified by the manufacturer, the protection provided by the equipment may be impaired. ◆ Avoid collision and handle the instrument carefully during transportation.
- Page 5 T3 / T3M Instruction Manual Notice: The light source of the instrument must be preheated for 10 minutes. It can start measurement after preheating. Please ensure that the battery is charged amply before using the instrument. The charging time should not be too long.
- Page 6 T3 / T3M Instruction Manual Instrument should be avoided working in strong electromagnetic environment. Balance the energy after changing measurement assembly.
-
Page 7: Table Of Contents
T3 / T3M Instruction Manual Contents: Chapter 1 Introduction 1.1 Uses 1.2 Structures 1.3 Characters 1.4 Functions and configuration 1.4 Specifications and performance Chapter 2 Main units 2.1 Main unit configuration 2.2 Test tube holder accessory 2.3 Cell holder accessory 2.4Main unit and interface introduction... - Page 8 T3 / T3M Instruction Manual 4.1.1 Interface introduction 4.1.2 Auto zero 4.1.3 Sample measurement 4.2 Operation 4.2.1 Main interface 4.2.2 Food analysis 4.2.3 Water analysis 4.2.4 Quantitative measurement 4.2.5 Photometric measurement 4.2.6 Kinetics 4.2.7 Spectrum scanning 4.2.8 System settings 4.3 Video...
- Page 9 T3 / T3M Instruction Manual Chapter 6 Instrument maintenance 6.1 Maintenance cautions 6.2 Replacement of battery 6.3 Replacement of fiber probe and reflection mirror Chapter 7 Troubleshooting Chapter 8 Instrument Configuration...
-
Page 10: Chapter 1 Introduction
T3 / T3M Instruction Manual Chapter 1 Introduction 1.1 Uses is a small portable quick-test instrument, whose measurement speed is very fast. The dimension of the instrument is small, and it’s light. It is convenient for carrying and manually operation. It can not only be used in the lab, but also special for the wild environment monitor and on-site real time detection. -
Page 11: Functions And Configuration
T3 / T3M Instruction Manual perfect software and hardware platform for the functions implementations of the instrument. For the convenience of user's operation, extra large display touch-screen is used for display. The monochrometer adopts concave plate holographic grating made by French JY company integrated with CCD ILX511 detector made by Japanese Sony Company featuring with high wavelength accuracy and low stray light. -
Page 12: Specifications And Performance
T3 / T3M Instruction Manual The optical structure support multi kinds of sampler holders changeable and the light source energy can be adjust automatically. Built-in chargeable battery, it can work for 5 hours with one charging. (with full loaded, it can do precision measurement for 4-5 hours ) ... - Page 13 T3 / T3M Instruction Manual Immerging fiber probe, 10mm pathlength, 20mm Measurement parts Pathlength (Exchange); cell holders; test tube holders Built-in chargeable battery and one charging for 5 hours work. Power supply Charger Printer Micro printer (optional) Embedded operation system, integration 2G-Flash Operating system memorizer.
-
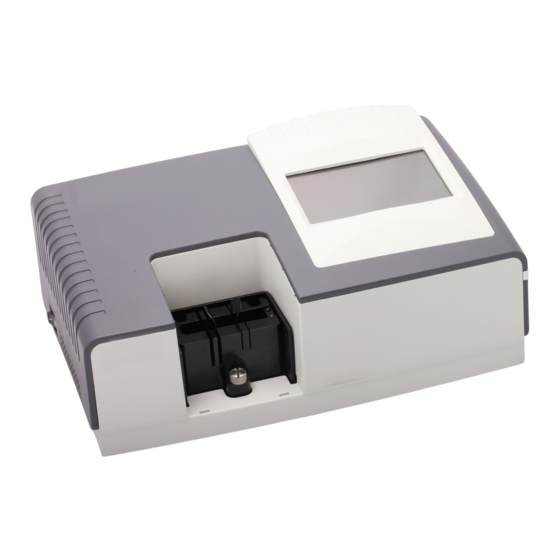
Page 14: Chapter 2 Main Units
T3 / T3M Instruction Manual ≤0.3% Photometric repeatability Dimension 280×170×110mm Environmental Operation environment 5-30℃ temperature Store environment -20-55℃ Chapter 2 Main units 2.1 Main unit configuration Figure 2-1 Main unit 2.2 Test tube holder accessory... - Page 15 T3 / T3M Instruction Manual There are two kinds of test tube holder: 1. φ25 test tube holder: shown as figure 2-2. Loose the fixed screws off the hole, insert theφ25 test tube into the test tube holder, and the test tube is fixed by the spring.
- Page 16 T3 / T3M Instruction Manual Figure 2-3φ16 Test tube holder accessory Cautions: If choosing the special test tube with arrow label it’s necessary to rotate for location after inserting the test tube into test tube holder. The two arrows on test tube and test tube holder should be matched as figure 2-4 shown.
-
Page 17: Cell Holder Accessory
T3 / T3M Instruction Manual 2.3 Cell holder accessory Shown as figure 2-5. Figure 2-4 Cell holder The cell holder is consist of holder, baffle and spring. It supports 10mm, 20mm, 50mm cuvettes. The baffle and spring work together to fix the position of cuvettes, assure the precision of measurement. - Page 18 T3 / T3M Instruction Manual Figure 2-6 Installation of cell holder...
-
Page 19: Main Unit And Interface Introduction
T3 / T3M Instruction Manual 2.4 Main unit and interface introduction SIM Card RS23 USB main GPS interface interface USB slave interface Power switch Charger indicator AC plug Figure 2-2 Main unit and interface Power switch (ON/ OFF): Turn on the main unit and the instrument is running. - Page 20 T3 / T3M Instruction Manual when the charging is finished. RS232: The interface is connected with printer and accessories through special communication cable. USB main interface: Support the flash memory, saving the data into the flash memory. Also can connect with the USB printer.
-
Page 21: Connection Between The Main Unit And Pc/Accessories
T3 / T3M Instruction Manual 2.5 Connection between the main unit and PC/Accessories The RS232 interface is connected as Figure 2-9. One side of the special communication cable is connected with the RS232 port, while the other side is connected with the printer. Print the data and spectrum directly by pressing “Print”... -
Page 22: Power Supply Monitor And Battery Charging
T3 / T3M Instruction Manual Figure 2-9 RS232 port communication 2.6 Power supply monitor and battery charging Charge interface is connected as Figure 2-10. - Page 23 T3 / T3M Instruction Manual Figure 2-10 Charging interface connection When the main unit is running, it will display the battery volume on the right upper corner. See figure 2-11.
- Page 24 T3 / T3M Instruction Manual Figure 2-11 Power display There will be some notice if battery is low. See figure 2-12. Please use the charging power supply for offering power to the main unit and charging the battery. The charging power supply should be connected with AC of 100-240V/50-60Hz.
-
Page 25: Chapter 3 Measurement Accessories Instruction
T3 / T3M Instruction Manual recommended charging time should not be too long to avoid damage the battery. The charger specification is 100-240V/50-60Hz input and 18.5V/3.5A output. Figure 2-10 Low battery Chapter 3 Measurement accessories instruction Note: The flexing diameter of the fiber should be bigger than 0.1 meter to... - Page 26 T3 / T3M Instruction Manual specifications of fiber probe: Wavelength range: 380-800nm Pathlength: 10mm, 20mm (interchangeable) Standard SMA 905 port Attached with holder, easy to install on site. The reflection mirror can be disassemble, easy to clean ...
-
Page 27: Using Method
T3 / T3M Instruction Manual 3.2 Using method The branching ends of the fiber probe connect with the light source export and sample light import respectively, choose different path length according to different measure method. Insert the fiber probe into holder. -
Page 28: Chapter 4 Operation
T3 / T3M Instruction Manual Chapter 4 Operation 4.1 Instruction before using 4.1.1 Interface introduction There are four parts of the interface, which are status bar, navigation bar, current page and tool bar. See figure 4-1. Status bar Navigation Current... - Page 29 T3 / T3M Instruction Manual Current page: The current page is switched by the navigation bar. Navigation bar: In the middle of navigation bar is the current measurement, shown as figure 4-1 is “Spectrum scanning”. The button on the both sides can be used to switch between different pages.
- Page 30 T3 / T3M Instruction Manual Click the option you want to select, the background turns blue. If the color doesn’t change after clicked, then it means you cannot select this option. Multiple choice drop-down box: Click the drop-down arrow, the following option box, click the option you need.
- Page 31 T3 / T3M Instruction Manual Figure 4-3 Figure 4-4 Figure 4-3 is the numerical input panel, Figure 4-4 is the text input panel. For Figure 4-3 — 0~9 Numerical input keys; Enter the decimal point; Clear the input, re-enter; Delete the data-in front of;...
- Page 32 T3 / T3M Instruction Manual Save the new input and exit. For Figure 4-4: — 26 letters; Shift the input methods among characters, numbers, and PinYin; Space; Next line; Delete the date-in front; Previous line; Save the new input and exit;...
- Page 33 T3 / T3M Instruction Manual If the main page is spectrum, double-click the spectrum, a spectrum processing box will pop up as follows: Figure 4-4 The functions of the buttons are as follows: Zoom in; Zoom out; Peak search;...
- Page 34 T3 / T3M Instruction Manual Translate; Full screen; Read screen point data; Change the range of coordinates; Distance measuring, positioning by dragging the acute angle of the triangle; Read the point value on the spectrum, if click this button, use the arrow moving from left to right to select the date point;...
-
Page 35: Auto Zero
T3 / T3M Instruction Manual 4.1.2 Auto Zero Before measuring the transmittance (T%) and absorbance (Abs), the use needs to carry out the zero calibration. The steps are as follows: Step one: put in the blank solution, press the button <zero>, which reminds you... -
Page 36: Operation
T3 / T3M Instruction Manual The process of auto zero and measurement will not be mentioned again in the following description. 4.2 Operation 4.2.1 Main Interface Switch on the mainframe, the main interface (see Figure 4-8) will display after the boot screen. -
Page 37: Food Analysis
T3 / T3M Instruction Manual will perform the corresponding functions. The following is the introduction to the six functions. 4.2.2 Food analysis This module includes more than 50 methods of food analysis: nitrite, sulfur dioxide, formaldehyde, cyanide and peroxide value, etc. - Page 38 T3 / T3M Instruction Manual Figure 4-9 Choose the method, the description characters of this method will turn into deep color, click" start measuring”, at first, it will remind you to choose appropriate measurement modules, see fig.4-10. Figure 4-10 Click "OK", enter into the measurement interface shown in fig.4-11.
- Page 39 T3 / T3M Instruction Manual Figure 4-11 The operations user can be done on the measuring main page are: ·Zero: zero before measurement. According to prompt: put in the blank solution, return to the measuring interface to measure after zeroing.
- Page 40 T3 / T3M Instruction Manual ·Quantity: input the mass or volume of sample. ·Dil. Factor: If the concentration exceeds the concentration limit, it can be diluted before the test, as a baseline for measurement. Click the on the navigation bar to set the parameters. The interface as Figure 4-12 will pop up, which consist of parameter option page and instrument option page.
- Page 41 T3 / T3M Instruction Manual ·Concentration range: display the upper and lower limits of concentration of this method. ·Timers Count: modify the number of timers and the time for them. ·Significant figure: number of significant digits displayed. ● Instrument Setting Page Figure 4-13 ·Average times: can be selected from 1, 2, 4, 8 to 16.
- Page 42 T3 / T3M Instruction Manual ● Lamp Setting page Figure 4-14 ·Lamp on/Lamp off: set the status of the lamp. ·Energy balance: adjust the energy of tungsten lam. (After changing measurement assembly click this button to satisfy requirement)
- Page 43 T3 / T3M Instruction Manual ● Sample information page Figure 4-15 ·Sample Ent. : set the company of sample belongs to. ·Sample Name: set the name of measured sample. ·Operator: set the name of operator. Enter the calibration standards page by clicking the...
- Page 44 T3 / T3M Instruction Manual Figure 4-16 ·Add: add a new standard sample, you will first input the concentration of the standard sample as figure 4-17 shown.
- Page 45 T3 / T3M Instruction Manual Figure 4-17 ·Zero: Zero before measurement. ·Start: begin to measure. ·Delete: delete the selected standard sample. ·Apply: apply the method and save. ·Return: return to the setting interface By shift between “Standard” and “Curve” can view the related data and fitting information.
- Page 46 T3 / T3M Instruction Manual Figure 4- 18 Curve Click the button in the navigation bar on the measurement interface can view the previous measuring results corresponding to the current method.
- Page 47 T3 / T3M Instruction Manual Figure 4-19 ·Delete: select and delete the certain data. ·Print: pint the selected data. ·All/None: select all the data. If all is selected the current option will be “None”, which can clear the options. ·Export: insert the flash memory into the USB slot, the user can export the data to it.
- Page 48 T3 / T3M Instruction Manual Figure 4-20 ·Reference: measure the reference solution, then get the value A1 of reference solution, timer begin to count down. ·Sample: measure the sample solution, then get the value A1 of sample solution. Put the reference solution into test tube holder when the timer is to finish counting down, the value of A2 of reference solution will be automatically read out.
-
Page 49: Water Analysis
T3 / T3M Instruction Manual 4.2.3 Water quality analysis This module includes more than 30 methods of water quality analysis: Cr VI, cyanide, free chlorine and sodium reagent ammonia, etc. User can also customize dedicated measuring methods (under <quantitative measurement> mode) The ordinary procedure of <water quality analysis>: select measuring... - Page 50 T3 / T3M Instruction Manual deep color, click" start measuring”, at first, it will remind you to choose appropriate measurement modules, see fig.4-22. Figure 4-22 Click "OK", enter into the measurement interface shown in fig.4-23.
- Page 51 T3 / T3M Instruction Manual Figure 4-23 The operations user can be done on the measuring main page are: ·Zero: zero before measurement. According to prompt: put in the blank solution, return to the measuring interface to measure after zeroing.
- Page 52 T3 / T3M Instruction Manual ·Dil. Factor: If the concentration exceeds the concentration limit, it can be diluted before the test, as a baseline for measurement. Click the on the navigation bar to set the parameters. The interface as Figure 4-24 will pop up, which consist of parameter option page and instrument option page.
- Page 53 T3 / T3M Instruction Manual method. ·Timers Count: modify the number of timers and the time for them. ·Significant figure: number of significant digits displayed. ● Instrument Setting Page Figure 4-25 ·Average times: can be selected from 1, 2, 4, 8 to 16.
- Page 54 T3 / T3M Instruction Manual ● Lamp Setting page Figure 4-26 ·Lamp on/Lamp off: set the status of the lamp. ·Energy balance: adjust the energy of tungsten lam. (After changing measurement assembly click this button to satisfy requirement)
- Page 55 T3 / T3M Instruction Manual ● Sample information page Figure 4-27 ·Sample Ent. : set the company of sample belongs to. ·Sample Name: set the name of measured sample. ·Operator: set the name of operator. Enter the calibration standards page by clicking the button on the navigation bar, then measure the standard sample.
- Page 56 T3 / T3M Instruction Manual Figure 4-28 ·Add: add a new standard sample, you will first input the concentration of the standard sample as figure 4-29 shown.
- Page 57 T3 / T3M Instruction Manual Figure 4-29 ·Zero: Zero before measurement. ·Start: begin to measure. ·Delete: delete the selected standard sample. ·Apply: apply the method and save. ·Return: return to the setting interface By shift between “Standard” and “Curve” can view the related data and fitting information.
- Page 58 T3 / T3M Instruction Manual Figure 4- 30 Curve Click the button in the navigation bar on the measurement interface can view the previous measuring results corresponding to the current method.
-
Page 59: Quantitative Measurement
T3 / T3M Instruction Manual Figure 4-31 ·Delete: select and delete the certain data. ·Print: pint the selected data. ·All/None: select all the data. If all is selected the current option will be “None”, which can clear the options. ·Export: insert the flash memory into the USB slot, the user can export the data to it. - Page 60 T3 / T3M Instruction Manual measurement> are: New measuring——measure the standard sample——measure the sample——save data——view data——print data/export data. See Figure 4-32 for the interface of quantitative measurement, Figure 4-32 Quantitative The operations user can be done on the measuring main page are: ·Zero: zero before measurement.
- Page 61 T3 / T3M Instruction Manual the user can input the name of the data. If GPRS is on, the data the relevant information will be uploaded in the mean time. ·Timer: start the predefined timer. ·Exit: back to the main page.
- Page 62 T3 / T3M Instruction Manual The options can be set up are: ·Single wavelength/dual wavelength: set the measurement wavelength ·1 Order/ 2 order: times of fitting ·Coefficient a, b, c: in order, coefficient of constant, the first degree polynomial, and the quadratic degree polynomial.
- Page 63 T3 / T3M Instruction Manual ● Instrument Setting Page Figure 4-34 ·Average times: can be selected from 1, 2, 4, 8 to 16.
- Page 64 T3 / T3M Instruction Manual ● Lamp Setting Page Figure 4-35 ·Lamp on/Lamp off: set the status of the lamp. ·Energy balance: adjust the energy of tungsten lam. (After changing measurement assembly click this button to satisfy requirement)
- Page 65 T3 / T3M Instruction Manual ● Sample information page Figure 4-36 ·Sample Ent. : set the company of sample belongs to. ·Sample Name: set the name of measured sample. ·Operator: set the name of operator. ·Save method: use can save the current method as user-defined method on measurement page.
- Page 66 T3 / T3M Instruction Manual Figure 4-37 Add: add a new standard sample, you will first input the concentration of the standard sample.
- Page 67 T3 / T3M Instruction Manual Figure 4-38 Zero: Zero before measurement. Start: begin to measure. Delete: delete the selected standard sample. Apply: apply the method and save. Return: return to the setting interface By shift between “Standard” and “Curve” can view the related data and fitting information.
- Page 68 T3 / T3M Instruction Manual Figure 4- 39 Curve Click the button in the navigation bar on the measurement interface can view the previous measuring results corresponding to the current method.
- Page 69 T3 / T3M Instruction Manual Figure 4-40 ·Delete: select and delete the certain data. ·Print: pint the selected data. ·All/None: select all the data. If all is selected the current option will be “None”, which can clear the options. ·Export: insert the flash memory into the USB slot, the user can export the data to it.
-
Page 70: Photometric Measurement
T3 / T3M Instruction Manual Figure 4-41 ·Load method: replace the current parameters setting with parameters for the selected methods and enter the measuring interface. ·Delete: delete the selected method. ·Delete all: clear the list of all the methods. Note: if the user does not select the method, when the quantitative measurement is opened, the default parameters will be those of previous measurement. - Page 71 T3 / T3M Instruction Manual wavelength point and do the photometric measurement. The process is: “set measuring parameters → measure samples → save data → view data → print data”. Figure 4-42 See Figure 4-42 for photometric measurement interface. Press...
- Page 72 T3 / T3M Instruction Manual Figure 4-43 ● Parameter Setting Page ·Abs/T%/Es: choose the working mode between Abs, T% and Es. ·Wavelength: input the value of a wavelength point. ·Coeff. K: the value displayed in the column 【K× result】 is the result produced by point value measured multiplying this value.
- Page 73 T3 / T3M Instruction Manual Figure 4-44 ·Average times: can be selected from 1, 2, 4, 8 to 16. ·Integrating time: set the integrating time, the longer of integrating time, the higher of energy. ·Gain: set the amplifier times. ● Lamp Setting Page...
- Page 74 T3 / T3M Instruction Manual Figure 4-45 ·Lamp on/Lamp off: set the status of the lamp. ·Energy balance: adjust the energy of tungsten lam. (After changing measurement assembly click this button to satisfy requirement) ● Sample information page...
- Page 75 T3 / T3M Instruction Manual Figure 4-46 Set the information of sample Press button to enter the view page and view the saved photometric measurement results.
- Page 76 T3 / T3M Instruction Manual Figure 4-47 ·View: return the measuring interface to view the measuring value for the current file. 4.2.6 Kinetics “Kinetics” is a measuring method in which the sampling is done continuously at a certain time interval, and the sampling data is displayed in graphics. This method is mainly applied to observe the trend of changes of the samples over time.
- Page 77 T3 / T3M Instruction Manual Figure 4-48 See Figure 4-49 for setting interface.
- Page 78 T3 / T3M Instruction Manual Figure 4-49 ● Parameter Setting Page ·Abs/T%/Es: choose the measuring mode between Abs, T% and Es. ·Wavelength: input a specified wavelength point value ·Interval: time interval between each sampling. ·Total time: total scanning time, no less than the time interval ·Y range: coordinates displayed on Y axis during scanning.
- Page 79 T3 / T3M Instruction Manual results. Figure 4-50 4.2.7 Spectrum “Spectrum” means scanning a certain spectral range at a certain wavelength interval and displaying the measured data in two-dimensional graphics for further analysis and research. The process is: “set measuring parameters → measure samples → save data →...
- Page 80 T3 / T3M Instruction Manual Figure 4-51 See Figure 4-52 for setting interface. New buttons added to the instrument setting page for the user to input the start wavelength, end wavelength and scan Interval.
- Page 81 T3 / T3M Instruction Manual...
- Page 82 T3 / T3M Instruction Manual Figure 4-52 See Figure 4-53 for Browse interface.
- Page 83 T3 / T3M Instruction Manual Figure 4-53 ·View: the selected spectrum will be displayed on the measuring page see Figure 4-51. 4.2.8 Setting The following is the interface of setting:...
- Page 84 T3 / T3M Instruction Manual Figure 4-54 Setting Functions of these buttons are as follows: Date Time Set the system time by inputting the time.
- Page 85 T3 / T3M Instruction Manual Figure 4-55 Lock When locked, the user need to enter the password to unlock the instrument, or it cannot be operated (if GLP is enabled). Figure 4-56 This instrument is equipped with GLP functions. There are three parts of GLP functions: user manager, Log manager, GLP settings.
- Page 86 T3 / T3M Instruction Manual unlock it when the GLP function is ON. (The default password for administrator is 888888). Figure 4-57 Here is the User manager interface.
- Page 87 T3 / T3M Instruction Manual Figure 4-58 ·Add Group: there will be another row after adding, click different table in this line, the edit panel will pop up to edit the information of this group (Only allowed the administrator to carry on this operation).
- Page 88 T3 / T3M Instruction Manual Figure 4-59 ·Group member: list the user of this group, choose the table of this list to edit user’s information and password, add new user, delete user.
- Page 89 T3 / T3M Instruction Manual Figure 4-60 Log manager All the operation will be record into the log. Click “Log” to view.
- Page 90 T3 / T3M Instruction Manual Figure 4-61 Enter this page can view the user information. GLP Setting If the user belongs to the administrator group, “Setting” button will be visible which can be used to control the GLP function ON and OFF, and set the owner organization of this instrument.
- Page 91 T3 / T3M Instruction Manual Figure 4-62 Volume Volume setting is used to adjust the volume of the system.
- Page 92 T3 / T3M Instruction Manual Figure 4-63 Location To obtain the location information is one of the functions of this unit. There are two methods to locate, GPS and GPRS. Figure 4-64 GPRS Location: Make sure SIM card is inserted and click "GPRS" to locate by GPRS.
- Page 93 T3 / T3M Instruction Manual Warning at startup: after selecting Warning at startup, the instrument will remind you whether to locate again during each star-up, see fig.4-65. Figure 4-65 Notice: Make sure the SIM card is recharged when using GPRS location function.
- Page 94 T3 / T3M Instruction Manual GPRS This unit can upload data by GPRS. If this function is enabled, when the measured data is saved on food analysis, water analysis, quantitative mode, it will be uploaded to the wanted address automatically.
- Page 95 T3 / T3M Instruction Manual been changed, then it is no need to modify the choice again. Figure 4-67 Calibrate If the screen fails to response the clicks correctly, the user can enter into this module and click the centers of the small crosses to calibrate the screen.
- Page 96 T3 / T3M Instruction Manual PC Mode Only on PC mode the T3 data viewer can download data from T3 and update. Click “PC Mode” it will ask you: Figure 4-68 Click “OK”, it will show you:...
- Page 97 T3 / T3M Instruction Manual Figure 4-69 Reset Reset the instrument.
- Page 98 T3 / T3M Instruction Manual Figure 4-70 About Get the Serial Number, Software name, Software version, manufacture information and so on from here.
-
Page 99: Video
T3 / T3M Instruction Manual Figure 4-71 4.3 Video Method videos of food analysis and water quality analysis can be viewed under this module. The interface of <Method video> is shown as follows:... - Page 100 T3 / T3M Instruction Manual Figure 4-72 Play video Pause Video back Video forward Stop Full screen Volume up Volume down Quit the interface of method video The list of video files can be viewed after pressing the button "Browse", the...
- Page 101 T3 / T3M Instruction Manual format is wmv. Select relevant video files, and see the files after clicking "View". Figure 4-73...
-
Page 102: Chapter 5 T3 Data Viewer Software Installation And Operation
PC and T3. The software can read the data from instrument, process data and print them out. T3 data viewer can read the data in the flash memory copied from T3 main unit. T3 data viewer can export the measured result or the spectrum to text document (.txt or .csv) -
Page 103: T3 Data Viewer Installation Steps
T3 / T3M Instruction Manual 5.1.1 T3 data viewer Installation steps Insert the T3 data viewer software CD disk into CD driver of PC, and double click ViewerSetup.exe, the following figure will show: Figure 5-1 The software will ask you to install the Microsoft .net Framework 2.0 if without... - Page 104 T3 / T3M Instruction Manual Framework 2.0. Press “Next” it will show you: Figure 5-2 Click Browse to choose the installation directory, press “Next” it will show you:...
- Page 105 T3 / T3M Instruction Manual Figure 5-3 Press “Next” to continue, it will show the following figure after the installation is finished.
-
Page 106: Installation Of Microsoft. Net Framework
T3 / T3M Instruction Manual Figure 5-4 Press “Close” to finish the installation. 5.1.2 Installation of Microsoft .Net Framework 2.0 Find the Microsoft .NET Framework 2.0.exe installation program from the CD disk, and install as the prompt. 5.1.3 Installation of Windows Mobile Device Center... -
Page 107: Installation Of Usb Drivers
5.2 Software operation 5.2.1 Start Start the T3 data viewer software by the following solution. Double click the T3 data viewer v1.0 icon from the desktop to start. Start-Program-T3 data viewer v1.0 Double click the T3 data viewer.exe from the installed file. - Page 108 T3 / T3M Instruction Manual Figure 5-5 5.2.2 Download data Open the download window by choosing [download data] from [file] or clicking from toolbar. Before download the data, make sure the connection between the main unit and communication cable is correct, and the synchronization is achieved...
- Page 109 T3 / T3M Instruction Manual between the main unit and PC. Figure 5-6 If the Windows Mobile Device Center has been installed, the system will notice that the device is on synchronization when the instrument connecting with PC. Press [Import index] button to download data index from instrument.
- Page 110 T3 / T3M Instruction Manual in the default download path as tree form when started. Here is the basic structure of file list: Instrument model File name Measurement data type Method type Measurement data Measurement data Figure 5-7 Double click the measurement data or choose the data and click button to open it.
- Page 111 5.2.4 Browse Spectrum/Kinetics data The page structure for “Spectrum” and “Kinetics” are the same, which can display spectrum, measurement parameters and peak picking results. Spectrum can be operated and analysis by the T3 data viewer software. Figure...
- Page 112 T3 / T3M Instruction Manual 5-9 is the operation menu and tool bar. Figure 5-9 Axis Range: Setting the display range of X-axis and Y-axis. Area Selection: View the local spectrum by drafting the cursor. Full View: Display spectrum on full screen.
- Page 113 T3 / T3M Instruction Manual nearby by clicking the spectrum by the mouse. Or read the spectrum data continuously by the left and right key of keypad. Peak Pick: Show the peak value on spectrum, and show the result of peak picking on the list.
- Page 114 T3 / T3M Instruction Manual 5.2.5 Browse food analysis/water analysis/quantitative measurement data The page for food analysis, water analysis and quantitative measurement are the same. Display the calibration curve, parameters and measurement result on “Quantitative” page. Also can be printed and saved.
- Page 115 T3 / T3M Instruction Manual Figure 5-11 5.2.6 Browse photometric measurement result Display measurement result and parameters on the “Photometry” page, which is shown as the following figure.
- Page 116 T3 / T3M Instruction Manual Figure 5-12 Stop browsing or printing by choosing “Edit”- “Delete current Row’s File Data” when browsing data, this operation will not delete data. 5.2.7 Export data: Open the export wizard by choosing “File”- “Data export” or clicking toolbar.
- Page 117 T3 / T3M Instruction Manual Figure 5-13 Press “Next” to set the file format and path, which is shown as the following figure.
- Page 118 T3 / T3M Instruction Manual Figure 5-14 Press “Export” after finish setting up. The T3 Data Viewer software support two types of file, which are ASCII file and text file. They all can be opened by WordPad program of Windows. And the text file also can be opened by Microsoft Excel.
- Page 119 T3 / T3M Instruction Manual Figure 5-15 Figure 5-16 is page setting, including page setting and printer setting.
- Page 120 T3 / T3M Instruction Manual Figure 5-16 Print by choosing “File”- “Print” or clicking of toolbar.
- Page 121 T3 / T3M Instruction Manual 5.2.9 Program Update Select menu [Help]-[Update Device] to update the program of the instrument. (Make sure the instrument is successfully connected with PC, and under "PC" mode). See the picture below: Figure 5-17 Current version: The software version of the instrument will be displayed after the instrument is synchronous with the PC.
- Page 122 T3 / T3M Instruction Manual Browse: Select the update program. Recover to previous version: If update is not needed, the version can be recovered to previous one. Link to device: Link PC and the instrument, error warning will be displayed if synchronization fails.
- Page 123 T3 / T3M Instruction Manual Figure 5-29...
- Page 124 T3 / T3M Instruction Manual Chapter 6 Instrument maintenance 6.1 Maintenance cautions The main unit and accessories should be put into a convenient box and be locked for transportation. The immerging probe should be cleaned with distilled water and be covered with a rubber cap after the operation.
- Page 125 T3 / T3M Instruction Manual environment is -20-55℃. 6.2 Replacement of battery The effective charging times of the rechargeable batteries inside the instrument are 300-500. The procedure of the replacement of batteries (purchasable from the manufacturer) is as follows: 1. Open the battery cover on the back of the main unit, see fig.6-1, get out the...
- Page 126 T3 / T3M Instruction Manual Figure 6-2 Figure 6-3 3. Connect the the power cable of the new batteries with the main unit, put the cable into the battery box carefully, cover the battery holder (see fig.6-3). Notice: Curl the power cable and put the rest of the cable into the main unit, then put the batteries inside the holder, cover the main unit.
- Page 127 T3 / T3M Instruction Manual Replacement for fiber detector top: After the fiber probe has been used for a long time, the energy is lowered evidently. The trouble phenomenon is that the energy reading at 560nm is lower than 10 when the gain is 1 and integrating time is 0.005s in energy scanning.
- Page 128 T3 / T3M Instruction Manual Chapter 7 Troubleshooting Phenomenon Trouble-shooting The touch-screen is not 1. Restart accurate 2. Re-orientate the touch-screen 1. Energy balance. 2. Tungsten lamp and power switch broken. The energy from the light 3. Very low energy and bad baseline, source is low.
- Page 129 T3 / T3M Instruction Manual charging. 5. Scanning the energy on the Kinetics mode, replace with a new tungsten lamp if the energy fluctuates. 1. Check if the power supply is stable or The menu flashes after the power for the battery is enough.
- Page 130 T3 / T3M Instruction Manual during operation. enough. 2. Turn off the main unit and turn it on again. Initialization error Restart 1. The charging indicator should be lit (If not, contact the manufacture.). 2. Check if the charger is correct.
- Page 131 T3 / T3M Instruction Manual of Microsoft ActiveSync and USB driver are installed in the PC; Unload and re-install Microsoft ActiveSync and USB driver; 1. Make sure the SIM card is recharged; 2. Check whether the surface of the SIM The measurement data card is clean and not damaged;...
- Page 132 T3 / T3M Instruction Manual videos wmv format; 2. Make sure the video files are built in the instrument; Check whether the video files are saved in the primary directory in the flash disk; Check whether the selection of "printer setting" in "system setting" is Cannot print correct;...
- Page 133 T3 / T3M Instruction Manual reference. The final configuration is based on the sales contract. Pipette (5ml) Pipette (1ml) Cell holder Wash bottle Mini triangle stand GPS Test tube module GPS antenna Cuvettes USB cable Charger Test tube φ25mm pH meter Test tube φ16mm...
- Page 134 T3 / T3M Instruction Manual Test tube φ16mm *9 Test tube φ25mm *2 Glass cuvettes 10mm path length *1 Glass cuvettes 20mm path length *1 Glass cuvettes 50mm path length *1 Test tube *1...
- Page 135 T3 / T3M Instruction Manual Persee Analytics Inc. Address:7270 Popham Place, Solon, OH44139, United States Contact:Sean Cao Title:Sales and Marketing Director E-mail:jia.cao@pgeneral.com Tel:(440) 591 9268 Web: www.perseena.com...
Need help?
Do you have a question about the T3 and is the answer not in the manual?
Questions and answers