Table of Contents
Advertisement
Quick Links
Advertisement
Table of Contents

Related Manuals for Infratek 108B


Summary of Contents for Infratek 108B
- Page 1 USERS MANUAL 108B SINGLE- TO FOUR PHASE INFRATEK POWER ANALYZER...
-
Page 2: Table Of Contents
Logging Measure Mode ..................... 7 Transient Measure Mode ....................7 Power-Speed Measure Mode (Option) ................8 Power Analyzer Rear Panel ....................9 Summary of 108B Power Analyzer Features ..............10 Safety Instructions ......................11 Connection to Circuits Measurement in 3-Phase mains Circuit ................12 2.1.1 Three Wattmeter Connection ................ - Page 3 Operations in Transient Measure Mode ................36 4.3.1 What is measured in Transient Measure Mode? ..........36 4.3.2 Two Ways To Use Transient Measure Mode ............. 36 Basics Of Power-Speed Measure Mode (Option) ............38 4.4.1 What Is Measured In Power-Speed Measure Mode ........... 38 4.4.2 Operations in Power-Speed Measure Mode ............
- Page 4 9.2.3 Storing The Calibration Constants ..............70 9.3. A Few Practical Hints ....................... 70 9.4. 108B Calibration using Windows Operating Software (LabView) ........71 9.4.1 Equipment Needed ..................... 71 9.4.2 Calibration Procedure ..................71 9.4.3 Voltage Calibration At 60Hz ................71 9.4.4 Current Calibration At 60Hz (IN 5A) ..............
-
Page 5: Power Analyzer Features, Quick Overview, Safety
VERVIEW AFETY The Infratek 108B High Precision Power Analyzer is available in 1-, 3- and 4- phase versions. All voltage inputs (ranges 0.3V up to 1500Vpeak) and all current inputs (1.5mA up to 1A; 15mA up to 5A; 1A up to 40A; and current shunt inputs 60mV up to 6V) are potential free and exhibit ... -
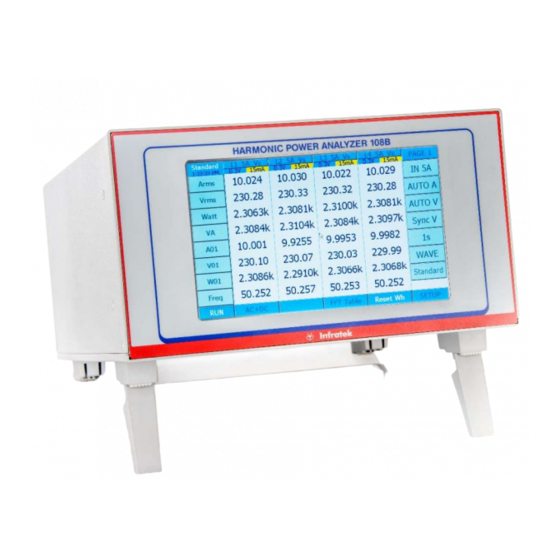
Page 6: Standard Measure Mode
Figure 1.2. Now touch “Arect” which brings you back to Figure 1.1 with the bottom line quantity changed to “Arect”. Four different measure modes enhance the 108B Power Analyzer capabilities. These are: standard measure mode, logging measure mode, transient measure mode, and power-speed measure mode. -
Page 7: Logging Measure Mode
0 to 7. Sections of the wave forms can be expanded by simply touching one of the 4 “Zoom Sectors” (maximum zoom factor is 256). For proper operation you must apply signal synchronization to all installed phases of your Power Analyzer. Figure 1.3 108B 3-Phase Power Analyzer Display in Logging Measure Mode page 7... -
Page 8: Power-Speed Measure Mode (Option)
1, or phase 1 and phase 2, or using phase 1, 2, and phase 3 of the Power Analyzer. At the end of a measurement cycle (maximum 11 seconds) data versus time are plotted, can be expanded to view details, or can be stored. Figure 1.4 108B 3-Phase Power Analyzer in Power-Speed Measure Mode page 8... -
Page 9: Power Analyzer Rear Panel
NALYZER ANEL Figure 1.5 shows the 108B rear panel with four phases installed. Every phase consists of a potential free voltage input along the top side. Below the voltage inputs are the 40A input, and the 5A input (7A max.) with common Lo socket. -
Page 10: Summary Of 108B Power Analyzer Features
108B P UMMARY OF OWER NALYZER EATURES Available as 1-, 3- and 4-phase instrument. Highest precision available: 0.02 % reading + 0.02 % range. 18bit measurement resolution. High accuracy at 10 % full scale. Wide angle, touchscreen TFT color display (800 x 480 pixels). -
Page 11: Safety Instructions
AFETY NSTRUCTIONS The manufacture of this equipment conforms to the safety standards defined in IEC 61010-1. The device assigns to protection class and is equipped with a protective Protection: earth stud. This equipment may be operated only by qualified personnel. A qualified person has complet- ed training to operate a Power Analyzer. -
Page 12: Connection To Circuits
ONNECTION TO IRCUITS Please read section “Safety” of this manual before performing the measurements described below. EASUREMENT IN HASE MAINS IRCUIT 2.1.1 HREE ATTMETER ONNECTION Power and energy consumed by a load are positive values. This means that current Hi and Lo, and voltage Hi and Lo must be connected in correct directions (polarity). -
Page 13: Aron Connection
2.1.2 ONNECTION Important! Do not use Aron Connection for unsymmetrical loads. Figure 2.2 Measurement in 3-phase mains circuit using 2 Wattmeter configuration. Rule 1 and Rule 3 apply. Rule 3: Voltage Lo connects to third wire not used for current measurement (Figure 2.2). -
Page 14: 108B Mathematical Definitions And Specifications
108B M ATHEMATICAL EFINITIONS AND PECIFICATIONS ATHEMATICAL EFINITIONS Tables 3.1 and 3.2 define all quantities measured and computed. The “batch” column shows the symbol that must be used in the interface batch command of section 6 (setting the quanti- ties viewed on the display). - Page 15 Table 3.1: continued. List of standard value that can be displayed Description Symbol = Formula, Description Batch voltage crest factor Vcf = Vmax / Vrms voltage form factor Vff = Vrms / Vrect, is 1.1107 for sine wave voltage fundamental V01 = fundamental voltage of FFT voltage 2.
- Page 16 Table 3.2: List of special values that can be displayed Description Symbol = Formula, Description batch sum1 of power sum1 = Pact1 + Pact2 + Pact3; Power phase 1+2+3 sum2 of power sum2 = Pact1 + Pact2 sum3 of power sum3 = not used sum4 of power sum4 = not used...
- Page 17 Table 3.2: List of special values that can be displayed Description Symbol = Formula, Description batch Loss resistance Equivalent loss resistance = Pact1 / Arms Loss inductance Equivalent loss reactance = Prea 1 / Arms turn ratio turn ratio = N2 / N1 = Vrms2 / Vrms1, no load analog input1 5V analog input1 5V analog input2...
-
Page 18: Specifications
PECIFICATIONS Voltage Measurement 8 measuring ranges: 0.3V – 1V – 3V – 10V – 30V – 100V – 300V – 1000V Bandwidth DC-2MHz Coupling: AC or AC + DC Common mode rejection: 100dB at 100kHz Input impedance: 1M / 15pF. Floating input max. - Page 19 Power Measurement W range = voltage range times current range 112 power ranges Standard accuracy 23 C ± 1 High precision Input In1A, In5A, Shunt In1A, In5A, Shunt 45 to 65Hz 0.16 + 0.16 0.04 + 0.04 45 to 65Hz 0-0.05 0.01 + 0.01 3 to 1000Hz...
- Page 20 Additional Computed Values Accuracy: Add % figures of values involved 65 values per phase Rectified mean, VA, Var, impedance, distortion factor, power factors, motor- and transformer values, sums, ratios, analog inputs and -outputs, speed inputs, and more are continuously updated and ready for display or interface output. Typical max.
- Page 21 Interface USB connection to Host Computer for downloading measurement data (USB stick) 10/100 Mbps Ethernet interface (Up to 230.4kBaud) RS232 Interface (Up to 115.2kBaud) USB Interface (Up to 921.6kBaud) Analog Input / Output connector (37-pole) GPIB, IEEE 488.2 (Set address 1 to 30, store in setting) Saving and Recalling 108A Setting Configurations Save your personal setting in S01, or S02, .., or S20.
-
Page 22: Operating The Power Analyzer From The Front Panel
PERATING OWER NALYZER FROM THE RONT ANEL Apply line voltage 90Vac to 264Vac, 47 – 63Hz, and turn on rear panel power switch. The Power Analyzer requires 40 seconds for start-up. Common to all four measurement functions (Standard, Logging, Transient, and Power-Speed) the following actions are needed: ... -
Page 23: Operations In Standard Measure Mode
Figure 4.1 Start-up configuration of 108B Power Analyzer Along the top of the display you find phase, current input, synchronization, voltage- and cur- rent range, and over (red) - and under (yellow) range indication. -
Page 24: Selecting Current Inputs Using Same Inputs For All Phases
4.1.2 ELECTING URRENT NPUTS USING SAME NPUTS FOR ALL HASES Touch IN 5A pop-up window IN 1A IN 5A default IN 30A SHUNT Touch desired current input 4.1.3 ELECTING INDIVIDUAL CURRENT INPUTS PER PHASE Touch the phase button L1 along the top of the display. The button turns to green, indicat- ing to be ready for phase L1 current input- and range selection IN 1A Touch IN 5A... -
Page 25: Selecting Current Range Using Same Range For All Phases
4.1.4 ELECTING URRENT ANGE USING SAME RANGE FOR ALL PHASES The available ranges depend on the current input selected. IN 1A: 1.5mA, 5mA, 15mA, 50mA, 150mA, 500mA, 1.5A. IN 5A: 15mA, 50mA, 150mA, 500mA, 1.5A, 5A, 15A. IN 30A: 1A, 3A, 10A, 30A, 100A. SHUNT: 60mV, 180mV, 600mV, 2V, 6V. -
Page 26: Selecting Measurement Synchronization (Synchronization For All Phases)
4.1.6 ELECTING EASUREMENT YNCHRONIZATION USING SAME SYNCHRONI- ZATION FOR ALL PHASES Touch Sync A pop-up window Sync A 2Hz-5kHz default Sync V 2Hz-150kHz S_Ext V 2Hz-150kHz Touch desired measurement synchronization. For precise AC-measurements at low frequen- cies a periodic wave form is required. If you are measuring voltages only, you must select Sync V. -
Page 27: Selecting Wave Forms (Graph)
4.1.9 ELECTING ORMS RAPH Touch WAVE pop-up window for 3-phase instrument. Wave 1 Wave 2 Wave 3 Touch desired phase L1, L2, or L3. Touch OFF to exit wave display. The lower 3/8 of the display shows current- (blue), voltage- (black), and power waveforms (red) of selected phase. -
Page 28: Selecting Display Run And Display Hold
4.1.13 HOLD ELECTING ISPLAY ISPLAY Touch RUN, the button toggles to HOLD. The display update is halted. In the background the continuous measurement process goes on. This guarantees correct energy- and charge measurements (Wh, VAh, Varh, Ah). If USB memory stick is inserted, measurement data on hold are also stored on memory stick with filename 108A_data_HOLD. - Page 29 Exception 1: Touching A FFT, V FFT, or W FFT will activate a pop-up window from which you can select one out of the first 13 harmonics. Exception 2: Touching one of the special values at the bottom of the value se- lection table, such as S1|S2, will always display 3 values, some of them may be zero.
- Page 30 4.1.16 Motor 1 values from phase 1, 2, and 3. OTOR ESTING A three phase Power Analyzer calculates 6 motor values (motor 1). To display these val- ues select M1|1-3 on one display line and M1|4-6 on the next display line. Speed in rpm must be entered via analog input-output option at speed 1/ freq 1 input terminal (Section 7).
-
Page 31: Selecting Setup
4.1.17 SETUP ELECTING Touch SETUP. The pop-up window, shown in Figure 4.4 lets you select the following in- strument parameters: Figure 4.4 Setup Window for selecting instrument parameters Scaling I1-I4: Individual current scaling factors of every phase. Use pop-up num- ber pad. - Page 32 Store Data: Select the desired storing interval in seconds. Press green “Store Data” button and select D01…D20. The measurement data displayed on page 1 of all phases are stored in the selected data file Dxy (D01… D20) and on the memory stick. Average of Arms and Vrms are not stored if se- lected.
- Page 33 GPIB addr: Set 1 to 30. Use pop-up number pad. Save Setup: Give the setting your personal number. If you want that the Power Ana- lyzer starts up in your preferred configuration you must store the setting in S01. Load Setup: Recall your setting number Calibration: Enter your personal code if okay...
-
Page 34: Operations In Logging Measure Mode
PERATIONS IN OGGING EASURE Touch Standard pop-up window Standard Logging Transient P-Speed Touch Logging to switch to Logging function Measure Mode. The logging mode config- ures the display, line 1 to line 8, as follows: Frequency, Arms, Vrms, W, PF, VA, Wh, and VAh. -
Page 35: What Has To Be Observed When Using Logging
If “cycles” is set to 30000 the time for one measurement is 30000 0.02 sec. = 10 minutes. To read Logging data from the 108B via Interface use commands COMP:LOG1? or COMP:LOG2? (Table 5.4). For fast data acquisition use manual ranging. Select ranges such that no severe over- loads occur. -
Page 36: Operations In Transient Measure Mode
PERATIONS IN RANSIENT EASURE Touch Standard pop-up window Standard Logging Transient P-Speed Touch Transient to switch to the Transient Measure Mode Please note that TRANSIENT ID is set in the SETUP menu accessible in the STANDARD mode. Before pressing START synchronization to all phases of the Power Analyzer is re- quired. - Page 37 You must select proper current- and voltage ranges, to avoid serious overloads. Start the transient measurement then start your system. Figure 4.6 Shows the transient display of a 3-phase 108B Power Analyzer. The three values to the left are rms current, rms voltage, and average power of the displayed wave forms.
-
Page 38: Basics Of Power-Speed Measure Mode (Option)
If you insert a memory stick on the rear panel the complete data set is displayed on the 108B display and also stored on the memory stick for off-line analysis in Excel. - Page 39 Set Voltage range according to supply voltage applied to load under test Touch AUTO V pop-up window 0.3V 100V 300V 1000V AUTO V Touch appropriate voltage range (Do not use AUTO V). Set current input. You must set the current range based on the estimated maximum rms current.
- Page 40 Enter the SETUP window in standard measure mode. Set phase 1, 2, and 3 scaling fac- tors by entering the scaling factor written on the 3-phase current sensor module Touch START and turn on the system under test. Alternatively start your system by using the 0 to +5V signal of analog output1.
-
Page 41: Operating The Power Analyzer Using A Computer Interface
RS232 on rear panel using Computer Interface Command set. USB on rear panel using Computer Interface Command set. USB memory stick for measurement data storage or downloading 108B software update. Ethernet interface on rear panel using Interface Command set. - Page 42 The capital letters in the command list are mandatory. They can be sent upper case or lower case. The lower case letters in the command set can be added if desired. R = decimal number, e.g. 2000.5. It follows the command with one space. ...
- Page 43 Composite commands Table 5.1 using a 3 Phase 108B Power Analyzer. COMP:CMP1? returns: 3 Vrms, 3 Arms, and 3xW, terminated with CRLF. The data string is: Vrms1, Vrms2, Vrms3, Arms1, Arms2, Arms3, W1, W2, W3, CRLF. Where Vrms1 = voltage phase 1, etc.
-
Page 44: Computer Interface Command Set
OMPUTER NTERFACE OMMAND Throughout the command set tables it is assumed a 3 phase Power Analyzer is used. If you are using a 4 phase instrument “4x” must be replaced by “3x”. The default for ph_start=1 (Table 5.7). The default of ph_end is equal the number of phases installed in your instrument. -
Page 45: Reading Voltages Reading And Writing Voltage Scale Factors
EADING VOLTAGES READING AND WRITING VOLTAGE SCALE FACTORS Table 5.2 Voltages Reading Commands VOLTage:RMS? 3x Vrms (root mean square), phase 1 value first. VOLTage:FUND? 3x fundamental of voltage (V1) VOLTage:RECT? 3x Vrect (rectified mean of voltage) VOLTage:MEAN? 3x Vmean (is valid also when AC coupling is used) VOLTage:MIN? 3x minimum voltage VOLTage:MAX? -
Page 46: Reading Currents Reading And Writing Current Scale Factor
EADING CURRENTS READING AND WRITING CURRENT SCALE FACTOR Table 5.3 Current Reading Commands 3x Arms (root mean square), phase 1 value first. CURRent:RMS? CURRent:FUND? 3x fundamental of current (A1) CURRent:RECT? 3x Arect (rectified mean of current) CURRent:MEAN? 3x Amean (is valid also when AC coupling is used). CURRent:MAX? 3x maximum current CURRent:FFTL1? -
Page 47: Reading Power, Apparent Power, And Reactive Power
EADING POWER APPARENT POWER AND REACTIVE POWER Table 5.4 Power Reading Commands POWer:ACTive? 3x W (active power) POWer:APParent? 3x VA (apparent power) POWer:REActive? 3x Var (reactive power) POWer:FFTL1? Power Harmonics L1: W1, W2, …, W21. Can be changed by altering FFT_START, FFT_END (max. 21) POWer:FFTL2? Power Harmonics L2: W1, W2, …, W21. -
Page 48: Reading Frequency, Impedance, And Phase Angle
EADING FREQUENCY IMPEDANCE AND PHASE ANGLE Table 5.6 Frequency, Impedance, Phase Angle Reading Commands FREQency? 3x frequency of current or voltage (fundamental) IMPedance:MAG? 3x magnitude of impedance = V1/A1 (fundamental) IMPedance:ANGle? 3x phase angle of fundamental impedance IMPedance:FFT_ANGL1? Phase angle L1: phi1, phi2, …, phi21 IMPedance:FFT_ANGL2? Phase angle L2: phi1, phi2, …, phi21 Phase angle L3: phi1, phi2, …, phi21... -
Page 49: Read And Write Display, Rs232 Baud Rate, Ieee-488 Address
5.11 , RS232 B , IEEE-488 EAD AND WRITE DISPLAY ADDRESS Table 5.8 Display, Interface, Analog Scaling Commands DISplay:PAGE <N> Read active display page 1-4. DISP:PAGE? Write display page 1-4. DISP:PAGE 4. Display shows values of page 4 DISplay:BATCH Example to change the display values of page 1, line 1, 2, 3, 4 DISP:BATCH A00A03A06A14. - Page 50 ACQ:HOLD 0. Set display hold: ACQ:HOLD 1. Set display locked: ACQ:HOLD 2; (2:must be used for PC operation) (ACQ:HOLD 2 grays 108B display buttons, avoids conflicts) Turn display off: ACQ:HOLD 4; ACS10 Turn display on: ACQ:HOLD 5; ACS10 ACQ:GO starts measurement if in Logging, transient or power-speed.
-
Page 51: Computer Operating Software
OMPUTER PERATING OFTWARE NSTALLING OMPUTER PERATING OFTWARE Insert the CD-ROM into the drive for installation. Click setup.exe for installation. Click “NEXT” if directory location is correct. Click “NEXT >>” to start the installation... -
Page 52: 108A Data Window (Computer Software)
108A D INDOW OMPUTER OFTWARE The Power Analyzer Computer Operating Software consists basically of 3 Windows: The Data Window, the IEC Data Window and the Control/Setting Window. The Data Window displays the measured values, and the actual ranges of current and voltage. -
Page 53: Select Instrument Mode
6.2.2 ELECT INSTRUMENT MODE Turn knob to Standard Mode, Logging Mode, Transient Mode or Power Speed Mode. Press APPLY STANDARD MODE In the Standard Measure Mode 280 quantities per phase are continuously measured (no gaps) and are updated. Values can be displayed on four display pages, can be saved in internal memory, or can be transferred via Interface to a computer. -
Page 54: Select Software Mode
6.2.3 ELECT SOFTWARE MODE Move function slider to Standard, Curve, FFT Num, FFT Bar, IEC or Vector. 1. Standard >> measurement values 2. Standard + Curve >> measurement values and curves 3. Standard + FFT Num >> measurement values and harmonics 4. -
Page 55: Input, Ranges, Synchronization, Aperture Selection
6.2.5 NPUT ANGES YNCHRONIZATION PERTURE SELECTION Current Input: Select IN 1A / IN 5A / IN 30A or SHUNT I AUTO/MAN: Select mode: I AUTO/MAN = current auto/manual ranging IN 5A: 15mA, 50mA, 150mA, 500mA, 1.5A, 5A, 15A IN 30A: 1A, 3A, 10A, 30A, 100A IN 1A: 1.5mA, 5mA, 15mA, 50mA, 150mA, 500mA, 1.5A... -
Page 56: Fft Numerics (Harmonics)
6.2.8 FFT N UMERICS ARMONICS Harmonics: Select a FFT measurement value. FFT Volt L1-L4 / FFT Current L1-L4 FFT Power L1-L4 / FFT Angle L1-L4. Save Harmonics: Press button to store harmonics in a file. 6.2.9 FFT B RAPH ARMONICS Waveform Graph: Select a FFT Bar Graph. -
Page 57: Iec Data Window
6.2.11 IEC D INDOW The IEC Window displays numeric values and charts in context with IEC 555-2 (EN 61000-3-2) standards. Class File Selector Classification of Equipment into Classes A, B, C, D for Harmonic Measurement. Class A: Balanced three-phase equipment and all other equipment except that stated in one of the following classes. - Page 58 Limits for Class C: (max. value expressed as a % of the fundamental input current of lumi- naires) 1.62 / 3.45 / 0.645 / 1.71 / 0.45 / 1.155 / 0.345 / 0.600 /0.276 / 0.495 / 0.230 / 0.315 / 0.197 / 0.225 / 0.173 0.199 / 0.153 / 0.178 / 0.138 / 0.161 / 0.125 / 0.148 / 0.115 / 0.135 / 0.106 / 0.125 / 0.099 / 0.116 / 0.092 0.109 / 0.086 / 0.102 / 0.081 / 0.096 / 0.077 / 0.091 / 0.073 / 0.087 / 0.069 / 0.118 / 0.092 / 0.107 / 0.084 0.098 / 0.077 / 0.09 / 0.071 / 0.083 / 0.066 /...
-
Page 59: Control / Setting Window
6.2.12 ONTROL ETTING INDOW Scale Current (I) Select desired phase for scaling: Current L1 – L4 Multiplication factor for current. This is especially useful when us- ing external voltage sensors. Valid Range: -3.38e-38/+3.37e38 (default Value: 1.0) Note: Be careful when changing scaling factors as it could look like an instru- ment malfunction in case of improper choice. - Page 60 FFT ID Set to 0, 1, 2, 3, 4. Corresponds to FFT averaging over 4, 16, 64, 256, or 1024 cycles. Transient ID Set it to 1, 2, 3, 4, 5, 6 or 7. The transient ID determines the measurement duration after start. Transient ID Measurement duration: 1 = 0.25 seconds 2 = 0.5 seconds (default)
-
Page 61: Logging-, Transient-, Power Speed Measure Mode
6.2.13 -, T -, P OGGING RANSIENT OWER PEED EASURE Select the number of cycles and set the frequency; then press APPLY. Now set the number of Logging iterations and press the START button. After the last iteration is completed, the amplitudes of the signals are displayed in the graph window. -
Page 62: Analog Input And -Output
NALOG NPUT AND UTPUT The rear panel DB37 connector Figure 7.1 provides all signals for processing inputs to- and processing outputs from the Power Analyzer. Freq2 Freq1 AGRD 0GRD +12V -12V SYNC1 SYNC2 SYNC3 SYNC4 SYNC5 SYNC6... -
Page 63: Analog Input And Output Specification
NALOG NPUT UTPUT PECIFICATION Analog input 1-4, span: -5V to +5V, Ri = 100k, Typical max error 0.2 % If not used short inputs to AGRD Analog input 5,6, span: -10V to +10V, Ri = 100k, Typical max error 0.2 % If not used short inputs to AGRD Frequency input 1,2: 20Hz –... -
Page 64: Using Inputs For Motor Testing (See Also 4.1 Motor Testing)
Below examples of output configurations are given: Single phase: Display lines 1 to 8 = Arms, Vrms, W, VA, Var, PF1, frequency, Wh. Analog output 1, 2, 3, 4, 5, 6, 7, 8 are proportional to Arms, Vrms, W, VA, Var, PF1, freq, Wh. -
Page 65: Using Low Current Shunt For Standby Power Measurement
SING URRENT HUNT FOR TANDBY OWER EASUREMENT Insert Shunt in the 3-pin connector on rear panel Select SHUNT input Shunt voltage 60mV corresponds to current range 0 - 100μA Shunt voltage 180mV corresponds to current range 0 - 300μA Shunt voltage 600mV corresponds to current range 0 - 1mA Shunt voltage 1.8V corresponds to... -
Page 66: Data Management
ANAGEMENT USB I PERATING THE OWER NALYZER USING THE NTERFACE To operate the USB interface you must install the USB driver. Use the following driver (on the CD-ROM) for your Windows operating system: CDM v2.12.14 WHQL Certified for Windows (Windows XP to Windows 10 (32/64)). Open the hardware manager and check for proper USB Driver installation. -
Page 67: Measurement Data From The Power Analyzer (Usb) To Computer
(USB) EASUREMENT ATA FROM THE OWER NALYZER OMPUTER If USB memory stick is inserted, measurement data are also stored on memory stick 108A_data_01, 108A_data_02, …, 108A_data_20. The 108A stores measurement data in Standard Mode, on HOLD and in Power Speed Mode. -
Page 68: Calibration Via 108B Front Panel
108B F ALIBRATION VIA RONT ANEL A calibration cycle of two years is appropriate. If occasional overloads occur (greater two times maximum value) we recommend one year calibration cycle. QUIPMENT EEDED Voltage: 0.3V, 1V, 3V, 10V, 30V, 100V, 300V, 1000V; 60Hz Current: 1.5mA, 5mA, 15mA, 50mA, 150mA, 500mA, 1.5A;... -
Page 69: Current Calibration At 60Hz, Shunt Input Calibration
9.2.2 URRENT ALIBRATION HUNT NPUT ALIBRATION You must select Sync A. Select Current Input IN 5A. Apply current to all current inputs in series. touch TAKE CURRENT READING Select 15mA range, apply 15mA, wait touch TAKE CURRENT READING Select 50mA range, apply 50mA, wait ... -
Page 70: Storing The Calibration Constants
Shunt input calibration at 60Hz Remove the short circuit cover on the shunt input. Shunt input Hi Shunt input Lo Select shunt input SHUNT. Apply voltage to all shunt inputs in parallel. touch TAKE CURRENT READING Select 60mV range, apply 60mV, wait ... -
Page 71: 108B Calibration Using Windows Operating Software (Labview)
9.4. 108B C ALIBRATION USING INDOWS PERATING OFTWARE 9.4.1 QUIPMENT EEDED Voltage: 0.3V, 1V, 3V, 10V, 30V, 100V, 300V, 1000V; 60Hz Current: 1.5mA, 5mA, 15mA, 50mA, 150mA, 500mA, 1.5A; 1A, 3A, 10A, 20A; 60Hz 9.4.2 ALIBRATION ROCEDURE Set all voltage- and current scaling factors to 1.0000. -
Page 72: Current Calibration At 60Hz (In 5A)
Select U MAN, U Sync, 300mV and press Refresh Apply 300mV from calibrator – wait – press Apply Select 1V and press Refresh Apply 1V from calibrator – wait – press Apply Select 3V and press Refresh Apply 3V from calibrator – wait – press Apply Select 10V and press Refresh Apply 10V from calibrator –... -
Page 73: Current Calibration At 60Hz (In 1A)
Select IN 5A, I MAN, 15mA, I SYNC and press Refresh Apply 15mA from calibrator – wait – press Apply Select 50mA and press Refresh Apply 50mA from calibrator – wait – press Apply Select 150mA and press Refresh Apply 150mA from calibrator – wait – press Apply Select 500mA and press Refresh Apply 500mA from calibrator –... -
Page 74: Current Calibration At 60Hz (In 30A)
9.4.6 (IN 30A) URRENT ALIBRATION Remove 1A input 3 pole connector and insert short circuit cover. Apply current to all current inputs in series Select IN 30A, 1A and press Refresh Apply 1A from calibrator – wait – press Apply Select 3A and press Refresh Apply 3A from calibrator –... -
Page 75: Storing The Calibration Constants
9.4.8 TORING ALIBRATION ONSTANTS Select Store/Exit Calibration and press Apply This stores all calibration constants in nonvolatile memory. In case you do not want to store the calibration constants (abort calibration process), the instrument uses the previous stored calibration constants. Wait at least 2 seconds. - Page 76 Weingartenstrasse 6 8707 Uetikon am See / Switzerland phone: +41 44 920 50 05 fax: +41 44 920 60 34 www.infratek-ag.com email: info@infratek-ag.com Copyright 2019 Vers. 1.0 / 10/2019 by Infratek AG...
Need help?
Do you have a question about the 108B and is the answer not in the manual?
Questions and answers