Advertisement
Using Tables on the TI-84+ Graphing Calculator
Default Tables:
Enter one or more functions into Y=.
Press 2nd WINDOW to access [tblset].
Change TblStart and the table increment Tbl if desired.
Press 2nd GRAPH to access [table].
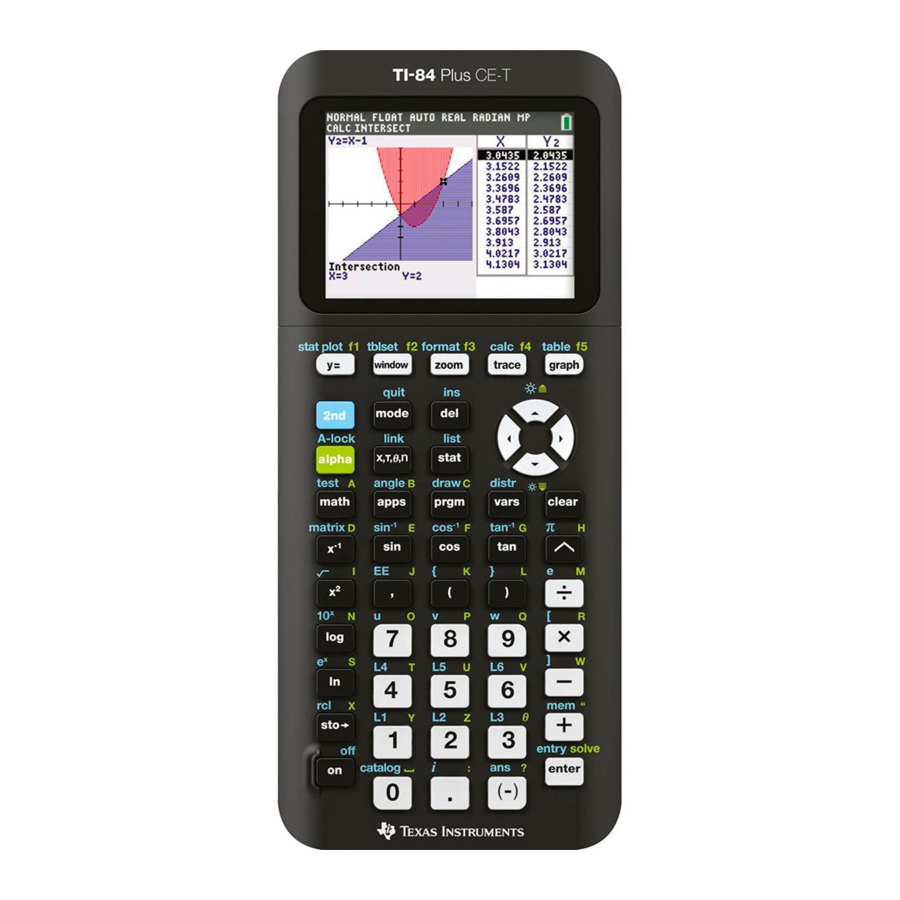
The table of values is displayed for all active functions.
Use the UP/DOWN arrows to move through the values and
the RIGHT/LEFT arrows to change columns.
From this screen, press PLUS + to change the table increment,
instead of going back to [tblset] screen.
Dynamic Tables option 1:
To view the Y-values one at a time, use AUTO-ASK:
Press 2nd WINDOW to access [tblset].
Set the Independent variable to AUTO and the Dependent
variable to ASK.
Press 2nd GRAPH to access [table].
The table of values only displays the X-values initially. Arrow
to the desired Y-value column.
Move down the column, pressing ENTER to display the value
for each row. Repeat for additional columns.
This enables you to observe how a function grows or changes
as the X-value increases.
Advertisement
Table of Contents

Related Manuals for Texas Instruments TI-84+


Summary of Contents for Texas Instruments TI-84+
- Page 1 Using Tables on the TI-84+ Graphing Calculator Default Tables: Enter one or more functions into Y=. Press 2nd WINDOW to access [tblset]. Change TblStart and the table increment Tbl if desired. Press 2nd GRAPH to access [table]. The table of values is displayed for all active functions. Use the UP/DOWN arrows to move through the values and the RIGHT/LEFT arrows to change columns.
- Page 2 Dynamic Tables option 2: To enter the X-values one at a time, use ASK-AUTO: Press 2nd WINDOW to access [tblset]. Set the Independent variable to ASK and the Dependent variable to AUTO. Press 2nd GRAPH to access [table]. The table of values is blank initially. As you enter an X-value, the Y-values will fill in for all columns.
Need help?
Do you have a question about the TI-84+ and is the answer not in the manual?
Questions and answers