Table of Contents
Advertisement
Quick Links
Advertisement
Table of Contents

Related Manuals for MR ETOS TD


Summary of Contents for MR ETOS TD
- Page 1 Motor-drive unit ® ETOS Operating Instructions 4453918/14 EN...
- Page 2 © All rights reserved by Maschinenfabrik Reinhausen Dissemination and reproduction of this document and use and disclosure of its content are strictly prohibited unless expressly permitted. Infringements will result in liability for compensation. All rights reserved in the event of the granting of patents, utility models or designs.
-
Page 3: Table Of Contents
Table of contents Table of contents Introduction........................ 10 Manufacturer............................. 10 Completeness........................... 10 Safekeeping............................ 10 Notation conventions ........................ 11 1.4.1 Symbols ................................ 11 1.4.2 Hazard communication system ........................... 12 1.4.3 Information system.............................. 13 1.4.4 Instruction system ............................... 14 1.4.5 Typographic conventions ............................ 14 Safety.......................... 15 Appropriate use .......................... 15 Inappropriate use.......................... - Page 4 Mounting ........................... 52 Fitting the control cabinet to the transformer .................. 52 Cable recommendation........................ 55 Information about connecting serial interfaces RS232 and RS485 .......... 55 Notes on connecting to the MR sensor bus.................. 57 6.4.1 MSENSE® DGA.............................. 59 6.4.2 MESSKO® MTeC® EPT303 FO......................... 60 6.4.3...
- Page 5 Table of contents Visualization........................ 73 Establishing connection to visualization ................... 73 General ............................. 75 9.2.1 Setting general device functions ......................... 76 9.2.2 Set up automatic logout ............................ 77 9.2.3 Activating/deactivating service user access...................... 78 Configuring the network........................ 79 MQTT.............................. 81 Setting the device time ........................ 83 9.5.1 Time synchronization via PTP.......................... 84 Configuring syslog ..........................
- Page 6 Table of contents 9.10.8 Displaying status of cooling stages ........................ 128 9.11 Cooling system monitoring (optional) ..................... 129 9.11.1 Setting the cooling system monitoring function.................... 129 9.11.2 Cooling efficiency monitoring (optional) ...................... 130 9.11.3 Cooling system flow monitoring (optional) ...................... 131 9.12 Drive overview .......................... 135 9.13 Displaying power characteristics ....................
- Page 7 Table of contents 9.22.4 Power flow monitoring............................ 201 9.22.5 Tap position monitoring (optional)........................ 203 9.22.6 U bandwidth monitoring ............................ 204 9.22.7 Q bandwidth monitoring (optional) ........................ 206 9.22.8 Phase symmetry monitoring.......................... 208 9.22.9 Temperature monitoring............................ 209 9.22.10 Monitoring the gas volume of the Buchholz relay (OLTC) ................ 210 9.22.11 Monitoring the gas volume of the Buchholz relay (transformer)................ 211 9.22.12 Monitoring the oil pressure (transformer) ...................... 211 9.22.13 Monitoring the oil pressure (on-load tap-changer) .................... 212...
- Page 8 Table of contents 9.28 MR sensor bus.......................... 246 9.28.1 Configuring MR sensor bus.......................... 247 9.28.2 Managing sensors............................. 248 9.28.3 Function assignment ............................ 250 9.28.4 Defining the sensors ............................ 251 9.28.5 Displaying information on the connected sensors..................... 255 9.29 Configuring analog inputs and outputs (optional) ................ 257 9.30...
- Page 9 Table of contents 9.37 Configuring media converter with managed switch ................ 289 9.37.1 Commissioning.............................. 290 9.37.2 Configuration.............................. 291 9.38 TAPCON® Personal Logic Editor (TPLE).................. 292 9.38.1 Function ................................ 292 9.38.2 Configuring TPLE.............................. 306 Fault elimination ...................... 310 10.1 Motor-drive unit.......................... 310 10.2 Human-machine interface....................... 311 10.3 Other faults .............................
-
Page 10: Introduction
1 Introduction 1 Introduction This technical file contains detailed descriptions on the safe and proper in- stallation, connection, commissioning and monitoring of the product. It also includes safety instructions and general information about the prod- uct. This technical file is intended solely for specially trained and authorized per- sonnel. -
Page 11: Notation Conventions
1 Introduction 1.4 Notation conventions 1.4.1 Symbols Symbol Meaning Wrench size Tightening torque Number and type of fastening material used Fill with oil Cut open, cut through Clean Visual inspection Use your hand Adapter ring Apply a coat of paint Use a file Grease Coupling bolt... -
Page 12: Hazard Communication System
1 Introduction Symbol Meaning Use a saw Hose clip Wire eyelet, safety wire Use a screwdriver Apply adhesive Lock tab Table 1: Symbols 1.4.2 Hazard communication system Warnings in this technical file are displayed as follows. 1.4.2.1 Warning relating to section Warnings relating to sections refer to entire chapters or sections, sub-sec- tions or several paragraphs within this technical file. -
Page 13: Information System
1 Introduction 1.4.2.3 Signal words and pictograms The following signal words are used: Signal word Definition DANGER Indicates a hazardous situation which, if not avoided, will result in death or serious injury. WARNING Indicates a hazardous situation which, if not avoided, could result in death or serious injury. -
Page 14: Instruction System
1 Introduction Important information. 1.4.4 Instruction system This technical file contains single-step and multi-step instructions. Single-step instructions Instructions which consist of only a single process step are structured as fol- lows: Aim of action ü Requirements (optional). ► Step 1 of 1. ð... -
Page 15: Safety
2 Safety 2 Safety ▪ Read this technical file through to familiarize yourself with the product. ▪ This technical file is a part of the product. ▪ Read and observe the safety instructions provided in this chapter. ▪ Read and observe the warnings in this technical file in order to avoid func- tion-related dangers. -
Page 16: Fundamental Safety Instructions
2 Safety 2.3 Fundamental safety instructions To prevent accidents, malfunctions and damage as well as unacceptable ad- verse effects on the environment, those responsible for transport, installa- tion, operation, maintenance and disposal of the product or parts of the prod- uct must ensure the following: Personal protective equipment Loosely worn or unsuitable clothing increases the danger of becoming... - Page 17 2 Safety Invisible laser radiation Looking directly into the beam or the reflected beam can cause eye damage. The beam is emitted at the optical connections or at the end of the fiber-optic cables connected to them on the assemblies. Read the chapter "Technical Data"...
-
Page 18: Personnel Qualification
2 Safety Ambient conditions To ensure reliable and safe operation, the product must only be operated under the ambient conditions specified in the technical data. ▪ Observe the specified operating conditions and requirements for the in- stallation location. Auxiliary materials and operating materials Auxiliary materials and operating materials not approved by the manufac- turer can lead to personal injury, damage to property and malfunctions of the product. -
Page 19: Personal Protective Equipment
2 Safety Electrically trained persons An electrically trained person receives instruction and guidance from an electrically skilled person in relation to the tasks undertaken and the poten- tial dangers in the event of inappropriate handling as well as the protective devices and safety measures. -
Page 20: Drying Transformer
2 Safety Hearing protection To protect against hearing damage. Protective gloves To protect against mechanical, thermal, and electrical hazards. Table 5: Personal protective equipment 2.6 Drying transformer 2.6.1 Drying transformer in autoclave Observe the following information when drying the transformer in an auto- clave. -
Page 21: Security
3 IT security 3 IT security Observe the following recommendations for secure operation of the product. General ▪ Ensure that only authorized personnel have access to the device. ▪ Only use the device within an ESP (electronic security perimeter). Do not connect the device to the Internet in an unprotected state. - Page 22 ETH 1 SNMP ETH 2.x (only for MR service) ETH 2.x HTTP for web-based visualization ETH 2.x HTTPS for web-based visualization ETH 2.x FTPS (only for MR service) ETH 2.x 8080 HTTP for web-based visualization ETH 2.x 8081 HTTPS for web-based visualization ETH 2.x SNMP Table 6: Interfaces and open ports of the CPU assembly Port is closed if you activate the device's SSL encryption.
- Page 23 3 IT security Default setting; if you have modified the port for the control system proto- col, only the set port is open. Depending on the setting of the SNMP agent parameter. Encryption standards The device supports the following TLS versions: ▪...
-
Page 24: Product Description
4 Product description 4 Product description 4.1 Scope of delivery The motor-drive unit is packaged with protection against moisture and is de- livered as follows: ▪ Gear motor (pre-installed on the on-load tap-changer) ▪ Control cabinet ▪ Connection cable ▪ Product documentation Please note the following: 1. -
Page 25: Performance Features
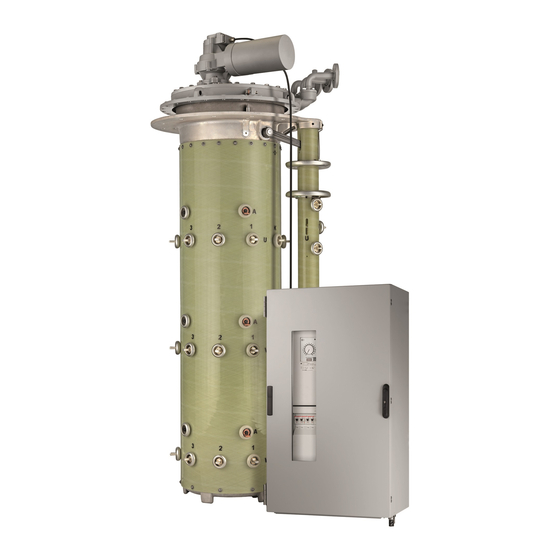
4 Product description The motor-drive unit control unit can be configured and the measured values and results can be displayed using the web-based visualization. Here, the functional scope is based on the ordered product version. Figure 2: ETOS® TD and on-load tap-changer on one power transformer 4.3 Performance features The motor-drive unit is characterized by the following features in particular: ▪... -
Page 26: Operating Modes
4 Product description – IEC 61850 (edition 1 and edition 2) – Modbus (RTU, TCP, ASCII) – DNP3 ▪ Free digital inputs and outputs, depending on the device configuration ▪ Free analog inputs and outputs, depending on the device configuration 4.4 Operating modes You can select the operating mode of the motor-drive unit with the control switch in the control cabinet [►Section 4.5.3, Page 29]. -
Page 27: Design
4 Product description 4.5 Design This chapter contains an overview of the design of the motor-drive unit. The entire system consisting of the on-load tap-changer and motor-drive unit in- cludes the following subassemblies: Figure 3: Design 1 On-load tap-changer 3 Connecting cable 2 Gear motor 4 Control cabinet ®... -
Page 28: Name Plate
4 Product description 4.5.1 Name plate The name plate is in the control cabinet of the motor-drive unit. Figure 4: Name plate 1 Name plate 4.5.2 Gear motor The gear motor is on the head of the on-load tap-changer. It is connected di- rectly to the drive shaft of the on-load tap-changer and carries out the on- load tap change operation. -
Page 29: Control Cabinet
4 Product description 4.5.3 Control cabinet The control cabinet contains the following components: Figure 6: Control cabinet 1 Tap position display 2 Control switch 3 Ethernet interface ETH1.1 (RJ45) 4 Plug socket X19, max. 10 A 5 Motor protective switch Q1 6 Fuses F14 and F25 ®... - Page 30 4 Product description Operating controls The control cabinet contains the following operating controls: Figure 7: Operating controls 1 Control switch S32 LOC/REM or 2 Control switch S3 RAISE/LOWER S132 LOC/AUTO/REM Display elements The control cabinet contains the following display elements: Figure 8: Display elements 1 Motor running LED 2 Event yellow/red LED 3 Tap position display...
-
Page 31: Ism® Assemblies
4 Product description Cable duct for digital inputs and outputs If you would like to connect digital inputs and outputs of the DIO assembly, a cable duct is available in the control cabinet to route the cable harness. Figure 9: Cable duct for digital inputs and outputs (example of control cabinet structure) 1 Cable duct in the control cabinet 4.5.4 ISM®... - Page 32 4 Product description ▪ 3x Ethernet (ETH1, ETH 2.1, ETH 2.2) ▪ USB (USB 2.0) ▪ 2x CAN bus (CAN 1, CAN 2) INIT TEST PROG 24V DC ETH 1 ETH 2.1 ETH 2.2 Figure 10: CPU I assembly 4.5.4.2 CPU (central processing unit) II The CPU II assembly is the central computing unit for the device.
- Page 33 4 Product description 4.5.4.3 Voltage measurement and current measurement The UI 1 assembly is used for measuring 1-phase voltage and current. Figure 12: UI 1 assembly The UI 3 assembly is used for measuring 3-phase voltage and current. Figure 13: UI 3 assembly Warning of a danger point.
- Page 34 4 Product description 4.5.4.4 UI 5-4 voltage measurement and current measurement The UI 5-4 assembly is used for measuring 3-phase voltage and current. Figure 14: UI 5-4 assembly Warning of a danger point. Read the information given in the product oper- ating instructions.
- Page 35 4 Product description Figure 15: DIO 42-20 assembly Warning of a danger point. Read the information given in the product oper- ating instructions. Warning of dangerous electrical voltage. Table 11: Safety-relevant symbols on the assembly 4.5.4.6 Analog inputs and outputs The AIO 2 and AIO 4 assemblies provide analog inputs and outputs: ▪...
- Page 36 4 Product description Figure 16: AIO 4 assembly 4.5.4.7 Media converter The MC 2-2 assembly is a media converter, which converts 2 electrical con- nections (RJ45) to one fiber-optic cable connection each. Each is converted independently of the other. The following interfaces are available: ▪...
- Page 37 4 Product description 4.5.4.8 Media converter with managed switch The assembly SW 3-3 is a media converter with managed switch. It com- bines two independent functions and provides you with the following inter- faces: ▪ A media converter converts an electric connection (RJ45) into a fiber-optic cable connection –...
-
Page 38: Visualization
4 Product description 4.6 Visualization 4.6.1 Main screen The web-based visualization is split into various areas. Figure 19: Main screen 1 Display area 2 Secondary navigation 3 Primary navigation 4 Status bar The most important measured values of the transformer are displayed on the main screen. - Page 39 4 Product description 4.6.1.1 Transformer for network applications Figure 20: Transformer data 1 DGA (status) 2 Top-oil temperature 3 Hot-spot temperature 4 Cooling system (status) 5 Load current and load voltage of 6 Transformer name phases L1, L2, L3 Figure 21: Apparent power, oil level, and ambient temperature 1 Asset intelligence 2 Total apparent power 3 Ambient temperature...
- Page 40 4 Product description Figure 22: On-load tap-changer and motor-drive unit 1 OLTC oil temperature 2 Current tap position 3 Voltage regulator 4 Tap-change operation statistics 5 OLTC status message (collective message) 4.6.1.2 Transformer for industrial applications Figure 23: Transformer data 1 DGA (status) 2 Top-oil temperature 3 Hot-spot temperature 4 Cooling system (status)
- Page 41 4 Product description Figure 24: Apparent power, oil level, and ambient temperature 1 Asset intelligence 2 Total apparent power 3 Ambient temperature 4 Oil level (transformer on left, on- load tap-changer on right) Figure 25: On-load tap-changer and motor-drive unit 1 OLTC oil temperature 2 Current tap position 3 Voltage regulator 4 Tap-change operation statistics...
-
Page 42: Additional Operating Controls And Display Elements When Using The Mcontrol Touch Panel (Optional)
4 Product description 4.6.2 Additional operating controls and display elements when using the MControl touch panel (optional) If you are using the device with the optionally available MControl touch panel, additional operating controls and display elements are displayed on the left edge of the screen. Depending on the device configuration, a variety of keys are available: Figure 26: Additional display elements and operating controls Status... - Page 43 4 Product description User rights and user roles The device is equipped with a rights system and a roles system. The display and access rights to device settings or events can therefore be controlled at user level. You can configure the rights system and roles system to meet your require- ments.
- Page 44 4 Product description Parameter search You can use the quick search function in the parameter menu to search for a parameter. Enter the name of the desired parameter in the Search entry field. Figure 27: Quick search Expert mode The device has an expert mode for entering the parameters. You can enter the parameters directly into the overview screen of the respective menu in this mode.
- Page 45 4 Product description Hiding/showing parameters Depending on how you set the parameters, the device will hide or show ad- ditional parameters related to this function. ® Maschinenfabrik Reinhausen GmbH 2020 4453918/14 EN ETOS...
-
Page 46: Packaging, Transport And Storage
5 Packaging, transport and storage 5 Packaging, transport and storage 5.1 Packaging The products are sometimes supplied with sealed packaging and sometimes in a dry state, depending on requirements. Sealed packaging surrounds the packaged goods with plastic foil on all sides. -
Page 47: Markings
5 Packaging, transport and storage 5.1.2 Markings The packaging bears a signature with instructions for safe transport and cor- rect storage. The following symbols apply to the shipment of non-hazardous goods. Adherence to these symbols is mandatory. Protect against Fragile Attach lifting Center of mass moisture... -
Page 48: Storage Of Shipments
5 Packaging, transport and storage Visible damage If external transport damage is found upon receipt of the shipment, proceed as follows: ▪ Immediately record the identified transport damage in the shipping docu- ments and have this countersigned by the carrier. ▪... -
Page 49: Unpacking Shipments And Checking For Transportation Damages
5 Packaging, transport and storage When selecting and setting up the storage location, ensure the following: ▪ Protect stored goods against moisture (flooding, water from melting snow and ice), dirt, pests such as rats, mice, termites and so on, and against unauthorized access. - Page 50 5 Packaging, transport and storage Figure 29: Control cabinet lifting gear limit stop – WARNING! The cable angle of the lifting gear must always be less than 45° in relation to the vertical. Otherwise, the control cabinet may be damaged and serious injuries may result. Figure 30: Maximum permissible cable angle for the control cabinet lifting gear limit stop ▪...
- Page 51 5 Packaging, transport and storage Figure 31: Slip for lifting the gear motor ® Maschinenfabrik Reinhausen GmbH 2020 4453918/14 EN ETOS...
-
Page 52: Mounting
6.5 m long. If required, you can contact Maschinenfab- rik Reinhausen GmbH for other lengths. The control cabinet has four fixing attachments on the rear to secure it. 1. Attach four stud bolts (not supplied by MR) to the transformer tank. Figure 32: Fastening the stud bolts Type A ±... - Page 53 6 Mounting 2. For control cabinets with vibration damper: Attach the vibration damper to the control cabinet. Figure 33: Vibration damper 3. Use the fixing attachments to attach the control cabinet to the stud bolts and align it vertically on the transformer tank. Figure 34: Attaching the control cabinet ®...
- Page 54 6 Mounting NOTICE! Damage to the control cabinet due to mechanical tension. Se- cure the control cabinet without subjecting it to mechanical tension. Figure 35: Securing the drive 5. Connect the grounding cable to the control cabinet and transformer tank, holding it against the control cabinet using a wrench (wrench size 36). Figure 36: Connecting the grounding cable to the control cabinet ®...
-
Page 55: Cable Recommendation
6 Mounting 6.2 Cable recommendation Please note the following Maschinenfabrik Reinhausen GmbH recommenda- tion when wiring the device. ▪ Excessive line capacitance can prevent the relay contacts from interrupt- ing the contact current. In control circuits operated with alternating current, take into account the effect of the line capacitance of long control cables on the function of the relay contacts. - Page 56 6 Mounting RS232 (D-SUB 9-pole) To connect the device via the RS232 interface (COM2), use a data cable with the following structure: Figure 37: RS232 data cable (9-pole) RS485 (D-SUB 9-pole) To connect the device via the RS485 interface (COM2), use a data cable with the following structure: Figure 38: RS485 data cable ®...
-
Page 57: Notes On Connecting To The Mr Sensor Bus
MR sensor bus. ▪ The MR sensor bus uses Modbus in a 2-wire configuration (2W). The 4- wire configuration (4W) is not supported. ▪ You must connect the sensors via a shielded line with 3 conductors (D0, D1, Common). - Page 58 CPU-COM2 Com. (C) D0 (A) D1 (B) Sensor 1 Com. (C) D0 (A) D1 (B) Sensor x Com. (C) D0 (A) 120 Ω D1 (B) Figure 40: MR sensor bus ® ETOS 4453918/14 EN Maschinenfabrik Reinhausen GmbH 2020...
-
Page 59: Msense® Dga
If you would like to use an MSENSE® DGA sensor, you must connect the sensor to the MR sensor bus in accordance with the following connection ex- amples. If the MSENSE® DGA sensor is the only bus device or the last bus device, you must use a terminating resistor (120 Ω, 0.5 W). -
Page 60: Messko® Mtec® Ept303 Fo
The EPT303 FO sensor module contains a terminating resistor. If you would like to use the EPT303 FO sensor together with other sensor types on an MR sensor bus, then we recommend connecting the EPT303 FO sensor to the end of the bus. -
Page 61: Messko® Mtrab® 2.5
6 Mounting 6.4.3 MESSKO® MTRAB® 2.5 If you would like to use a MESSKO® MTRAB® 2.5 sensor, you must con- nect the sensor to the RS485 plug terminals on the sensor bus. CPU-COM2 Com. (C) D0 (A) D1 (B) MTRAB 2.5 D+ | Rx+ D- | Rx- Shield... -
Page 62: Msense®-Fo Ecu-I/S
6 Mounting 6.4.4 MSENSE®-FO ECU-I/S If you would like to use an MSENSE®-FO ECU-I or ECU-S sensor, you must connect the sensor to the RS485 plug terminals on the sensor bus. Use a shielding clamp to apply the shield to the cable. If the MSENSE®-FO sensor is the only bus device or the last bus device, you must use a terminating re- sistor (120 Ω, 0.5 W). - Page 63 6 Mounting The AIO assembly has a separate plug connector for each channel (input or output). The plugs are assigned as follows: Figure 48: Plug assignment of the AIO module (illustration using module AIO 4 as an example) Interface Description I OUT (+): Current output + I/U IN (+) U OUT (+): Voltage input +, current input +, voltage output + I/U IN (-): Voltage input -, current in-...
- Page 64 6 Mounting 4...20 mA sensor You must connect a 4...20 mA sensor to the pins . You must also connect the supplied bridge to the pins , and 4...20 mA signal source I OUT (+) I/U IN (+) U OUT (+) I/U IN (-) I/U OUT (+) Figure 49: Connection example for a 4...20 mA sensor...
-
Page 65: Information About Screening The Cables For Analog Signals
6 Mounting 6.6 Information about screening the cables for analog signals In order to correctly record the analog signals, you must place the cable screening in the motor-drive unit on the grounding bar. The cable shielding should be removed as late as possible before connecting to keep the section with unshielded cables as short as possible. -
Page 66: Connecting Motor-Drive Unit
6 Mounting 6.8 Connecting motor-drive unit NOTICE Damage to the connecting cable! Damage to the connecting cable due to impermissibly small bend radiuses and kinks. ► When routing the connection cable, observe the minimum bend radiuses: min. 51 mm for fixed routing, min. 170 mm if moved occasionally. ►... - Page 67 6 Mounting 2. Connect the connection cable provided to the plug connector of gear mo- tor. Connect the other end of the connection cable to the terminal in the control cabinet in accordance with the connection diagram provided. Figure 52: Connecting the connection cable to the gear motor 3.
- Page 68 6 Mounting 4. Connect the shield of the connection cable provided (electrical connection between control cabinet and gear motor) using shielded clamps on the grounding bar in the control cabinet. Figure 54: Connection of the shielded clamps on the grounding bar of the control cabinet 1 Grounding bar Tighten cable screw connections on control cabinet to the following tighten- ing torques: M20: 8 Nm, M32: 20 Nm.
-
Page 69: Commissioning
7 Commissioning 7 Commissioning 7.1 Performing tests Please contact Maschinenfabrik Reinhausen GmbH (MR) if any aspect of the tests is not clear. 7.1.1 Function test of the motor-drive unit Risk of death or severe injury! WARNING Danger of death or severe injury due to electrical voltage and incorrect as- sembly! ►... -
Page 70: Dielectric Tests On Transformer Wiring
7 Commissioning ▪ Ensure that the oil compartment of the on-load tap-changer is completely filled with insulating fluid. ▪ Ensure that all protective devices for the on-load tap-changer are function- ing correctly and are ready for use. ▪ Ensure that the ground connections on the motor-drive protective housing and protective housing fastening are free of paint. -
Page 71: Commissioning The Transformer At The Operating Site
7 Commissioning 6. Tighten fixing screws (3x M12) using a tightening torque of 62 ± 6 Nm. 7. Connect gear motor [►Section 6.8, Page 66]. 7.3 Commissioning the transformer at the operating site Before commissioning the transformer, repeat the function tests. WARNING Danger of death or severe injury! Danger of death or severe injury due to incorrect operation. -
Page 72: Operation
8 Operation 8 Operation 8.1 Actuating motor-drive unit locally To actuate the motor-drive unit locally, proceed as follows: ü Operating mode switch S32 or S132 is in the LOC position. ► Turn control switch S3 in the raise or lower direction. ð... -
Page 73: Visualization
9 Visualization 9 Visualization The ETOS® TD motor-drive unit is equipped with web-based visualization . This allows you to configure the device with a computer and to display mea- sured values. System requirements To access the web-based visualization, you need a PC with an HTML5-ca- pable browser. - Page 74 9 Visualization Establishing a connection via the ETH1.1 interface To establish a connection via the ETH1.1 interface, proceed as follows: 1. Connect the PC and device using an Ethernet cable (RJ45 plug) via the ETH1.1 interface. Figure 55: Establishing a connection via the front interface 2.
-
Page 75: General
9 Visualization To connect via the ETH2.2 interface, proceed as follows: 1. Connect the PC and device using an Ethernet cable (RJ45 plug) via the ETH2.2 interface. Figure 56: Establishing a connection via the ETH2.2 interface on the back 2. Assign a unique IP address to the PC in the same subnet as the device (e.g. -
Page 76: Setting General Device Functions
9 Visualization 9.2.1 Setting general device functions You can set general device functions with the following parameters. Settings Parameters General Name Value Home Language English Commissioning wizard Auto-logout Events Time until auto-logout 15.0 min Measured value display Primary values Transformer name Transformer Remote behavior Hardware and SCADA... -
Page 77: Set Up Automatic Logout
9 Visualization You can select the following settings: Setting Description Hardware only The device accepts commands through digital inputs. SCADA only The device accepts commands via SCADA. Hardware and SCADA The device accepts commands via digital inputs and SCADA. Table 17: Selecting remote behavior USB interface You can use this parameter to deactivate the USB interface. -
Page 78: Activating/Deactivating Service User Access
9 Visualization Auto logout You can use this parameter to activate th automatic logout function. Time until auto logout You can use this parameter to set the time period of inactivity after which a user is automatically logged out. 9.2.3 Activating/deactivating service user access The device is equipped with user access for the Maschinenfabrik Rein- hausen GmbH Technical Service department. -
Page 79: Configuring The Network
9 Visualization 5. Restart the device to apply the change. Service user access activation You can use this parameter to activate or deactivate service user access. 9.3 Configuring the network You can configure the ETH 1 and ETH 2.2 network interfaces of the CPU as- sembly in this menu item. - Page 80 9 Visualization Assign IP addresses to both web-based visualization and SCADA (optional) in different subnets. Otherwise you will not be able to establish a connec- tion. Subnet mask ETH 1/ETH 2.2 You can use this parameter to set the subnet mask. Be sure to enter a valid network mask that is not 0.0.0.0, otherwise it will not be possible to connect to the device.
-
Page 81: Mqtt
9 Visualization TLS version You can use this parameter to set the accepted TLS versions. If you would like to establish an encrypted connection to the visualization, you must use an accepted TLS version. You can select the following options: Option Accepted TLS versions >= 1.0... - Page 82 9 Visualization Settings Parameters MQTT Name Value Home Activate MQTT Broker address Broker port 8883 Events Client username Password SSL/TLS encryption Information Recorder CHANGE REBOOTadmin 23.09.2020 09:23 Settings Figure 61: MQTT ü When using a URL on the broker, it may be necessary to enter and acti- vate [►Page 81] the IP address [►Page 81] of the DNS server.
-
Page 83: Setting The Device Time
9 Visualization Password (optional) You can use this parameter to set the password for authentication at the bro- ker. When using authentication, you must configure the broker accordingly. SSL/TLS encryption You can use this parameter to set whether the data should be transmitted over an SSL/TLS-encrypted connection. -
Page 84: Time Synchronization Via Ptp
9 Visualization SNTP time server You can use this parameter to enter the IP address of a SNTP time server. If you are using a time server, the device uses the time of the time server as the system time. Be sure to enter a valid time server address that is not 0.0.0.0, otherwise it will not be possible to connect to the device. -
Page 85: Configuring Syslog
9 Visualization PTP version You can use this parameter to select the PTP version. ▪ PTP version 1 (IEEE 1588-2002) ▪ PTP version 2 (IEEE 1588-2008) PTP interface You can use this parameter to select the interface that the device is to use for PTP. - Page 86 9 Visualization Syslog standard You can use this parameter to adjust the transmission process and the for- mat for the syslog messages. You can select the following options: Standard Transport Message format RFC 5425 (recom- RFC 5424 mended) RFC 5426 RFC 6587 RFC 3164 RFC 3164 Table 20: Syslog standard If you use the standard RFC 5245 (TLS), you have to import the root certifi- cate and the client certificate with the corresponding key to the syslog...
-
Page 87: Scada
9 Visualization Severity level Description Notice state Notice Information state Info Debug state Debug Table 21: Severity levels 9.7 SCADA The following section describes how you can configure the device to connect to a control system (SCADA). You can download the data points with the help of the export manager [►Section 9.36, Page 287]. - Page 88 9 Visualization Device ID You can use this parameter to assign a device ID to the device in order that it can be identified in the IEC 61850 network. Access point You can use this parameter to assign a name to the access point in the IEC 61850 network.
-
Page 89: Configuring Iec 60870-5-101 (Optional)
9 Visualization 9.7.2 Configuring IEC 60870-5-101 (optional) If you want to use the IEC 60870-5-101 control system protocol, you must set the following parameters. Settings Parameters IEC 60870-5-101 Name Value Home Serial interface RS232 Baud rate 9600 Transmission procedure Unbalanced Events Number of link address octets Link address... - Page 90 9 Visualization Transmission procedure You can use this parameter to set the transmission procedure. You can se- lect the following options: ▪ Unbalanced transmission ▪ Balanced transmission Number of link address octets You can use this parameter to set how many octets are provided for the link address.
- Page 91 9 Visualization ASDU single character confirmation You can use this parameter to set whether a confirmation is to be sent as single characters instead of as a complete message. Single character confir- mation is only possible for requesting data of class 2 (Class 2 Request). RES bit test You can use this parameter to set whether the device is to check the RES bit (Reserved Bit) in the control field.
-
Page 92: Configuring Iec 60870-5-103 (Optional)
9 Visualization Reference time You can use this parameter to set which time is to be transmitted by the con- trol system. The device uses this information for time synchronization [►Section 9.5, Page 83]. You can select the following options: Option Description Local... - Page 93 9 Visualization Baud rate You can use this parameter to set the serial interface's baud rate. You can select the following options: ▪ 9600 baud ▪ 19200 baud ▪ 38400 baud ▪ 57600 baud ▪ 115200 baud ASDU address You can use this parameter to set the address of the ASDU. Number of data bits You can use this parameter to set the number of databits.
-
Page 94: Configuring Iec 60870-5-104 (Optional)
9 Visualization Reference time You can use this parameter to set which time is to be transmitted by the con- trol system. The device uses this information for time synchronization [►Section 9.5, Page 83]. You can select the following options: Option Description Local... - Page 95 9 Visualization ASDU address You can use this parameter to set the address of the ASDU. ASDU sequence optimization With this parameter, you can set which method is to be used for optimizing the ASDU types. The standard enables optimization in order to be able to transfer multiple value changes in a telegram in a sequence of ascending in- formation object addresses.
-
Page 96: Configuring Modbus (Optional)
9 Visualization Note that all SCADA clients communicate with the device on an equal basis, because the device does not prioritize commands. If you transmit com- mands from several SCADA clients to the device at the same time, the de- vice will execute the last transmitted command. - Page 97 9 Visualization Maximum TCP connections You can use this parameter to set the maximum number of TCP connec- tions. TCP Keepalive You can use this parameter to activate/deactivate the "TCP Keepalive" func- tion. Serial interface You can use this parameter to select the serial interface for data transmis- sion.
-
Page 98: Configuring Dnp3 (Optional)
9 Visualization 9.7.6 Configuring DNP3 (optional) If you would like to use the DNP3 control system protocol, you must set the parameters listed below. Also refer to the section Configuring the network [►Section 9.3, Page 79] if you want to use the DNP3 via TCP. Settings Parameters DNP3... - Page 99 9 Visualization Baud rate You can use this parameter to set the serial interface's baud rate. You can select the following options: ▪ 9600 baud ▪ 19200 baud ▪ 38400 baud ▪ 57600 baud ▪ 115200 baud 9.7.6.2 Device address You can use this parameter to set the device link address.
-
Page 100: Configuring Goose (Optional)
▪ The maximum number of usable GSEControl elements is defined in TEM- PLATE.icd under Services GOOSE. You cannot adjust this value. ▪ The shortest repeat time is defined in Private Element type="MR- MINTIME-GOOSE". You cannot adjust this value. ®... - Page 101 9 Visualization Example: Configuration To configure the device as a GOOSE publisher, you have to call up the vi- sualization via a PC. You must have a parameter configurator or administra- tor user role. To configure the device as a GOOSE publisher, proceed as follows: 1.
- Page 102 9 Visualization 5. Select the PC or USB option, select the SCD/CID file, and select Trans- fer. Figure 71: Importing an SCD/ICD file 6. Select the desired IED with the configuration that is to be imported and select Accept to start the import. Figure 72: Selecting an IED 7.
- Page 103 DataSet and GSE block. The referenced DataSet may contain data ob- jects (DO) or data attributes (DA). The maximum number of usable data points per GOOSE message is defined in Private Element type="MR-MAX- GOOSE-SUBSCRIBER-FCDA". You cannot adjust this value.
- Page 104 9 Visualization To configure the device as a GOOSE subscriber, proceed as follows: ü The SCD file for your system with all required IEDs has been imported. 1. Go to Settings > Mapping. ð The list of functions available on the device appears. Figure 73: Overview of device functions available 2.
-
Page 105: Configure Data Points (Optional)
9 Visualization Deleting a configuration If necessary, you can delete the data point configuration. To do so, proceed as follows: 1. Go to Settings > Mapping. 2. Select the desired function. 3. Press the Delete button to delete the configuration. 9.7.8 Configure data points (optional) You can use the optional "Configure data points"... - Page 106 9 Visualization Column Description Modifiable Setting range Threshold value for measured values. The data point is 0...32,768 only transferred again if the change of value is greater than the threshold value. ▪ If you enter the value 0, no threshold value is active. ▪...
- Page 107 9 Visualization 9.7.8.2 Configuring IEC 60870-5-103 data points You can adjust the following data point properties for the IEC 60870-5-103 control system protocol: Column Description Modifiable Setting range Active You can use the checkbox to set whether the data point is Active/inactive to be transferred via the control system protocol or not.
- Page 108 9 Visualization Proceed as follows to configure the data points: 1. Go to Settings > Data point configuration. 2. Adjust the data points as required. 3. Press the Accept button to adopt the modified list of data points. 4. Restart the device to activate the modified list of data points. 9.7.8.3 Configuring IEC 60870-5-104 data points You can adjust the following data point properties for the IEC 60870-5-104 control system protocol:...
- Page 109 9 Visualization Figure 77: Configuring IEC 60870-5-104 data points Proceed as follows to configure the data points: 1. Go to Settings > Data point configuration. 2. Adjust the data points as required. 3. Press the Accept button to adopt the modified list of data points. 4.
- Page 110 9 Visualization Figure 78: Configuring Modbus data points Proceed as follows to configure the data points: 1. Go to Settings > Data point configuration. 2. Adjust the data points as required. 3. Press the Accept button to adopt the modified list of data points. 4.
- Page 111 9 Visualization Column Description Modifiable Setting range PREFSTATICVAR For a data point of class 0 (Static), you can define the fol- 0...6 lowing variation depending on the object group: ▪ BI: 1, 2 ▪ BO: 2 ▪ AI: 2, 4 ▪...
-
Page 112: Display Status Of The Scada Connection
9 Visualization 2. Adjust the data points as required. 3. Press the Accept button to adopt the modified list of data points. 4. Restart the device to activate the modified list of data points. 9.7.8.6 Resetting the data point configuration to factory settings If you want to reset the data point configuration to factory settings, proceed as follows: 1. -
Page 113: Name Plate
9 Visualization Figure 80: Communication ► Go to Home > Communication. 9.8 Name plate You can enter the data of the name plates, the on-load tap-changer and the motor-drive unit and display it later. 9.8.1 Enter the name plate data You can enter the name plate data for the transformer, the on-load tap- changer and the motor-drive unit. -
Page 114: Displaying The Name Plate
9 Visualization 9.8.2 Displaying the name plate You can display the nameplate data for the transformer, on-load tap- changer, and motor-drive unit. Figure 82: Nameplate ► Go to Information > System > Nameplate. 9.9 Linking signals and events The device enables you to link digital inputs (GPI) and control system com- mands (SCADA) with device functions, digital outputs (GPO), and control system messages. -
Page 115: Linking Functions
9 Visualization You can link the event messages with device functions, digital outputs, and control system messages. You can also link all other event messages (e.g. Undervoltage U<) with digital outputs and control system messages. Corre- sponding parameters, for which you need to enter the relevant event num- ber, are provided for this purpose. - Page 116 9 Visualization Follower parallel operation method If the assigned event is active, the device activates the follower parallel oper- ation method. Automatic tap synchronization parallel operation method If the assigned event is active, the device activates the automatic tap syn- chronization parallel operation method.
-
Page 117: Linking Digital Outputs
9 Visualization Activate desired value 5 If the assigned event is active, the device activates the desired value 5. Increase desired value If the assigned event is active, the device prompts an increase in the desired value. Decrease desired value If the assigned event is active, the device prompts a decrease in the desired value. -
Page 118: Linking Control System Messages
9 Visualization Generic digital output X You can use this parameter to link the digital output with an event message. To do so, enter the desired event number. If you enter event number 500, the link is disabled. 9.9.3 Linking control system messages You can link each event with a control system message. -
Page 119: Cooling System Control (Optional)
9 Visualization If you enter event number 500, the link is disabled. 9.10 Cooling system control (optional) You can use the cooling system control function package to control and/or monitor up to 6 cooling stages depending on device configuration. 9.10.1 Configuring cooling stages To control the cooling system, you have to set the following parameters for each cooling group: Settings... - Page 120 9 Visualization If you have started the cooling stages manually and a power failure occurs, the device restarts the cooling stages once power has been restored. Switch on input variable You can use this parameter to set which measured temperature value is to be used to switch on the cooling stage.
-
Page 121: Set The Operating Mode
9 Visualization Alternating mode You can use this parameter to activate alternating mode [►Section 9.10.6, Page 124] for the cooling stage. Periodic mode You can use this parameter to activate periodic mode [►Section 9.10.5, Page 123] for the cooling stage. Active if error You can use this parameter to set whether the device is to activate the cool- ing stage in the event of an error (fail-safe mode). - Page 122 9 Visualization Once the switch-on delay has elapsed, the cooling stages are activated. To limit the inrush current of the cooling stages, they are activated one after an- other with a delay time of 60 seconds. Settings Parameters Cooling ...rol Name Value Home Operating mode...
-
Page 123: Configuring Periodic Mode
9 Visualization Load-dependent mode: Overrun time You can use this parameter to set the time period for which the cooling stages remain switched on when the transformer load current returns to a value below the set switching point. 9.10.5 Configuring periodic mode Periodic mode is used to prevent the bearings of the cooling stages from seizing up as a result of long idle periods. -
Page 124: Configuring Alternating Mode
9 Visualization Periodic mode: Switch-on delay You can use this parameter to set the time period after which the cooling stages are to be switched back on again. 9.10.6 Configuring alternating mode If the transformer is equipped with several similar cooling stages, you can run the stages in alternating mode. -
Page 125: Configuring The Frequency-Based Cooling System Control
9 Visualization Alternating mode: Change interval You can use this parameter to set the time period after which the cooling stage is to be changed. 9.10.7 Configuring the frequency-based cooling system control The optional frequency-based cooling system control function lets you con- trol the fans in a cooling system using the frequency. - Page 126 9 Visualization The following diagrams show an example of a graph of the fan speeds based on the top-oil temperature according to the set parameters. θ θ °C θ Top oil Figure 90: Fan speed based on the top-oil temperature n Fan speed θ...
- Page 127 9 Visualization The following diagrams show an example of a graph of the fan speeds based on the load factor according to the set parameters. Load factor Figure 91: Fan speed based on load factor n Fan speed θ Temperature of top-oil Top-oil Minimum fan speed Maximum fan speed...
-
Page 128: Displaying Status Of Cooling Stages
9 Visualization Min. fan run time after error You can use this parameter to set how long the fans are to continue running if an error occurs in the cooling system control. The fans run at full power for this duration. Minimum fan speed You can use this parameter to set the minimum fan speed. -
Page 129: Cooling System Monitoring (Optional)
9 Visualization Figure 93: Status of cooling stages ► Go to Information > Cooling system > Cooling system control. 9.11 Cooling system monitoring (optional) With the optional cooling monitoring function, you can monitor the cooling system of a transformer. 9.11.1 Setting the cooling system monitoring function You can set the general cooling system monitoring functions with the follow- ing parameters. -
Page 130: Cooling Efficiency Monitoring (Optional)
9 Visualization 4. Press the Accept button to save the modified parameter. Run-in time evaluation You can use this parameter to set the length of time a cooling stage has to be active before the device performs an evaluation of the values to be moni- tored for the "Cooling system flow monitoring"... -
Page 131: Cooling System Flow Monitoring (Optional)
9 Visualization 1. Go to Settings > Parameters > Cooling system > Cooling efficiency monitoring. 2. Select the desired parameter. 3. Set the parameter. 4. Press the Accept button to save the modified parameter. Transformer short-circuit losses You can use this parameter to set the transformer short-circuit losses (cop- per losses) P for calculating the thermal resistance of the cooling system. - Page 132 9 Visualization ▪ Pressure ▪ Flow rate ▪ Pump current consumption Water Cooling stage 1 Cooling stage 2 0.96 bar 1.10 bar 0.96 bar 1.10 bar 3.6 m³/h 3.9 m³/h 3.6 m³/h 3.6 m³/h 45°C 8°C 47°C 8°C 38°C 14°C 41°C 15°C Figure 97: Cooling system flow monitoring values 9.11.3.1 Setting the cooling system flow monitoring function You can set the following limit values for the cooling media oil and water re- spectively for monitoring the cooling system flow:...
- Page 133 9 Visualization Behavior If the measured value is higher than the upper limit (> or >>) or lower than the lower limit (< or <<), the device triggers an event message. Figure 98: Monitoring, cooling stage 1 1. Go to Settings > Parameters > Cooling system > Cooling stage 1/2 monitoring.
- Page 134 9 Visualization Oil pressure You can use these parameters to set the limit values for the permissible pressure of the oil circuit. You can set two lower limit values for each cooling stage. Oil flow You can use these parameters to set the limit values for the permissible flow rate of the oil circuit.
-
Page 135: Drive Overview
9 Visualization 9.11.3.2 Displaying the cooling system flow You can display the temporal progression of the measured values of the cooling system flow monitoring over the last 10 days. Figure 99: Cooling system flow ► Go to Information > Cooling system > Cooling stage 1/2. 9.12 Drive overview The overview display of the motor-drive unit shows you the following infor- mation:... -
Page 136: Displaying Power Characteristics
9 Visualization Figure 100: Drive overview 1 Tap position 2 Tap-change indicator section (SSE) 3 Operation counter 4 Operating mode 5 Switching blocking 6 Motor protective switch 7 Door open/closed 8 Temperatures 9 Next maintenance ► Go to Information > Motor and control cabinet > Drive. 9.13 Displaying power characteristics You can display the recorded power characteristics of the motor-drive unit for the last 1000 tap-change operations. -
Page 137: Regulation
9 Visualization Information Perf. char. curves Home 20.01.2020 Date 13:36:33 Time 14 > 13 Tap position Events P_Motor Information Threshold Tap position Recorder 5 / 1000 CHANGE REBOOTadmin 03.02.2020 08:09 Settings Figure 101: Displaying power characteristics ► Go to Information > On-load tap-changer > Power characteristics. 9.14 Regulation The general functions for regulating the on-load tap-changer are described in this section. - Page 138 9 Visualization Settings Parameters Control Name Value Home Control variable Voltage Response to SCADA disconnection No reaction SCADA disconnection delay time 5 s Events Information Recorder CHANGE REBOOTadmin 23.09.2020 09:23 Settings Figure 102: Regulation 1. Go to Settings > Parameters > On-load tap-changer regulator > Regu- lation.
-
Page 139: Setting Control Variable (Optional)
9 Visualization 9.14.2 Setting control variable (optional) If the device is equipped with the optional reactive power regulation function, you can set which control variable the device is to regulate. Settings Parameters Control Name Value Home Control variable Voltage Response to SCADA disconnection No reaction SCADA disconnection delay time 5 s... -
Page 140: Voltage Regulation
9 Visualization 9.15 Voltage regulation All of the parameters required for voltage regulation are described in this section. Settings Parameters Voltage re...ion Name Value Home Desired value 1 100 V Desired value 2 100 V Desired value 3 100 V Events Selecting a desired value Desired value 1 Bandwidth 1.0 %... - Page 141 9 Visualization The device only processes commands via digital inputs or the control sys- tem when it is in the Remote mode. You must also set the Remote behavior [►Page 76] parameter accordingly. Setting the desired value 1. Go to Settings > Parameters > Grid > Control > Desired value. 2.
- Page 142 9 Visualization 9.15.1.4 Analog setting of the desired value With the analog setting of the desired value, the desired value for the auto- matic voltage regulation can be variably adapted using an analog signal (e.g. 4...20 mA). Desired value Max. Min.
- Page 143 9 Visualization 3. Press the Accept button to save the modified parameter. 9.15.1.5 Step-by-step setting of the desired value For the step-by-step setting of the desired value, you can increase or de- crease the desired value for the automatic voltage regulation by an ad- justable step width using digital inputs or control system commands.
- Page 144 9 Visualization Parameter Function Settings (see diagram below) : Desired value at 0 active Set desired value is activated when measured active 100.00 V power power is 0 MW. : Active power at max. de- Set maximum active power value above which the 20.0 MW sired value power-dependent desired value is to attain the maxi-...
- Page 145 9 Visualization Response to value falling below active power P If the measured active power P falls below the set parameter P , the meas value U is adopted as the desired value. Response to a measured active power P = 0 MW: meas If the measured active power P...
- Page 146 9 Visualization 2. Select the option you want. 3. Press the Accept button to save the modified parameter. TDSC Umax/Umin You can use these parameters to set the maximum and minimum desired value. The maximum or minimum desired value is activated when the mea- sured active power reaches the set minimum or maximum active power.
- Page 147 9 Visualization Depending on whether positive or negative active power is measured, the desired value calculation is based on 2 linear equations (see example in dia- gram below). Parameter Function Settings (see diagram below) : Maximum desired value Maximum set desired value is activated when P 103.0 V exceeded.
- Page 148 9 Visualization Response to active power P being exceeded If the measured active power P exceeds the set parameter P , the value meas is adopted as the desired value. Response to value falling below active power P If the measured active power P falls below the set parameter P , the meas...
- Page 149 9 Visualization If you activate TDSC, the line drop compensation (R&X compensation or Z compensation) function is deactivated. To activate/deactivate TDSC using parameters, proceed as follows: 1. Go to Settings > Parameters > Control > Activate TDSC. 2. Select the option you want. 3.
- Page 150 9 Visualization The following outputs are available to you as an option: ▪ Desired value setting faulty: The device issues a signal if the BCD code for the desired value setting is invalid. ▪ Desired value active: The device issues a signal if desired value setting via BCD is active.
- Page 151 9 Visualization Desired BCD input value 76 V 77 V 78 V 79 V 80 V 81 V 82 V 83 V 84 V 85 V 86 V 87 V 88 V 89 V 90 V 91 V 92 V 93 V 94 V 95 V...
- Page 152 9 Visualization Desired BCD input value 111 V 112 V 113 V 114 V 115 V 116 V 117 V 118 V 119 V 120 V 121 V 122 V 123 V 124 V 125 V 126 V 127 V 128 V 129 V 130 V...
- Page 153 9 Visualization Bandwidth You can use this parameter to set the maximum permissible deviation of the measured voltage U from the desired value U actual desired In order to set the correct value, the transformer step voltage and nominal voltage must be known. Note that a large bandwidth will result in a large control deviation.
- Page 154 9 Visualization change command is issued after expiration of the set delay time T1. The on-load tap-changer carries out a tap-change in a raise or lower direction to return to the tolerance bandwidth. Figure 108: Behavior of the control function with delay time T1 1 Upper limit of bandwidth 4 Set delay time T1 2 Desired value...
- Page 155 9 Visualization the device responds faster to large voltage changes in the grid. Regulation accuracy improves as a result but the frequency of tap-changes increases too. Figure 109: Diagram for integral time response ΔU/B Control deviation "ΔU" as % of desired value in relation to the set band- width "B"...
- Page 156 9 Visualization starts to count down. Once delay time T2 is complete, a control impulse is again issued to the motor-drive unit for the tap change to return to the tol- erance bandwidth. Figure 110: Behavior of the regulation function with delay times T1 and T2 1 Upper bandwidth limit 4 Set delay times T1 and T2.
-
Page 157: Reactive Power Regulation (Optional)
9 Visualization 9.16 Reactive power regulation (optional) All of the parameters required for reactive power regulation are described in this section. Settings Parameters Reactive p...ion Name Value Home Desired value 0 var Bandwidth 0 var Delay time T1 40 s Events Time response T1 Linear Activate delay time T2 Delay time T2... - Page 158 9 Visualization change command is issued after expiration of the set delay time T1. The on-load tap-changer carries out a tap-change in a raise or lower direction to return to the tolerance bandwidth. Figure 112: Behavior of the control function with delay time T1 1 Upper limit of bandwidth 4 Set delay time T1 2 Desired value...
- Page 159 9 Visualization the device responds faster to large voltage changes in the grid. Regulation accuracy improves as a result but the frequency of tap-changes increases too. Figure 113: Diagram for integral time response ΔU/B Control deviation "ΔU" as % of desired value in relation to the set band- width "B"...
-
Page 160: Transformer Data
9 Visualization starts to count down. Once delay time T2 is complete, a control impulse is again issued to the motor-drive unit for the tap change to return to the tol- erance bandwidth. Figure 114: Behavior of the regulation function with delay times T1 and T2 1 Upper bandwidth limit 4 Set delay times T1 and T2. -
Page 161: Setting Transformer Data
9 Visualization 9.17.1 Setting transformer data You can use the following parameters to set the transformer data. Also note the Examples for standard circuits for current transformers and voltage transformers [►Section 9.17.2, Page 163]. Settings Parameters Transfor...ata Name Value Home Primary transformer voltage 100 kV Secondary transformer voltage... - Page 162 9 Visualization Secondary transformer current You can use this parameter to set the secondary current of the current trans- former. You can select the following options: ▪ 0.2 A ▪ 1 A ▪ 5 A If you use the optional function "Hot-spot calculation on 3 different windings (W1, W2, W3)", this parameter setting applies to all 3 windings.
-
Page 163: Circuit Examples For Voltage Transformers And Current Transformers
9 Visualization 9.17.2 Circuit examples for voltage transformers and current transformers Below you will find different examples of circuits for voltage transformers and current transformers and the corresponding settings. 9.17.2.1 1-phase measurement Circuit 1-A ▪ The voltage transformer VT is connected to the phase conductor and neu- tral conductor. - Page 164 9 Visualization ▪ The voltage transformer VT is connected to the phase conductor L1 and the neutral conductor. ▪ The current transformer CT is looped into the phase conductor L1. ▪ The voltage U and current I are in phase. ▪...
- Page 165 9 Visualization Circuit 1-D ▪ The voltage transformer VT is connected to the phase conductors L1 and ▪ The current transformer CT is looped into the phase conductor L3. ▪ The current I is ahead of voltage U by 90°. This corresponds to a phase shift of -90°.
- Page 166 9 Visualization If you use this circuit, set the device as follows: Parameter Option Voltage-transformer circuit 3 Ph differential voltage Current-transformer circuit 3 Ph phase current Phase angle correction 30° Table 47: Circuit 1-E Circuit 1-F ▪ The voltage transformer VT is connected to the phase conductors L1 and ▪...
- Page 167 9 Visualization 9.17.2.2 3-phase measurement Circuit 3-A l1 k2 l2 k3 ▪ Three-phase measurement. ▪ The voltage transformers are connected between the phases. ▪ The current lags behind the voltage by 30°. If you use this circuit, set the device as follows: Parameter Option Voltage-transformer circuit...
- Page 168 9 Visualization Parameter Option Voltage-transformer circuit Current-transformer circuit Phase angle correction 0° UI measuring channels 3-phase measurement (channels 1, 2, 3) Measurement mode Phase-neutral Table 50: Circuit 3-B Only use the circuits 3-C, 3-D and 3-E on symmetrical grids. Otherwise the device will calculate incorrect performance values.
- Page 169 9 Visualization Circuit 3-D l1 k2 l2 k3 ▪ Three-phase voltage measurement, single-phase current measurement. ▪ The voltage transformers are connected between the phases. ▪ The current transformer is connected to phase L2. Parameter Option Voltage-transformer circuit Current-transformer circuit Phase angle correction -150°...
- Page 170 9 Visualization Parameter Option UI measuring channels 3-ph. voltage, 1-ph. current Measurement mode Phase-phase Table 53: Circuit 3-E Circuit 3-F l1 k2 l2 k3 ▪ Three-phase voltage measurement, single-phase current measurement. ▪ The voltage transformers are connected between the phase and neutral conductor.
- Page 171 9 Visualization ▪ Three-phase voltage measurement, single-phase current measurement. ▪ The voltage transformers are connected between the phase and neutral conductor. ▪ The current transformer is connected to phase L2. Parameter Option Voltage-transformer circuit 3 Ph phase voltage Current-transformer circuit 3 Ph phase current Phase angle correction -120°...
- Page 172 9 Visualization Only use these circuits in symmetrical grids. Note that you must always take the W1 voltage and current measurements on the low-voltage side of the transformer. ▪ W1: Voltage measurement and current measurement for the power calcu- lation and hot-spot calculation on winding 1 ▪...
- Page 173 9 Visualization Parameter Option UI measuring channels 3-ph. voltage, 1-ph. current Measurement mode Phase-neutral Table 57: Circuit S-1 Circuit S-2 l1 k2 l2 k3 If you use this circuit, set the device as follows: Parameter Option Voltage-transformer circuit 3 Ph phase voltage Current-transformer circuit 3 Ph phase current Current-transformer circuit W2...
- Page 174 9 Visualization Circuit S-3 l1 k2 l2 k3 If you use this circuit, set the device as follows: Parameter Option Voltage-transformer circuit Current-transformer circuit 3 Ph phase current Current-transformer circuit W2 Phase current Current-transformer circuit W3 Phase current Phase angle correction 0°...
- Page 175 9 Visualization Circuit S-4 l1 k2 l2 k3 If you use this circuit, set the device as follows: Parameter Option Voltage-transformer circuit 3 Ph differential voltage Current-transformer circuit 3 Ph phase current Current-transformer circuit W2 Phase current Current-transformer circuit W3 Phase current Phase angle correction -30°...
-
Page 176: Measurement
9 Visualization 9.18 Measurement You can use the following parameters to configure the measurement of cur- rent and voltage. Settings Parameters Measurement Name Value Home Regulation mode Single-phase Control variable L1/N or L1/L2 UI measuring channels 3-phase measurem.: Ch. 1,2,3 Events Information Recorder... -
Page 177: Control Variable
9 Visualization 9.18.2 Control variable If you are measuring the voltage and current with the 3-phase UI 3 measur- ing module and using the "single-phase" regulation mode, this parameter can be used to select the phase used for voltage regulation. You can select the following options: ▪... -
Page 178: Synchronizing The Motor-Drive Unit
9 Visualization 9.19 Synchronizing the motor-drive unit For commissioning, you have to synchronize the tap position of the on-load tap-changer using the control unit of the motor-drive unit. 9.19.1 Single-column on-load tap-changer model In the single-column design of the on-load tap-changer, you can synchronize the tap position in two different ways: ▪... -
Page 179: Multi-Column On-Load Tap-Changer Model
9 Visualization Note that the entire regulating range of the on-load tap-changer is traveled through during automatic synchronization. This allows strong voltage changes to occur on the transformer. Therefore, carry out the automatic synchronization on a de-energized transformer. Conditions for automatic synchronization: ▪... -
Page 180: Line Drop Compensation
9 Visualization 1. Go to Settings > Calibrate hardware > Tap position (automatic). 2. Select the Synchronize button. 3. Press the Start button to confirm the message. ð The on-load tap changers are switched into the lower final position (the lowest or the highest tap position, depending on the drive configura- tion). - Page 181 9 Visualization Figure 120: Phasor diagram of R&X compensation To use R&X compensation, you have to enter the following line data: ▪ Ohmic resistance load in mΩ/m ▪ Inductive resistance load in mΩ/m ▪ Length of line in km Settings Parameters Compensation Name Value...
- Page 182 9 Visualization Inductive resistance load You can use this parameter to set the inductive resistance load. Length of line You can use this parameter to set the length of line. 9.20.2 Z compensation To keep the voltage constant for the consumer, you can use Z compensation to activate a current-dependent voltage increase.
-
Page 183: Parallel Operation (Optional)
9 Visualization Settings Parameters Compensation Name Value Home Compensation method R & X compensation Ohmic resistance load 0.0 Ohm/m Inductive resistance load 0.0 Ohm/m Events Length of line 0.00 m Voltage increase 0.0 % Voltage limit value 0.0 % Information Recorder CHANGE REBOOTadmin 03.02.2020 08:09 Settings Figure 123: Compensation 1. -
Page 184: Parallel Operation Methods
9 Visualization ▪ Same number of switching groups ▪ For parallel operation with CAN communication: Current transformers with the same rated values must be used for all devices operating in parallel 9.21.1 Parallel operation methods You can undertake parallel operation with various parallel operation meth- ods. - Page 185 9 Visualization Parameter Auto Master Follower Activate parallel operation Parallel operation method Auto. tap syn- Master Follower chronization CAN bus address Circul. reactive current Optional, if master/follower current blocking is active blocking limit Master/follower current blocking Master/follower switching characteristics Maximum tap difference Yes (if follower) Error if no communication present...
- Page 186 9 Visualization voltage regulators as a correction for the control deviation determined on the basis of the measurement voltage. You can use the circulating reactive cur- rent sensitivity parameter to decrease or increase this extra control devia- tion. The circulating reactive current method is suited to transformers connected in parallel with a similar nominal output and short-circuit voltage U and to vector groups with the same and different step voltages.
- Page 187 9 Visualization 9.21.1.3 Circulating reactive current minimization without CAN bus communication With this method, you can operate several voltage regulators without a com- munication connection (CAN bus) in parallel with circulating reactive current minimization. Desired cosφ Desired cosφ T1: U, I, (cosφ) T2: U, I, (cosφ) U, I, (cosφ) Figure 126: Circulating reactive current minimization without CAN bus communication...
-
Page 188: Configuring Parallel Operation
9 Visualization Note that the parameters "Error if no communication" and "Behavior if no communication" have no function in the circulating reactive current mini- mization without CAN communication parallel operation method. 9.21.2 Configuring parallel operation In the Parallel operation menu item, you can set the parameters needed for parallel transformer operation. - Page 189 9 Visualization Parallel operation method You can use this parameter to set the parallel operation method. You can select the following options: Option Description Master The device is designated as Tap synchronization [►Sec- the master. tion 9.21.1.1, Page 184] par- allel operation method Follower The device is designated as...
- Page 190 9 Visualization Circulating reactive current blocking limit You can use this parameter to set the limit value for the maximum permissi- ble circulating reactive current. This value relates to the rated current of the current transformer. If, during parallel operation, the circulating reactive cur- rent exceeds the set limit value, the device triggers the Circulating reactive current blocking limit exceeded event.
- Page 191 9 Visualization mization, and provides you with the safety function of circulating reactive current blocking. The Circulating reactive current blocking parameter is used to set the limit value. Master/follower switching characteristics You can use this parameter to set the switching characteristics for the tap synchronization parallel operation method..
-
Page 192: Tapcon® 2Xx Retrofit
9 Visualization Option Description cosφ interpolation Continuation of parallel operation with interpolated values (only possible with circulating reactive current parallel oper- ation method) Power factor Circulating reactive current minimization without CAN bus communication [►Section 9.21.1.3, Page 187] parallel op- eration method Table 65: Behavior if no communication present Parallel operation error delay time You can use this parameter to set the delay time for a parallel operation er-... -
Page 193: Detecting Parallel Operation Via Group Inputs (Optional)
9 Visualization Settings Parameters TAPCON® ...fit Name Value Home Retrofit TAPCON®2xx Events Information Recorder CHANGE REBOOTadmin 31.01.2020 09:54 Settings Figure 130: Retrofit TAPCON® 2xx 1. Go to Settings > Parameters > Grid > TAPCON® 2xx retrofit. 2. Select the desired parameter. 3. -
Page 194: Monitoring Functions
9 Visualization 9.22 Monitoring functions For various measured values, you can define limit values that are monitored by the device. 9.22.1 Voltage monitoring In order to monitor the transformer's current output voltage, you can set 4 limit values: ▪ Undervoltage U<<: Lower limit 2 ▪... - Page 195 9 Visualization Settings Parameters Voltage ...ing << < > >> Home Mode Relative Absolute Absolute Absolute Absolute 60.1 V 80.0 V 110.9 V 120.0 V Relative 60.1 % 80.0 % 110.9 % 120.0 % Events Hysteresis 0.0 V 0.0 V 0.0 V 0.0 V Delay time 10.0 s 0.5 s 0.5 s 10.0 s Information Reaction Auto blockin...
-
Page 196: Current Monitoring
9 Visualization Delay time You can use this parameter to set the delay time in order to delay the issuing of the event message. Reaction You can use this parameter to set the behavior of the device if the measured value is higher than the upper limit (>... - Page 197 9 Visualization If the measured value is higher than the upper limit (> or >>) or lower than the lower limit (< or <<), the device transmits an event message. I>> I> I< I<< Figure 133: Example of current monitoring with the limit value I> being exceeded I>>...
- Page 198 9 Visualization Settings Parameters Current ...ing << < > >> Home Mode Absolute Absolute Absolute Absolute Absolute 0.0 A 0.0 A 7.7 A 10.0 A Relative 0.0 % 0.0 % 110.0 % 110.0 % Events Hysteresis 0.0 A 0.0 A 0.0 A 0.0 A Delay time 0.0 s 0.0 s 0.0 s 0.0 s Information Reaction Auto blockin...
-
Page 199: Power Monitoring
9 Visualization Delay time You can use this parameter to set the delay time in order to delay the issuing of the event message. Reaction You can use this parameter to set the behavior of the device if the measured value is higher than the upper limit (>... - Page 200 9 Visualization If the measured value is higher than the upper limit (> or >>) or lower than the lower limit (< or <<), the device issues an event message. Settings Parameter Power monitoring << < > >> Home S absolute 0 VA 0 VA 10 MVA...
-
Page 201: Power Flow Monitoring
9 Visualization Setting Behavior Auto blocking position- The automatic control does not perform a tap-change operation in the direction of a lower tap position (posi- tion-). You can continue to perform tap-change operations in manual mode. Auto blocking position+ The automatic control does not perform a tap-change operation in the direction of a higher tap position (posi- tion+). - Page 202 9 Visualization Settings Parameters Power fl...ing Name Value Home Reversal of power flow hysteresis 100 kW Reversal of power flow delay 5.0 s Behavior for reversal of power fl... Events Information Recorder CHANGE REBOOTadmin 31.01.2020 09:54 Settings Figure 136: Power flow monitoring 1. Go to Settings > Parameters > Grid > Power flow monitoring. 2.
-
Page 203: Tap Position Monitoring (Optional)
9 Visualization Setting Behavior Auto/manual blocking ▪ The Reversal of power flow event is issued. ▪ If Z compensation is activated, this function is deacti- vated. ▪ Automatic regulation is blocked. ▪ You cannot perform tap-change operations in manual mode. Target tap position ▪... -
Page 204: U Bandwidth Monitoring
9 Visualization 3. Set the desired parameter. 4. Press the Accept button to save the modified parameter. Delay time You can use this parameter to set the delay time in order to delay the issuing of the event message. Behavior limit value You can use this parameter to set the behavior of the device when the event message is issued. - Page 205 9 Visualization You can set the following parameters for each limit value: ▪ Hysteresis limit value: Specification as a percentage relative to the de- sired voltage value. ▪ Delay time limit value Behavior If the measured value is higher than the upper limit or lower than the lower limit, the device triggers the Upper bandwidth limit value / Lower bandwidth limit value message.
-
Page 206: Q Bandwidth Monitoring (Optional)
9 Visualization Function monitoring You can use this parameter to activate function monitoring. You can select the following options: Setting Behavior Function monitoring is deactivated. Only Auto Function monitoring is only active in AVR AUTO oper- ating mode. Auto and Manual Function monitoring is active in AVR AUTO and AVR MANUAL operating modes Table 71: Activate function monitoring... - Page 207 9 Visualization The following parameters are available for setting function monitoring: ▪ Function monitoring ▪ Hysteresis ▪ Delay time Settings Parameters U bandwidt...ing Name Value Home Function monitoring Auto and Manual Hysteresis 0.0 % Delay time 15 min Events Lower bandwidth hysteresis 0.1 % Lower bandwidth delay time 2 s...
-
Page 208: Phase Symmetry Monitoring
9 Visualization Delay time You can use this parameter to set the delay time in order to delay the issuing of the event message. 9.22.8 Phase symmetry monitoring If you are measuring the voltage and current with the 3-phase UI 3 measur- ing module, you can set the maximum permitted differences for voltage and phase angle between the 3 phases. -
Page 209: Temperature Monitoring
9 Visualization Behavior You can use this parameter to set the behavior of the device when the event message is issued. You can select the following options: Setting Behavior The limit value is not monitored. Auto blocking Automatic regulation is blocked. You can continue to perform tap-change operations in manual mode. -
Page 210: Monitoring The Gas Volume Of The Buchholz Relay (Oltc)
9 Visualization 9.22.10 Monitoring the gas volume of the Buchholz relay (OLTC) When you record the gas volume of the Buchholz relay of the on-load tap- changer, you can set 2 limit values for the gas volume. If the on-load tap- changer has multiple columns, you can set 2 limit values for each column. -
Page 211: Monitoring The Gas Volume Of The Buchholz Relay (Transformer)
9 Visualization 9.22.11 Monitoring the gas volume of the Buchholz relay (transformer) When you record the gas volume of the Buchholz relay of the transformer, you can set 2 limit values for the gas volume. If the measured gas volume is greater than the limit value >... -
Page 212: Monitoring The Oil Pressure (On-Load Tap-Changer)
9 Visualization 1. Go to Settings > Parameters > Active part > Pressure relief device. 2. Select the desired parameter. 3. Set the desired parameter. 4. Press the Accept button to save the modified parameter. 9.22.13 Monitoring the oil pressure (on-load tap-changer) When you record the oil pressure of the on-load tap-changer, you can use the pressure relief device (PRD) to set 2 limit values for the gas volume. -
Page 213: Target-Tap-Position Operation
9 Visualization 9.23 Target-tap-position operation When target-tap-position operation is activated, the device automatically switches to this target tap position. Settings Parameters Move to ...ion Name Value Home Target tap position Events Information Recorder CHANGE REBOOTadmin 03.02.2020 08:09 Settings Figure 146: Move to the defined target tap position 1. -
Page 214: Displaying Measured Value Recorder (Optional)
9 Visualization You can change the measured value display to the generator sign conven- tion by activating the Retrofit TAPCON® 2xx [►Section 9.21.3, Page 192] parameter. The following measured values are displayed: ▪ Voltage ▪ Current ▪ Power factor (cos ϕ) ▪... - Page 215 9 Visualization Signal Description S_m L2 Apparent power L2 (average value) S_m L3 Apparent power L3 (average value) Apparent power in total (average value) U_m Desired Desired voltage value (average value) Frequency (average value) φ_m U1/I1 Phase angle U1/I1 (average value) φ_m U2/I2 Phase angle U2/I2 (average value) φ_m U3/I3...
- Page 216 9 Visualization Signal Description P L2 Active power L2 P L3 Active power L2 Active power in total S L1 Apparent power L1 S L2 Apparent power L2 S L3 Apparent power L3 Apparent power in total Frequency φ U1/I1 Phase angle U1/I1 φ...
- Page 217 9 Visualization To display the measured value recorder, proceed as follows: 1. Go to Recorder. Figure 148: Recorder 2. Select the signals to be displayed in the list. 3. If necessary, set the desired axis for each signal. 4. Enter the start time and end time for the measured value display. 5.
-
Page 218: Setting The Measured Value Recorder
9 Visualization 7. Use the mouse to drag a selection window in order to zoom into the dia- gram. Select the button to reduce the diagram back to its original size. 8. Select the button to save the displayed measured values as a csv file. Trend curves If you call up the measured value recorder using a PC, you can display a trend curve instead of the measured values. - Page 219 9 Visualization Note that, for measured values via analog input signals (e.g. temperature), a maximum of 100,000 measured values with an average value interval of 3,600 s (= 1 h) will be saved. This is equivalent to a time period of approx. 11 years.
-
Page 220: Displaying Temperature Curve (Optional)
9 Visualization 9.24.4 Displaying temperature curve (optional) You can display the temporal progression of the temperatures measured over the last 10 days. Figure 152: Temperature curve ► Go to Information > Active part > Temperatures. Generic temperatures If you are using additional temperature sensors (generic temperature 1...8), you can display the temperature curve for these temperatures over the last 10 days. -
Page 221: Displaying Winding Temperatures (Optional)
9 Visualization 9.24.5 Displaying winding temperatures (optional) If you record the winding temperatures with a sensor, you can display the temporal progression of the measured winding temperatures over the last 10 days. To do so, proceed as follows: Figure 154: Winding temperature ►... -
Page 222: Displaying The Measured Values Of The Pressure Relief Device (Optional)
9 Visualization 9.24.7 Displaying the measured values of the pressure relief device (optional) You can display the temporal progression of the measured values of the pressure relief device (PRD) over the last 10 days. Figure 156: Measured value trend of the pressure relief device ►... -
Page 223: On-Load Tap-Changer Monitoring
9 Visualization 9.25 On-load tap-changer monitoring 9.25.1 Changing tap position designation (optional) This function allows you edit the designation of the tap position. The desig- nations are displayed on the main screen when each of the tap positions is active and are used for the control system. Settings Tap position table Raw value... -
Page 224: Displaying Tap-Change Operation Statistics (Optional)
9 Visualization You must enter the calculation factor for each tap position. If you enter the value 0 for a tap position, a calculation will not be performed for this tap posi- tion and the device will not display a value for the current on the low-voltage side. -
Page 225: Motor Current Index (Mci)
9 Visualization The top diagram shows how often the on-load tap-changer was switched into a particular tap position and how long it spent there. The bottom dia- gram shows the time spent in the tap positions over the last 10 days. Figure 160: Tap-change operation statistics ►... - Page 226 9 Visualization The motor runtime and therefore the Motor Current Index differ depending on the type of tap-change operation. The Motor Current Index will therefore be categorized in accordance with the following types of tap-change opera- tion to aid comparison: Tap-change operation type Description TSO/CSO...
- Page 227 9 Visualization 9.25.4.1 Setting MCI monitoring The device can monitor the Motor Current Index (MCI) and trigger an event message if the Motor Current Index is outside of the permissible range. If you would like to monitor the Motor Current Index, you must set the following parameters.
- Page 228 9 Visualization MCI values In the MCI values menu, you can display the Motor Current Index recorded values and the corresponding tap position of the last 3000 tap-change oper- ations. The following buttons are available for navigation within the diagram: ▪...
-
Page 229: Displaying Information About Contact Wear (Only Oiltap®)
9 Visualization MCI extreme values In the MCI extreme values menu, you can display the maximum and mini- mum values of the Motor Current Index and the corresponding dates. Figure 164: MCI extreme values 1. Go to Information > On-load tap-changer > MCI extreme values. 2. -
Page 230: Configuring Oltc Precheck
9 Visualization The device also shows the differences in contact wear for different contacts. Figure 165: Contact wear ► Go to Information > On-load tap-changer > Contact wear. 9.25.6 Configuring OLTC PreCheck The OLTC PreCheck function is used to prevent damage on the on-load tap- changer by on-load tap-changer operations under unauthorized operating conditions. -
Page 231: Information About The On-Load Tap-Changer
9 Visualization Settings Parameters OLTC PreCheck Name Value Home Activate OLTC precheck OLTC oil level >> 95 % OLTC oil level << 65 % Events OLTC oil temperature >> 110°C I>> relative/absolute Relative I>> [A] 1 kA I>> [%] 110 % Information I>>... -
Page 232: Transformer Monitoring (Optional)
Hot-spot measurement Hot-spot measurement requires that you connect [►Section 9.28, Page 246] a sensor for recording the winding temperature to the device via an MR sen- sor bus and link [►Section 9.29, Page 257] the transmitted data points to the function of the analog input (winding temperature 1...24). - Page 233 9 Visualization If you are to control a cooling system with the optional Frequency-based cooling system control [►Section 9.10.7, Page 125] function, you must set the calculation parameters for both the minimum fan speed and the maxi- mum fan speed. The device interpolates the values of the parameters be- tween the two operating points.
- Page 234 9 Visualization IEC: k21 You can use this parameter to set the thermal model constant k21 for calcu- lating the hot-spot temperature in accordance with IEC 60076-7. IEC: k22 You can use this parameter to set the thermal model constant k22 for calcu- lating the hot-spot temperature in accordance with IEC 60076-7.
-
Page 235: Hot-Spot Forecast (Optional)
9 Visualization Increase of the hot-spot temperature You can use this parameter to set the increase of the hot-spot temperature above ambient temperature in accordance with IEEE Std C57.91. The value to be set depends on the design of your transformer. Ratio of the evaluated power loss You can use this parameter to set the ratio of the power losses at rated cur- rent to the idling losses of the transformer. -
Page 236: Setting Calculation Of Transformer's Loss Of Life (Optional)
9 Visualization 3. Press the Start calculation button. ð The diagram appears. 4. Optional: Press to save the calculated values as a csv file. 5. If required, press Adjust values to make changes to the entered values. 9.26.3 Setting calculation of transformer's loss of life (optional) In order to calculate the transformer's loss-of-life, you need to set the follow- ing parameters. -
Page 237: Displaying Protective Device Status (Optional)
Depending on the device configuration, the device records the measured values from the sen- sors either as analog signals (4...20 mA) or MR sensor bus. For the configu- ration of the sensors, refer to sections "Configuring analog inputs and out- puts"... -
Page 238: Configuring Dga Monitoring
9 Visualization ▪ Additional, as an option: – Duval analysis – Rogers analysis – Dörnenburg analysis – IEC 60599 analysis 9.27.1 Configuring DGA monitoring For the DGA monitoring "DGA", you can set 3 limit values for the absolute values and for the rates of increase. Depending on the device configuration, you can monitor up to 11 DGA signals. - Page 239 9 Visualization Reset diagnostic errors This parameter can be used to reset the recorded diagnostic errors for all dissolved gas analyses. This can be useful after a transformer oil change, for example. Rates of increase evaluation interval You can use this parameter to set the interval for the rate of increase which is used as the basis for the limit value consideration.
- Page 240 9 Visualization Limit values for rates of increase Parameter Limit 1 Limit 2 Limit 3 H2O (%/d) H2O rate of in- H2O rate of in- H2O rate of in- crease> crease>> crease>>> H2 (ppm/d) H2 rate of increase> H2 rate of in- H2 rate of in- crease>>...
-
Page 241: Displaying Measured Values
9 Visualization 9.27.2 Displaying measured values The overview screen displays the current status of the dissolved gas analy- sis. Figure 173: Overview screen Depending on the analysis method, the following status values are dis- played: Value Description Gray Limit value not exceeded Yellow Yellow limit exceeded Red limit exceeded... - Page 242 9 Visualization For the Duval, Rogers, Dörnenburg and IEC 60599 analyses, the values measured by the sensor have to exceed the following detection limits. If the measured values are less than the detection limit, the device will use the de- tection limit value for the calculation. Detection limit 50 ppm 10 ppm...
- Page 243 9 Visualization 9.27.2.2 Rates of increase You can display the calculated rates of increase of the gases (ppm/d and ppm/y). The bar chart shows a graphical representation of the actual rate of increase (ppm/d) and the set limit values (yellow, red). The set evaluation in- terval is the decisive factor for the display of rates of increase.
- Page 244 9 Visualization 9.27.2.4 Duval analysis The display of the Duval analysis shows the following information: ▪ Duval triangle, with the allocation of the last 10 measured values in the ar- eas of the various error types. – Latest measured value: Darkest area with a display of the measure- ment error.
- Page 245 9 Visualization If you call up the visualization using a PC, the proportions of the gas concen- trations and the time of the measurement are displayed for each measured value via tooltip. Furthermore, you can rotate the diagram using the mouse. Figure 178: Display of the Rogers analysis ►...
-
Page 246: Mr Sensor Bus
9.28 MR sensor bus The optionally available MR sensor bus function lets you connect digital and analog sensors to the device over Modbus RTU. The MR sensor bus sup- ports the connection of up to 31 sensors (Modbus slaves). The ISM® device operates as the Modbus master. -
Page 247: Configuring Mr Sensor Bus
9 Visualization 9.28.1 Configuring MR sensor bus If you would like to use the MR sensor bus, you can configure the Modbus protocol with the following parameters. Note that the data transmission depends heavily on the number of sensors and data points as well as the query rate and send delay time parameters. -
Page 248: Managing Sensors
This parameter lets you set the period that the device is to wait between the response of one sensor and the query of another sensor. 9.28.2 Managing sensors This menu lets you manage sensors connected to the device over the MR sensor bus. The following information is displayed: ▪ Sensor name ▪... - Page 249 9 Visualization Figure 182: Managing sensors The operation described below is only possible if you access the visualiza- tion using a computer. You must also have a Parameterizer or Administrator user role. Adding a sensor If you would like to add a sensor, then you have to set the Modbus address, sensor name and version.
-
Page 250: Function Assignment
9 Visualization 5. Select the Version. 6. If necessary, enable the Assign functions option. 7. Press the Accept button. 8. After adding a sensor or several sensors, restart the device to apply the changes. Before restarting the device, you can add even more sensors or change ad- ditional settings such as the function assignment or configuration of analog or digital inputs. -
Page 251: Defining The Sensors
9.28.4 Defining the sensors This menu lets you define your own sensors, which you can connect to the device over the MR sensor bus. The defined sensors are then available in the sensor management function as a selection option. The sensor editor shows you an overview of the defined sensors: ▪... - Page 252 9 Visualization Adding a sensor definition You have to set the following values to add a sensor: Value Description Sensor name Entry field, max. 20 characters Sensor version Format: X.Y.Z (e.g. 1.5.2), used together with the sensor name to provide unique identification of the sensor in the sensor management menu.
- Page 253 9 Visualization – DISC: Discrete input (digital input) – HREG: Holding register – COIL: Digital input/output ▪ Register ▪ Description ▪ Byte order – Little-endian – Big-endian ▪ Data type ▪ Multiplier (only with IREG or HREG) ▪ Optional: Validation (only with IREG or HREG) –...
- Page 254 9 Visualization 2. Press the + new button to add a new data point or press the button to edit a data point. Figure 188: Adding a data point 3. Enter a description. 4. Select a data type and register. 5. Select the byte order of the sensor. 6.
-
Page 255: Displaying Information On The Connected Sensors
9 Visualization 2. Press the button. Figure 189: Editing a sensor definition 3. Enter the sensor name, sensor version and sensor manufacturer (op- tional). 4. Optional: Press the Edit button to go to the data point configuration. Any changes made are applied in this case. 5. - Page 256 9 Visualization Figure 190: Overview screen ► Go to Information > System > Sensor bus. Detailed information on the sensor You can display the current transmitted data point for each sensor on the overview screen. The following information is displayed: ▪ Register (Reg.) ▪...
-
Page 257: Configuring Analog Inputs And Outputs (Optional)
Analog signal Figure 192: Analog signal with linear characteristic curve, correction factor <1 and correction off- If you have connected sensors over the MR sensor bus, you must select the "Modbus" signal type for the desired functions. Observe the additional infor- mation provided in the MR sensor bus [►Section 9.28, Page 246] section. - Page 258 (x). The corrected function value (y) is: y = (m * x) + t Table 82: Configuration of the analog inputs and outputs Only available for GPAI. Not available with sensors connected over the MR sensor bus (Modbus). Only available for inputs. Figure 193: Configuring analog inputs/outputs You can only change the configuration of the analog inputs and outputs if you have a Parameter Configurator or Administrator role.
-
Page 259: Configuring Digital Inputs And Outputs
9 Visualization When in delivery status, you can log in as the administrator as follows: ▪ User name: admin ▪ Password: admin Creating a backup You need to create a backup to be able to reset the system in the event that any incorrect configuration settings are made. - Page 260 9 Visualization If you have connected sensors over the MR sensor bus, you must select the "Modbus" signal type for the desired functions. Observe the additional infor- mation provided in the MR sensor bus [►Section 9.28, Page 246] section. Ensure that the configuration of the digital inputs and outputs is suitable for the functions used.
-
Page 261: Maintenance (Optional)
MR standards. Oil sample An oil sample must be taken and analyzed; the limit values specified by MR for added insulating oil must be observed. Oil filter unit The oil filter of the oil filter unit must be replaced. -
Page 262: Setting Operator Interval For Oltc Maintenance
9 Visualization 9.31.1 Setting operator interval for OLTC maintenance You can define the maintenance interval of your choice for the on-load tap- changer. You can define the maintenance interval as dependent on time and/or number of tap-change operations. If the limit is reached (100%), the device triggers an event message (red). -
Page 263: Setting Operator Interval For Transformer Maintenance
9 Visualization 9.31.2 Setting operator interval for transformer maintenance You can define a maintenance interval of your choice for the transformer. The maintenance interval is dependent on time. If the limit is reached (100%), the device triggers an event message (red). Settings Parameters Mainten..tor... -
Page 264: Undertaking And Confirming Maintenance
9 Visualization 9.31.3 Undertaking and confirming maintenance Once you have undertaken maintenance, you can confirm this on the device and thereby reset the maintenance interval. The following maintenance pa- rameters can be entered based on the maintenance type: Value Description Date Date of maintenance. - Page 265 9 Visualization Determining the contact wear (only OILTAP®) The thickness of the wear to be entered is the sum of the wear of the mov- able and the fixed contact part. Figure 198: Determining contact wear 1 Fixed contact Thickness of the worn contact coating (fixed contact) 2 Movable contact Thickness of the contact coating...
- Page 266 9 Visualization Confirming maintenance To confirm maintenance, proceed as follows: 1. Go to Settings > Maintenance wizard. Figure 199: Maintenance wizard 2. Select the maintenance to be confirmed. 3. Press the Next button. 4. Enter the maintenance parameters. Figure 200: Undertaking and confirming maintenance 5.
-
Page 267: Displaying Maintenance Overview
9 Visualization 9.31.4 Displaying maintenance overview The maintenance overview displays the progress of the individual mainte- nance intervals. You can also see the limit values for the "yellow" and "red" event messages. For the maintenance intervals of the on-load tap-changer, the device uses the recorded operating data to predict the date for the next maintenance appointment. - Page 268 9 Visualization Figure 202: Maintenance logbook To call up the maintenance logbook, proceed as follows: ► Go to Settings > Maintenance logbook. Editing an entry in the maintenance logbook You can edit the entries in the maintenance logbook as needed. Figure 203: Editing an entry in the maintenance logbook Proceed as follows to edit an entry in the maintenance logbook: 1.
-
Page 269: Suppressing A Maintenance Event
9 Visualization 2. Press the New entry button. 3. Enter the maintenance data. 4. Press the Accept button to save the entry. Deleting an entry in the maintenance logbook You can delete the entries in the maintenance logbook as needed. To do so, proceed as follows: 1. -
Page 270: Dynamic Transformer Rating (Optional)
9 Visualization 9.32 Dynamic Transformer Rating (optional) NOTICE Damage to the transformer! An impermissibly strong or long overload can irreversibly damage the trans- former's insulation system. This can lead to increased gas formation and could cause the transformer to fail. Note that the permitted overload is cal- culated based on a thermal model in accordance with IEEE Std C57.91 or IEC 60076-7 and, as a result, deviations in the transformer's thermal model can occur. -
Page 271: Configuring The Dynamic Transformer Rating
9 Visualization If your transformer has been out of operation for a long time and in operation for less than 60 days, or if your transformer is subject to large load devia- tions, the device cannot calculate the permissible load precisely. 9.32.1 Configuring the Dynamic Transformer Rating To calculate the overload capability of the transformer, the following parame- ters must be set. -
Page 272: Displaying The Dynamic Transformer Rating
9 Visualization Emergency mode max. hot-spot temperature You can use this parameter to set the limit for the maximum hot-spot temper- ature of the transformer for emergency mode. IFM: max. hot-spot temperature You can use this parameter to set the limit for the maximum permissible hot- spot temperature of the transformer for insulation-friendly mode (IFM). - Page 273 9 Visualization DTR table The following values are displayed in this menu: ▪ Current load factor K [%] ▪ Remaining time [min], depending on the current load factor for emergency mode ▪ Remaining time [min], depending on the current load factor for insulation- friendly mode at >...
-
Page 274: Event Management
9 Visualization DTR diagram In this menu, you can display the calculated values graphically. For the se- lected overload period, the diagram shows the permissible load factor K and the forecast progression of the temperatures (hot-spot, top-oil) as well as the associated limit values. -
Page 275: Configuring Events
9 Visualization Events Event Time Home 17.03.2020 Limit value I>> 10:56:59/669 17.03.2020 Limit value S>> 10:56:59/669 Events 17.03.2020 Limit value P>> 10:56:59/669 17.03.2020 Limit value Q<< 10:56:59/669 Information 17.03.2020 1001 Ambient temperature invalid 10:56:59/669 17.03.2020 1002 Ambient temperature Recorder Confirm CHANGE REBOOTadmin 23.03.2020 08:08... - Page 276 9 Visualization Property Description Save If you activate this option, the event is stored in the event memory. Multi-set The event can be triggered several times without having been deactivated in the meantime. (not configurable) High active High active: The device generates a signal if the event is pending.
-
Page 277: Displaying Event Memory
9 Visualization 9.33.3 Displaying event memory Past events are stored in the event memory. The following information is dis- played: Column Description Consecutive number of events Event number for clear identification Event category: ▪ Error (red) ▪ Warning (yellow) ▪ Info (gray) Event Event text Time... -
Page 278: User Administration
9 Visualization 5. Press the Search button to display the desired events. Exporting events You can export the event memory entries currently displayed as a csv file. If you first create a filter, only the filtered entries are exported. To export the events, proceed as follows: ü... - Page 279 9 Visualization Role Description Operator User who can view data of relevance to operation and ac- knowledge events. The user can perform manual tap- change operations using the device's controls. ▪ Display all parameters ▪ Display and acknowledge all events Parameter configura- User who can view and modify data of relevance to opera- tion.
-
Page 280: Changing The Password
Operator Parameter Administrator configurator Enabling ECOTAP Modbus Adding sensors to the MR sensor bus Table 90: Access rights permanently linked to the roles 9.34.2 Changing the password All users can change their passwords provided that the user account is not set up as a group account. You can only change a group account's pass- word if you are logged in as the administrator. -
Page 281: Creating, Editing And Deleting Users
9 Visualization 9.34.3 Creating, editing and deleting users You can set the following options for all users: ▪ Username and password ▪ Role: You can assign a role to every user. The access rights to parame- ters and events are linked to the roles. ▪... -
Page 282: Setting Access Rights To Parameters And Events
9 Visualization 4. Select the role you want. 5. If necessary, activate the Group account, Active or Auto login options. 6. Press the Accept button to save the user. Editing users To edit an existing user, proceed as follows: 1. Go to Settings > Administration > User. 2. -
Page 283: User Authentication Via Radius (Optional)
VENDOR MR 34559 BEGIN-VENDOR MR # Attributes ATTRIBUTE MR-ISM-User-Group 1 integer # Predefined values for attribute 'MR-ISM-User-Group' VALUE MR-ISM-User-Group Administrator 1 VALUE MR-ISM-User-Group Parameter-configurator 2 VALUE MR-ISM-User-Group Operator 3 VALUE MR-ISM-User-Group Diagnostics 4 VALUE MR-ISM-User-Group Data-display 5 END-VENDOR MR ®... - Page 284 9 Visualization If your RADIUS server supports the importing of a dictionary, you can export the dictionary for ISM® devices from the device and import it onto your RA- DIUS server. For more information, refer to the information in the section ti- tled Exporting data [►Section 9.36.1, Page 287].
-
Page 285: Information About Device
9 Visualization RADIUS server port You can use this parameter to set the port of the RADIUS server. Authentication protocol You can use this parameter to set the authentication protocol through which the server and client communicate. You can select the following options: ▪... -
Page 286: Software
9 Visualization 9.35.2 Software Under Software, you can display the version status of the software compo- nents of the device. Figure 216: Information about the device's software ► Go to Information > System > Software. 9.35.3 Parallel operation In the parallel operation menu, you can display information about the de- vices that are connected by CAN bus. -
Page 287: Import/Export Manager
9 Visualization Figure 217: Parallel operation ► Go to Information > On-load tap-changer regulator > Parallel opera- tion. 9.36 Import/export manager The device is equipped with an import/export manager, which can be used to export and import various data. To transfer the data, the following options are available: Option Description Data transfer via USB port on rear of CPU I assembly. -
Page 288: Importing Data (Software Version 3.44 And Later)
Configuration of parameters and events. Data point con- Data point configuration of the control system. figuration Sensor bus de- Sensor description of the sensors for MR sensor bus that have vice descrip- been created with the sensor editor. tion Service data... -
Page 289: Configuring Media Converter With Managed Switch
9 Visualization Option Description Language Import of additional languages. You can install a maximum of 5 different languages on the device. If 5 languages are already installed, you will be asked to delete one during the import process. SSL certificate Import of an SSL certificate with associated key: ▪... -
Page 290: Commissioning
9 Visualization 9.37.1 Commissioning Before integrating the Ethernet switch into your network, you must review the most important settings and adjust them if necessary. During this process, follow the information outlined in this section for commissioning the Ethernet switch. The Ethernet switch is supplied with the following factory default settings: IP address 192.168.1.1;... -
Page 291: Configuration
9 Visualization 5. In the Basic settings > Network > Global menu, adjust the network set- tings and click on the Write button. Figure 219: Network settings 6. In the Basic settings > Load/Save menu, click on the Save button to per- manently store the settings. -
Page 292: Tapcon® Personal Logic Editor (Tple)
1. Go to Basic settings > Load/Save and click on the Reset to factory de- faults… button. 2. Reestablish the connection to the IP address of 192.168.1.1 if necessary. 3. Set the MR factory settings in accordance with the following table. Menu Parameter... - Page 293 9 Visualization 9.38.1.2 Variables The following types of variables for information processing are available for TPLE: ▪ Event inputs: You can use all the device's events as inputs for a function. ▪ Event outputs: 100 generic events are available as outputs for functions. ▪...
- Page 294 9 Visualization Outputs Output (BOOL) Parameter None Function If all configured inputs are TRUE, the output is FALSE, otherwise it is TRUE. Initial state All inputs and outputs are FALSE. Non-configured inputs are assumed to be TRUE so that they have no impact on the output. If no input is configured, the output therefore remains in the initial state of FALSE.
- Page 295 9 Visualization Parameter None Function If an odd number of inputs is TRUE, the output is TRUE, otherwise it is FALSE. Initial state All inputs and outputs are FALSE. Non-configured inputs are assumed to be FALSE so that they have no impact on the output. If no input is configured, the output therefore remains in the initial state of FALSE.
- Page 296 9 Visualization Figure 220: Example of RS 1 Trigger 2 Set 3 Reset 4 Output 9.38.1.3.8 Switch-on delay Description TON, switch-on delay Inputs Input (BOOL) Outputs Output (BOOL) Parameter Time ms (UINT32), 1...1,000,000, default = 1,000 Function If Input has a rising edge, the internal timer is set to zero and starts to run.
- Page 297 9 Visualization Function If Input becomes TRUE, Output also instantly becomes TRUE, this condition takes priority. If Input has a falling input, the internal timer is set to zero and starts to run. When the internal timer has reached or exceeded the parameter value, Output becomes FALSE and the counter stops running.
- Page 298 9 Visualization Function The internal timer runs for a long as Enable is TRUE. When the internal timer has reached or exceeded the configured time value, the status of the output changes and the timer is restarted. The configured time there- fore corresponds to half the period duration of the re- sulting signal.
- Page 299 9 Visualization Figure 221: Example of COUNT 1 Trigger 2 Direction 3 Reset 4 Lock 5 Output 9.38.1.3.13 Analog threshold value switch with hysteresis Designation THRES, threshold value switch with hysteresis Inputs Input (REAL32) Outputs Output (BOOL) Error (BOOL) Parameter On Limit (REAL32), -10,000,000… +10,000,000, de- fault = 10,000,000 Off Limit (REAL32), -10,000,000 …...
- Page 300 9 Visualization Input Output FALSE TRUE FALSE Figure 222: Analog threshold value switch with the On Limit > Off Limit setting Input Output TRUE FALSE TRUE FALSE TRUE FALSE Figure 223: Analog threshold value switch with the On Limit < Off Limit setting 9.38.1.3.14 Analog multiplication Description MUL, analog multiplication...
- Page 301 9 Visualization 9.38.1.3.15 Analog division Description DIV, analog division Inputs Divident (REAL32) Divisor (REAL32) Outputs Result (REAL32) DivByZero (BOOL) Overflow (BOOL) Parameter Constant divisor (REAL32), -1,000,000...+1,000,000; default = 1 Function Result = Dividend / Divisor / Constant Divisor If dividing by zero, the DivByZero output becomes TRUE and Result is set to zero.
- Page 302 9 Visualization Function Result = Input 1 - Input 2 – Offset If the REAL32 range of numbers is exceeded, the Overflow output becomes TRUE. Initial state All inputs and outputs are zero or FALSE. Table 112: Analog subtraction function module 9.38.1.3.18 Rising edge Description RTRG, rising edge trigger...
- Page 303 9 Visualization Parameter Time ms (UINT32): 1...2,000,000,000, default = 10,000 Sample time ms (UINT32): 1...10,000,000, default = 1,000 Function Averaging starts with a rising edge of Enable. This does not affect averaging which is already underway. Any output value remaining from earlier is retained. The Done output becomes FALSE, the Started output becomes TRUE.
- Page 304 9 Visualization Figure 224: AVRG 1 Input 2 Enable 3 Reset 4 AutoRepeat 5 Average 6 Done 7 Started 8 SampleCount 9.38.1.3.21 Scaling Description SCAL, scaling Inputs Input (REAL32) Outputs Output (REAL32) Error (BOOL) Parameter Min In (REAL32): -10,000,000...+10,000,000, default = -10,000,000 Max In (REAL32): -10,000,000...+10,000,000, default = +10,000,000...
- Page 305 9 Visualization Function Output is calculated using the following formula: Output = Min Out + (Max Out - Min Out) x (Input – Min In) / (Max In – Min In) Output is set to 0 and Error = TRUE when: ▪...
-
Page 306: Configuring Tple
9 Visualization Parameter Function The value of UINT32 is output converted to Output U, the value of SINT32 is output converted to Output S. Initial state All inputs and outputs are zero. Table 119: NAND function module 9.38.2 Configuring TPLE You can configure TPLE on a PC using the web-based visualization. Only a live view is available on the device's display. - Page 307 9 Visualization Figure 225: Editing variable To edit the variable, proceed as follows: 1. Go to Settings > TPLE > Variables. 2. Select the variable you want. 3. Enter the name and description. 4. Press the Accept button to save the modified variable. 9.38.2.2 Creating functions Within one function group, you can create up to 12 function modules to de- pict one function.
- Page 308 9 Visualization Creating function modules To create a function module, proceed as follows: ► Press the + button to create a new function module. Deleting function modules To delete a function module, proceed as follows: ► Drag the desired function module to the trash can using drag & drop. Sorting function modules To sort a function module, proceed as follows: ►...
- Page 309 9 Visualization 3. Select the text field with the name of the function group and enter the name you want. Figure 228: Renaming function group 4. Press [Enter] to accept the change. 9.38.2.4 Activating/deactivating function group You can fully activate or deactivate a function group. When you deactivate a function group, none of the function group's function modules are processed.
-
Page 310: Fault Elimination
10 Fault elimination 10 Fault elimination This chapter describes how to rectify simple operating faults. 10.1 Motor-drive unit Characteristics/details Cause Remedy No tap-change operation possi- Motor-drive unit not synchronized Synchronize motor-drive unit [►Section 9.19, Page 178]. ▪ Motor status "Error" No tap-change operation possi- Motor voltage outside the permissi- Check the voltage supply. -
Page 311: Human-Machine Interface
10 Fault elimination 10.2 Human-machine interface Characteristics/details Cause Remedy No display/screen is loaded Power supply interrupted. Check the voltage supply. Error when loading the current Press [F5] key to update the screen. screen in the browser. Fuse faulty. Contact Maschinenfabrik Reinhausen. Connection cannot be established Connection cable defective. -
Page 312: Inspection And Maintenance
11 Inspection and maintenance 11 Inspection and maintenance This chapter contains information about inspecting and maintaining the prod- uct. 11.1 Maintaining motor-drive unit Regular maintenance is not required. We do however recommend that you contact Maschinenfabrik's Technical Service team after 600,000 tap-change operations. -
Page 313: Event Messages
12 Event messages 12 Event messages Name Description Remedy 1 Limit value U< Value has fallen below the limit Check the current operating conditions of the value for undervoltage U<. transformer and the set U< parameters. 2 Limit value U<< Value has fallen below the limit Check the current operating conditions of the value for undervoltage U<<. - Page 314 12 Event messages Name Description Remedy 22 Limit value cos f << Value has fallen below the limit Check the current operating conditions of the value for power factor cos f<<. transformer and the set parameters cos f<<. 23 Limit value Pos< Value has reached or fallen below Check the current operating conditions of the the limit value for tap position...
- Page 315 12 Event messages Name Description Remedy 42 CAN bus address The CAN bus address is already Make sure that different CAN bus addresses are being used for another configured for each TAPCON®. Use a different TAPCON®. CAN bus address. 43 Invalid tap position: The tap position of a follower in Check the function and wiring of the follower's Follower...
- Page 316 12 Event messages Name Description Remedy 186 Tap position analog The value cannot be output via Check the parameter settings and the wiring of output the analog output. the analog output. 259 Phase sequence incor- Phase sequence incorrectly con- Check whether the motor is correctly connected rectly connected nected to the power supply (note rotary field!).
- Page 317 12 Event messages Name Description Remedy 295 Tap position display er- The module for the tap position Check the module for the tap position display. display is defective. 296 Communication with A connection with the module for Check the connection cable between the control tap position display er- the tap position display cannot be and module for the tap position display.
- Page 318 12 Event messages Name Description Remedy 1010 Generic temperature 1 The analog signal for recording Check the sensor, device wiring, and analog invalid the generic temperature 1 is in- signal configuration. valid. 1011 Generic temperature 2 The analog signal for recording Check the sensor, device wiring, and analog invalid the generic temperature 2 is in-...
- Page 319 12 Event messages Name Description Remedy 1026 Ambient temperature > Ambient temperature is greater Check the current operating conditions of the limit value than > limit value. transformer, temperature sensor, analog signal configuration, and the set limit value. 1027 Ambient temperature Ambient temperature is greater Check the current operating conditions of the >>...
- Page 320 12 Event messages Name Description Remedy 1060 Gen. temperature 3 > Generic temperature 3 is greater Check the current operating conditions of the limit value than > limit value. transformer, temperature sensor, analog signal configuration, and the set limit value. 1061 Gen.
- Page 321 12 Event messages Name Description Remedy 1076 Gen. temperature 7 > Generic temperature 7 is greater Check the current operating conditions of the limit value than > limit value. transformer, temperature sensor, analog signal configuration, and the set limit value. 1077 Gen.
- Page 322 12 Event messages Name Description Remedy 1101 Transformer oil level Oil level of transformer is less Check the transformer oil level and the device << limit value than << limit value. wiring. If using an analog sensor, check the sen- sor, analog signal configuration, and the set limit value.
- Page 323 12 Event messages Name Description Remedy 1151 Plan selector mainte- The selector maintenance is re- Undertake the selector maintenance soon. nance quired soon. 1152 Selector maintenance The selector maintenance is re- Undertake the selector maintenance. is required quired. 1153 Plan oil sample The oil sample is required soon.
-
Page 324: Disassembly
13 Disassembly 13 Disassembly The safe disassembly of the motor-drive unit is described below. WARNING Risk of severe injury or death! An energized transformer and energized on-load tap-changer and motor- drive unit components can cause death or serious injuries during disassem- bly! ►... - Page 325 13 Disassembly Disassembling gear motor To disassemble the gear motor, also observe the notes in the operating in- structions of the associated on-load tap-changer to reduce the oil level in the on-load tap-changer. Proceed as follows to disassemble the gear motor: 1.
-
Page 326: Disposal
14 Disposal 14 Disposal Observe the national requirements applicable in the country of use. ® ETOS 4453918/14 EN Maschinenfabrik Reinhausen GmbH 2020... -
Page 327: Technical Data
15 Technical data 15 Technical data 15.1 Gear motor Gear motor ETOS® TD Connection power 0.45…0.75 kW Voltage supply 3 AC/N 330...480 V Frequency 50 Hz or 60 Hz Running time of output shaft per tap-change opera- approx. 6.5 s tion Maximum number of operating positions Permitted ambient temperature during operation - 25...+ 55 °C Protection class (DIN EN 60529) -
Page 328: Connection Terminals
15 Technical data Control cabinet ETOS® TD S ETOS® TD L ETOS® TD XL Permitted ambient Standard: - 25...50°C temperature during HiTemp: -25...+55°C operation Storage temperature -25...+70°C Degree of protection IP 66 Potential corrosive- C4 high, C4 very high C4 high, C4 very ness category in ac- high, C5 high C5 high, C5 very high... -
Page 329: Drawings
15 Technical data 15.2.2 Drawings 15.2.2.1 ETOS® TD S ® Maschinenfabrik Reinhausen GmbH 2020 4453918/14 EN ETOS... - Page 331 15 Technical data 15.2.2.2 ETOS® TD L ® Maschinenfabrik Reinhausen GmbH 2020 4453918/14 EN ETOS...
- Page 333 15 Technical data 15.2.2.3 ETOS® TD XL ® Maschinenfabrik Reinhausen GmbH 2020 4453918/14 EN ETOS...
-
Page 335: Ism® Assemblies
15 Technical data 15.3 ISM® assemblies 15.3.1 Voltage measurement and current measurement UI 1 UI 3 Measurement 1-phase 3-phase Voltage measurement (RMS): 100 VAC Measuring range (RMS): 19.6...150 VAC Measuring accuracy (at U , -25...+70°C): <± 0.3% Intrinsic consumption: < 1 VA Measurement category III in accordance with IEC 61010-2-30 Current measurement : 0.2 / 1 / 5 A... -
Page 336: Ui 5-4 Voltage Measurement And Current Measurement
15 Technical data ca. 120 mm (4.72 in) 54 mm 55 mm (2.12 in) (2.17 in) UI 3 Figure 231: UI 1 und UI 3 dimensions 15.3.2 UI 5-4 voltage measurement and current measurement UI 5-4 Measurement 3-phase Voltage measurement (RMS): 230 VAC Measuring range (RMS): 10...300 VAC Measuring accuracy (at U , -25...+70°C): <± 0.2% Intrinsic consumption: < 1 VA... - Page 337 15 Technical data Interface Description Voltage input for phase L1 Not used Voltage input for phase L2 Not used Voltage input for phase L3 Voltage input for neutral conductor Table 130: Voltage measurement Interface Description Current input for phase L1 Current output for phase L1 Current input for phase L2 Current output for phase L2 Current input for phase L3...
-
Page 338: Digital Inputs And Outputs
15 Technical data 15.3.3 Digital inputs and outputs DIO 28-15 DIO 42-20 DIO 42-20 HL Inputs (plug-based Quantity electrical isolation) Logical 0 0...10 V AC (RMS) 0...40 V AC (RMS) 0 to 10 V DC 0 to 40 V DC Logical 1 18...260 V AC (RMS) 170...260 V AC (RMS) 18 to 260 V DC 170 to 260 V DC Input current... - Page 339 15 Technical data Interface Description Input Input Input Input Input Input Input Common Table 134: Digital inputs Interface Description Break contact Source contact Make contact Break contact Source contact Make contact Break contact Source contact Make contact Source contact Make contact Source contact Make contact Table 135: Digital outputs...
-
Page 340: Analog Inputs And Outputs
15 Technical data ca. 150 mm (5.9 in) 219 mm 93 mm (8,62 in) (3.66 in) DIO 42-20 INIT Figure 235: DIO 42-20 dimensions 15.3.4 Analog inputs and outputs AIO 2 AIO 4 Channels (input or output) Inputs Measuring range 0...10 V 0...20 mA 4...20 mA Load resistance Max. -
Page 341: Cpu (Central Processing Unit) I
15 Technical data ca. 120 mm (4.72 in) 54 mm 55 mm (2.12 in) (2.17 in) Figure 236: AIO 2 and AIO 4 dimensions 15.3.5 CPU (central processing unit) I CPU I Processor 266 MHz 256 MB Interfaces 1x serial RS232/485 (electrically isolated) 3x Ethernet 10/100 Mbps 1x USB 2.0 1x CAN (electrically isolated) 1x CAN... - Page 342 15 Technical data Interface Description Table 140: USB 2.0 Interface Description TxD+ TxD- RxD+ RxD- Table 141: ETH1, ETH 2.1, ETH 2.2 (RJ45) Interface Description CAN-L CAN-GND CAN-H Table 142: CAN1, CAN2 ca. 120 mm (4.72 in) 109 mm 55 mm (4.29 in) (2.17 in) INIT TEST...
-
Page 343: Cpu (Central Processing Unit) Ii
15 Technical data Optional accessories CAN bus Terminating resistor ▪ D-SUB plug connector (9-pole) ▪ R = 120 Ω Connector with terminal strip for directly connecting CAN lines Media converter for Adapter from D-SUB (9-pole) to fiber-optic cable: COM2 interface (only ▪... - Page 344 15 Technical data Interface Description Table 146: USB 2.0 Interface Description TxD+ TxD- RxD+ RxD- Table 147: ETH1, ETH 2.1, ETH 2.2 (RJ45) Interface Description CAN-L CAN-GND CAN-H Table 148: CAN1, CAN2 ca. 120 mm (4.72 in) 109 mm 55 mm (4.29 in) (2.17 in) INIT TEST...
-
Page 345: System Networking
15 Technical data Optional accessories CAN bus Terminating resistor ▪ D-SUB plug connector (9-pole) ▪ R = 120 Ω Connector with terminal strip for directly connecting CAN lines Media converter for Adapter from D-SUB (9-pole) to fiber-optic cable: COM2 interface (only ▪... - Page 346 15 Technical data SW 3-3 Time synchronization PTPv2 (IEEE 1588-2008) RJ45 Max. 100 m (per section) 10/100 Mbps Cable impedance 100 Ω Fiber-optic cable Max. 2,000 m 100 Mbps Light-emitting diode: class 1 Wavelength: 1,310 nm Max. optical output power: <1 mW (in accordance with IEC 60825-1:2014) Table 151: Technical data for the SW 3-3 assembly Factory setting Interface Description...
-
Page 347: Tests
15 Technical data ca. 150 mm (5.9 in) 54 mm 93 mm (2.12 in) (3.66 in) MC 2-2 Figure 239: MC2-2 and SW3-3 dimensions 15.4 Tests Electrical safety IEC 61010-1 Safety requirements for electrical measurement and con- trol and regulation equipment and laboratory instruments ▪... -
Page 348: Glossary
Glossary Glossary Load sign convention Change-over selector operation Definition for describing electrical circuits. The ar- rows for current rating and voltage on a "con- sumer" absorbing electrical power (e.g. a resis- tor) face the same direction. U*I is the power ab- Analysis of the gases dissolved in the oil (Dis- sorbed by the component. - Page 349 Glossary RSTP TDSC Redundancy protocol in accordance with IEEE TAPCON® Dynamic Set Point Control 802.1D-2004 (Rapid Spanning Tree Protocol) TPLE SCADA TAPCON® Personal Logic Editor Technical processes are monitored and con- trolled using a computer system (Supervisory Control and Data Acquisition) Tap selector operation SNTP NTP (Network Time Protocol) is a standard for...
-
Page 350: List Of Key Words
List of key words List of key words Absolute 195, 198, 200 Bandwidth 153, 157 Cable recommendation 55 Access point 88 Bandwidth monitoring 204, 206 Calculation method 233, 271 Access rights 282 Baud rate 89, 93, 97, 99, 247 Calibration run 178 Activate 119... - Page 351 List of key words Data Edition 88 ICD file 88 Import/export 287 Emergency mode IEC 60870-5-101 89 Databits 90, 93, 97, 248 Max. hot-spot temp. 272 IEC 60870-5-103 92 Date 83 Max. top-oil temp. 272 IEC 60870-5-104 94 Deactivate parallel operation 116 Emergency mode max.
- Page 352 83 Select 72 Broker address 82 Status 135 Client user name 82 Operations counter 135, 204 Port 82 Outputs MR sensor bus 57, 246 Analog 257 Configuring 247 Digital 259 Overvoltage 194 ® ETOS 4453918/14 EN Maschinenfabrik Reinhausen GmbH 2020...
- Page 353 List of key words Parallel operation 183, 188 R&X compensation 180 SCADA 87 CAN bus 189 RADIUS 283 SCADA disconnection delay time Circulating reactive current 185 RADIUS server 284 138 Information 286 RADIUS server port 285 Secondary transformer voltage Parallel operation error mes- Rated power of the transformer 161 sage...
- Page 354 List of key words TLS version 81 TPLE 292 Tap difference Visualization 73 Transformer Follower 191 Operating concept 42 Overview 38 Tap position Visualization release 80 Transformer age 236 Change designation 223 Voltage increase 183 Transformer data 160 Display 135 Voltage limit value 183 Secondary current...
- Page 356 Maschinenfabrik Reinhausen GmbH Falkensteinstrasse 8 93059 Regensburg +49 (0)941 4090-0 sales@reinhausen.com www.reinhausen.com ® 4453918/14 EN - ETOS TD - - 10/20 - Maschinenfabrik Reinhausen GmbH 2020 THE POWER BEHIND POWER.
Need help?
Do you have a question about the ETOS TD and is the answer not in the manual?
Questions and answers